













-
Water scarcity, due to declines in freshwater reserves and reduced regional precipitation as a consequence of global climate change poses a major challenge for turfgrass irrigation, especially for drought-sensitive turfgrass species such as creeping bentgrass (Agrostis stolonifera). The use of remote sensing techniques, specifically through unmanned aerial vehicles (UAVs) equipped with spectral sensors like multispectral cameras, offers a powerful high-throughput phenotyping method for evaluating plant growth and physiological status, as well as responses to abiotic and biotic stresses[1−3]. The spectral sensors can capture reflectance data from the plant canopy across a wide range of the light spectrum, which is then utilized to calculate various vegetation indices (VIs). The VIs serve as quantitative indicators of important phenotypic and physiological traits of plants. Turfgrass performance is usually evaluated through visual ratings of turf quality (TQ), which are assigned on a scale from 1 to 9 based on factors including color, density, and uniformity. While TQ is a common method, it is inherently subjective, leading to variability between observers. This variability can compromise the accuracy of experiments and impact management decisions[4,5]. Although there are more objective physiological measurements available, such as assessing leaf chlorophyll content or relative water content, these methods are often destructive, labor-intensive, and impractical for the high spatial and temporal resolution needed in large-scale field management[6]. Additionally, visual assessments and most physiological parameters typically identify abiotic stresses, such as drought stress, only after irreversible damage has occurred. Therefore, remote sensing VIs evaluating turf performance and stress responses is crucial for enhancing turfgrass stress tolerance through timely cultural practices or breeding improvement.
Remote sensing VIs have primarily been used in phenotypic screening for superior turf quality[3,7]. For instance, the normalized difference vegetation index (NDVI) is a robust indicator of canopy density and photosynthetic capacity[8]. Normalized difference red edge index (NDRE), which utilizes the red-edge portion of the spectrum, provides an estimate of chlorophyll content[9]. Other indices can detect more specific stress responses; for example, the plant senescence reflectance index (PSRI) is sensitive to changes in the carotenoid-to-chlorophyll ratio, making it an effective early indicator of stress-induced senescence[10]. Some VIs related to drought responses have been investigated, and the sensitivity of different VIs to drought stress for the detection of stress levels in turfgrass plants varied, as mostly found in controlled environment studies[11−13]. For example, from a growth-chamber study with Kentucky bluegrass, structure insensitive pigment index (SIPI) and the simple ratio index (SRI) were among the most responsive to drought stress; in contrast, NDVI and NDRE have been found to be less sensitive in detecting drought stress[13]. To develop remote sensing-guided precision irrigation programs, it is essential to identify reliable remote sensing VI thresholds for detecting drought stress levels and develop robust predictive models for turfgrass exposed to variable levels of deficit irrigation in natural field environments.
The objectives of this study were to: (1) determine the correlation between remote-sensing VIs and ground measurements for creeping bentgrass subjected to drought stress induced by deficit irrigation; (2) assess the sensitivity of remote-sensing VIs in detecting declining soil water content; and (3) establish threshold ranges for each VI associated with an acceptable level of visual turf quality in creeping bentgrass during drought stress. The overarching objective was to identify reliable VIs that can serve as actionable indicators for early drought stress detection and facilitate high-throughput phenotyping to enhance selection efficiency in breeding for improved drought tolerance in creeping bentgrass.
-
The study was conducted at the turfgrass research farm in North Brunswick, New Jersey. Field plots were established with '007' creeping bentgrass, which was seeded at a rate of 4.882 g m−2. Throughout the experiment, the trial was managed under typical fairway conditions, including a mowing height of 0.635 cm and routine applications of fertilizers and fungicides (Supplementary Table S1).
Linear gradient irrigation to induce different levels of drought stress
-
To create varying levels of water deficit in the soil or drought stress, a linear gradient irrigation system (LGIS)[14], which creates a gradient of water deficit across the experimental area by differentially irrigating the field based on the distance from irrigation baseline, was utilized over a 30.48 m by 18.28 m field plot including 200 1.52 m × 1.52 m subplots (10 × 20); that is, 10 replications of sampling units on each of the 20 irrigation levels. LGIS was turned on to irrigate the entire plot every 2 d during the month of August in 2023 and June in 2024. The irrigation output was calibrated using catch cans placed in five blocks, each spanning a 6-m section along the irrigation baseline at the northern end of the experimental field (0−6, 6−12, 12−18, 18−24, and 24−30 m). Water application rates were then expressed as a percentage of the daily evapotranspiration (ET) recorded by a local weather station.
Data collection
-
Data was collected during August 2023, and from June 11 to June 28, 2024. The data on August 14, 2023, and June 14, 17, and 25, 2024, when the soil moisture content exhibited a linear gradient in the field plot irrigated with LGIS, were analyzed and presented in this paper. A standardized workflow was employed for all data collection, which occurred once per week, weather permitting. All ground and remote data collection was specific to each 1 of the 200 experimental plots, which were fixed and geo-labelled. Ground-based measurements included visual assessments of turf quality (TQ) and digital imaging using an RGB camera installed inside a custom-made lightbox, which created a stable light environment for consistent light for RGB imaging. TQ was rated on a scale of 1 (completely dead) to 9 (perfectly healthy and uniform) based on turf color, density, and uniformity, with 6 as the minimum acceptable level[4]. Dark Green Color Index (DGCI) data were acquired from RGB imaging analysis using Turfanalyzer (Green Research Services, LLC, Fayetteville, AR, USA). Soil water content was collected using FieldScout 300, with a 12.7-cm probe (FieldScout, Portland, OR, USA) on each experimental subplot. The device was calibrated in deionized water prior to the data collection procedure.
Remote sensing data was captured using a drone platform by DJI Inspire 2 (DJI, Shenzhen, Guangdong, China) equipped with a dual multispectral camera system capable of imaging 10 spectral bands (Micasense Rededge-MX dual, AgEagle, Wichita, Kansas, USA). To correct variations in ambient light, a Micasense reflectance calibration panel was photographed before each flight for post-processing calibration. Aerial surveys were planned and executed with the Measure GroundControl iOS app (AgEagle, Wichita, Kansas, USA). Flights were conducted around solar noon at an altitude of 25 m above ground and a speed of 4 m/s, ensuring 75% frontal and side overlap to generate detailed orthomosaic maps.
Image processing and data analysis
-
The raw aerial multispectral images were processed in Pix4DMapper (v4.6.4, Pix4D, Prilly, Switzerland) to create orthomosaic reflectance maps for each spectral band. These composite maps were then analyzed using ArcGIS Pro (v3.4, ESRI, Redlands, California, USA), where experimental plot boundaries were defined and used to extract data. From the reflectance maps, VIs reflectance maps were calculated and generated. The indices analyzed in this study include SIPI, PSRI, NDVI, and NDRE. These specific indices were selected based on their established correlation with drought stress responses in other cool-season turfgrass species[13]. Nonlinear regression analysis (a second-order polynomial model) between all parameters was conducted using Python (v.3.13, Python Software Foundation, OR, USA) featuring the NumPy library. The goodness-of-fit was assessed using the coefficient of determination (R2), and statistical significance was determined by the p-value (p < 0.05). Variance Inflation Factor (VIF) was also calculated in the script for each correlation, based on the coefficient of correlation among the parameters. Model diagnostics, including 95% Confidence Interval (CI), define the precision of the mean, while the 95% Prediction Interval (PI) and Observed Range were used to evaluate the volatility of individual data points. Threshold ranges were determined with regression-based estimation for each VI data point at TQ = 6, which is the minimal acceptable level.
-
Data from 2023 (August 14, 2023) and 2024 (June 14, 17, and 25, 2024), when soil water content (SWC) exhibited variations in field plots along the LGIS, were analyzed, and the results are presented below:
Significant correlations among remote-sensing VIs were observed (Table 1). The NDVI exhibited a strong relationship with the SIPI (R2 = 0.996). Both NDVI (R2 = 0.989) and SIPI (R2 = 0.975) were also strongly correlated with PSRI. NDRE showed moderate correlations with NDVI (R2 = 0.655) and SIPI (R2 = 0.841), but it was not correlated to PSRI (R2 = 0.034). NDVI and SIPI also demonstrated strong correlations with ground measurements, DGCI (NDVI R2 = 0.812, SIPI R2 = 0.733) and TQ (NDVI R2 = 0.826, SIPI R2 = 0.834).
Table 1. R2 of measured parameters for selected dates of experimental period.
NDRE 0.655 1 SIPI 0.996 0.841 1 PSRI 0.989 0.034 0.975 1 DGCI 0.812 0.671 0.733 0.785 1 TQ 0.826 0.659 0.834 0.628 0.698 1 SWC 0.694 0.087 0.677 0.793 0.454 0.335 1 NDVI: normalized differential vegetation index; NDRE: normalized difference red edge; SIPI: structure independent pigment index; PSRI: plant senescence reflectance index; TQ: turf quality; SWC: soil water content. NDVI, NDRE, SIPI, PSRI were calculated from remote sensing data, DGCI was calculated based on ground RGB camera data, and TQ was determined by the researcher's visual evaluation of the experimental plots. SWC was collected from a TDR soil moisture sensor. The VIF analysis (Supplementary Table S2) identified significant multicollinearity among several of the spectral indices. High redundancy was found between NDVI and SIPI (VIF = 250.00), as well as between NDVI and PSRI (VIF = 90.91). The relationship between SIPI and PSRI also showed a high VIF of 40.00. Conversely, NDRE showed much lower collinearity when compared to PSRI (VIF = 1.04) and NDVI (VIF = 2.90).
Statistics and distribution intervals for VIs (Supplementary Table S3) indicated the varying stability across the assessed indices (n = 1,200). SIPI and NDVI demonstrated the highest relative stability with coefficients of variation (CV) of 4.13% and 6.64%, respectively. In contrast, NDRE exhibited greater proportional volatility (CV = 8.96%), likely contributing to its lower predictive performance.
Sensitivity of remote-sensing indices (VIs) to detect declining soil water content
-
To determine the sensitivity of TQ and different remote-sensing VIs to water deficit, regression analysis was performed for each parameter against changing SWC along the LGIS system during the 2023 and 2024 experimental periods.
SIPI decreased with declining SWC (Figs. 1a, 2a, 3a, 4a). It was significantly correlated with SWC, with R2 of 0.69 in the dry-down period in 2023, and R2 of 0.71, 0.76, and 0.69 during the three dry-down periods in 2024.
PSRI increased with a declining SWC (Figs. 1b, 2b, 3b, 4b). The negative correlation between PSRI and SWC was significant during the dry-down periods in 2023 (R2 = 0.67). In 2024, it was particularly sensitive during the early stages of dry-down periods with R2 of 0.80 on June 14, 2024, R2 of 0.82 on June 17, 2024, and an R2 of 0.77 on June 25, 2024.
NDVI exhibited a positive non-linear relationship with SWC throughout the 2023 and 2024 dry-down cycles (Figs. 1d, 2d, 3d, 4d). The R2 was 0.62, 0.75, 0.79, and 0.68 in 2023 and June 14, 17, and 25, 2024, respectively.
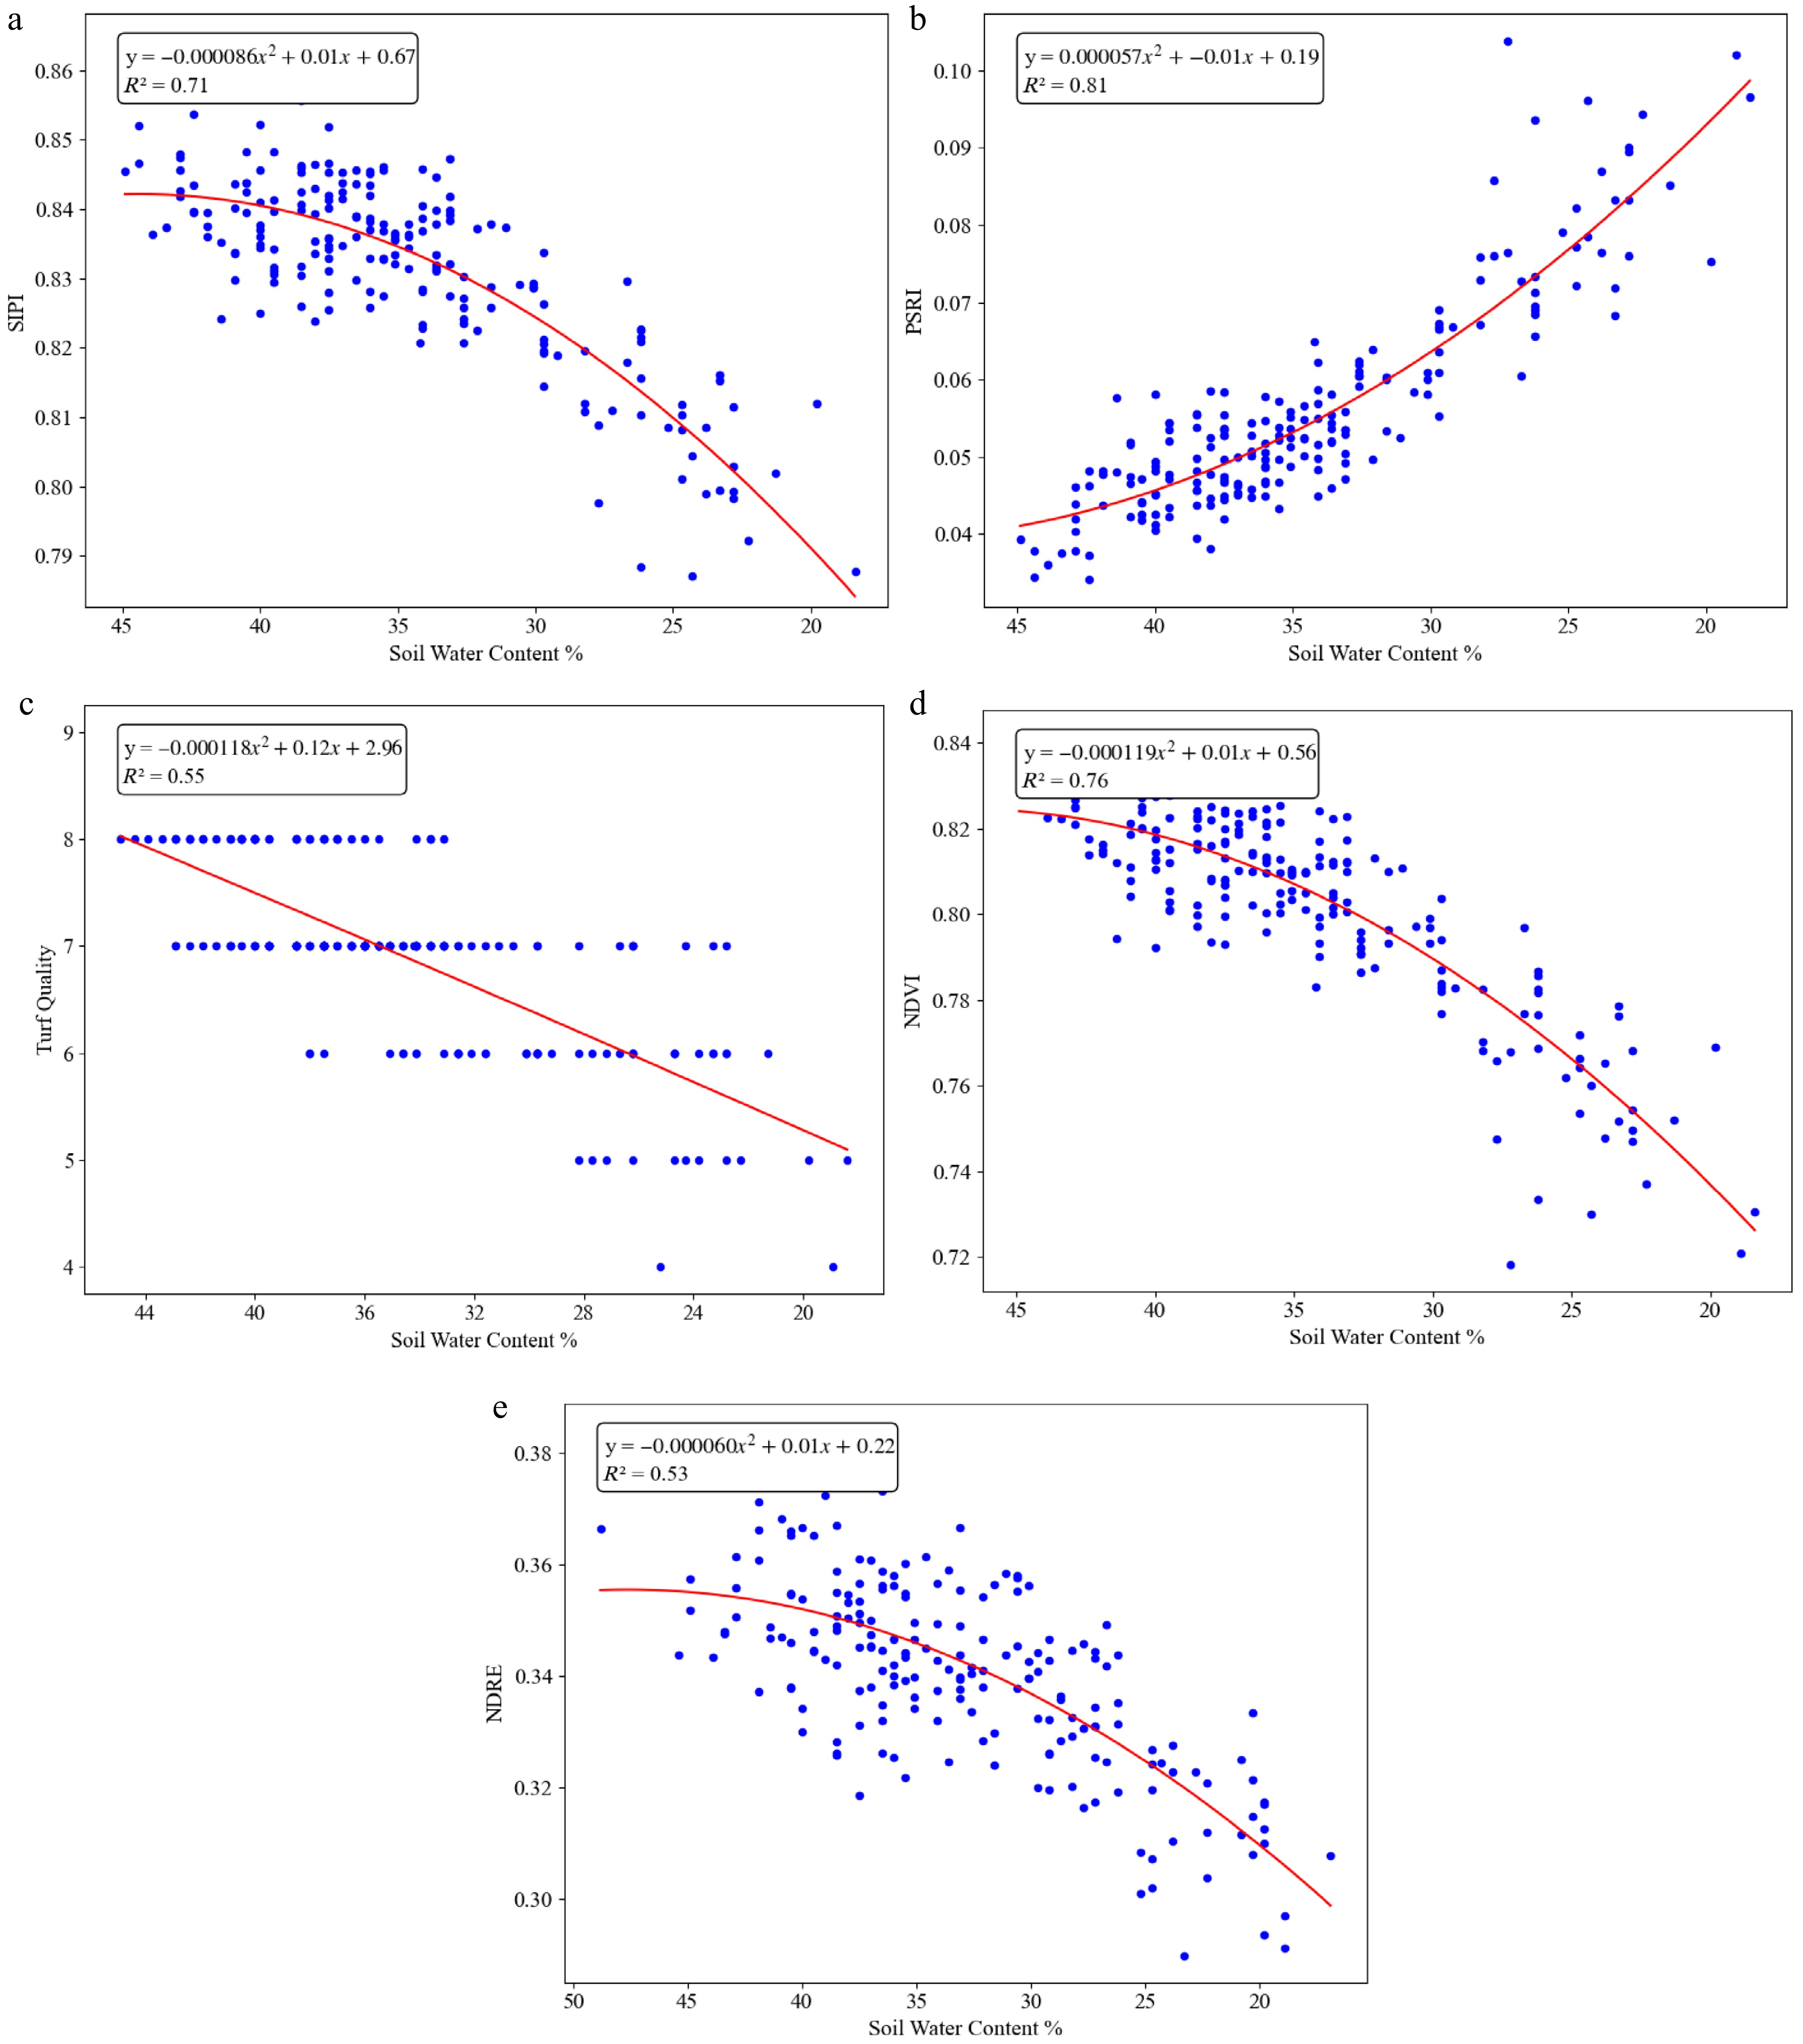
Figure 1.
Non-linear correlation regression graphs of various vegetation indices or turf quality vs. soil water content on 6/14/2024. (a) SIPI vs. SWC, (b) PSRI vs. SWC, (c) TQ vs. SWC, (d) NDVI vs. SWC, and (e) NDRE vs. SWC.
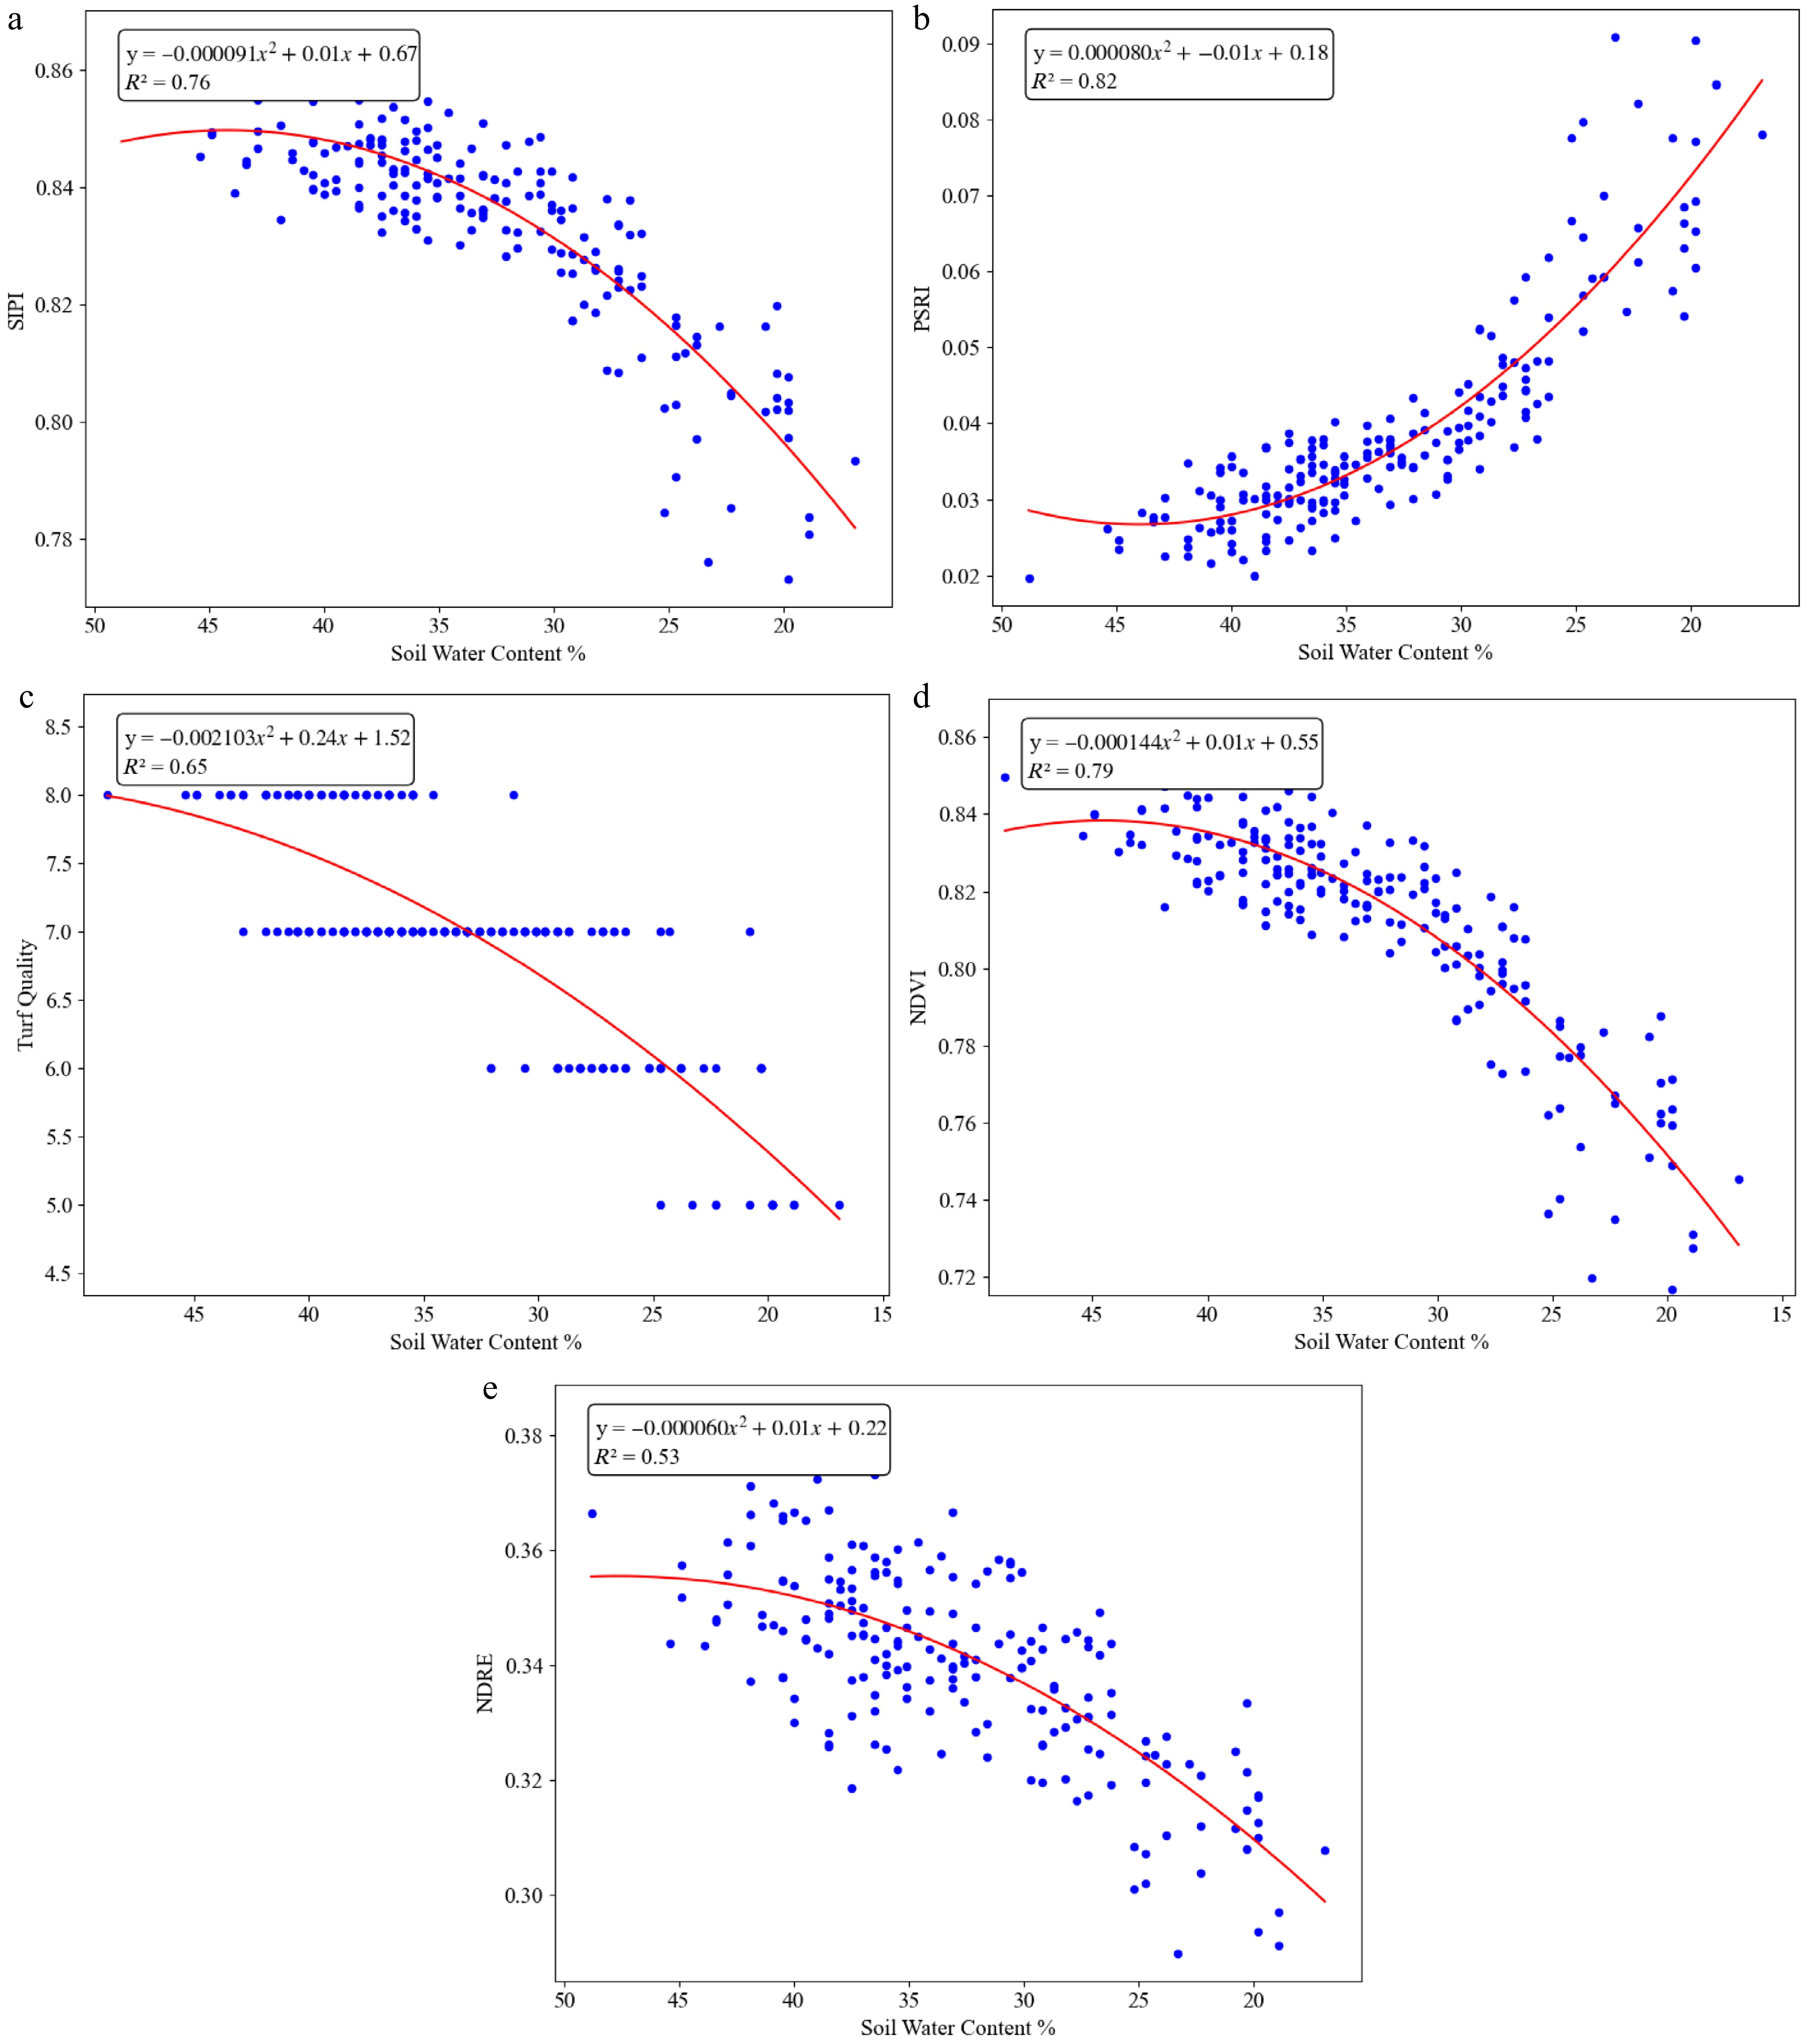
Figure 2.
Changes in vegetation indices and turf quality with soil water content during early phase of deficit irrigation (data collected on 6/17/2024). (a) SIPI vs. SWC, (b) PSRI vs. SWC, (c) TQ vs. SWC, (d) NDVI vs. SWC, and (e) NDRE vs. SWC.
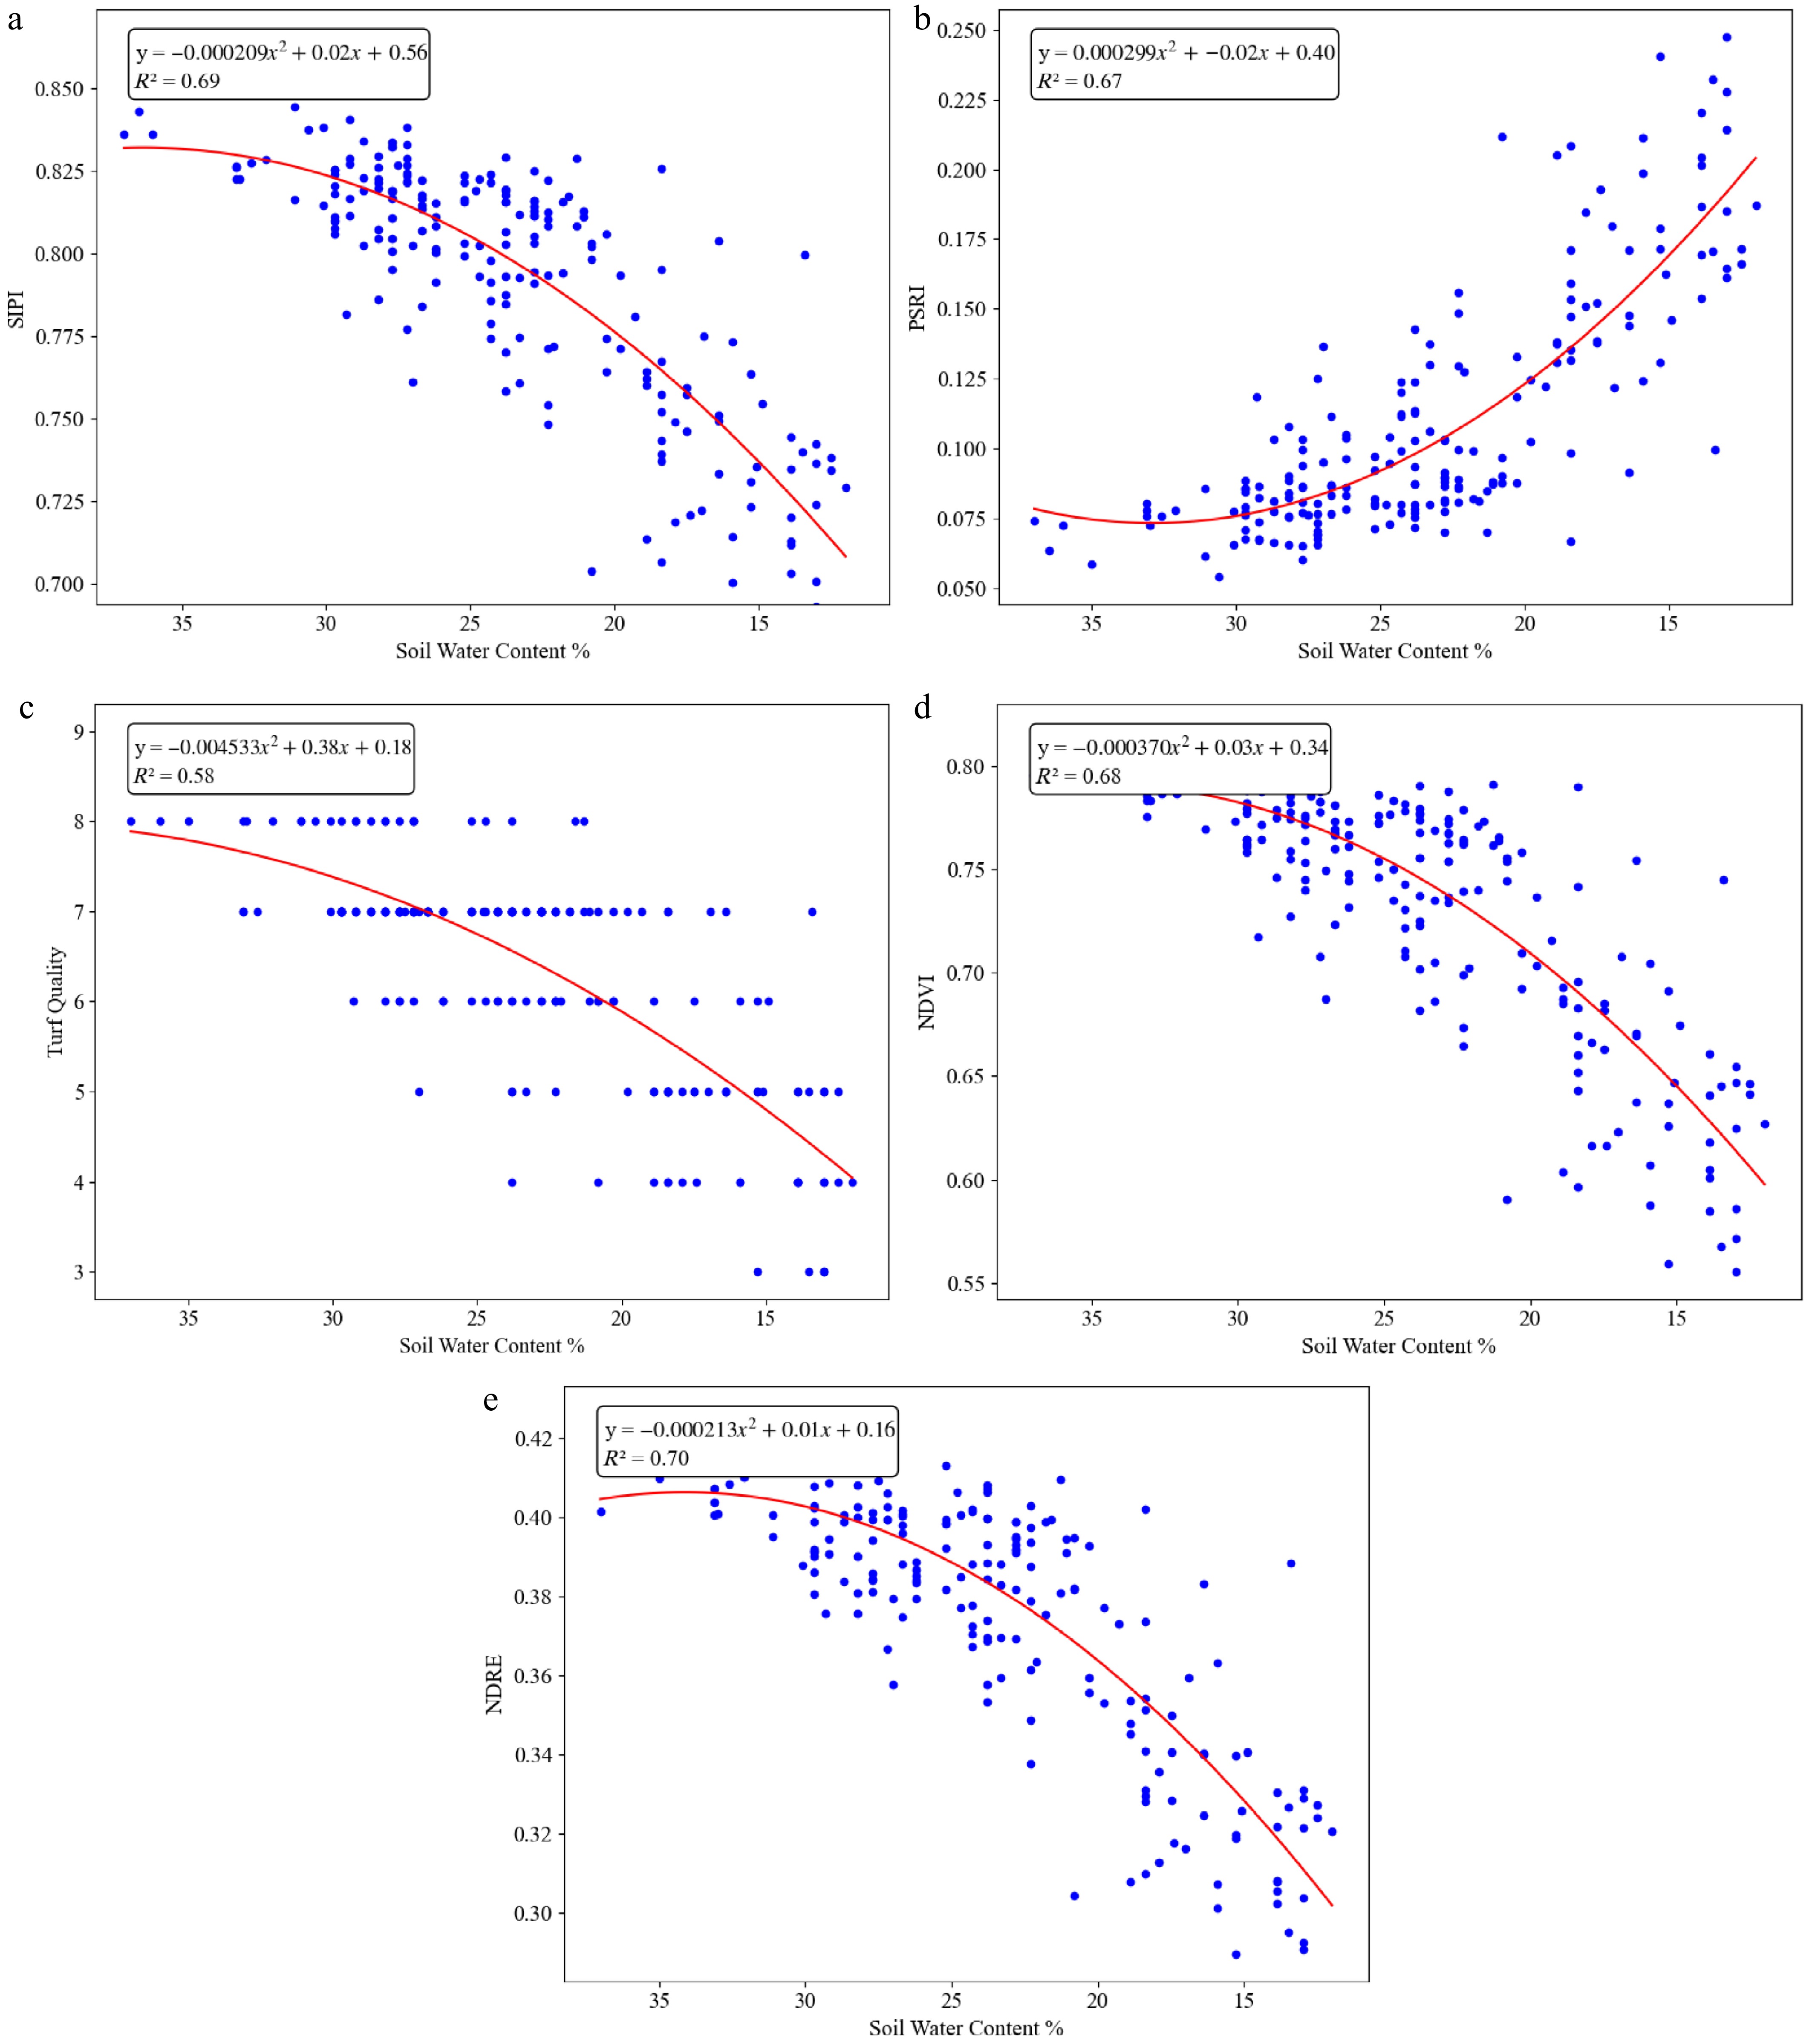
Figure 3.
Changes in vegetation indices and turf quality with soil water content during late phase of deficit irrigation (data collected on 6/25/2024). (a) SIPI vs. SWC, (b) PSRI vs. SWC, (c) TQ vs. SWC, (d) NDVI vs. SWC, and (e) NDRE vs. SWC.
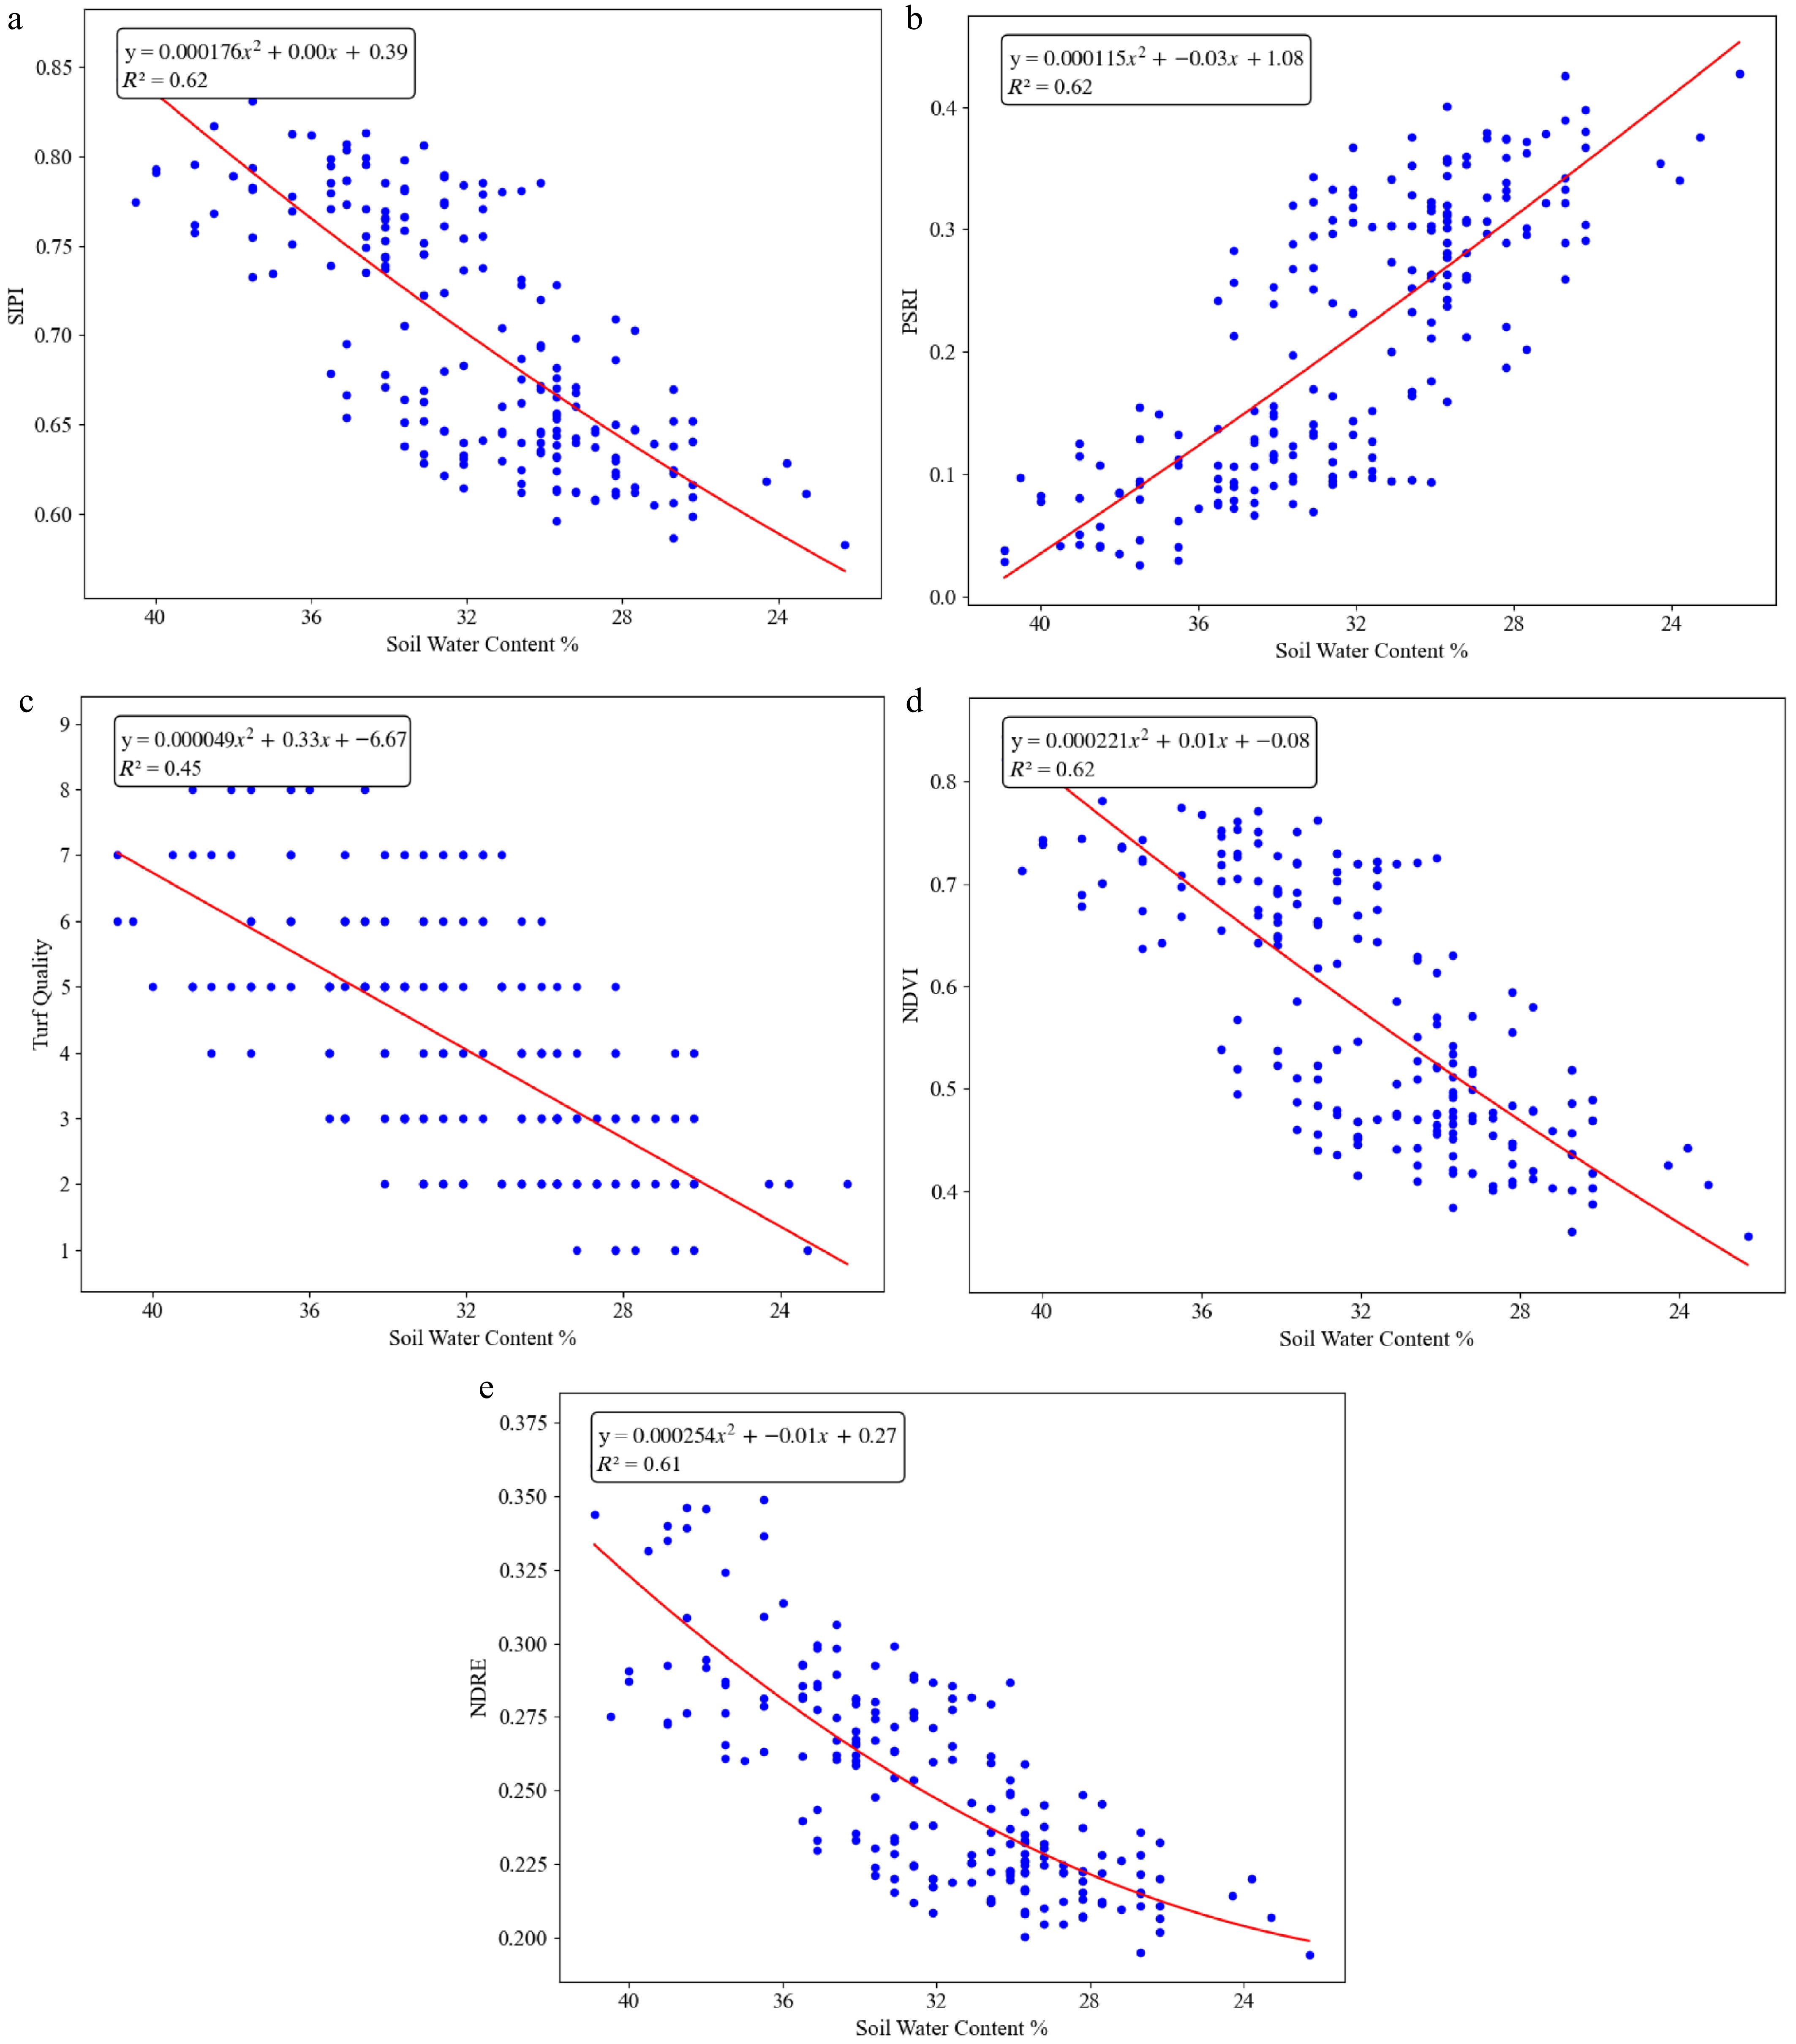
Figure 4.
Changes in vegetation indices and turf quality with soil water content during late phase of deficit irrigation on 8/13/2023. (a) SIPI vs. SWC, (b) PSRI vs. SWC,(c) TQ vs. SWC, (d) NDVI vs. SWC, and (e) NDRE vs. SWC.
NDRE showed the weakest overall correlation with SWC among all remote-sensing VIs. The R2 was 0.61 in 2023 and 0.35, 0.53, and 0.70 on June 14, 17, and 25, 2024, respectively (Figs. 1e–4e). The R2 increased over time during the later stages of dry-down cycles in 2024.
TQ decreased with a declining SWC in a linear pattern (Fig. 5c). The R2 was 0.55 during the dry-down period in 2023 (Fig. 5a) and ranged from 0.55 to 0.65 during three dry-down periods in 2024 (Fig. 5b–d).
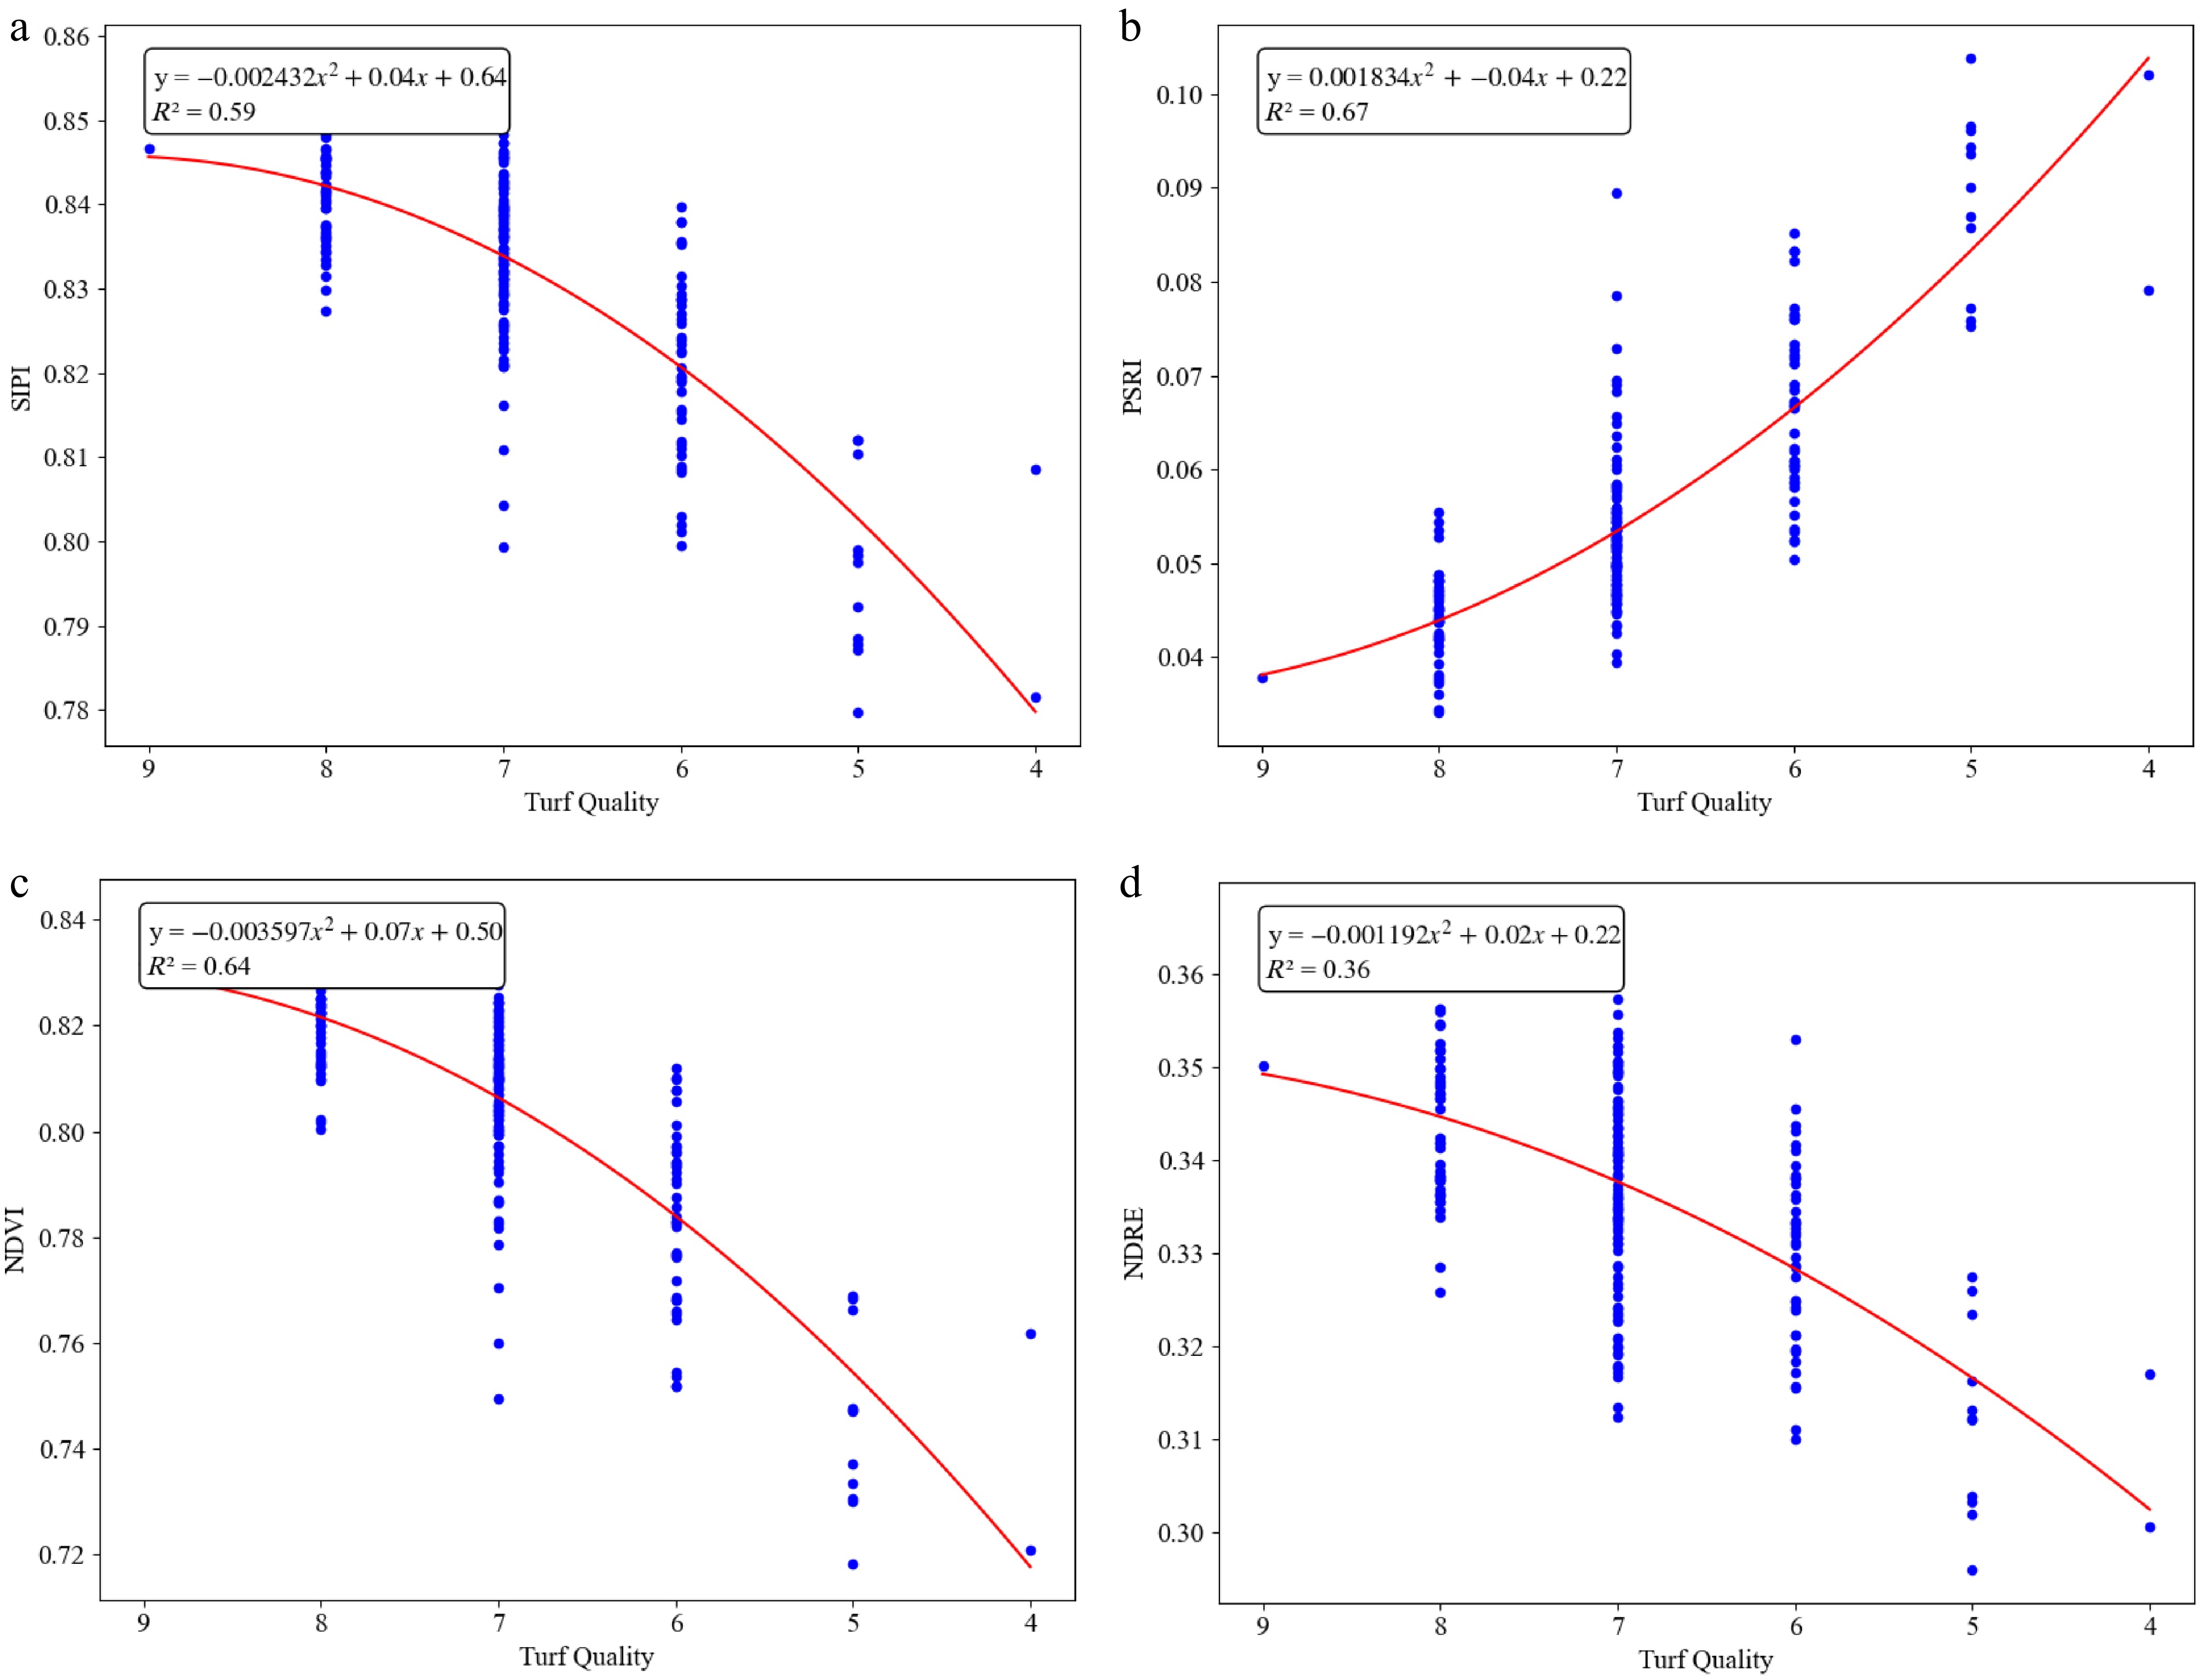
Figure 5.
Relationships of vegetation indices and turf quality during early phase of deficit irrigation (6/14/2024). (a) SIPI vs. TQ, (b) PSRI vs. TQ, (c) NDVI vs. TQ, and (d) NDRE vs. TQ.
Threshold ranges of remote sensing vegetation indices for acceptable level of visual turf quality
-
Threshold ranges for each remote sensing VI were established by analyzing the relationships between each VI and visual TQ ratings obtained from the LGIS system during the 2023 and 2024 experimental periods. The analysis focused on instances where visual TQ achieved the minimum acceptable value of 6.0 on a 1−9 scale. The point or range at which NDVI, SIPI, and NDRE values fell below 6.0 visual TQ rating, and PSRI increased above 6.0 TQ, was identified as the stress threshold values.
SIPI demonstrated a strong positive correlation with TQ. The R2 was 0.77 during the 2023 dry-down period and 0.59, 0.72, and 0.87 during the three dry-down periods in 2024 (Figs. 5–7, 8a). The SIPI values ranged from 0.74 to 0.83 when TQ was at the minimal acceptable level of 6.0 across all dates of measurements in 2023 and 2024.
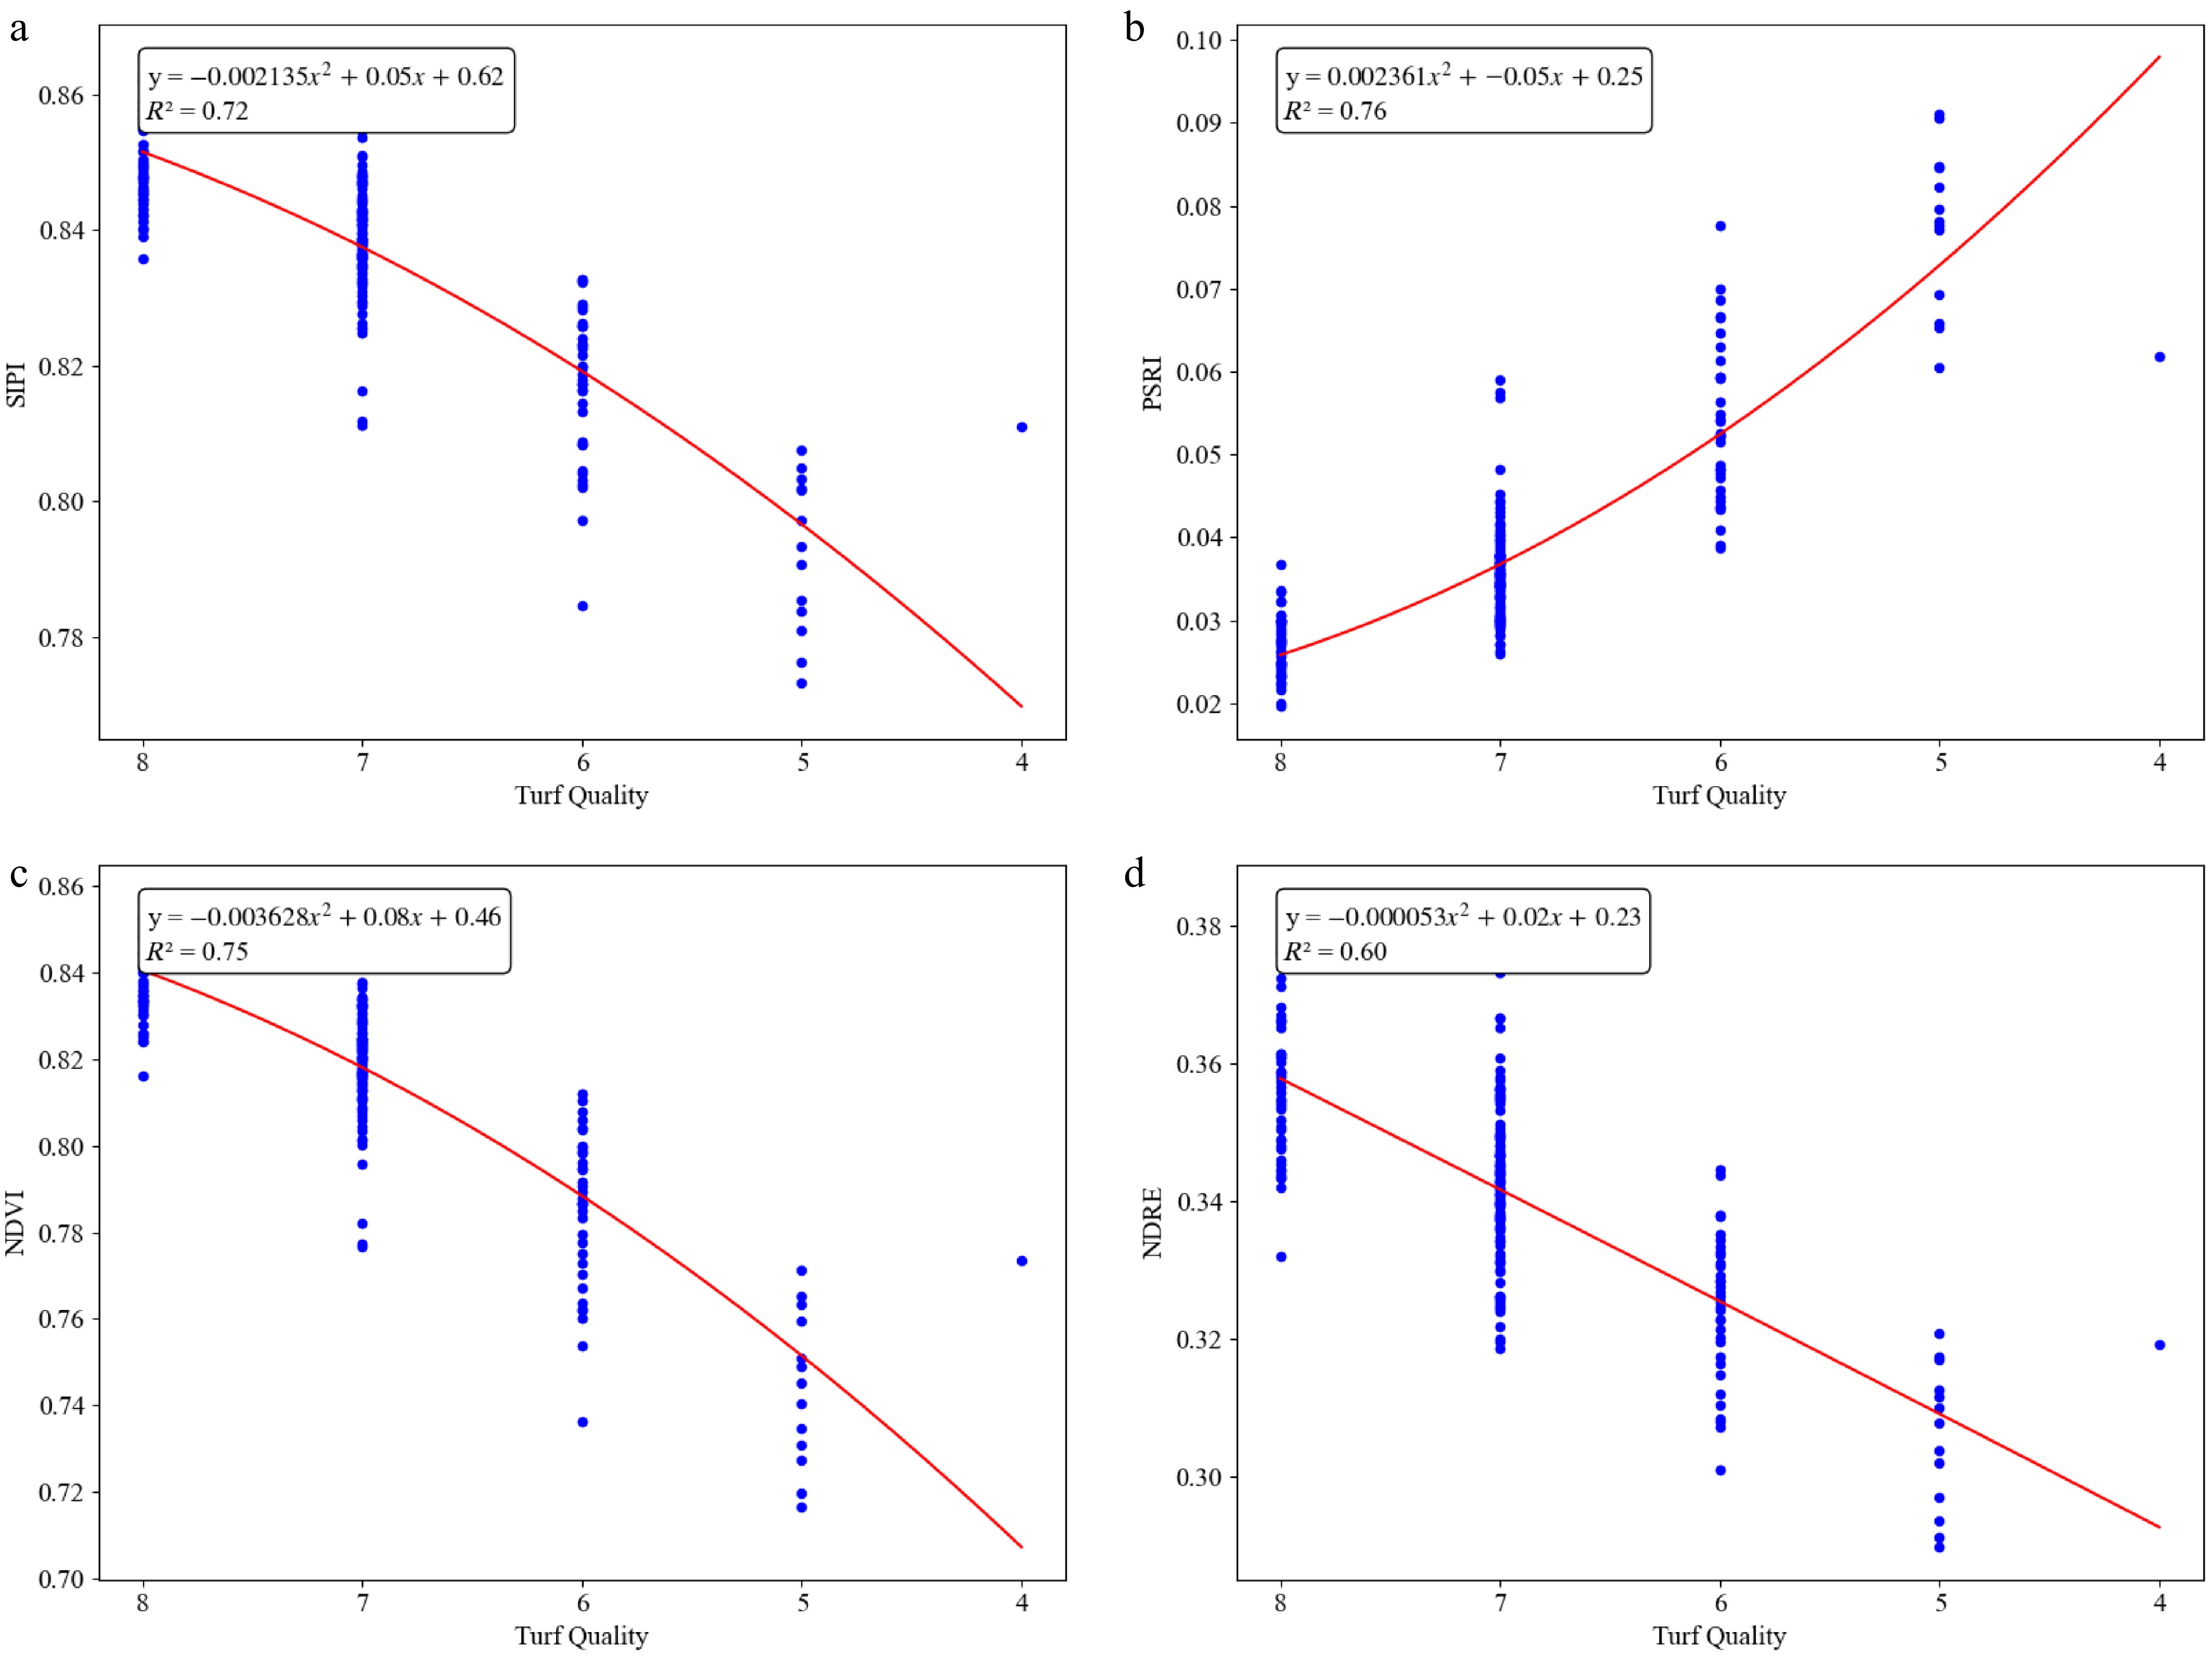
Figure 6.
Relationships of vegetation indices and turf quality during middle phase of deficit irrigation (6/17/2024). (a) SIPI vs. TQ, (b) PSRI vs. TQ, (c) NDVI vs.TQ, and (d) NDRE vs. TQ.
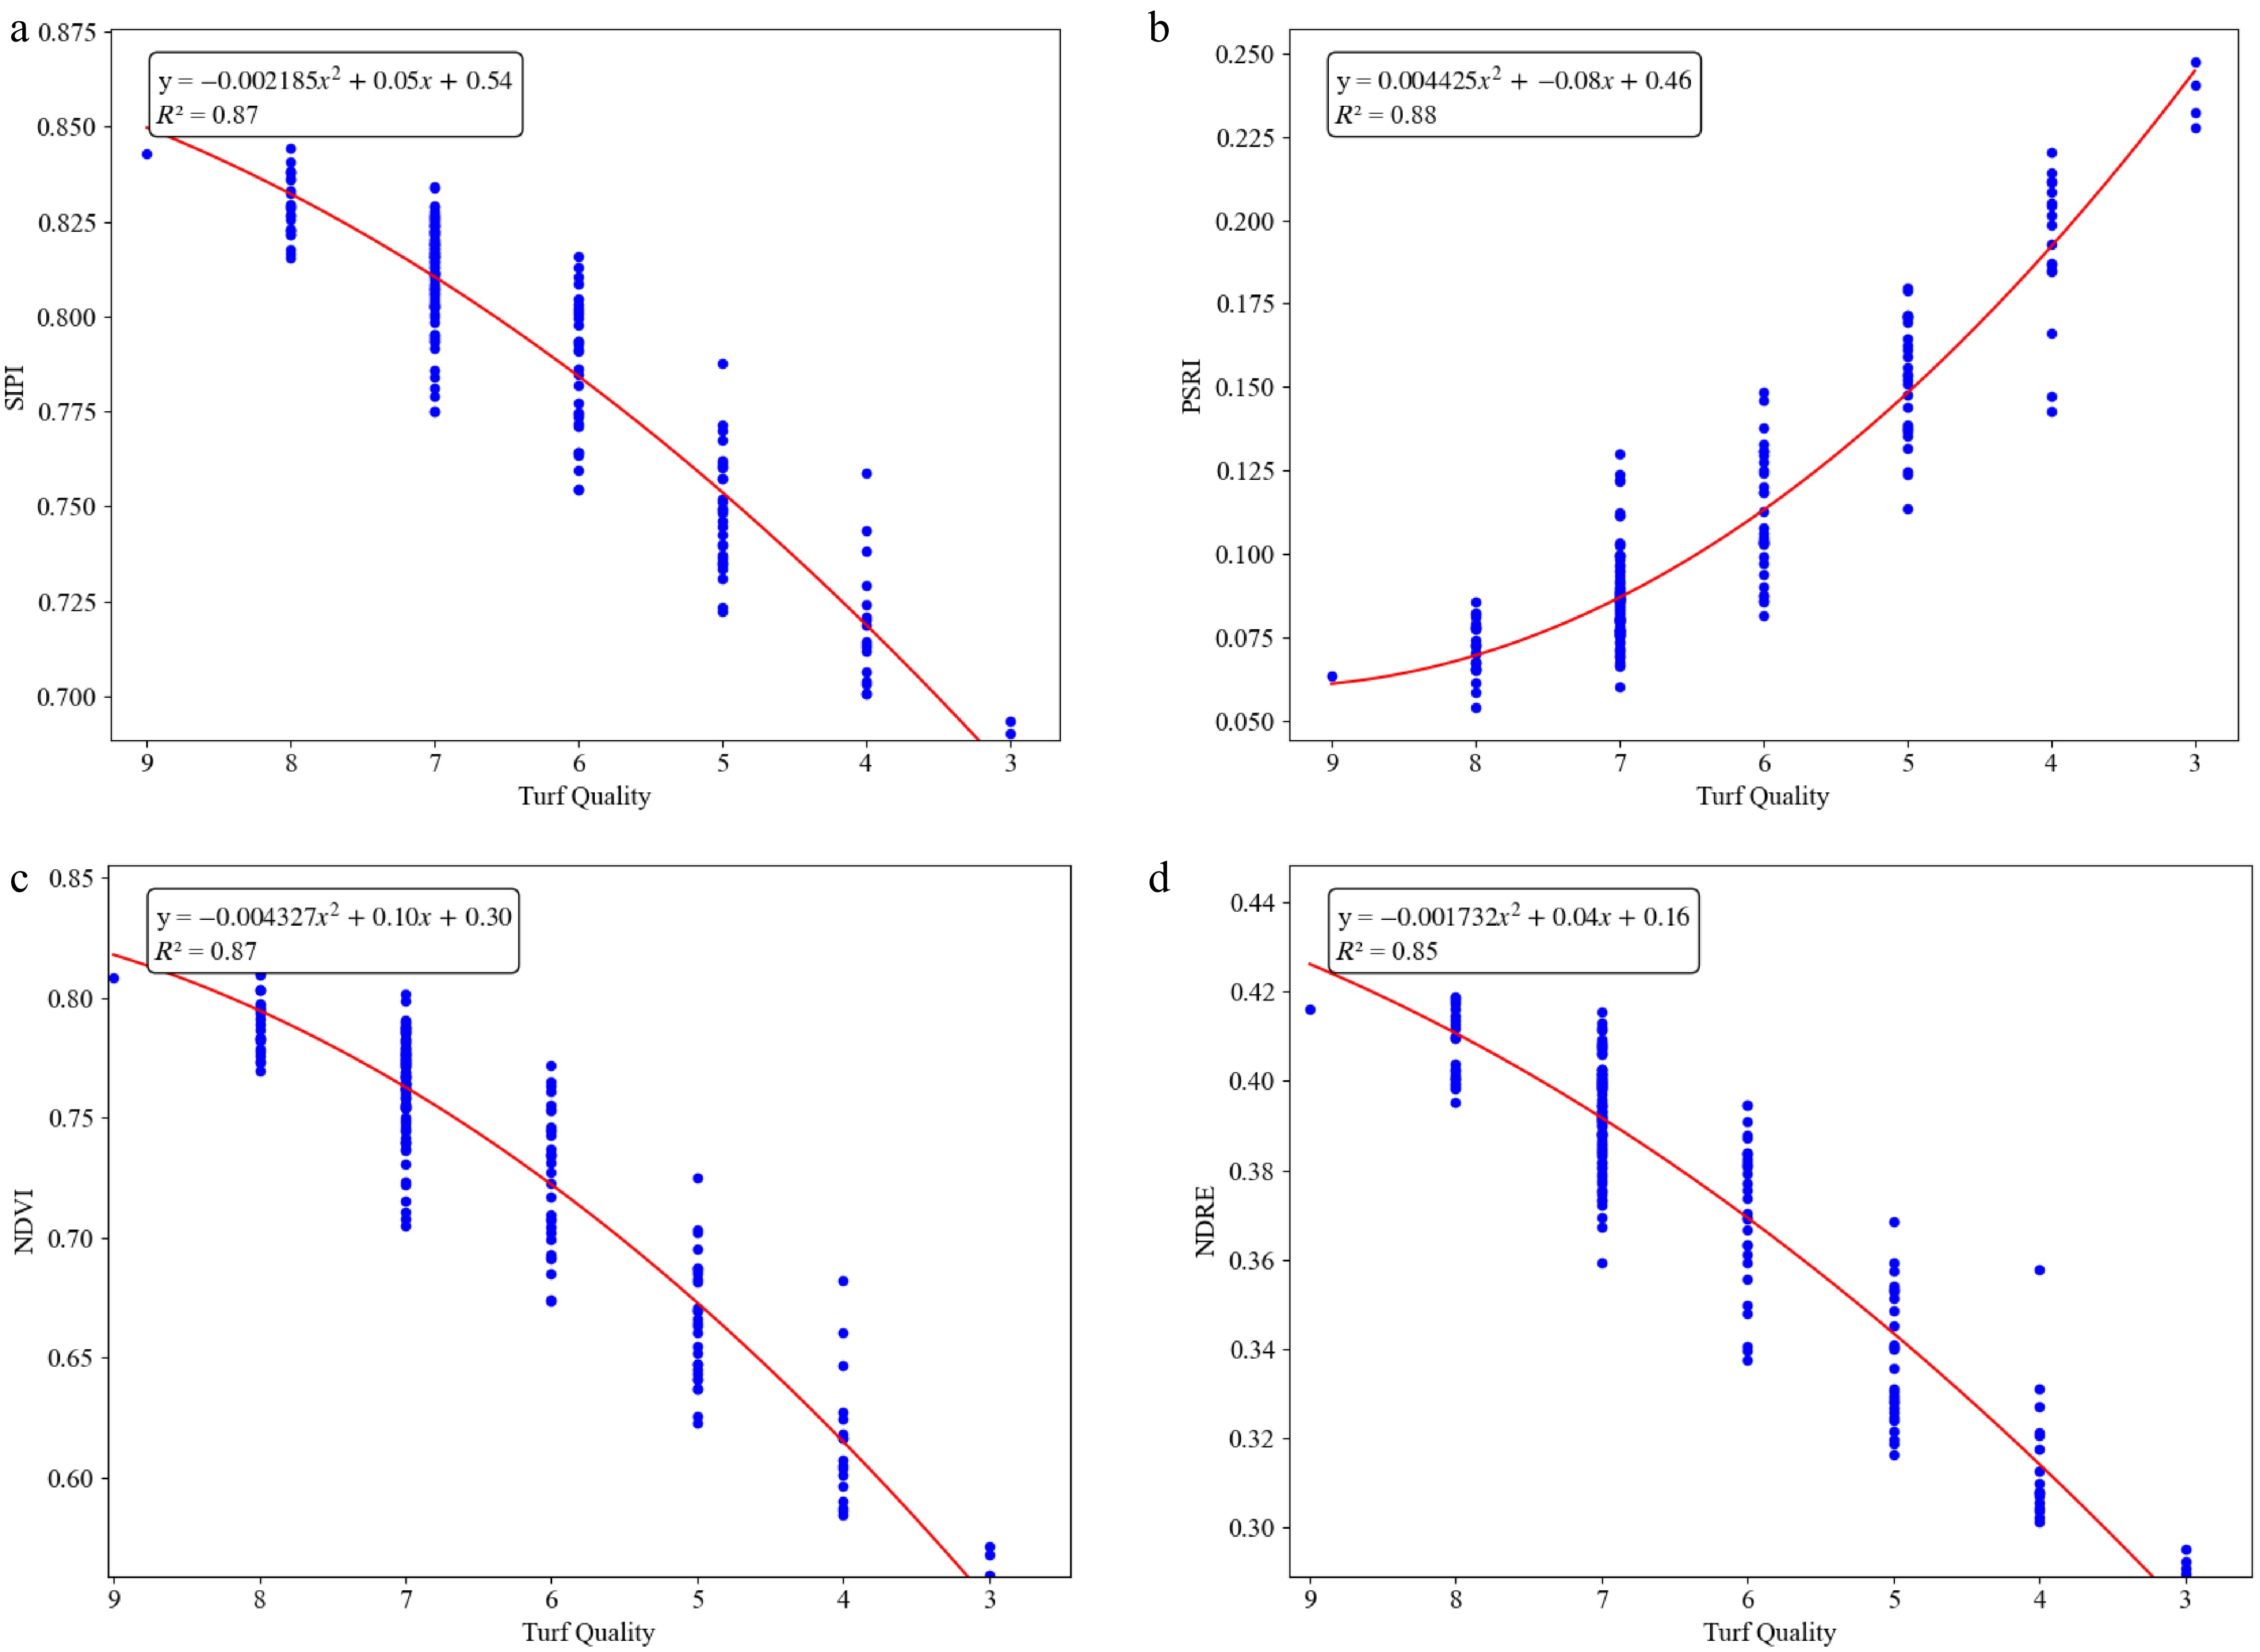
Figure 7.
Relationships of vegetation indices and turf quality during late phase of deficit irrigation (6/25/2024). (a) SIPI vs. TQ, (b) PSRI vs. TQ, (c) NDVI vs. TQ, and (d) NDRE vs. TQ.
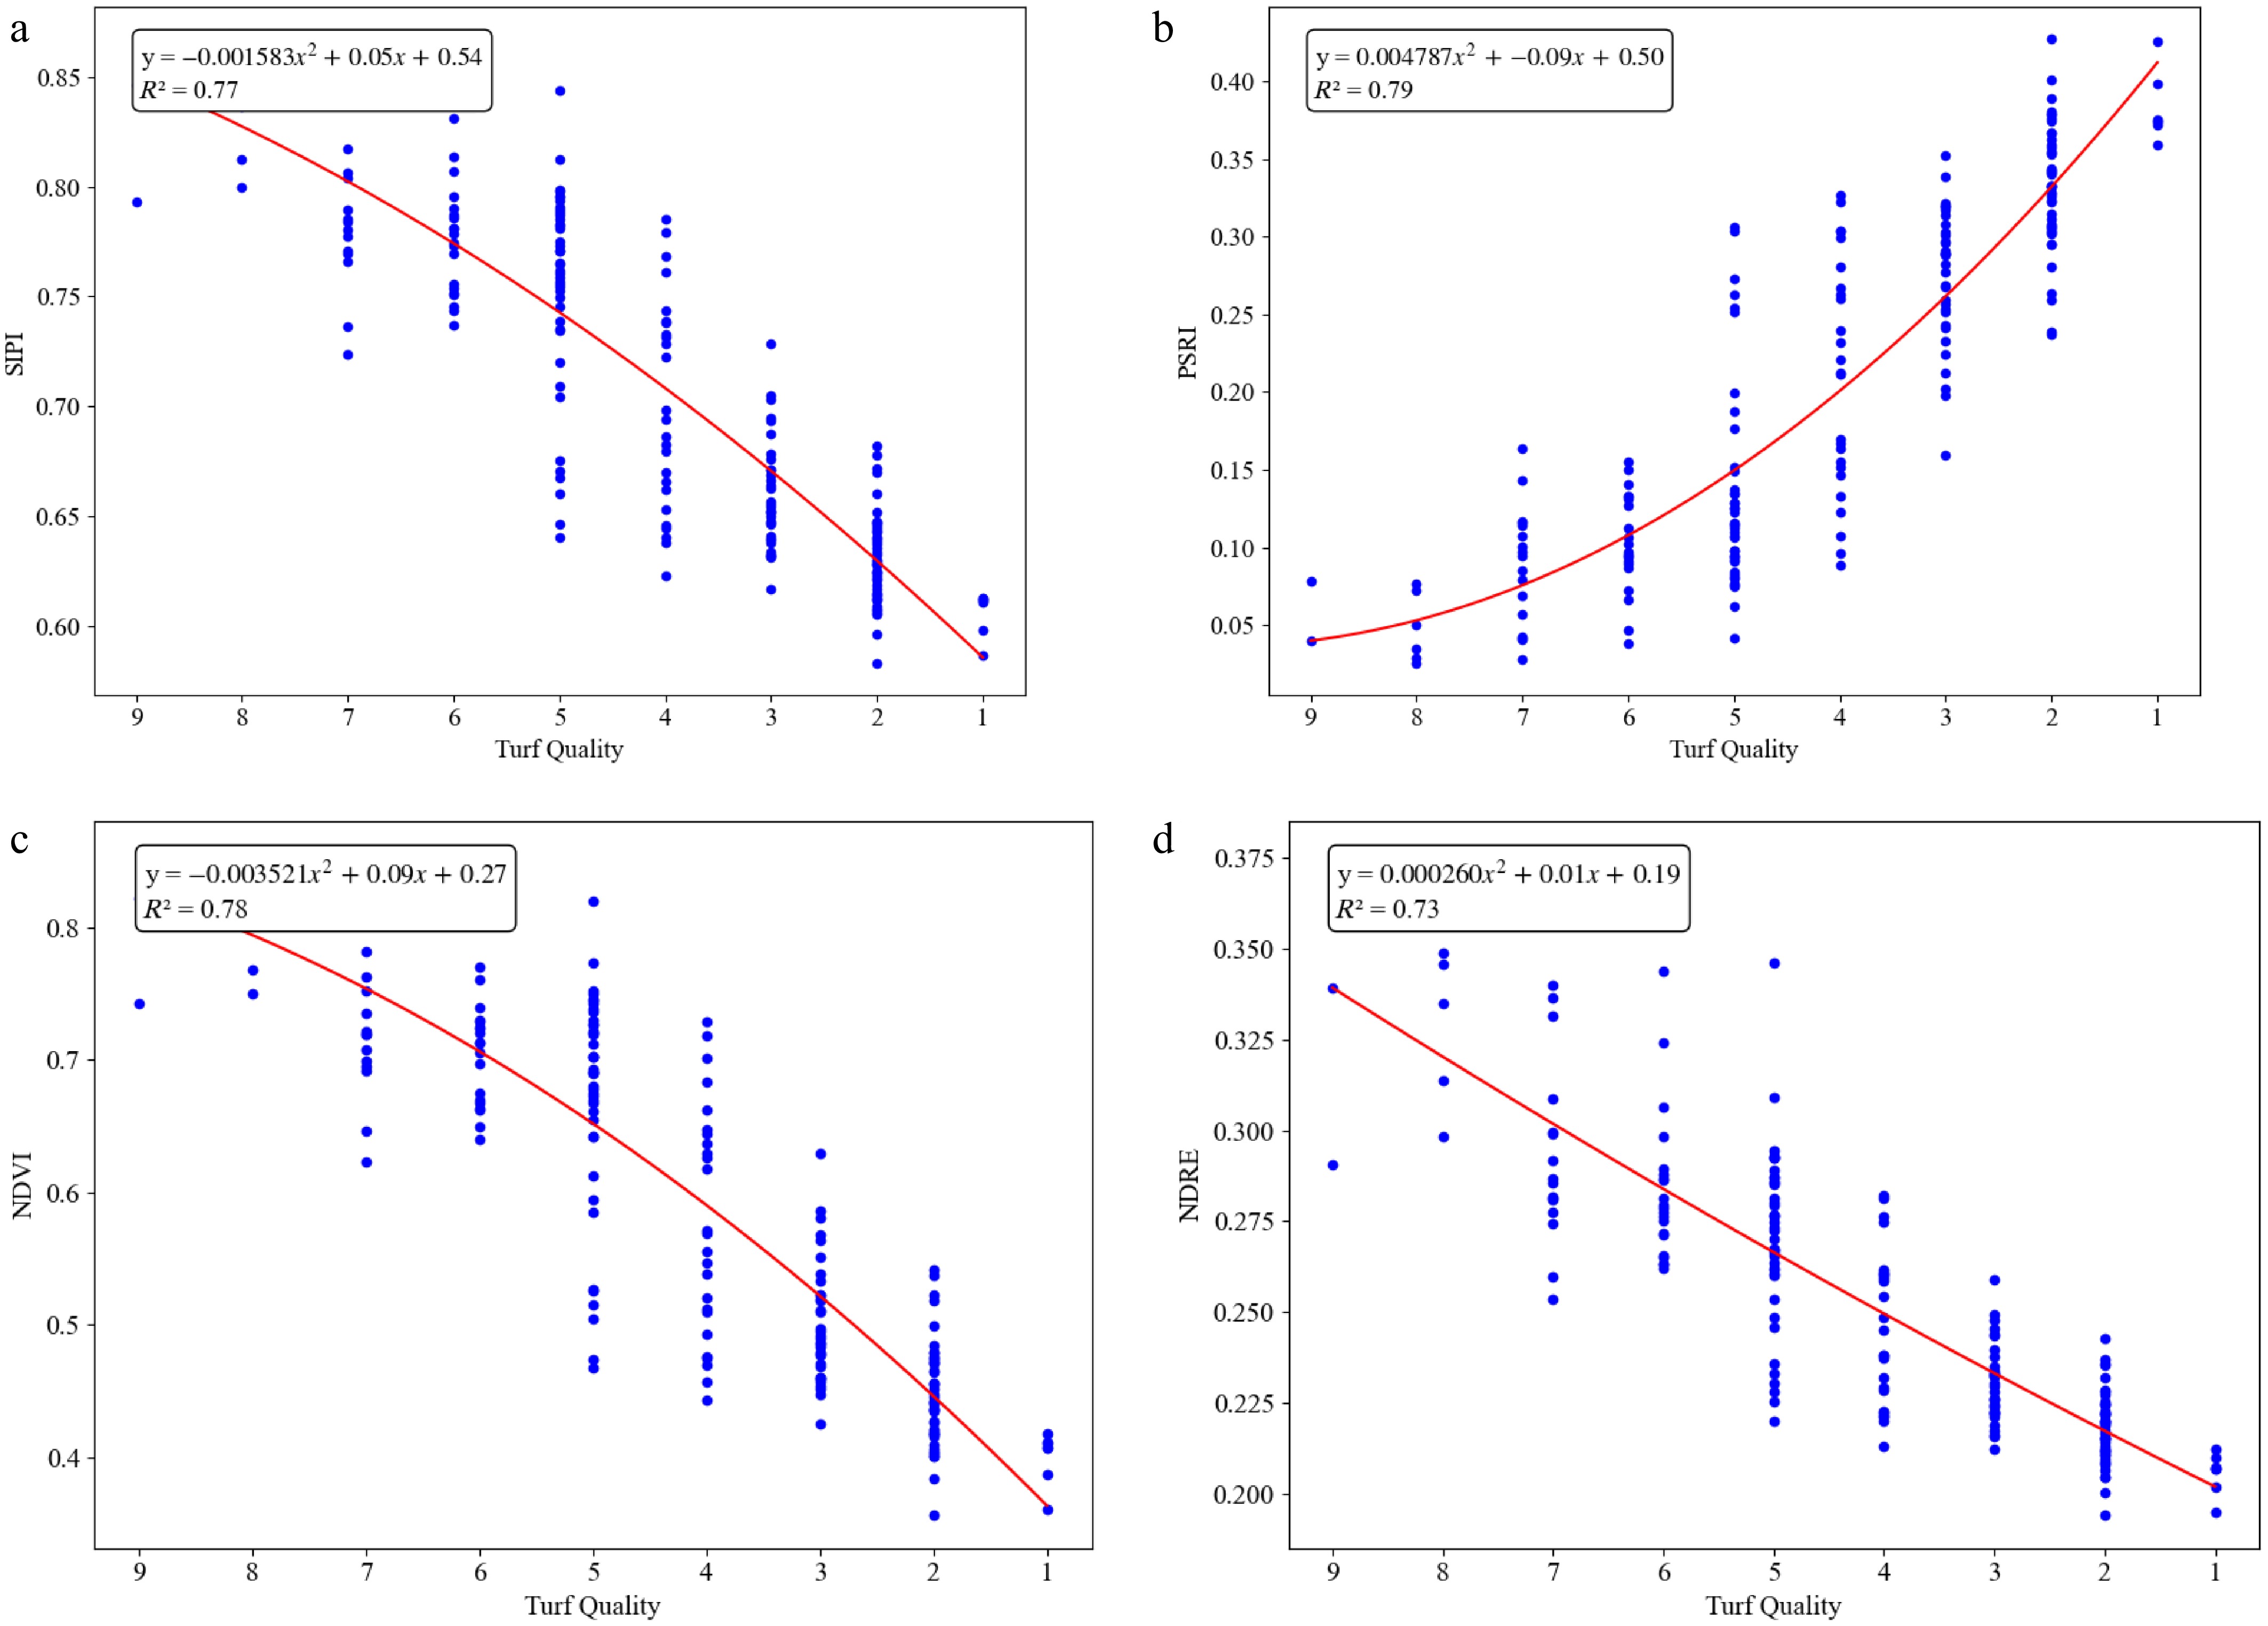
Figure 8.
Relationships of vegetation indices and turf quality during late phase of deficit irrigation (8/13/2023). (a) SIPI vs. TQ, (b) PSRI vs. TQ, (c) NDVI vs. TQ, and (d) NDRE vs. TQ.
PSRI consistently showed a strong negative correlation with TQ. For the 2023 cycle (Fig. 8b), PSRI demonstrated a strong correlation with R2 = 0.79. On June 14, 2024 (Fig. 5b), PSRI showed an R2 of 0.67, which improved to R2 = 0.76 on June 17, 2024 (Fig. 6b), and further to R2 = 0.88 on June 25, 2024 (Fig. 7b). PSRI values ranged from 0.05 to 0.16 when TQ was at the minimal acceptable level of 6.0 across all dates of measurements in 2023 and 2024.
NDVI exhibited a strong correlation with TQ across the 2023 and 2024 dry-down cycles. In the 2023 cycle the R2 was 0.78. On June 14, 2024 (Fig. 5c), NDVI showed an R2 of 0.64. This improved to R2 = 0.75 on June 17, 2024 (Fig. 6c), and further to R2 = 0.87 on June 25, 2024. The NDVI values ranged from 0.61 to 0.80 when TQ was at the minimal acceptable level of 6.0 across all dates of measurements in 2023 and 2024.
NDRE, showing varying correlations with TQ, displayed different R2 values across the dates. For the 2023 cycle on August 13 (Fig. 8d), NDRE exhibited an R2 of 0.73. On June 14, 2024 (Fig. 5d), NDRE showed a moderate correlation with turf quality (R2 = 0.57). This improved on June 17, 2024 (Fig. 6d), with an R2 of 0.60, and further on June 25, 2024 (Fig. 7d), reaching an R2 of 0.85. The NDRE values ranged from 0.25 to 0.38 when TQ was at the minimum acceptable level of 6.0 across all dates of measurements in 2023 and 2024.
-
The linear correlation analysis provides a general understanding of the relationships between remote sensing data and ground-based parameters for the evaluation of turfgrass responses to drought stress. Among the remote-sensing VIs, NDVI, PSRI, and SIPI demonstrated consistently strong correlations. Those VIs were also highly correlated with ground-based measures, DGCI, and TQ. NDRE had a moderate correlation with TQ. This aligns with previous research highlighting the effectiveness of these indices in assessing vegetation status[13,15,16]. The remote-sensing VIs, NDVI, PSRI, and SIPI, along with ground-based DGCI measurements, exhibited strong correlations with SWC. In contrast, NDRE demonstrated lower correlation coefficients with SWC compared to the other VIs. These findings indicate that NDVI, PSRI, SIPI, and DGCI are reliable indicators for assessing plant water stress through their strong relationships with soil moisture levels. However, NDRE appeared to be less suitable for water deficit detection in this context, suggesting that researchers and practitioners should prioritize the more responsive indices when monitoring irrigation needs or drought conditions in similar experimental systems.
Remote sensing monitoring of changes and sensitivity of VIs with declining SWC during soil drying resulting from deficit irrigation provides a powerful, non-invasive method for early drought detection, enabling timely intervention and optimized water management. In this study, NDVI and SIPI consistently demonstrated a strong positive non-linear relationship with SWC across both experimental cycles in 2023 and 2024. This relationship identifies NDVI and SIPI as reliable indicators of soil water content based on canopy status[17]. The linear portion of the relationship with changing SWC suggests that NDVI and SIPI are more effective for evaluating turfgrass performance under moderate to severe drought stress, while the non-linear portion with observed saturation of NDVI and SIPI at elevated SWC levels indicates that these indices are less effective for detecting subtle changes in turfgrass performance under mild drought stress and well-watered conditions. This saturation effect limits their ability to differentiate plant performance when soil moisture is relatively high[18]. PSRI demonstrated a strong negative non-linear relationship with SWC, which is consistent with PSRI's characteristic to detect leaf senescence and chlorophyll degradation that are often induced during early stages of drought stress[19]. The early increases in PSRI during SWC decline showed its sensitivity during the early stages of drought stress, making PSRI a valuable indicator for SWC decline and drought stress. NDRE, which showed weaker correlations with SWC changes, suggesting this index is not sensitive to detecting changes in drought stress. TQ exhibited a moderate positive linear relationship with declining SWC; however, its correlation levels were significantly lower than those of NDVI, SIPI, and PSRI. This finding indicates that the remote VIs, particularly PSRI, NDVI, and SIPI are more sensitive to changes in SWC than visual assessment and useful indictors to monitoring turf performance for creeping bentgrass under drought stress.
The relatively poor overall performance of NDRE in TQ (R2 = 0.034) and SWC (R2 = 0.087) prediction, especially in contrast to moderate to strong correlation on individual dates (R2 ranges from 0.53 to 0.7 for SWC, and 0.36 to 0.8 for TQ), indicates that the NDRE value ranges significantly fluctuated across different dates. This is due to the environmental variables such as solar zenith angles, light intensity, or atmospheric haze, which vary between dates, even with sensor calibration. Therefore, NDRE may be considered an excellent tool for detecting immediate SWC or TQ declines, but its use as a universal predictor across different dates may require date-specific normalization or the inclusion of seasonal covariates to account for shifting baselines. Unlike NDRE, which relies on the highly sensitive and narrow red-edge transition zone, indices such as NDVI, SIPI, and PSRI utilize broader spectral regions or specific pigment ratios that are naturally more buffered against fluctuations in light geometry and atmospheric conditions, allowing them to maintain a more consistent baseline across different sampling periods[20]. The diagnostic statistics in Supplementary Table S3 also provide quantitative evidence for this volatility. The high relative variation (CV = 8.96%), which is nearly double that of SIPI (4.13%), and the wide 95% prediction interval (0.2797–0.3988) highlight the significant dispersion of individual datapoints, confirming that inter-date baseline shifts introduce a level of noise that overwhelms the index's sensitivity when data are pooled.
The extreme VIF values seen in the results indicate that NDVI, SIPI, and PSRI are relatively redundant in this context, capturing nearly identical canopy reflectance data. Using these indices together in a single regression model could lead to unstable coefficients or overfitting. In contrast, the independence of NDRE suggests it provides a unique spectral perspective. This is likely due to the red-edge band's ability to penetrate deeper into the canopy to reflect chlorophyll content, whereas NDVI often saturates or only captures surface-level data. Since the VIFs for SWC and the NDRE/PSRI combinations remained low, these variables could've been the most suitable candidates for multi-variable analysis, as they offer distinct, non-overlapping information. However, as NDRE showed serious flaws in its performance stability in prediction for SWC and TQ across different dates, NDVI/SIPI/PSRI still should be prioritized in consideration for VI candidates of SWC/TQ prediction. DGCI, on the other hand, showed low VIF values in its relation to remote VIs, which indicates the relative complementarity of ground spectral data with remote sensing data.
Effective use of various remote-sensing VIs for high-throughput phenotyping of turf performance under drought stress requires the establishment of threshold ranges for each VI. However, defining universal and specific thresholds remains challenging due to environmental variability. NDVI in the range of 0.6−0.9 is considered healthy plants and below 0.6 indicates stress. For acceptable turf quality (e.g., a visual rating of 6 on a 1−9 scale), studies have suggested NDVI thresholds around 0.6–0.65 for tall fescue and 0.5 for hybrid bermudagrass in specific regions[21]. A decline from the healthy range towards these lower values (or below) indicates increasing stress. PSRI in the range of −0.1 to 0.2 is considered healthy, and SIPI in the range of 0.8−1.8, varying with species, is considered healthy. NDRE ranges from 0.3−0.6 in healthy plants, and below 0.3 indicates signs of abiotic stress[22,23]. In our study, NDRE ranged from 0.25 to 0.38, NDVI ranged from 0.61 to 0.80, PSRI ranged from 0.05 to 0.16, and SIPI ranged from 0.74 to 0.82 when the TQ was rated at 6.0. Establishing these benchmarks of remote sensing VIs may facilitate high-throughput phenotyping of plants for drought tolerance and enable the development of precision irrigation management programs based on turfgrass performance assessed with these indices. The shifting SWC threshold for TQ = 6 across time points likely reflects varying environmental factors, such as temperature and ET. While these weather variables influence the instantaneous relationship between moisture and turf quality, the canopy response remains a cumulative process; the SWC threshold for TQ = 6 was highly fluctuating across the different dates.
The differing performance of these indices is fundamentally tied to how the creeping bentgrass canopy physically and chemically reacts to water deficit. Early in the drought cycle, the rapid response of PSRI and SIPI is driven by shifting pigment stoichiometry—specifically an increase in the carotenoid-to-chlorophyll ratio[9,10]. As water potential drops, plants often begin chlorophyll degradation as part of the senescence process, while carotenoids are retained longer to provide photoprotection[24,25]. This biochemical shift allows these indices to act as early warning indicators before any damage is visible to the naked eye. In contrast, NDVI serves as a broader proxy for canopy structural responses. As stress intensifies, the combination of leaf rolling, wilting, and reduced leaf area changes the physical architecture of the turf. Because NDVI captures both this structural collapse and the loss of greenness, it remains a robust, though less nuanced, indicator of overall plant health[26]. By tracking these specific pigment dynamics alongside structural changes, we get a much clearer physiological fingerprint of drought than a visual TQ rating could ever provide.
In summary, this study demonstrates that multispectral indices—including NDVI, SIPI, and PSRI—offer a highly sensitive and objective alternative to traditional visual assessments for monitoring drought stress in creeping bentgrass. While the high multicollinearity and extreme VIF values suggest these indices provide overlapping information, their stability across varying environmental conditions and strong correlation with soil moisture make them the most reliable candidates for consistent drought prediction. In particular, the early detection capabilities of PSRI highlight its value in identifying the onset of stress before visual quality declines. Conversely, while NDRE provides a unique physiological perspective on deep-canopy chlorophyll, its susceptibility to temporal baseline shifts requires date-specific caution. By establishing practical threshold systems and benchmarks for each VI, these findings offer a framework for integrating high-throughput phenotyping into precision irrigation programs. Ultimately, leveraging these remote sensing tools enables proactive, data-driven water management, ensuring turfgrass performance is maintained while optimizing water use efficiency.
-
The authors confirm their contributions to the paper as follows: data curation: Yang H, Gladden D; formal analysis, software, validation, data visualization, writing − original draft: Yang H; methodology: Yang H, Huang B; investigation: Yang H, Gladden D, Rossi S; writing − review and editing: Gladden D, Rossi S, Huang B; conceptualization, funding acquisition, project administration, resources, supervision: Huang B. All authors reviewed the results and approved the final version of the manuscript.
-
All data generated or analyzed during this study are included in this published article and its supplementary information files.
-
The research presented in this paper was funded by the United State Department of Agriculture - National Institute of Food and Agriculture (2021-51181-35855) and Rutgers Center for Turfgrass Science.
-
The authors declare that they have no conflict of interest.
- Supplementary Table S1 Fertilizer and fungicide application record during experimental period.
- Supplementary Table S2 Collinearity diagnostics for vegetation indices and turfgrass parameters.
- Supplementary Table S3 Statistics and distribution intervals for vegetation indices (n = 800).
- Copyright: © 2026 by the author(s). Published by Maximum Academic Press, Fayetteville, GA. This article is an open access article distributed under Creative Commons Attribution License (CC BY 4.0), visit https://creativecommons.org/licenses/by/4.0/.
-
About this article
Cite this article
Yang H, Gladden D, Rossi S, Huang B. 2026. Sensitivity and threshold ranges of remote-sensing vegetation indices for assessing creeping bentgrass responses to deficit irrigation. Grass Research 6: e023 doi: 10.48130/grares-0026-0015 

Sensitivity and threshold ranges of remote-sensing vegetation indices for assessing creeping bentgrass responses to deficit irrigation
- Received: 10 February 2026
- Revised: 06 May 2026
- Accepted: 20 May 2026
- Published online: 05 August 2026
Abstract: Water scarcity is an escalating challenge for turfgrass management, highlighting the need for more objective, high-throughput tools to monitor plant health. While traditional visual quality ratings are the industry standard, they are often limited by observer bias and an inability to detect drought stress before visible damage occurs. This study evaluated the efficacy of unmanned aerial vehicle (UAV)-based remote sensing as a precise alternative for assessing drought responses in '007' creeping bentgrass (Agrostis stolonifera). Using a linear gradient irrigation system (LGIS) during the 2023 and 2024 growing seasons, we induced a controlled spectrum of soil water content (SWC) to compare aerial vegetation indices (VIs) against ground-based physiological data. The results indicate that multispectral indices, specifically NDVI, SIPI, NDRE, and PSRI, provide a more detailed assessment of plant status compared to manual evaluations, demonstrating strong correlations with turf quality (R2 up to 0.88). The PSRI proved to be a sensitive early-warning indicator by detecting stress-induced senescence during the initial stages of soil drying, when visual symptoms were minimal. To facilitate the application of these spectral data in management practices, specific threshold ranges were established to correspond with the minimum acceptable turf quality rating of 6.0. These findings indicate that UAV-based phenotyping is a suitable alternative to manual evaluations and provides the high-resolution data required to develop precision irrigation strategies and high-throughput phenotyping selection of drought-tolerant cultivars.
-
Key words:
- Turfgrass /
- Drought /
- Remote sensing