-
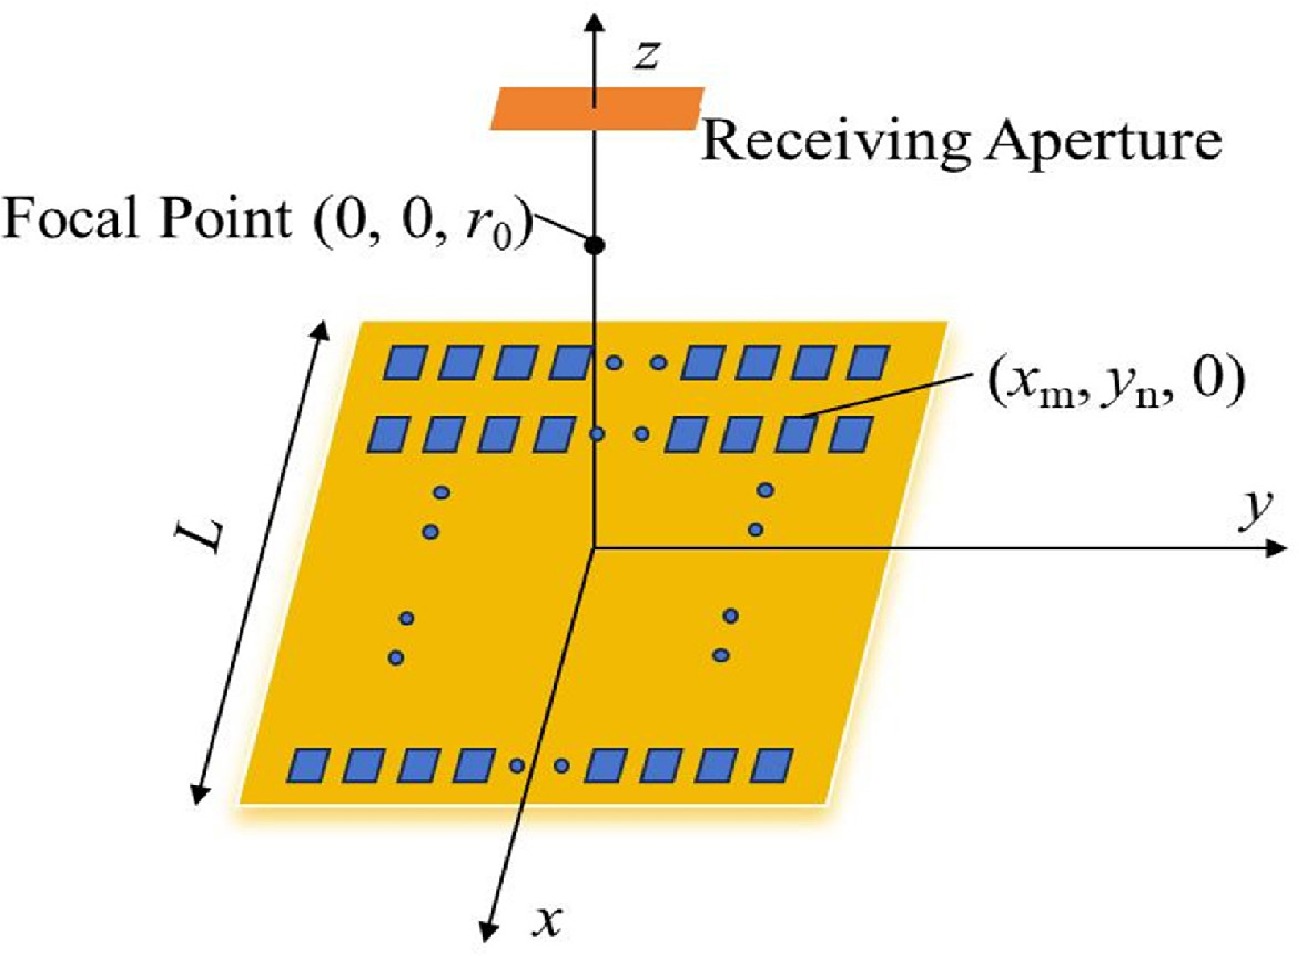
Figure 1.
Schematic diagram of planar array antenna radiation.
-
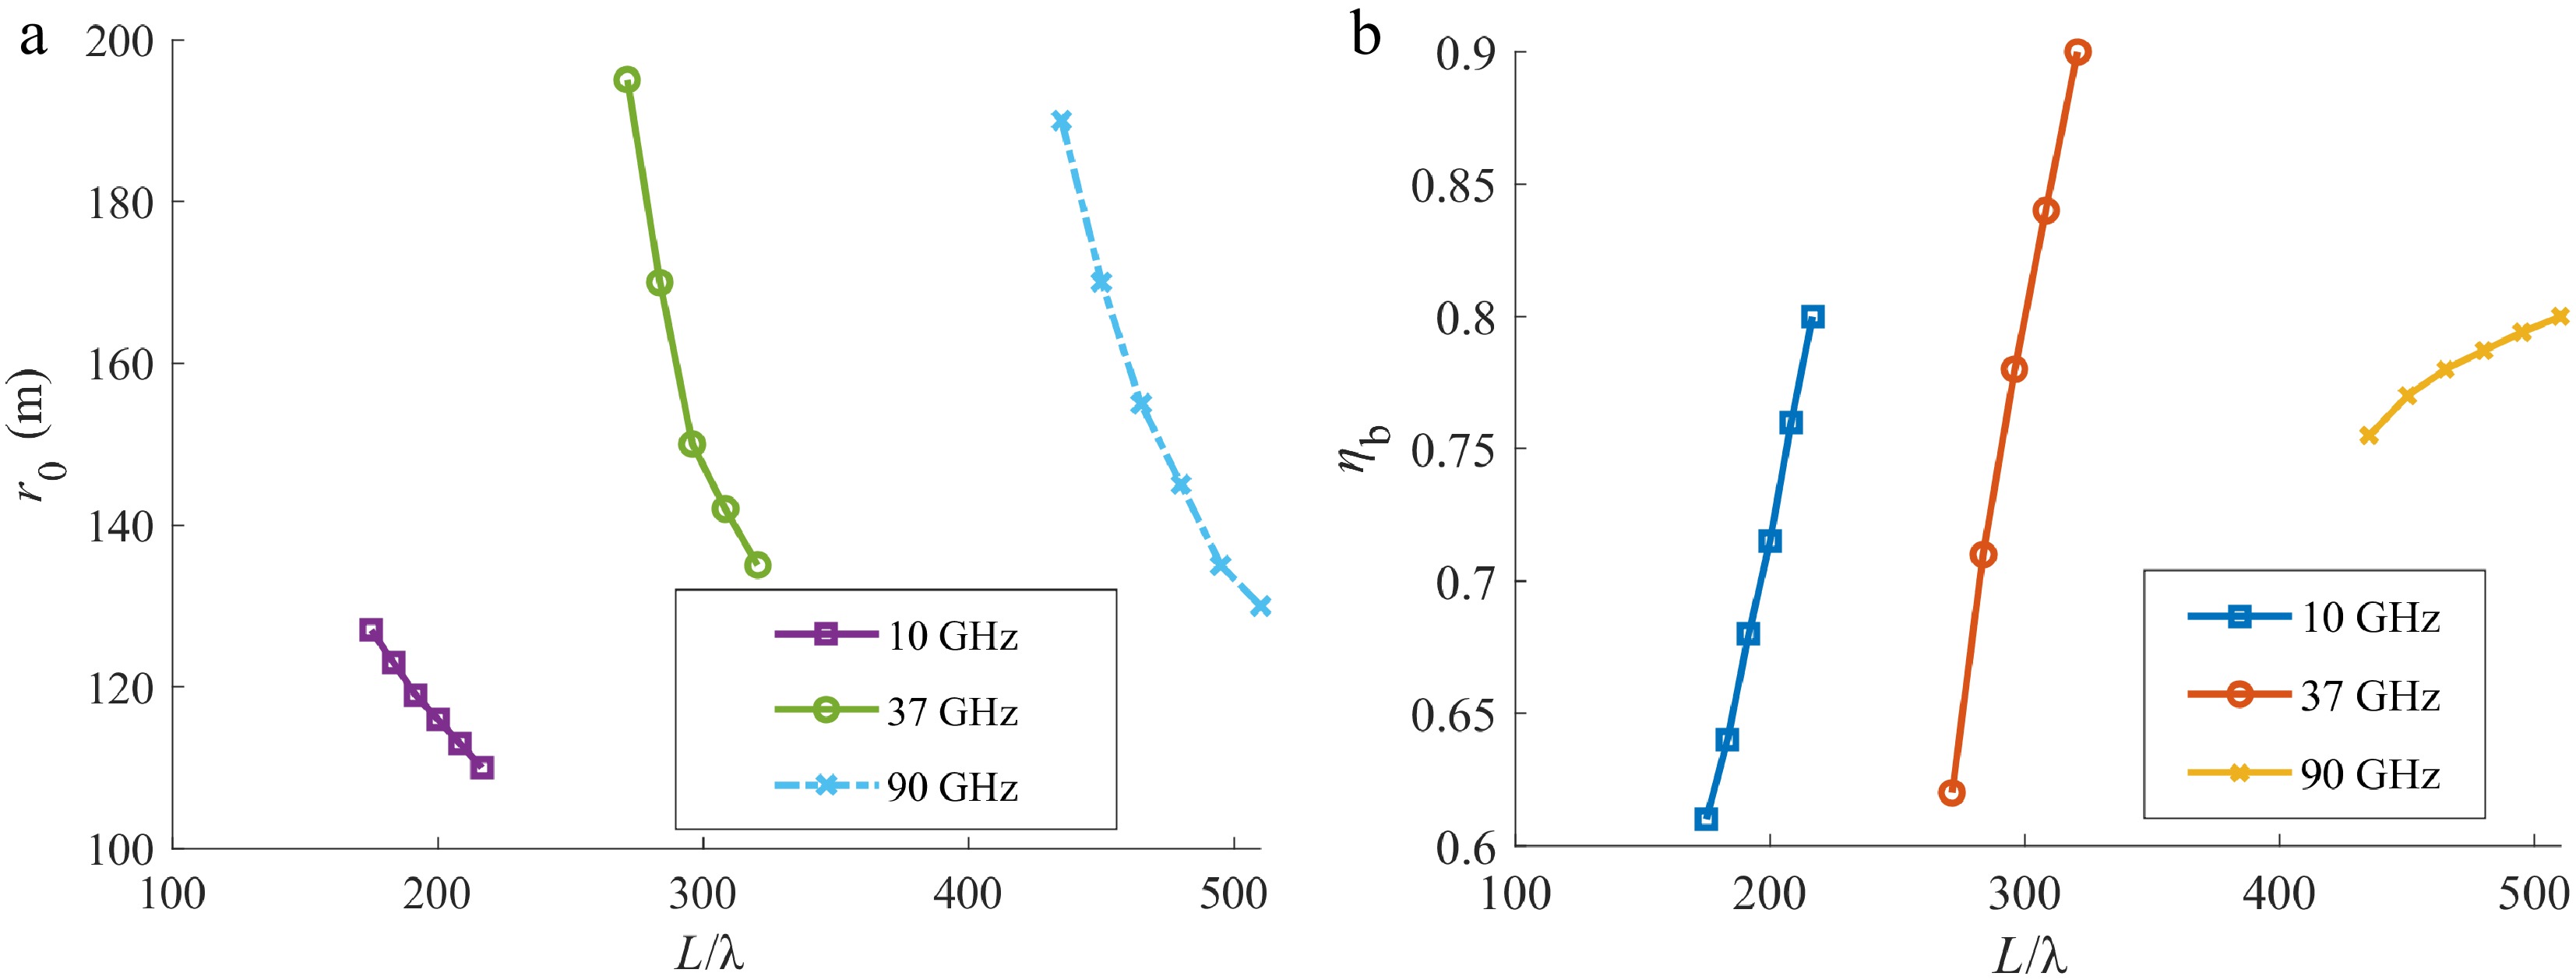
Figure 2.
r0 and ηb as a function of L/λ at 10, 37, and 90 GHz when maximum electric fields occur on the z-axis at a distance of 100 m. (a) r0 as a function of L/λ and (b) ηb as a function of L/λ.
-
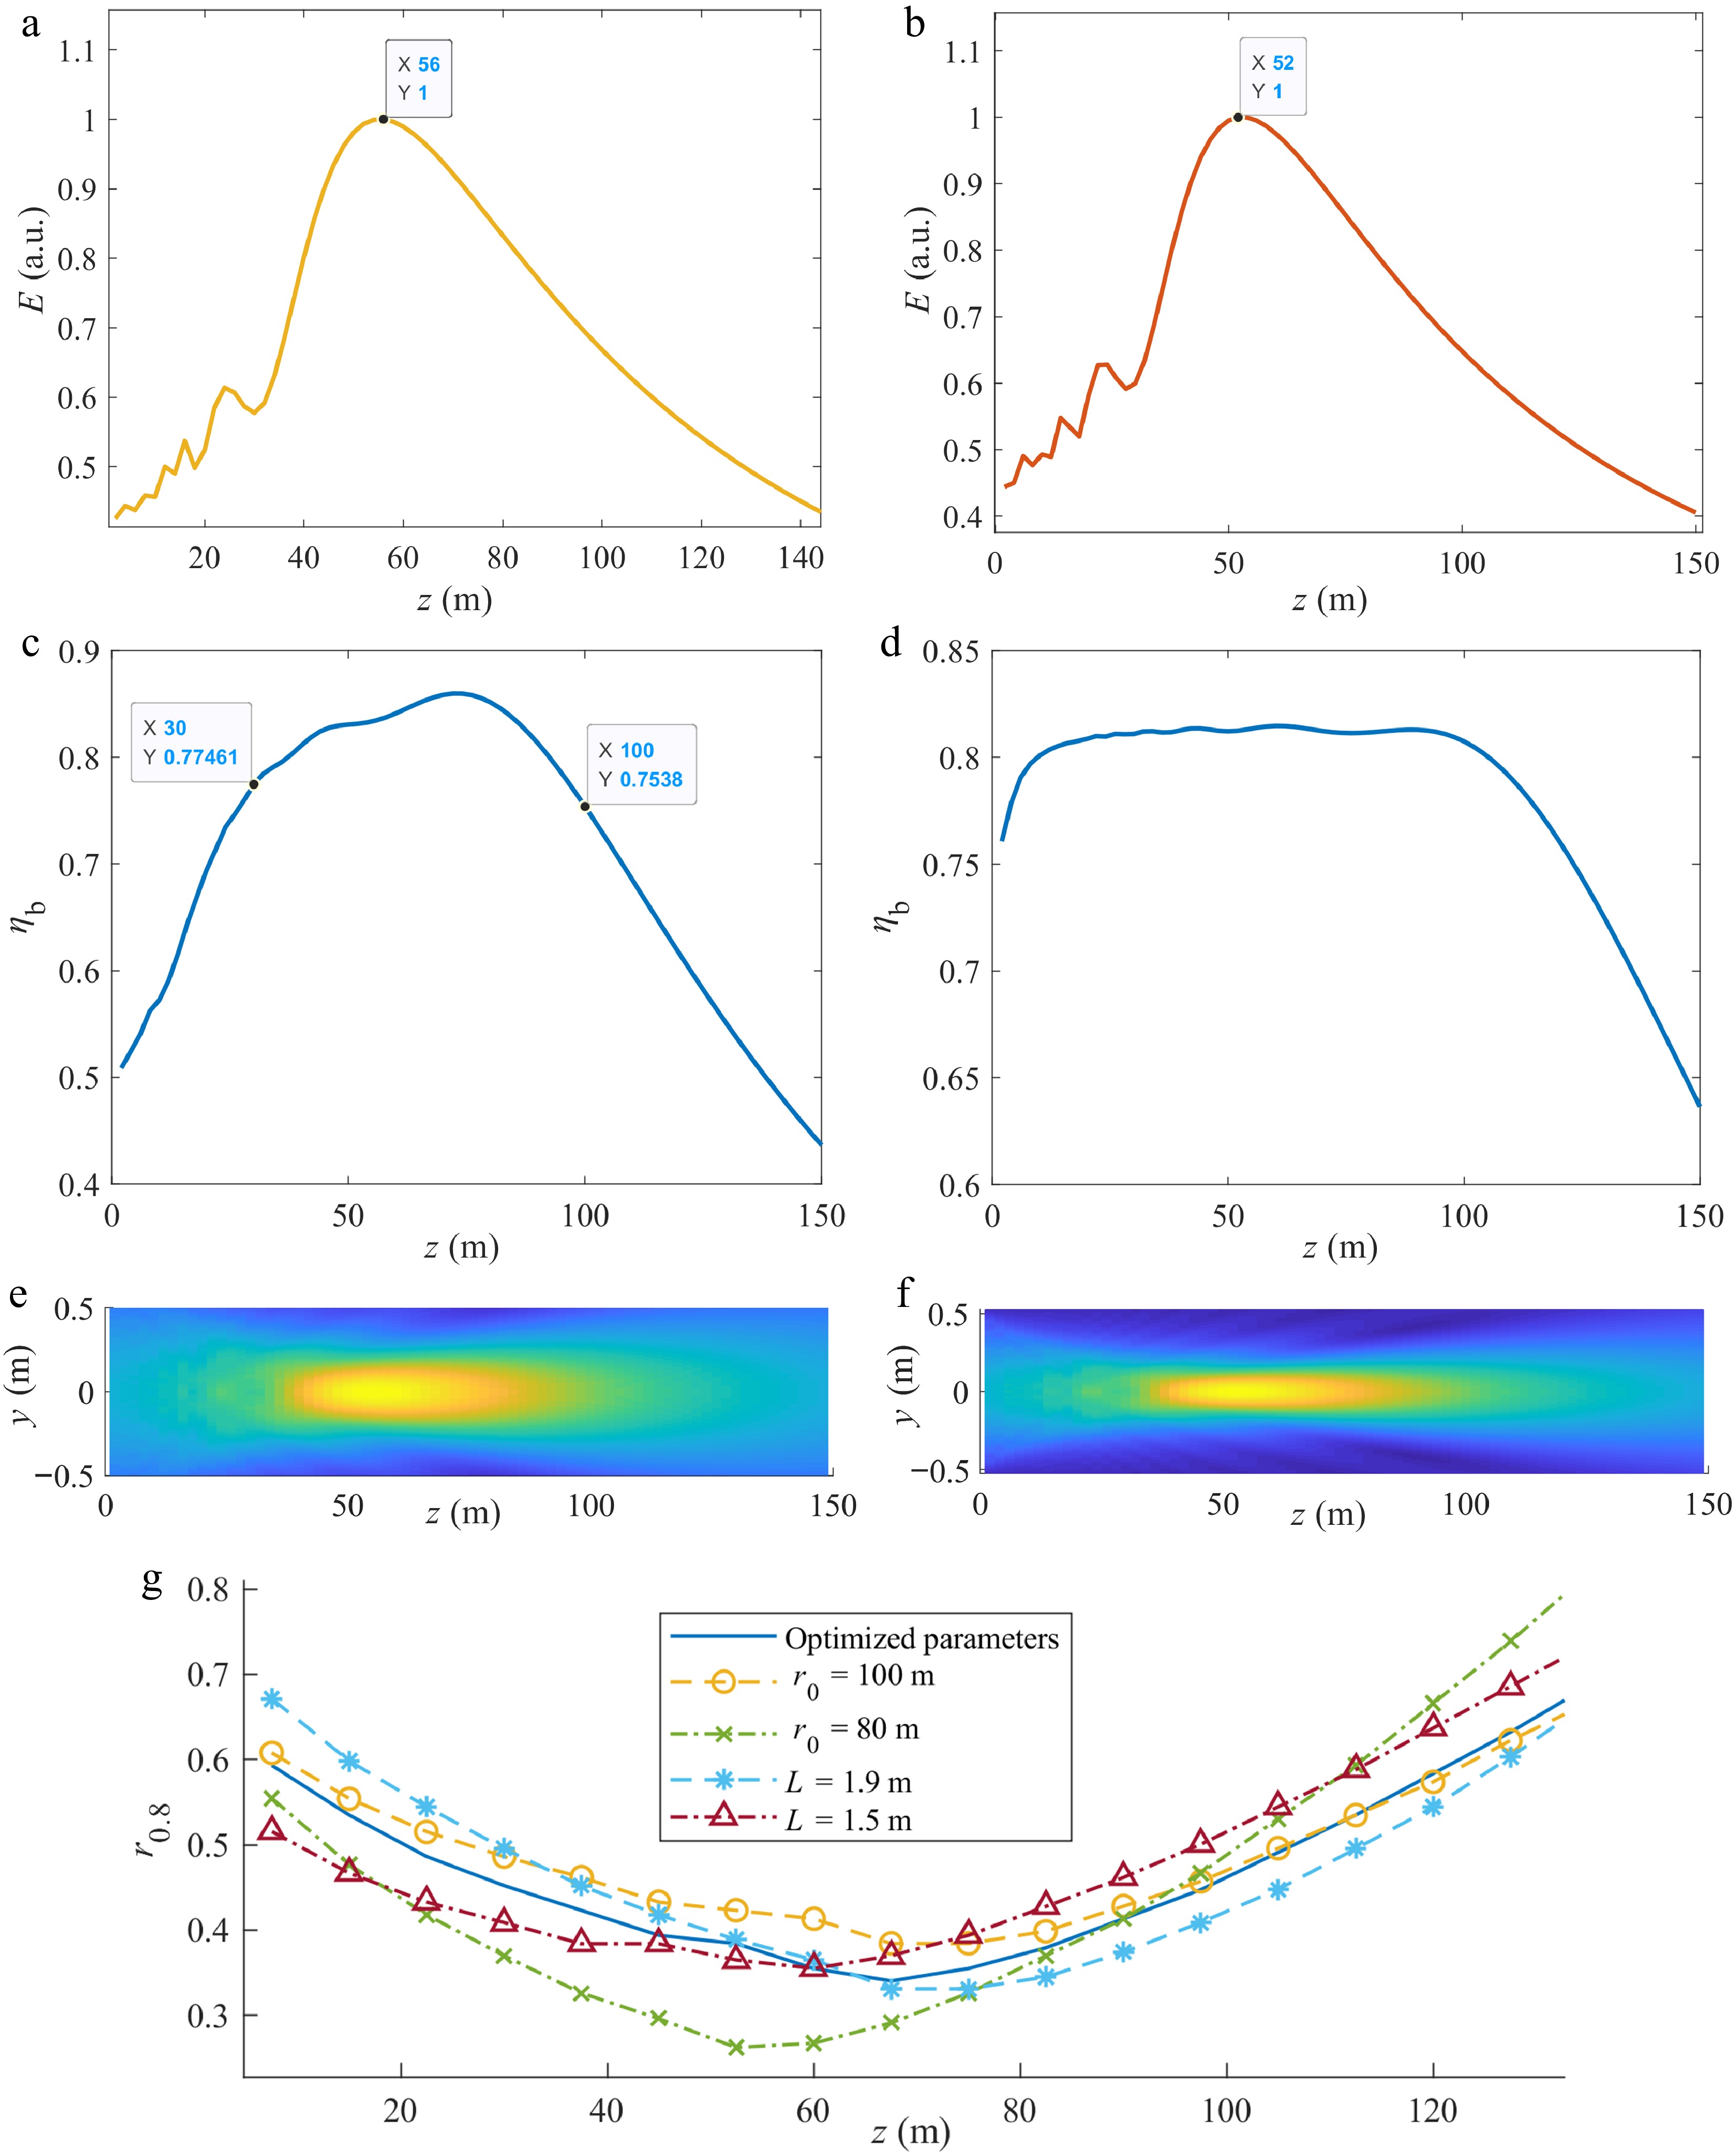
Figure 3.
Power transmission properties with optimized focal distances at 37 and 90 GHz. (a) Electric field along the z-axis at 37 GHz, (b) electric field along z-axis at 90 GHz, (c) ηb vs z at 37 GHz, (d) ηb vs z at 90 GHz, (e) field distribution on yoz plane at 37 GHz, (f) field distribution on yoz plane at 90 GHz, and (g) r0.8 vs z at 37 GHz under different beam parameters.
-
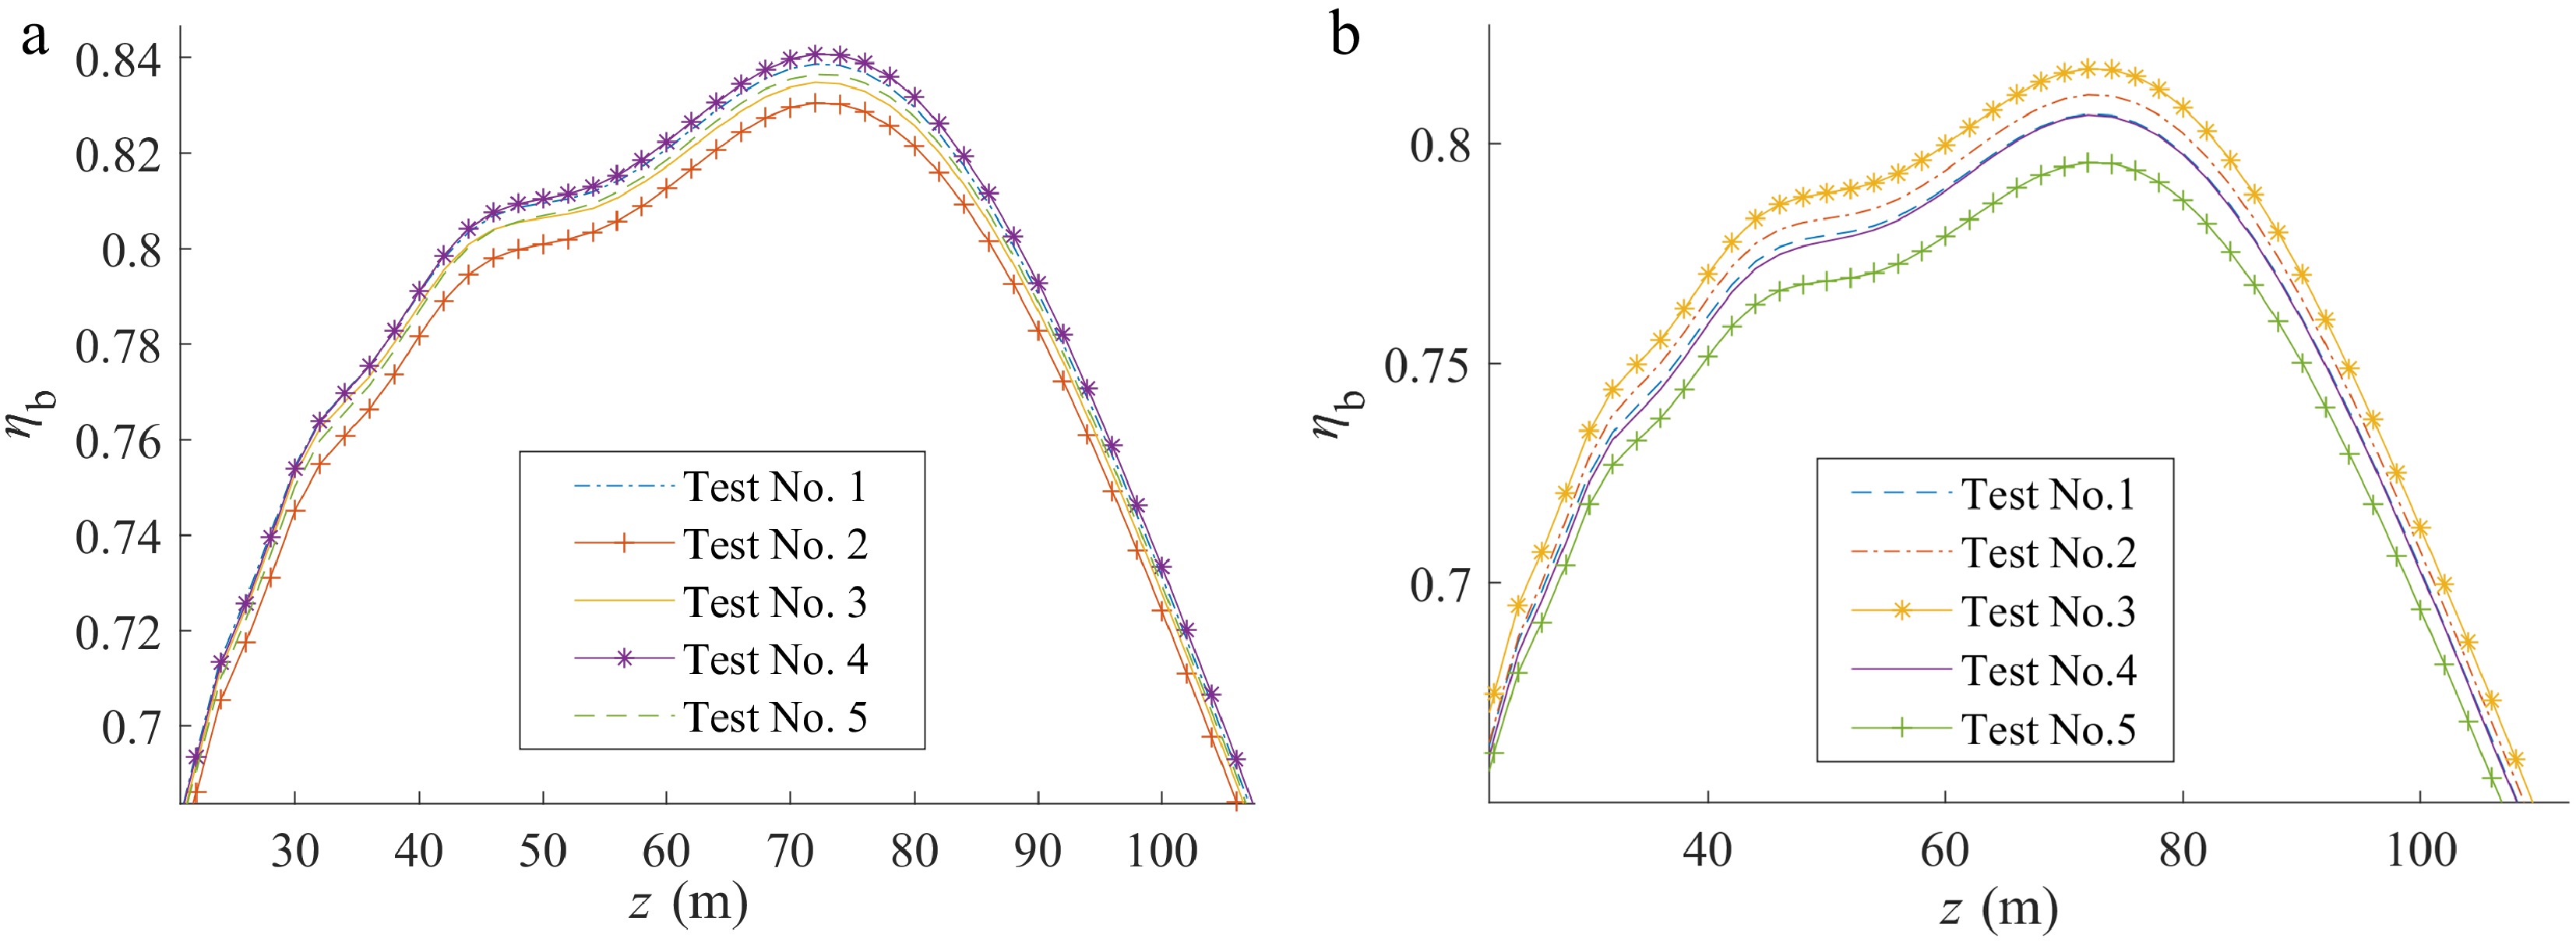
Figure 4.
Beam efficiency as a function of z obtained by five random tests considering phase error in initial phase distribution. (a) σ = 10, and (b) σ = 15.
-
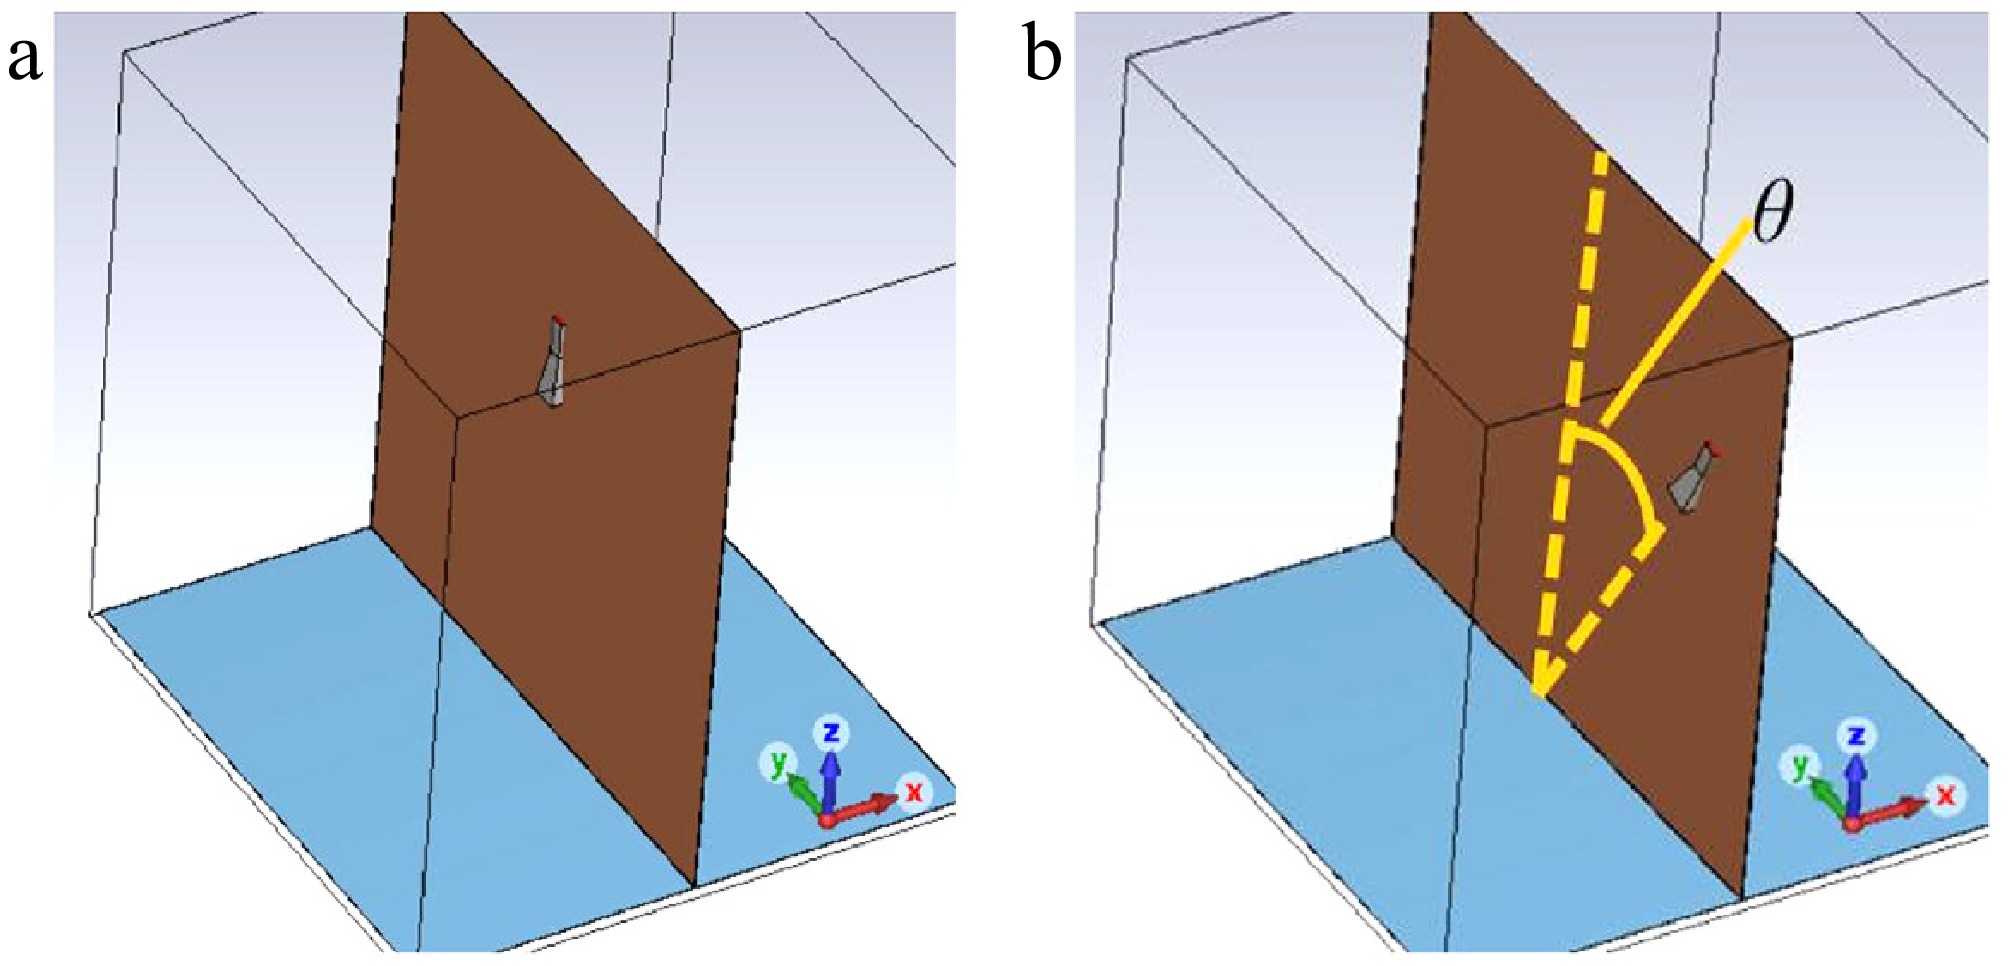
Figure 5.
Geometry of the horn and antenna aperture. (a) Boresight feed, and (b) offset feed.
-
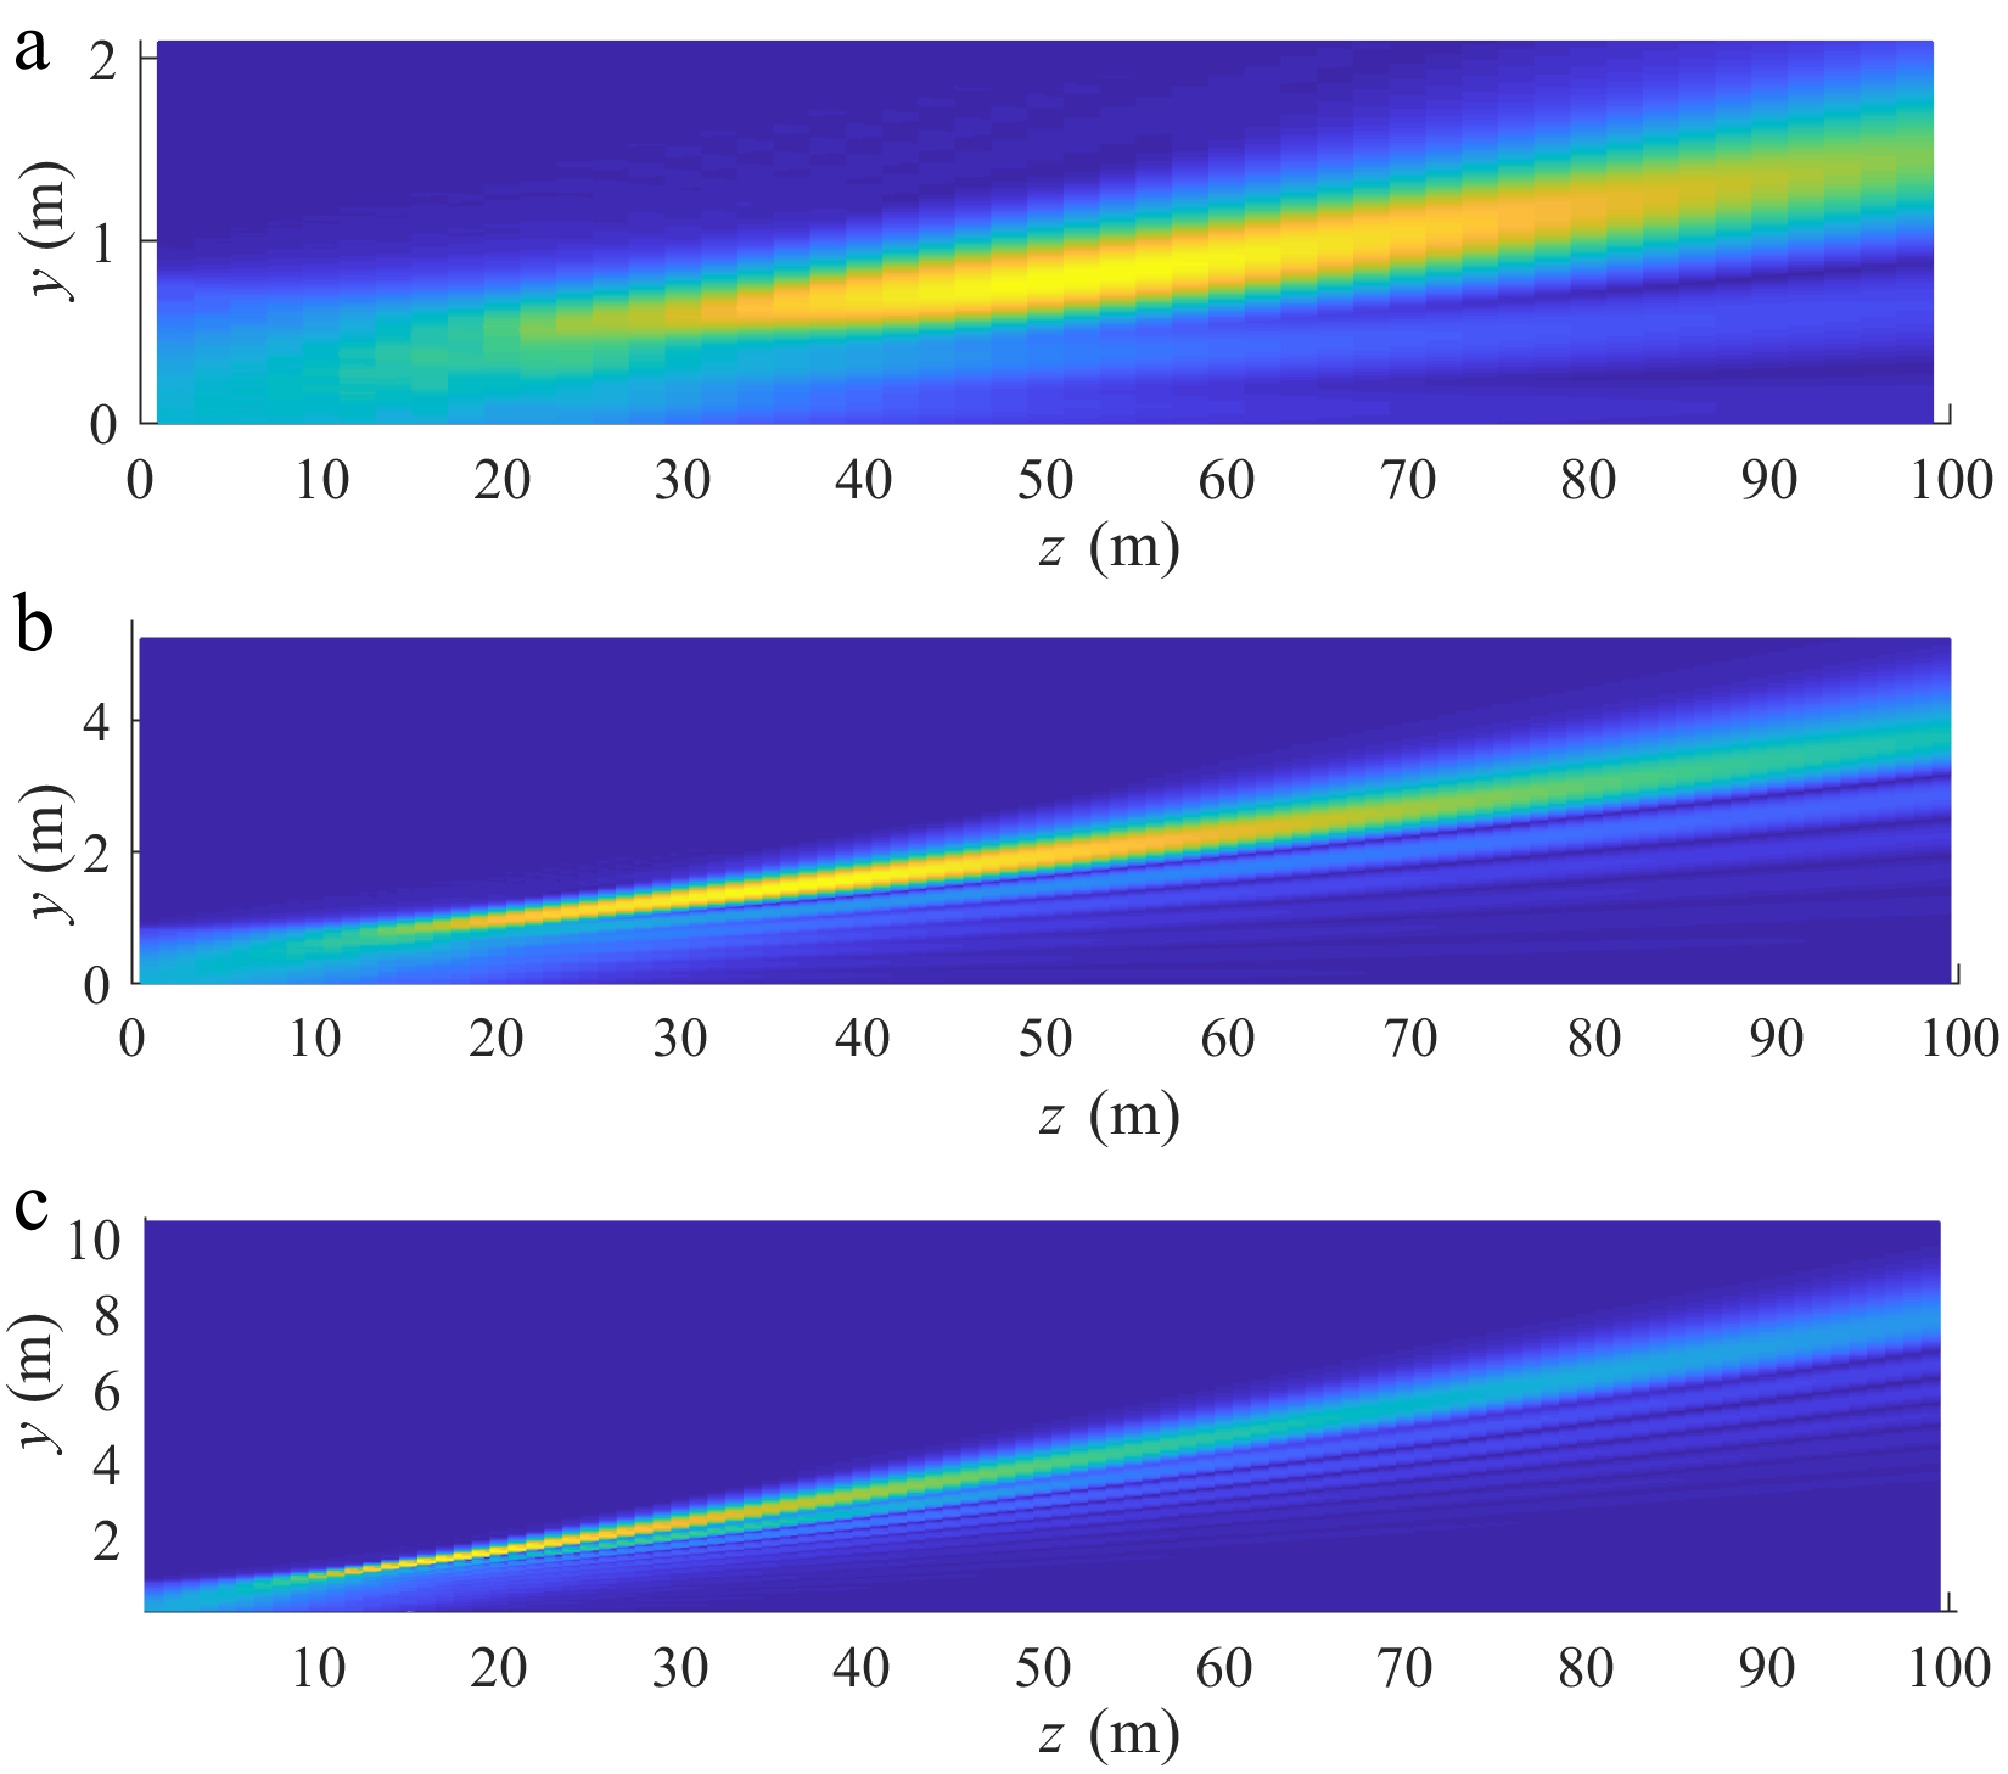
Figure 6.
Field distribution on yoz plane at 37 GHz for offset feed. (a) θ = 1°, (b) θ = 2.5°, and (c) θ = 5°.
-
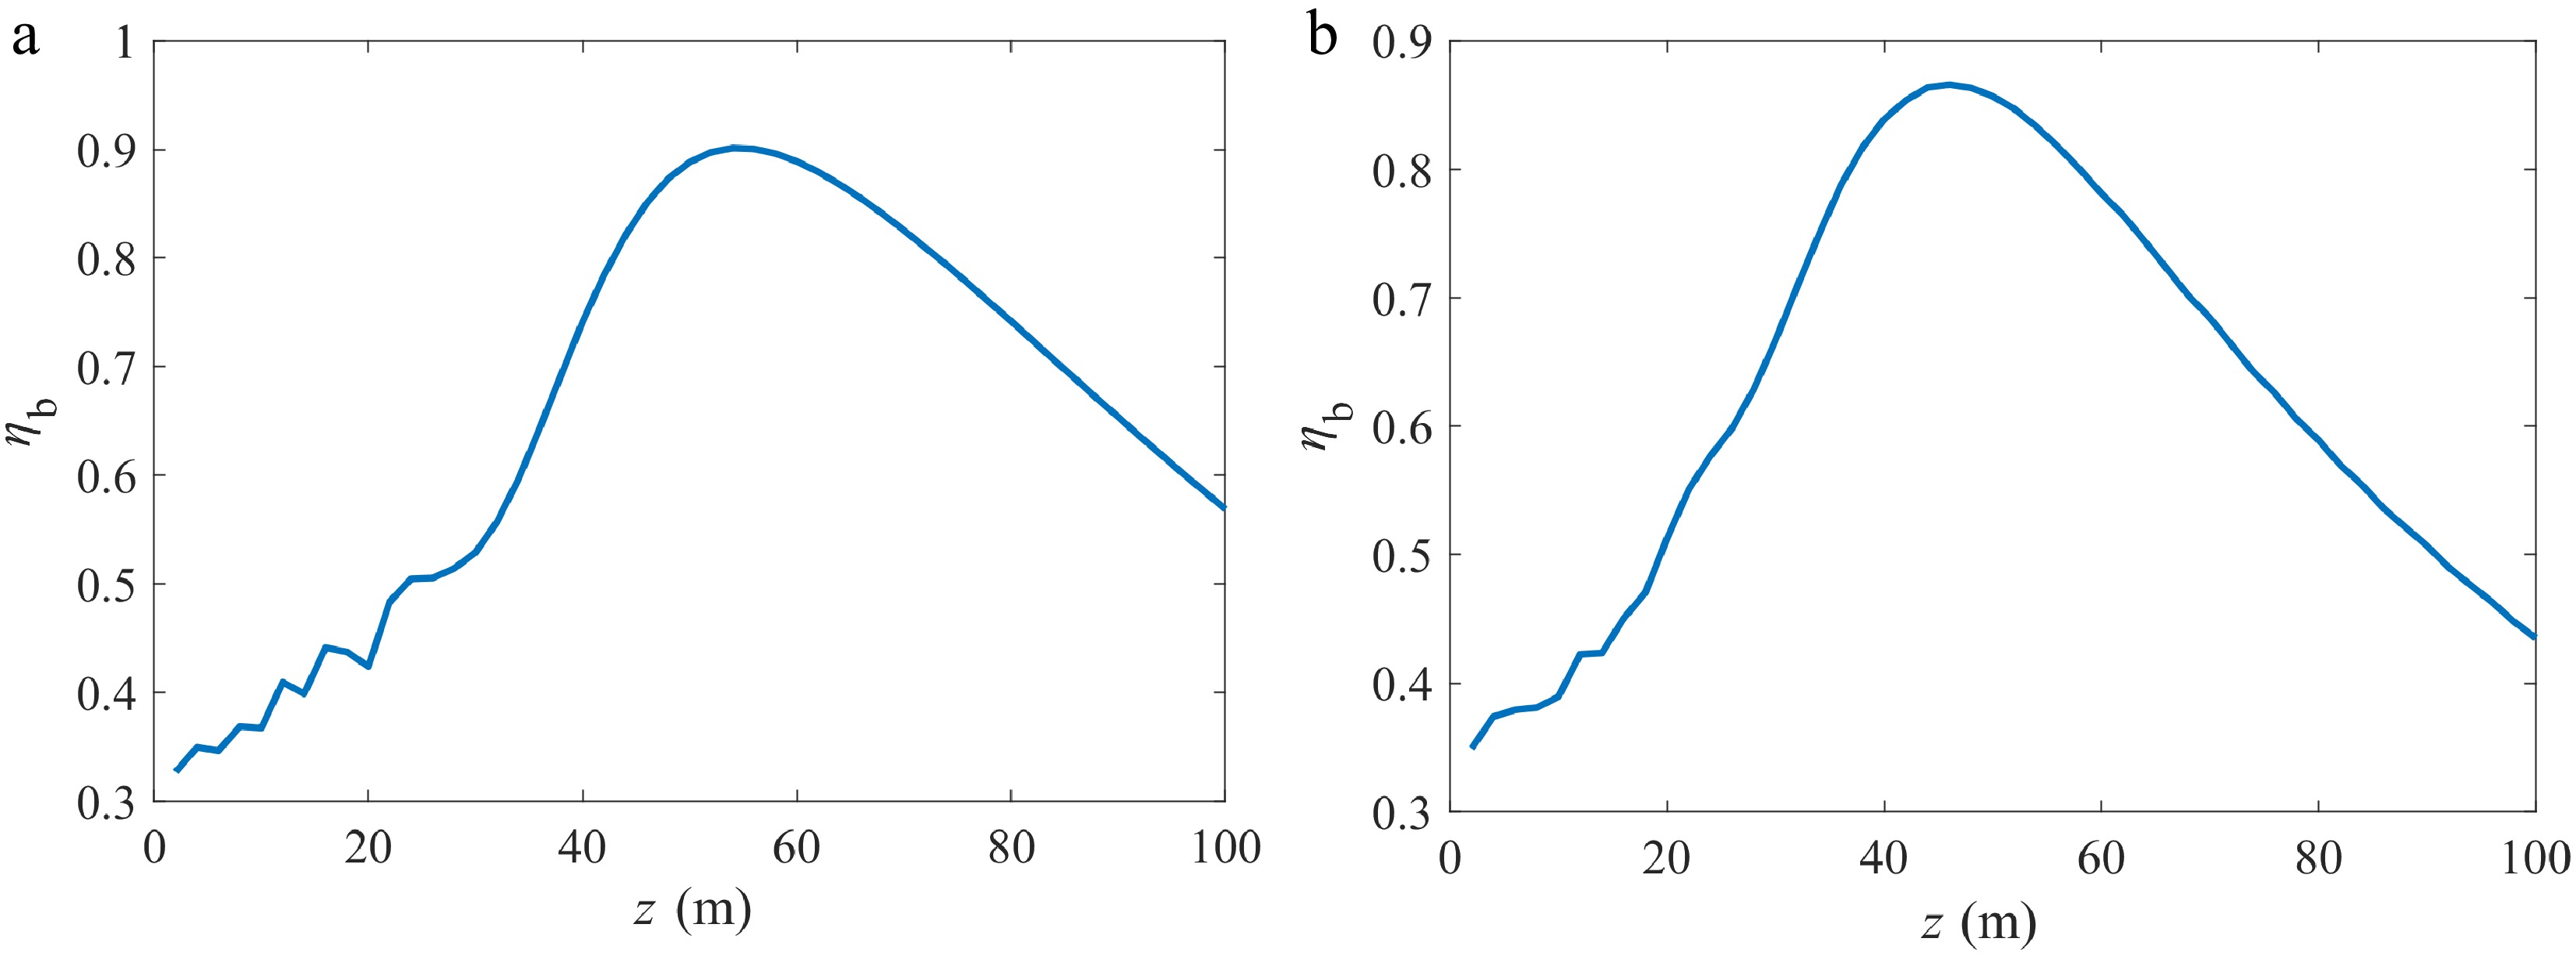
Figure 7.
ηb as a function of z at 37 GHz for offset feed. (a) θ = 1°, and (b) θ = 2.5°.
-
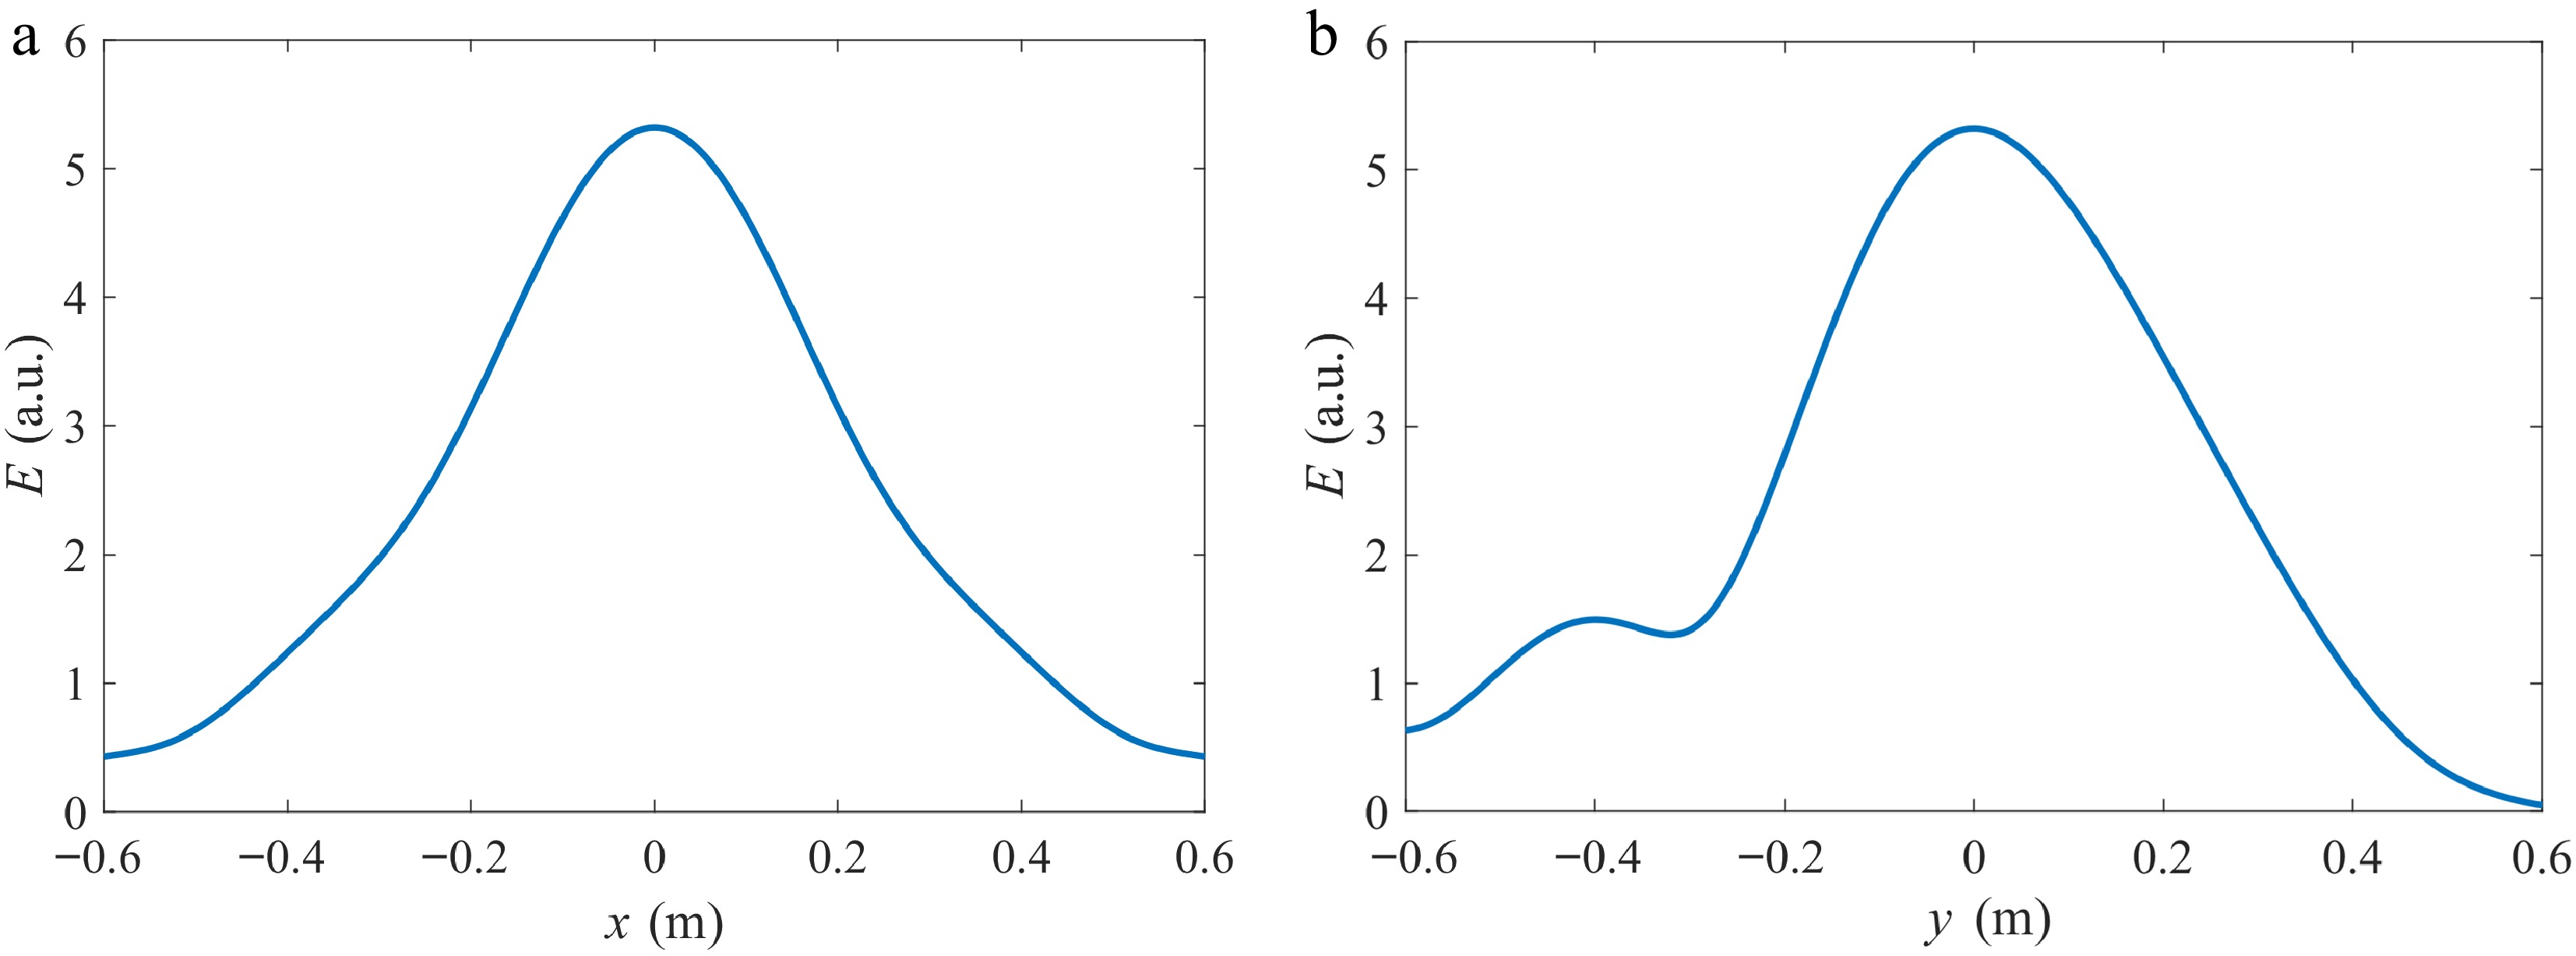
Figure 8.
Electric field distribution along horizontal x-axis and vertical direction in receiving aperture with θ = 1° and z = 50 m. (a) Along the horizontal x-axis, and (b) along the vertical direction.
-
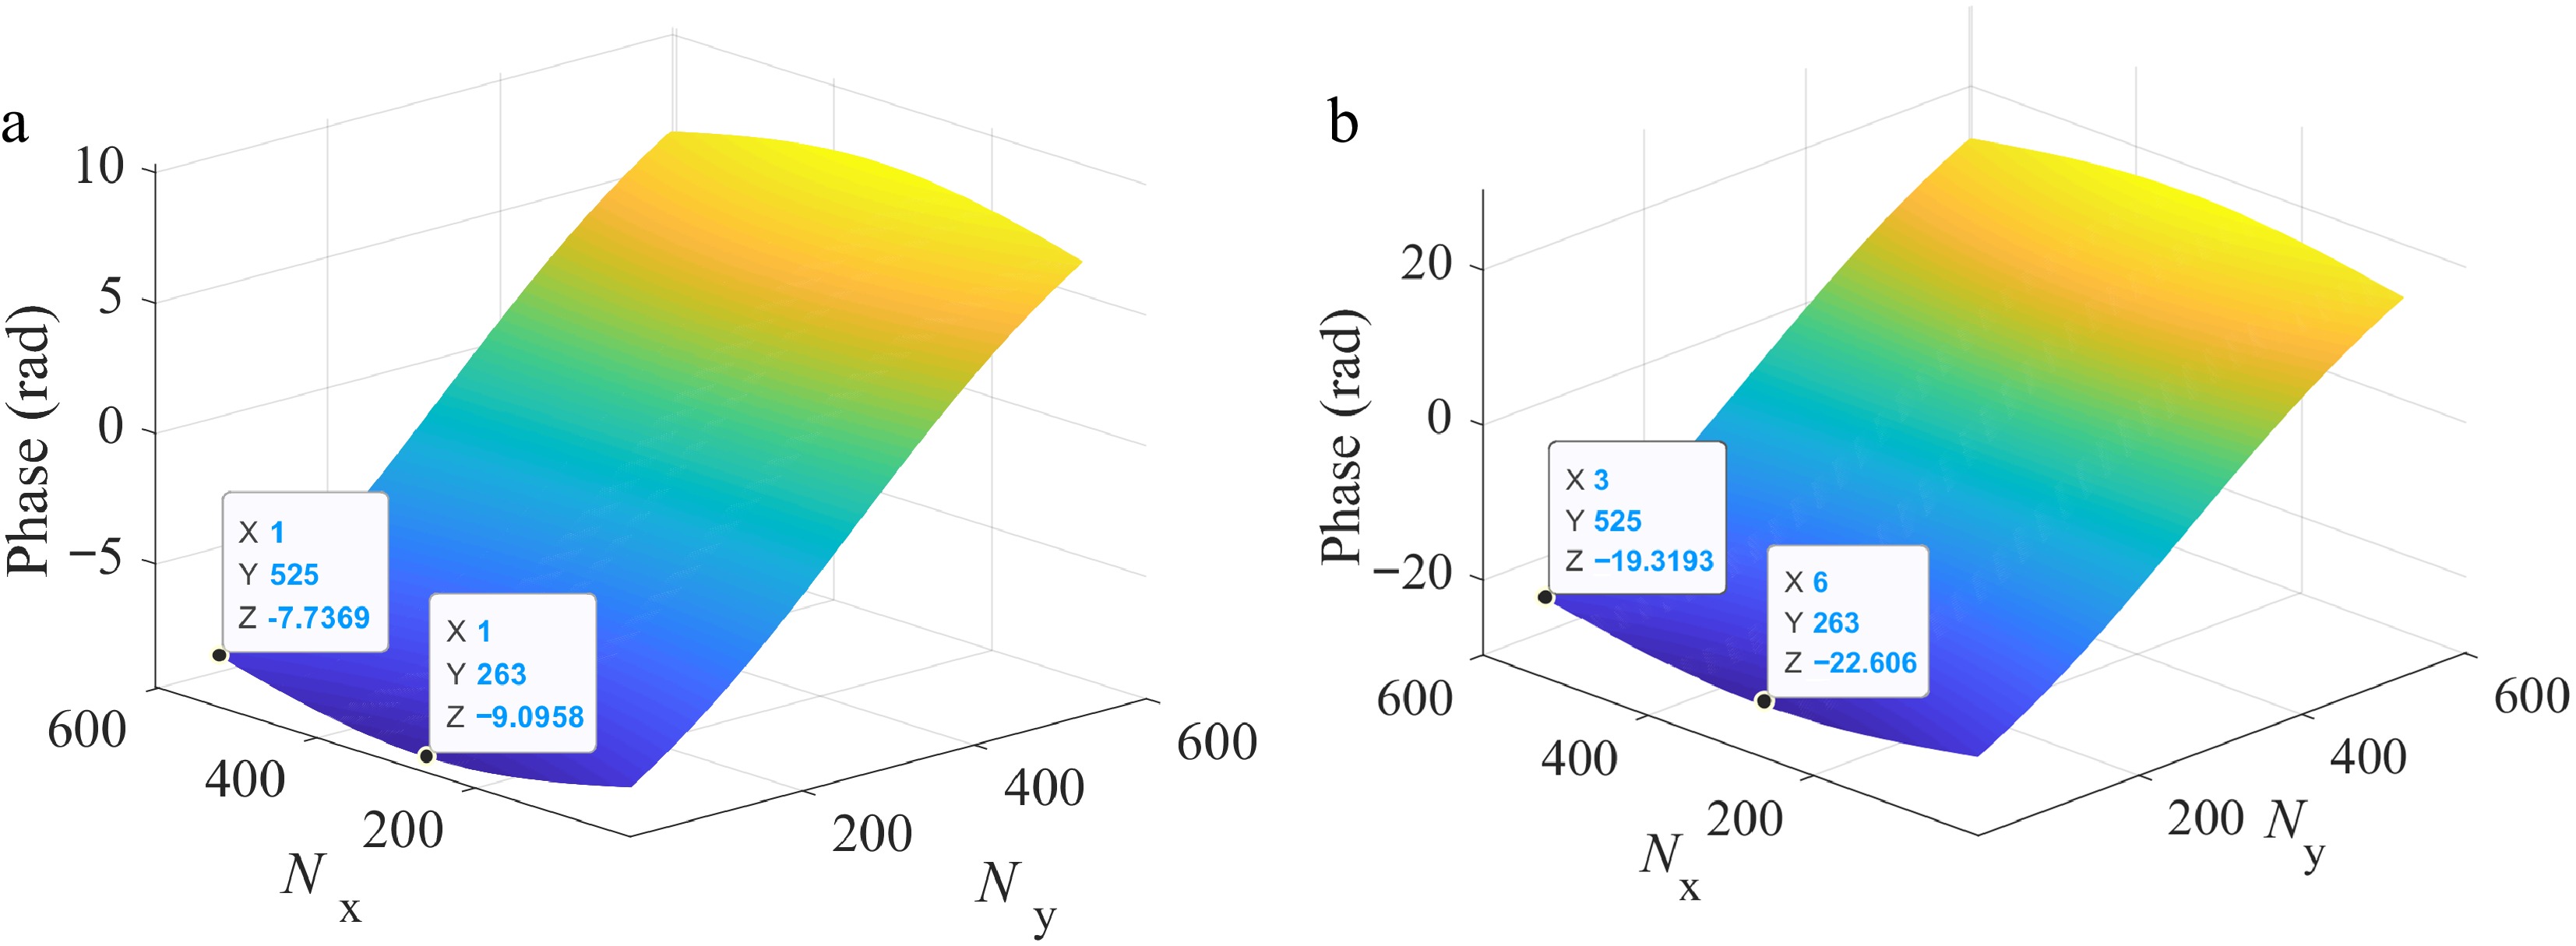
Figure 9.
Deviation of initial phase distribution caused by offset horn (a) θ = 1°, and (b) θ = 2.5°.
-
-
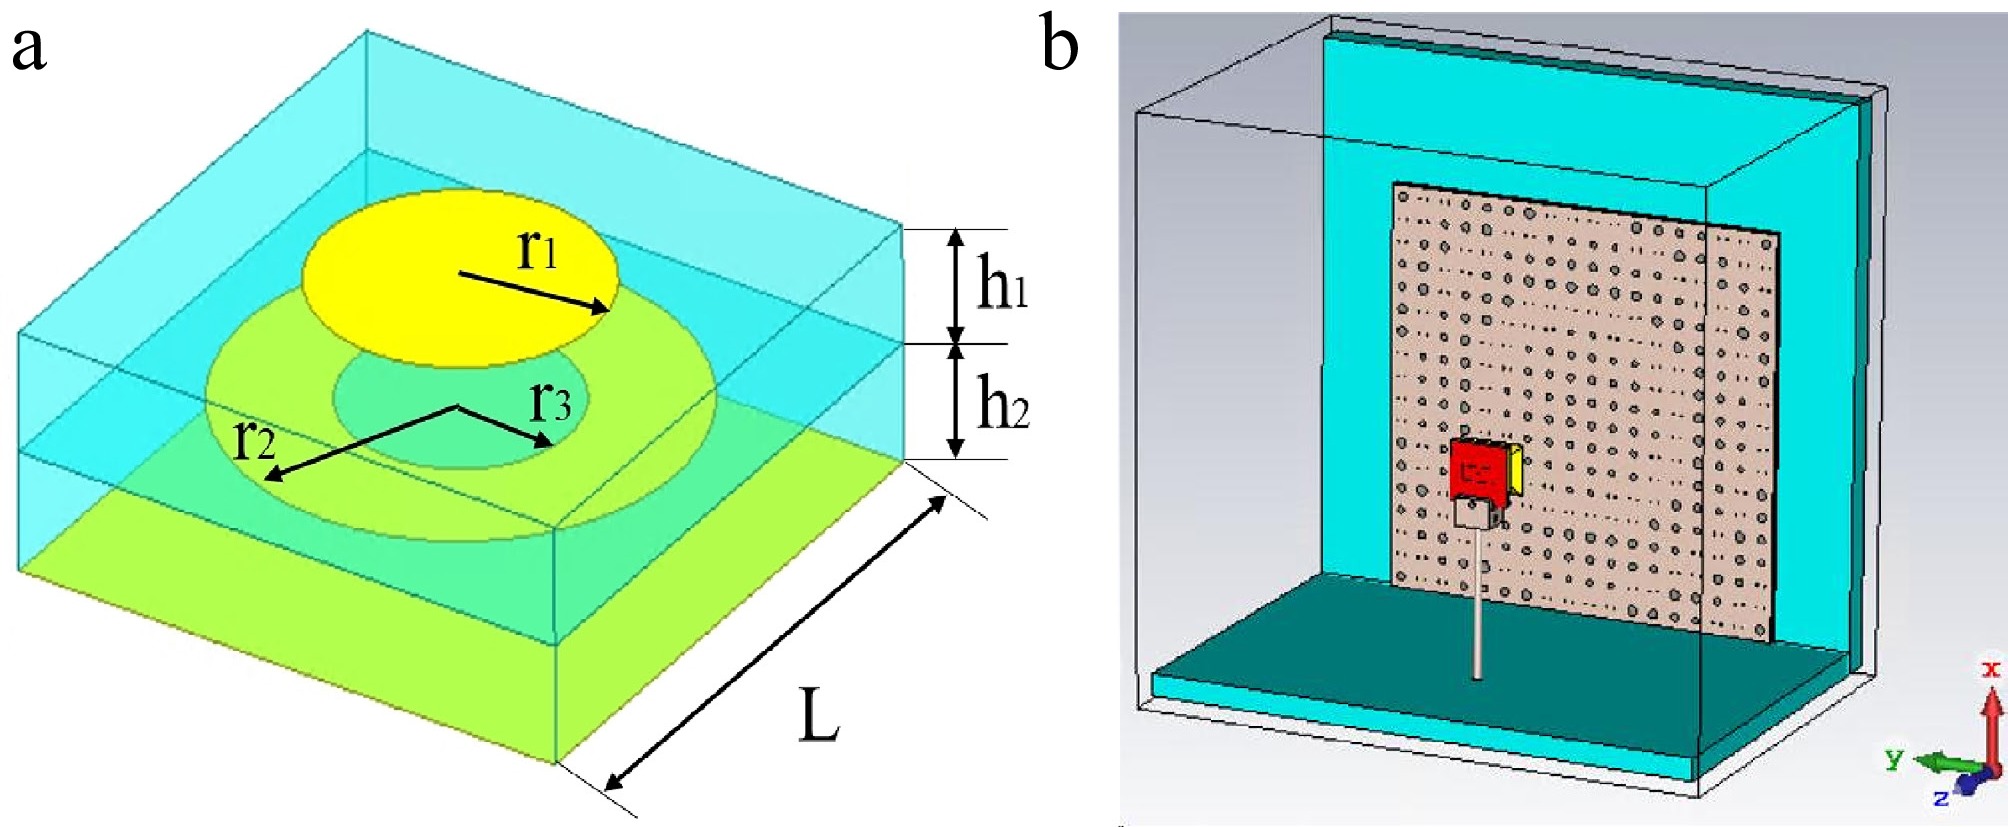
Figure 11.
Simulation models in a CST microwave studio. (a) Geometrical structure of unit-cell, and (b) whole reflect-array antenna.
-
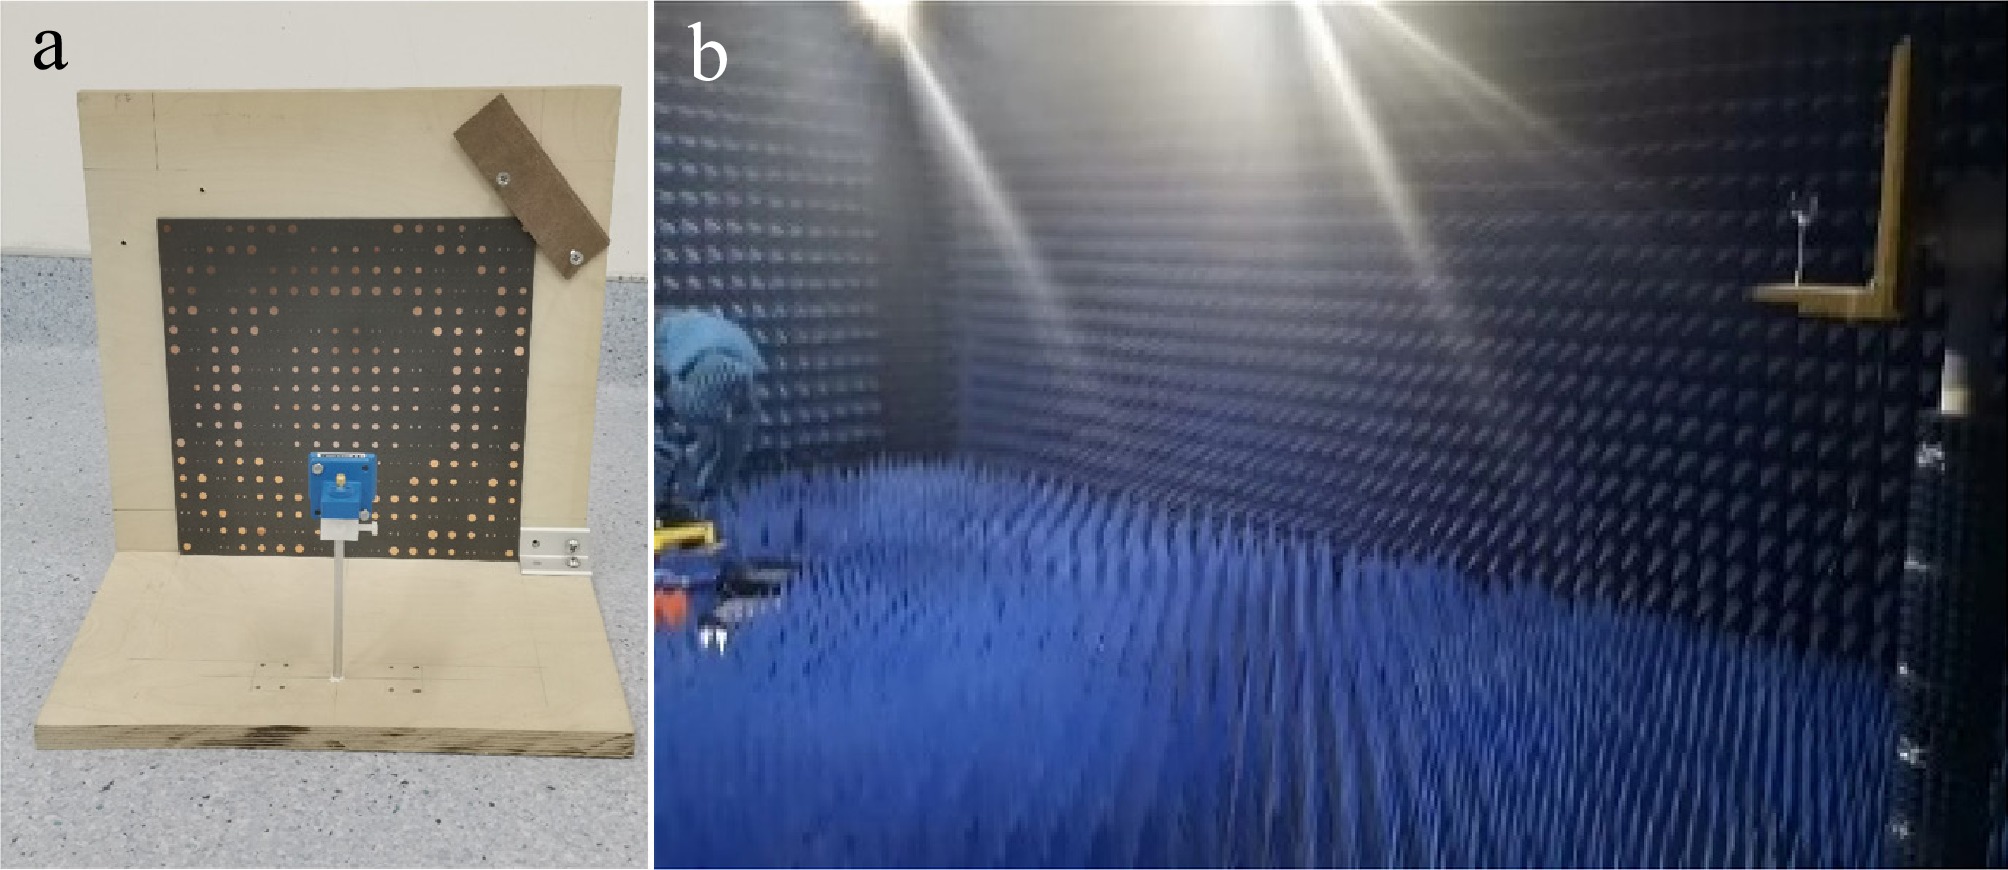
Figure 12.
Reflect-array antenna for experimental demonstration. (a) Practical antenna, and (b) experimental setup.
-
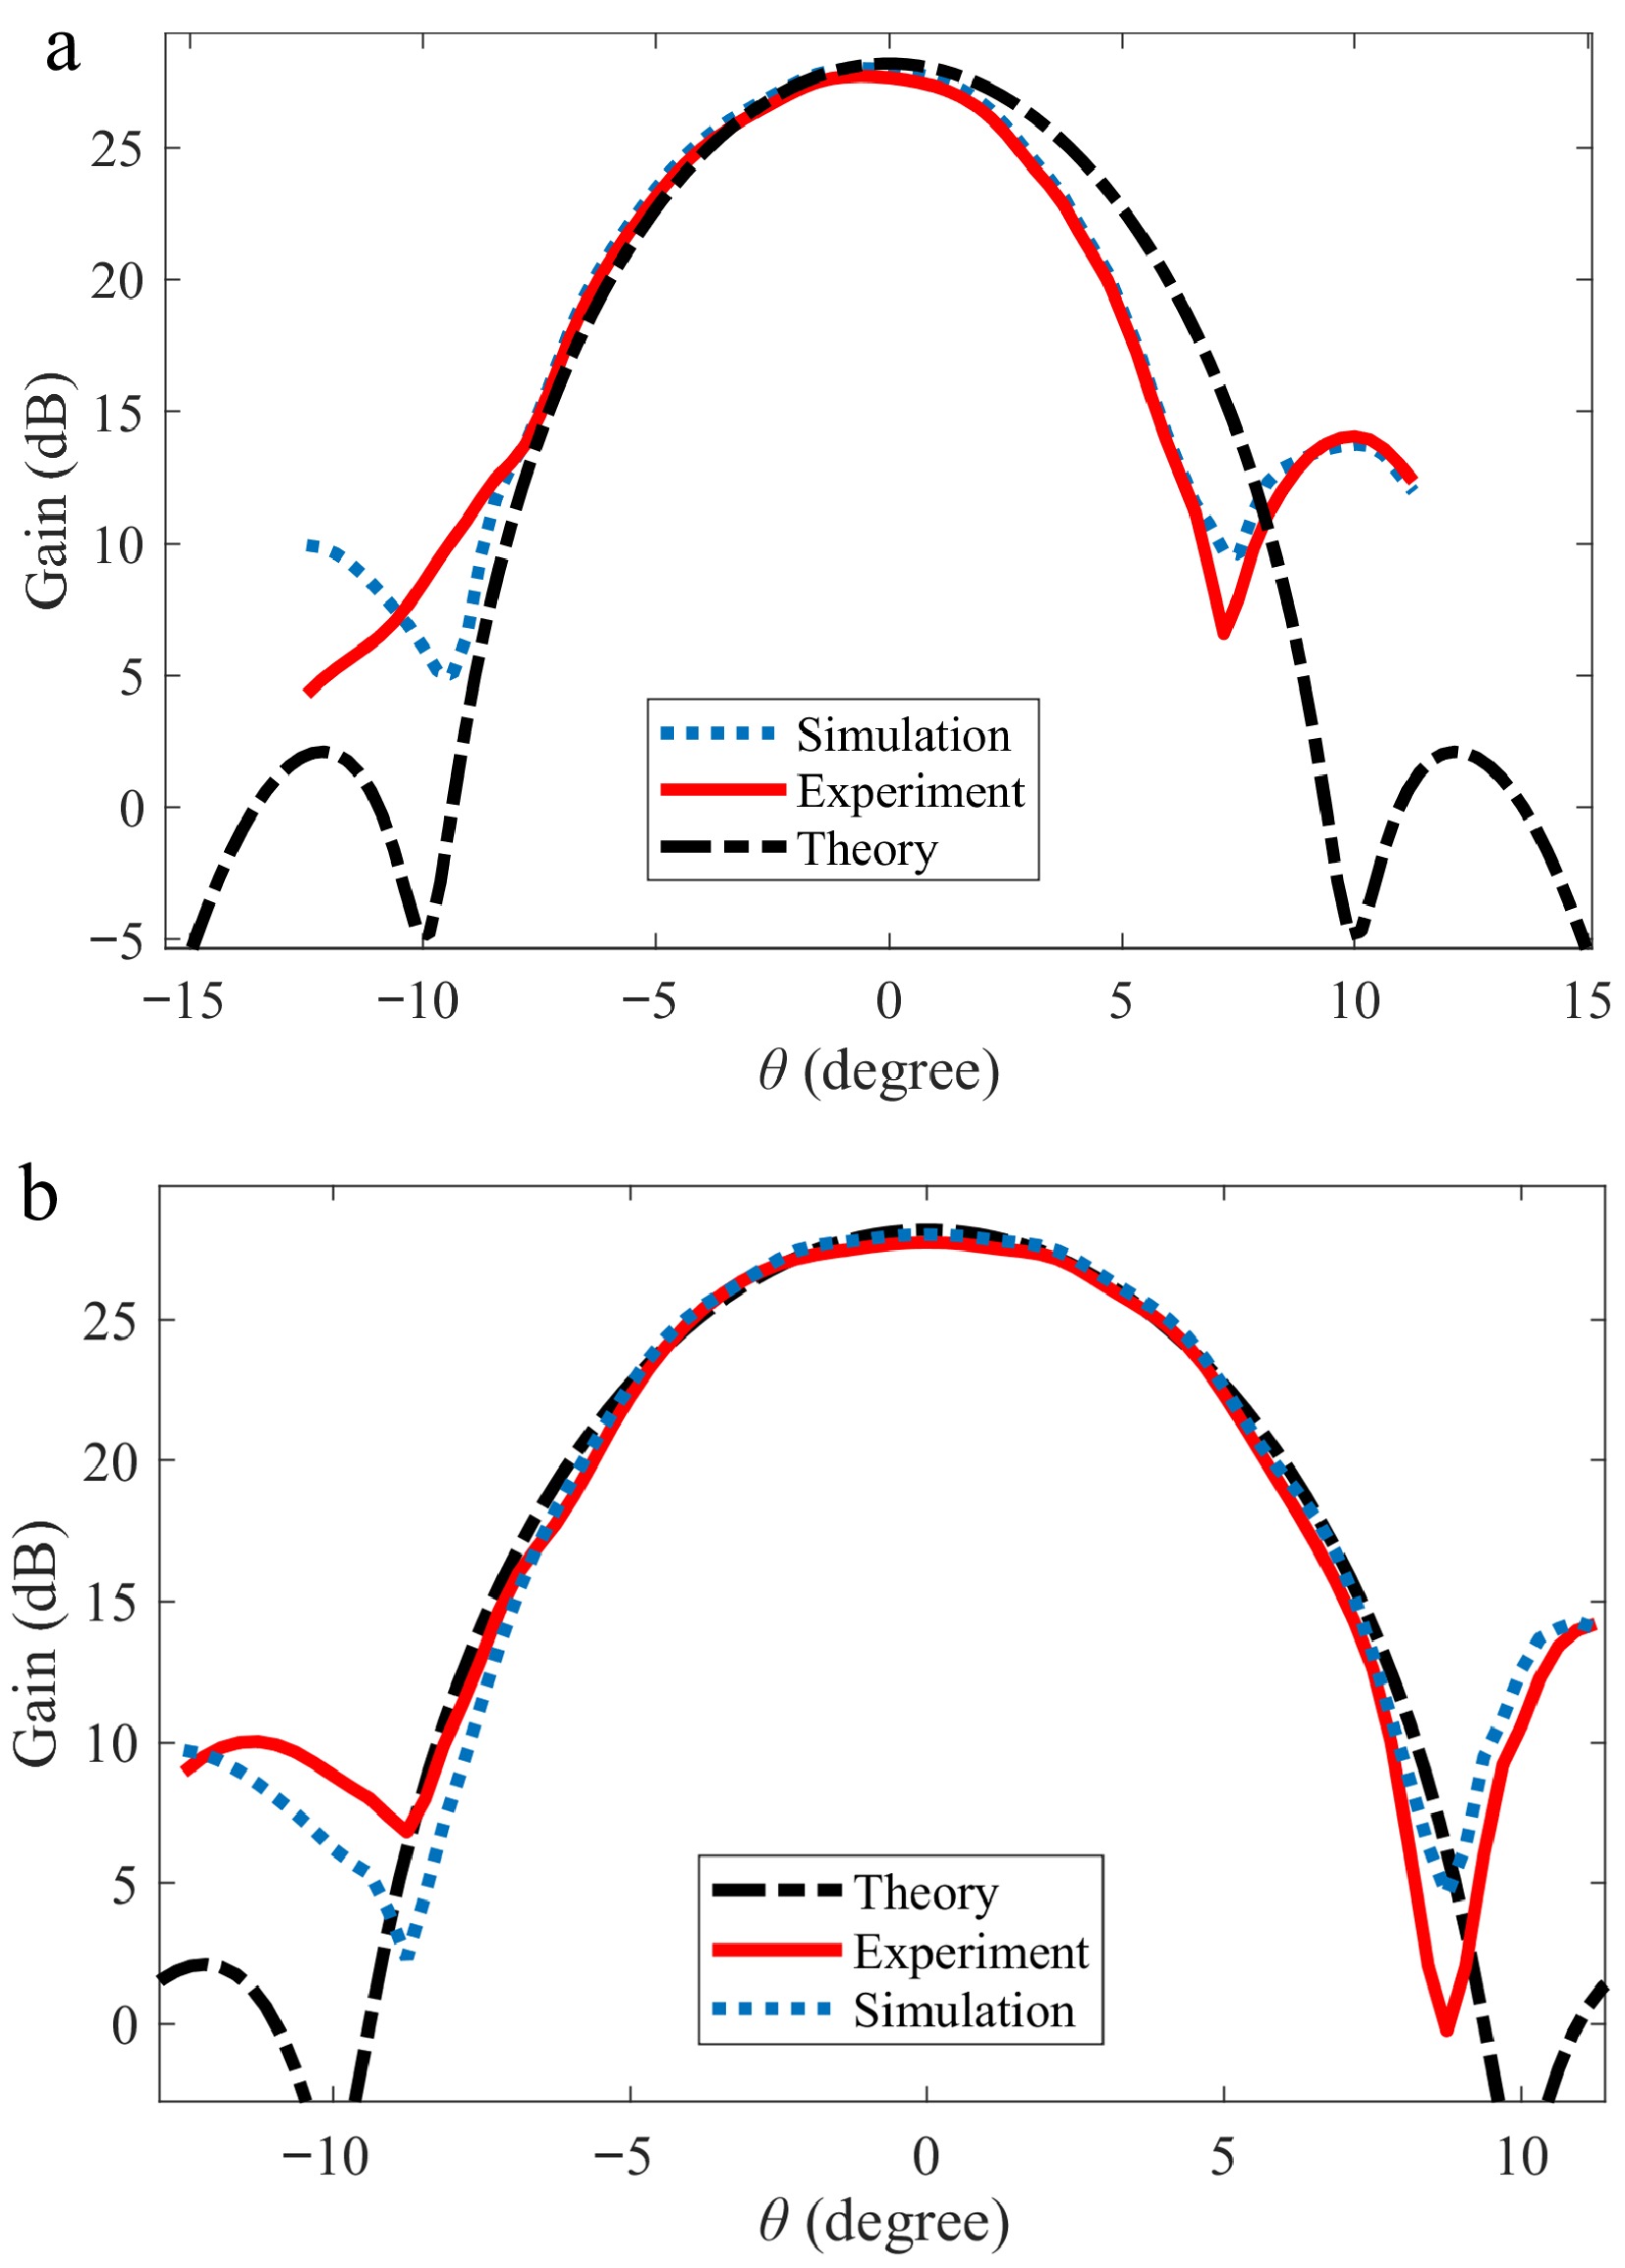
Figure 13.
Radiation patterns of reflect-array antenna. (a) H-plane pattern, and (b) E-plane pattern.
-
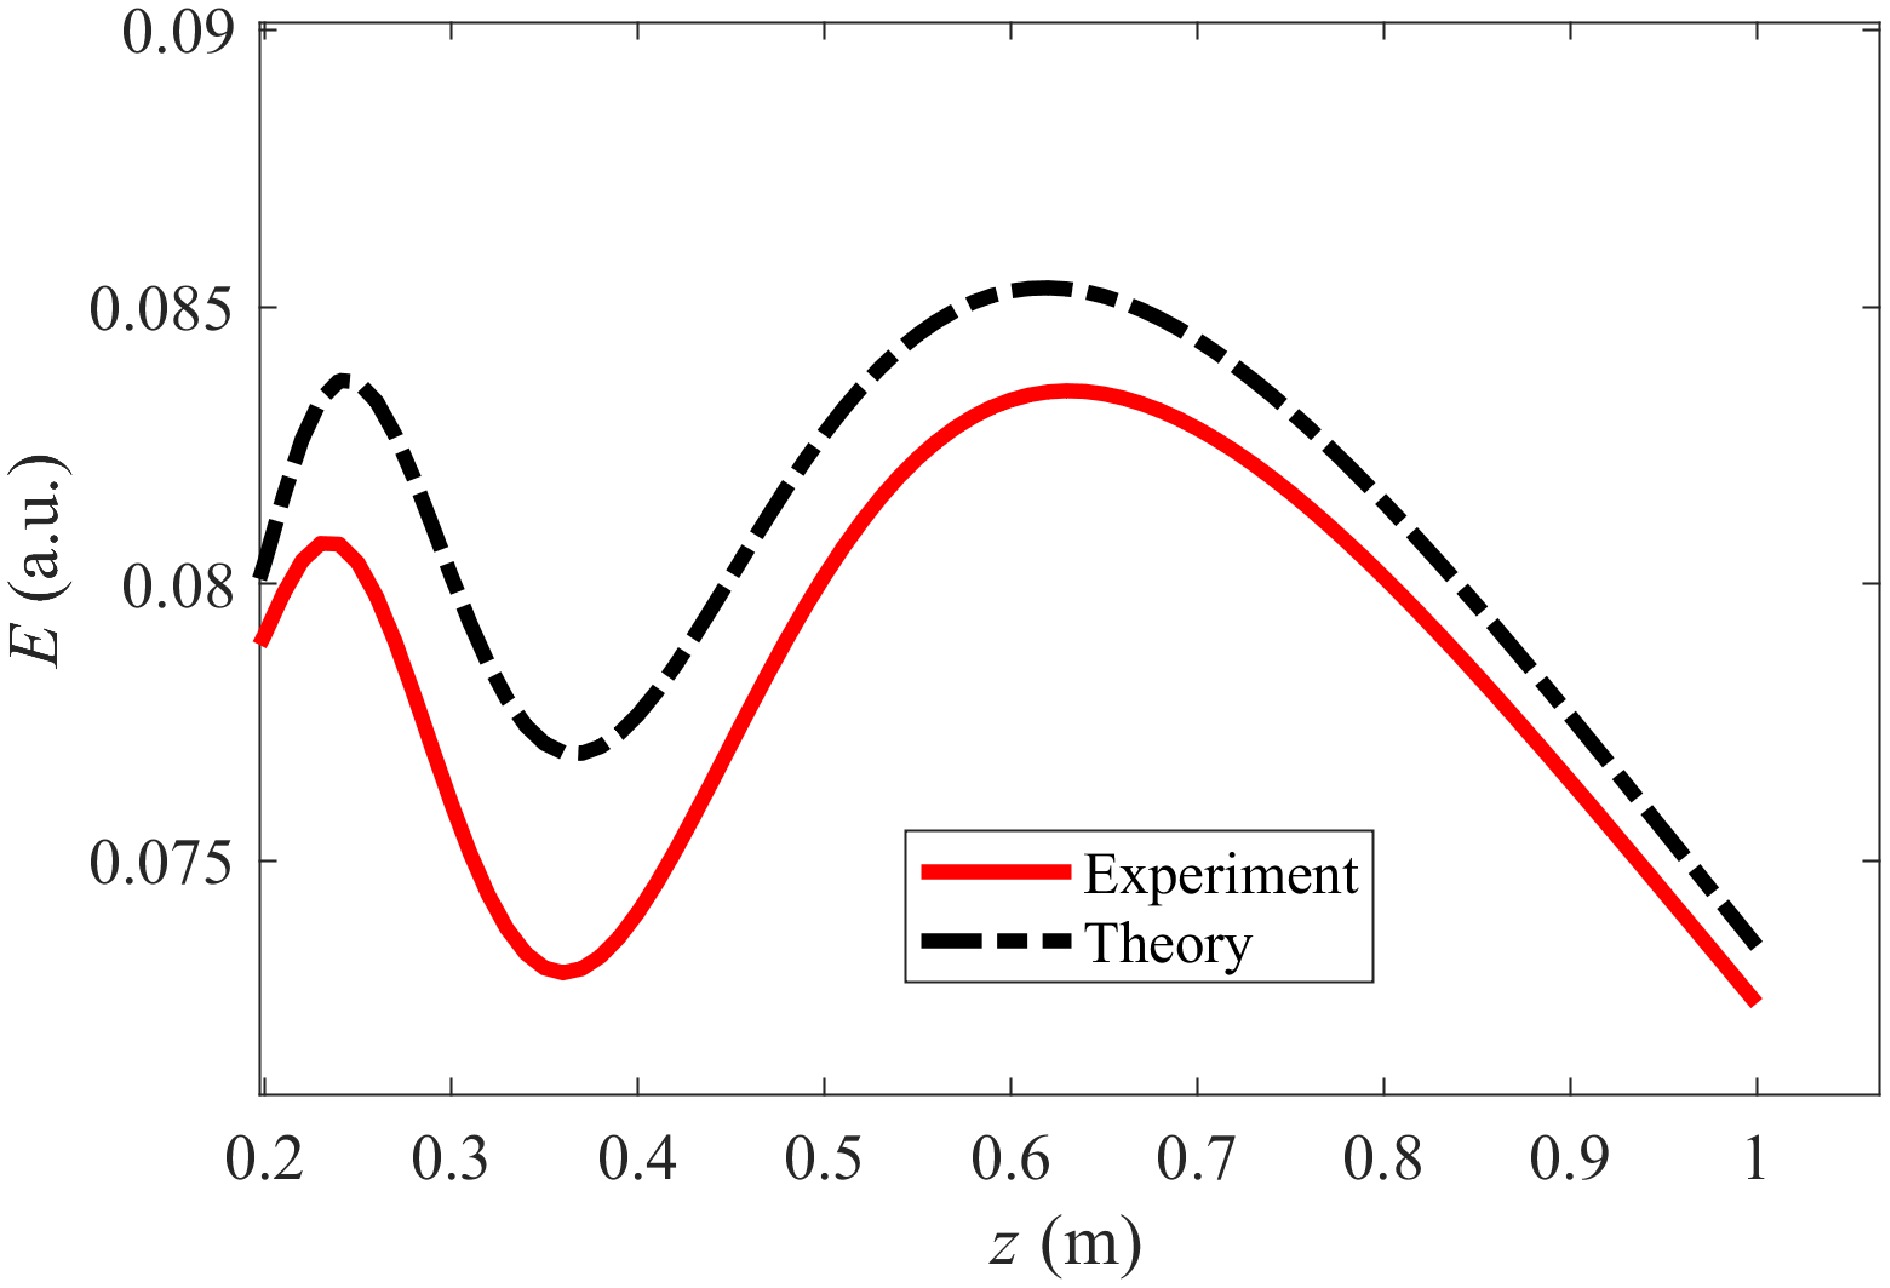
Figure 14.
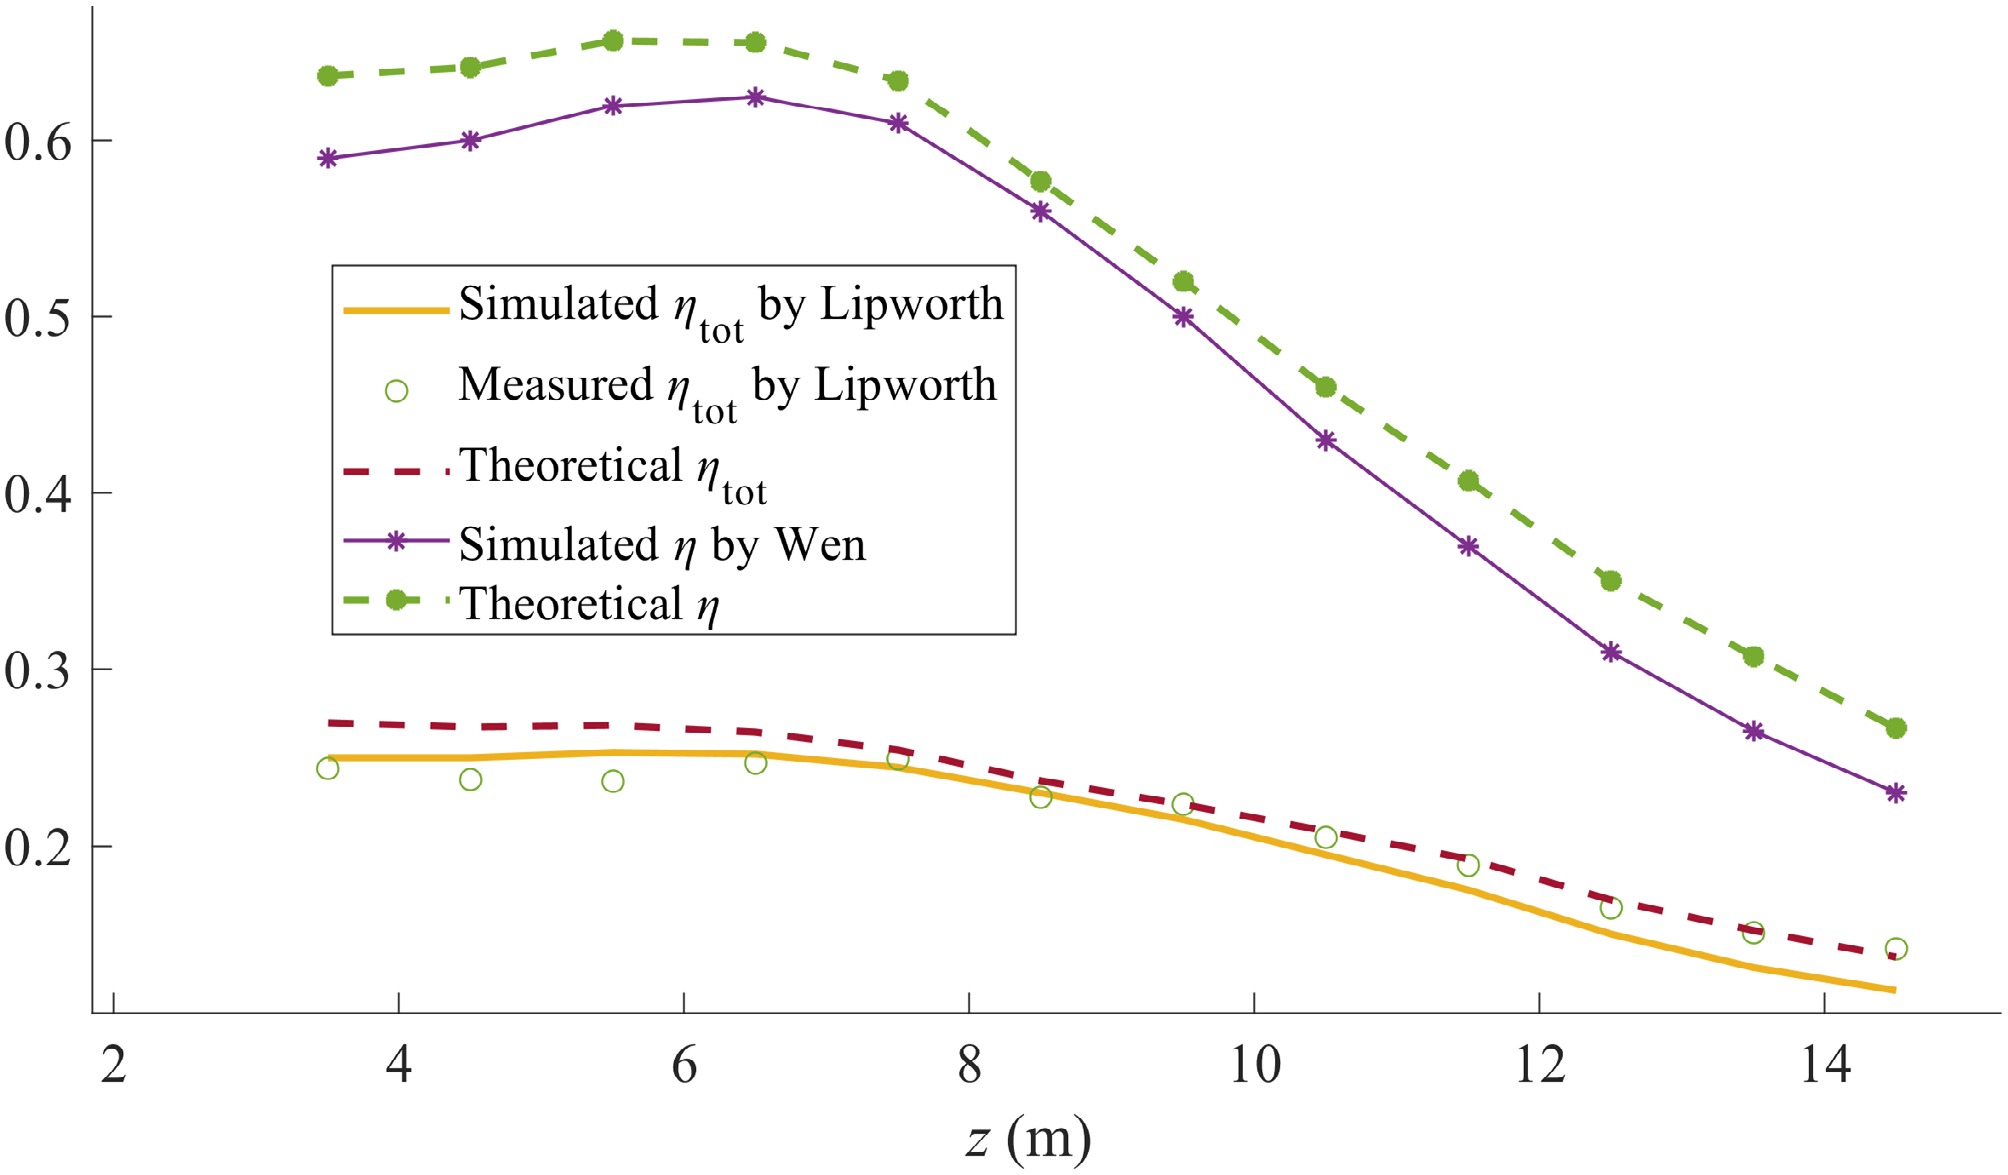
Distributions of magnitude of electric field along the z-axis obtained by experimental and theoretical results.
Figures
(14)
Tables
(0)