











-
With the large-scale implementation and application of ultra-high voltage direct current (UHVDC) transmission in China, the workload of inspection and maintenance for high-voltage transmission towers is increasing daily. UAV-based inspection, which features advantages such as high speed and personnel safety, has rapidly replaced manual operations. The wired charging method is hardly feasible for charging UAVs while they hover at a height of up to 100 m[1]; in contrast, microwave wireless charging can not only avoid this problem but also eliminate the need for battery replacement during the operational process. Compared with laser charging, when the microwave wavelength is 8 and 3.3 mm, it can avoid the absorption by gas molecules in the air[2]. Therefore, microwave wireless transfer is not affected by weather conditions and is more suitable for the application of power transmission in mountainous areas.
Planar reflect-array antennas can be used to realize microwave near-field focusing(NFF) beams[3,4]. The initial amplitude and phase distributions of an NFF beam are theoretically arbitrary; however, on one hand, for the unit cells, the periodic boundary conditions can not be satisfied strictly, and the mutual coupling effect will cause deviations in the phase shift; on the other hand, errors in geometric and dielectric parameters will result in errors in the actual phase shift relative to the designed value.
The improved techniques in recent years have overcome the problems for mm-wave planar array antennas. Numerical calculations and experimental studies have shown that the mutual coupling effect between multi-ring resonant elements is not significant when the cell size is small, and the maximum adjacent phase shift (MAPS) on the aperture is < 100°[5−7]. The theoretical calculations agree well with the simulation and experimental results. In the mm-wave band, high-precision processing technologies such as micro-electro-mechanical systems can maintain the same MAPS and the accuracy of the phase shift[8,9]. The application of mm-wave planar reflect-array antennas has become feasible[9−11].
Previous studies have investigated the power transmission properties of NFF microwave beams. The nearly non-diffraction propagation of such beams was discussed early in 1985[12], which indicates that the beams can maintain the property of non-diffraction when the propagation distance is smaller than L2/λ. Experimental demonstrations have been performed at 5.8 GHz for < 10 m microwave power transmissions[13−15]. An unmanned microaerial vehicle can be charged by a controllable transmitting antenna array at 5.8 GHz, although the distance is only 2 m[15,16]. At 10 GHz, Rodenbeck et al. demonstrated terrestrial power beaming, transmitting 1.6 kW over 1 km[17]. They applied a large-scale parabolic antenna and a rectenna receiver of an area of 4 m2. A similar experiment had been performed in 1975 by Dickinson et al.[18]. They delivered ~30 kW with large-scale transmitting and receiving antennas. In both Fujino, and Shinohara's microwave power transmission (MPT) studies, parabolic antennas were applied to produce microwave beams[19,20]. In the first 10 years after 2000, experimental studies had been hindered by the lack of a cheap and advanced transmitting antenna. Phased-array antennas were applied in retrodirective systems by Hsieh & Rodenbeck[21,22]. In 2009, Ahn et al. used rectangular patches to design a reflect-array antenna, in which the phase-shift range could not cover 360°[23]. Later in 2011, Yu et al. presented the generalized laws of reflection and refraction[24]. This work made the foundation of the state-of-the-art metasurfaces in microwave frequencies[3−5].
As for the design method, Shinohara et al. summarized the beam design, especially for the condition where the receiver area is equal to that of the transmitter[25]. Wen et al. investigated the beam transmission efficiency when the receiver area is much smaller than the transmitting aperture[14]. When the receiving aperture is assumed to be a ring[26], an optimization method is presented by Dr. Duan's team. However, in this work, the receiver area and the transmission distance will be specific, and the operation frequency will increase. Millimeter waves are of concern mainly owing to the development of GaN microwave sources[27]. A kilowatt of output power can be expected from a power combination of such GaN devices.
Under the engineering constraints of the MAPS and the aperture of the UAV-carried receiving antenna, the microwave frequency, and the power transmission properties of the microwave NFF beam are two issues of interest. To avoid high experimental costs and a long simulation time, the theoretical model is suitable to calculate the beam propagation, and obtain acceptable results in good agreement with the experimental results when the MAPS and cell size are chosen to depress the mutual coupling effect[5,7].
-
When the antenna transmits a beam toward the sky, ground reflection and multi-path effects can be neglected, and the beam propagation can be simplified to a free-space propagation. Figure 1 illustrates the geometric relationship of the array and the receiving aperture. r0 represents the focal length. The initial phase of each element is denoted as φmn, and the coordinates of the center of each element as (xmn, ymn, 0). The initial phase with a focal length of r0 should satisfy the following relationship:
$ {\varphi }_{mn}=\dfrac{2\pi }{\lambda }\left(\sqrt{x_{m}^{2} \,+\, y_{n}^{2}\, +\, r_{0}^{2}} \,-\, {r}_{0}\right) . $ (1) The phase distribution described by Eq. (1) is circularly symmetric with respect to the array center.
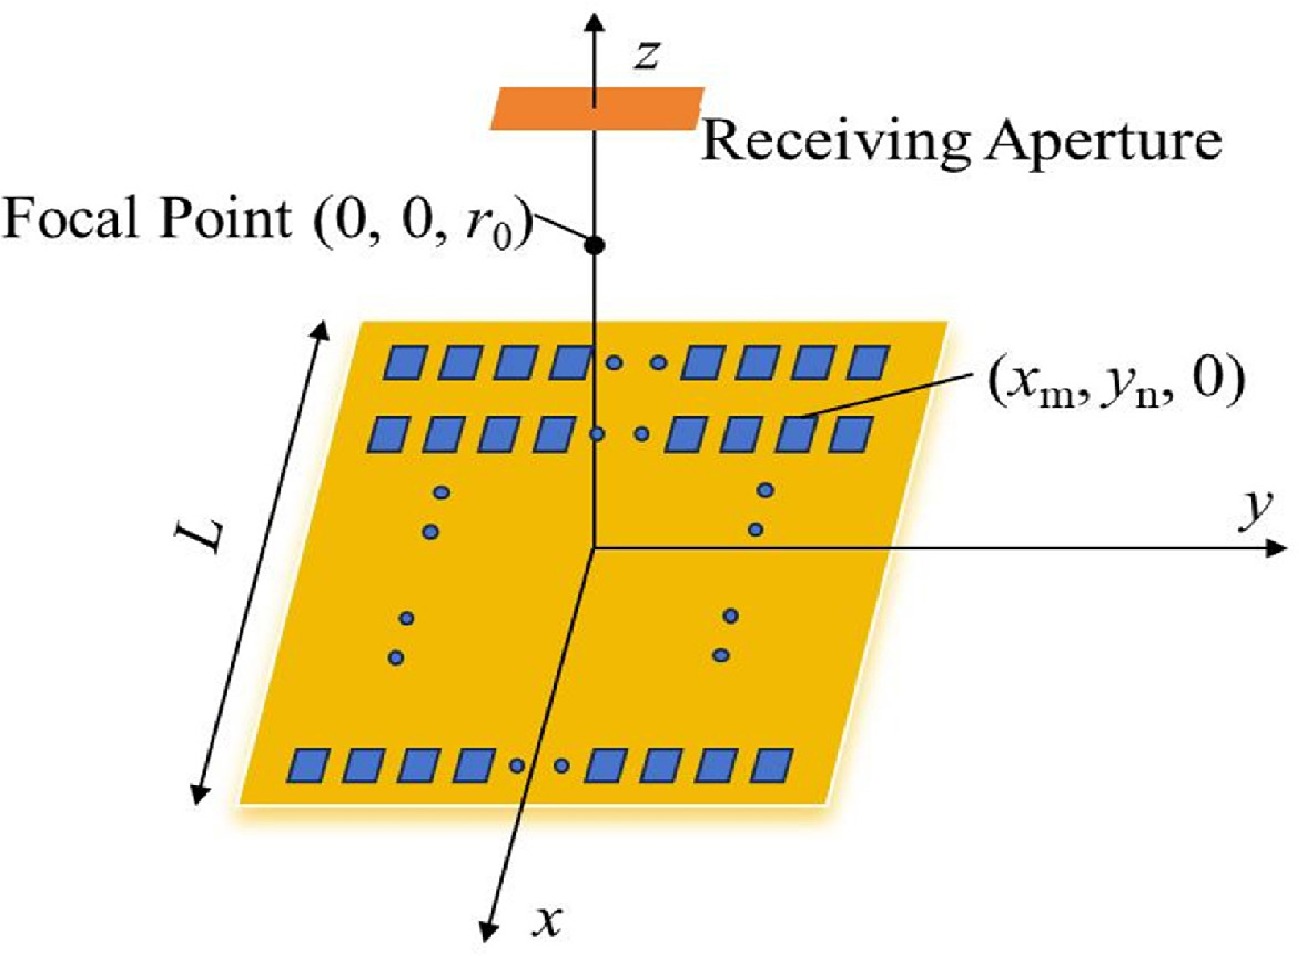
Figure 1.
Schematic diagram of planar array antenna radiation.
The model used to calculate the beam propagation radiated by reflect-array antennas had been proposed by Hansen[12], however, the normalization method is modified in this work. The model used is as follows:
$ E\left(P\right)=\sum\limits_{m=1}^{N}\sum\limits_{n=1}^{N}\dfrac{a{A}_{mn}}{2\pi {R}_{mn}}{e}^{j{{\varphi }_{mn}}}{e}^{-jk{{R}_{mn}}} $ (2a) $ {P}_{\text{A}}=\sum\int\limits_{\Omega }\left(\left| {E}^{2}\right| /{\zeta }_{0}\right)\text{d}S $ (2b) $ {\mathrm{and}} \;{P}_{\text{b}}=\sum\int\limits_{\Omega '}\left(\left| E{'}^{2}\right| /{\zeta }_{0}\right)\text{d}S' $ (2c) where, Rmn is the distance from the element at (xmn, ymn, 0) to any point denoted as P. Amn and φmn represent the amplitude and phase for the same element, respectively. k is the free-space propagation constant. For calculating the total power PA, the selected surface Ω is a distant hemisphere, whereas for calculating the power reaching the receiving aperture Pb, the surface Ω' is a planar region. The beam efficiency, denoted as ηb, can be calculated as the ratio between Pb and PA.
To ensure that the electric field calculation results are not affected by the discretization for the free space and the initial aperture, the item of aAmn/2πRmn is adopted in Eq. (2a), where a is the side length of the element and the spatial discretization step. This item can be physically interpreted as the electric potential difference between the two ends of the electric field lines, which remains constant. For example, the potential difference is aAmn at the initial aperture, and the cell size a corresponds to the initial length of the electric field lines, then the length increases to 2πRmn after reaching the point P, so the field strength at P can be written as the constant potential difference divided by the increased length of the filed line, i.e., aAmn/2πRmn.
The model has been validated in previous studies[13,14]. The experimental, simulated, and analytical results for beam efficiency showed good consistency when the MAPS does not exceed 100°. In this work, the cell size and the MAPS are chosen to be the same as those in the study by Wen et al.[14], so that the calculation results by the model are valid.
In terms of computational efficiency, with an i7-1365HX processor, it takes several tens of minutes to calculate the beam propagation for a transmission distance of 100 m. In contrast, a full electromagnetic 3D simulation such as CST Microwave Studio requires a multi-core high-performance server, memories on the order of 1 TB, and several weeks to complete the calculation.
It is necessary to specify the initial amplitude and phase distributions on the antenna aperture before any calculations. However, the structure and arrangement of unit cells will not be involved. By constraining the cell size and MAPS, the feasibility of design and fabrication of the antenna is ensured[5−7,13,14].
The method for generating the initial amplitude distribution still relies on a feed horn which illuminates the antenna aperture. Here, it is specified that the feed horn is aligned normally in front of the initial aperture, and the scattering effect of the horn is neglected, as the size of the feed horn is much smaller than that of the aperture for a 100-m power transmission. As a result, the amplitude distribution on the aperture is circularly symmetric with respect to the array center and adopts a cos2-form distribution, which can be obtained using a horn antenna. The height of it is denoted as h, and h/L is selected to be 0.64[14]. By carefully designing the gain of the horn, the amplitude distribution on the aperture can be analytically expressed as follows[14]:
$ {A}_{\text{mn}}={\cos }^{2}\left(\dfrac{\pi }{2}\sqrt{x_{m}^{2}+y_{n}^{2}}/\dfrac{\sqrt{2}L}{2}\right) . $ (3) The area of the receiving aperture is also specified as a circle with a radius of 0.4 m. The beam propagates directly towards the receiving aperture, as shown in Fig. 1. The size of the receiving aperture is determined by considering the size and load-carrying capacity of UAVs.
By substituting the amplitude distribution in Eq. (3) and the phase distribution in Eq. (1) into the theoretical model, the field distribution in free space and the beam efficiency can be calculated. Considering the influence of microwave atmospheric windows, three frequencies are selected for discussion, namely 10, 37, and 90 GHz. It is required that when the transmission distance is 100 m, the electric field reaches its maximum value along the z-axis, for ease of comparison.
The calculation results are shown in Fig. 2. Figure 2a shows the focal length r0 as a function of L/λ, while Fig. 2b illustrates ηb as a function of L/λ. It can be observed from Fig. 2 that at 10 GHz, an L of 6.6 m is required to achieve a beam efficiency of 0.8, which is too large to realize in UAV-charging applications.
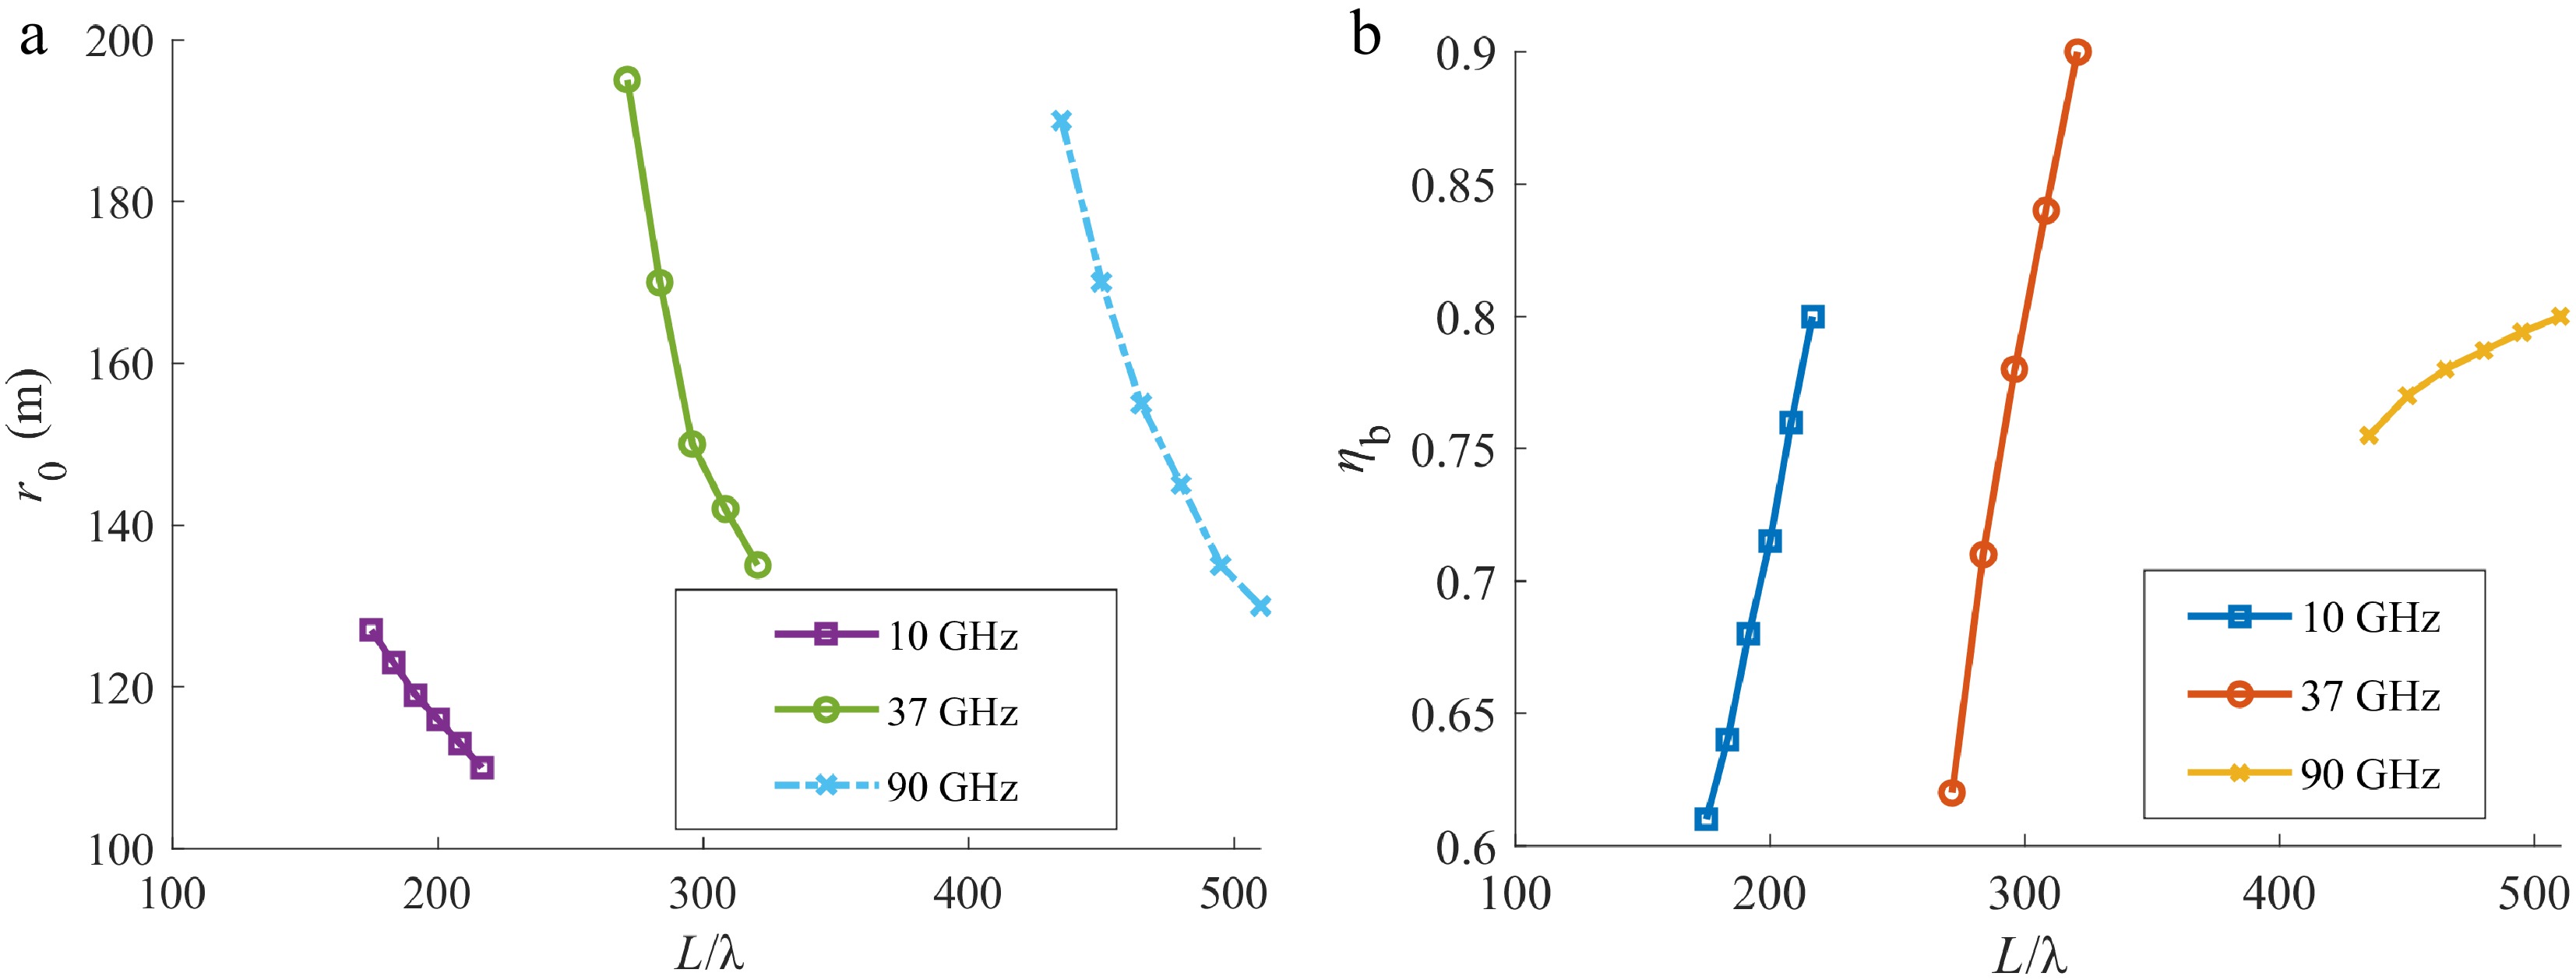
Figure 2.
r0 and ηb as a function of L/λ at 10, 37, and 90 GHz when maximum electric fields occur on the z-axis at a distance of 100 m. (a) r0 as a function of L/λ and (b) ηb as a function of L/λ.
Considering the number of unit cells in the array, we assume the cell size is 1/3 of the wavelength, and the total number of elements is N2, where N denotes the number of cells along one side of the array. Then, at frequencies of 10, 37, and 90 GHz, the number of unit cells required to achieve a beam efficiency of 0.8 is 4.2 × 10⁵, 3.96 × 10⁵, and 9 × 10⁵, respectively. Previous studies have shown that the transmission distance is proportional to N2λ[6,13,14]. When the beam efficiency reaches 0.8, the values of N2λ at 10, 37, and 90 GHz are 9 × 10⁵, 3.2 × 10⁵, and 3 × 10⁵, respectively. This indicates that the transmission capability of the focused beam at 10 GHz is greatly wasted, and the reason lies in the small area of the receiving aperture for UAVs, with a radius of 0.4 m. Notably, the cell number required at 90 GHz is significantly larger. This is also caused by the mismatch between the spot size of the beam and the receiving aperture.
-
The amount of the transmitted power can be formulated by:
$ \mathit{P}_{\mathrm{t}}\mathrm{\ =}\mathit{\ P}_{\mathrm{0}}\mathit{\eta}_{\mathrm{1}}\mathit{\eta}_{\mathrm{b}}\mathit{\eta}_{\mathrm{2}}\mathrm{,} $ where, Pt and P0 are the transmitted power and radiated power from the horn, respectively; η1 is the horn irradiation efficiency, which measures the efficiency of energy coupling from the horn to the reflect-array aperture; ηb is the beam efficiency, which quantifies the fraction of radiated power arriving at the rectenna (critical for long-distance MPT); and η2 is the AC-to-DC efficiency of the rectenna. Typically, η1 can reach ~0.7[13,14]. Assuming a rectenna efficiency of 0.8, the beam efficiency should be ~0.8 to enable the UAVs to accept more than 200 W from a 500-W microwave source. Thus, the following optimization will aim for ηb ≥ 0.8.
There are five main influential factors for beam properties: the operating frequency, the transmitting aperture, the focal length r0, the distance, and the receiving aperture. In this work, the distance ranges from 30 to 100 m, and the receiving aperture has a radius of 0.4 m. The operational frequency is chosen from three specific frequencies, 10, 37, and 90 GHz, corresponding to the center frequencies of the low-attenuation propagation windows in air. However, the choice is not single. The operation frequency can be adjusted in the propagation window. It should be mentioned that the initial amplitude distribution has been given in Eq. (3).
The optimization method has three processes. First, the minimum transmitting aperture is found so that the beam efficiency at 100 m reaches 80% when the focal length is infinite, which means that the initial phases on the aperture are the same; Second, the focal length can be adjusted for the maximum average beam efficiency in the range 30 to 100 m, and the transmitting aperture can be slightly increased if the average beam efficiency is less than 80%; Third, comparisons are made between the results for different frequencies and the overall relationship among aperture size, focal length, and required receiving aperture size at the chosen frequency is illustrated.
Power transmission properties are calculated with optimized focal distances at 37 and 90 GHz, which can cover the effective transmission distances from 30 to 100 m, as shown in Fig. 3.
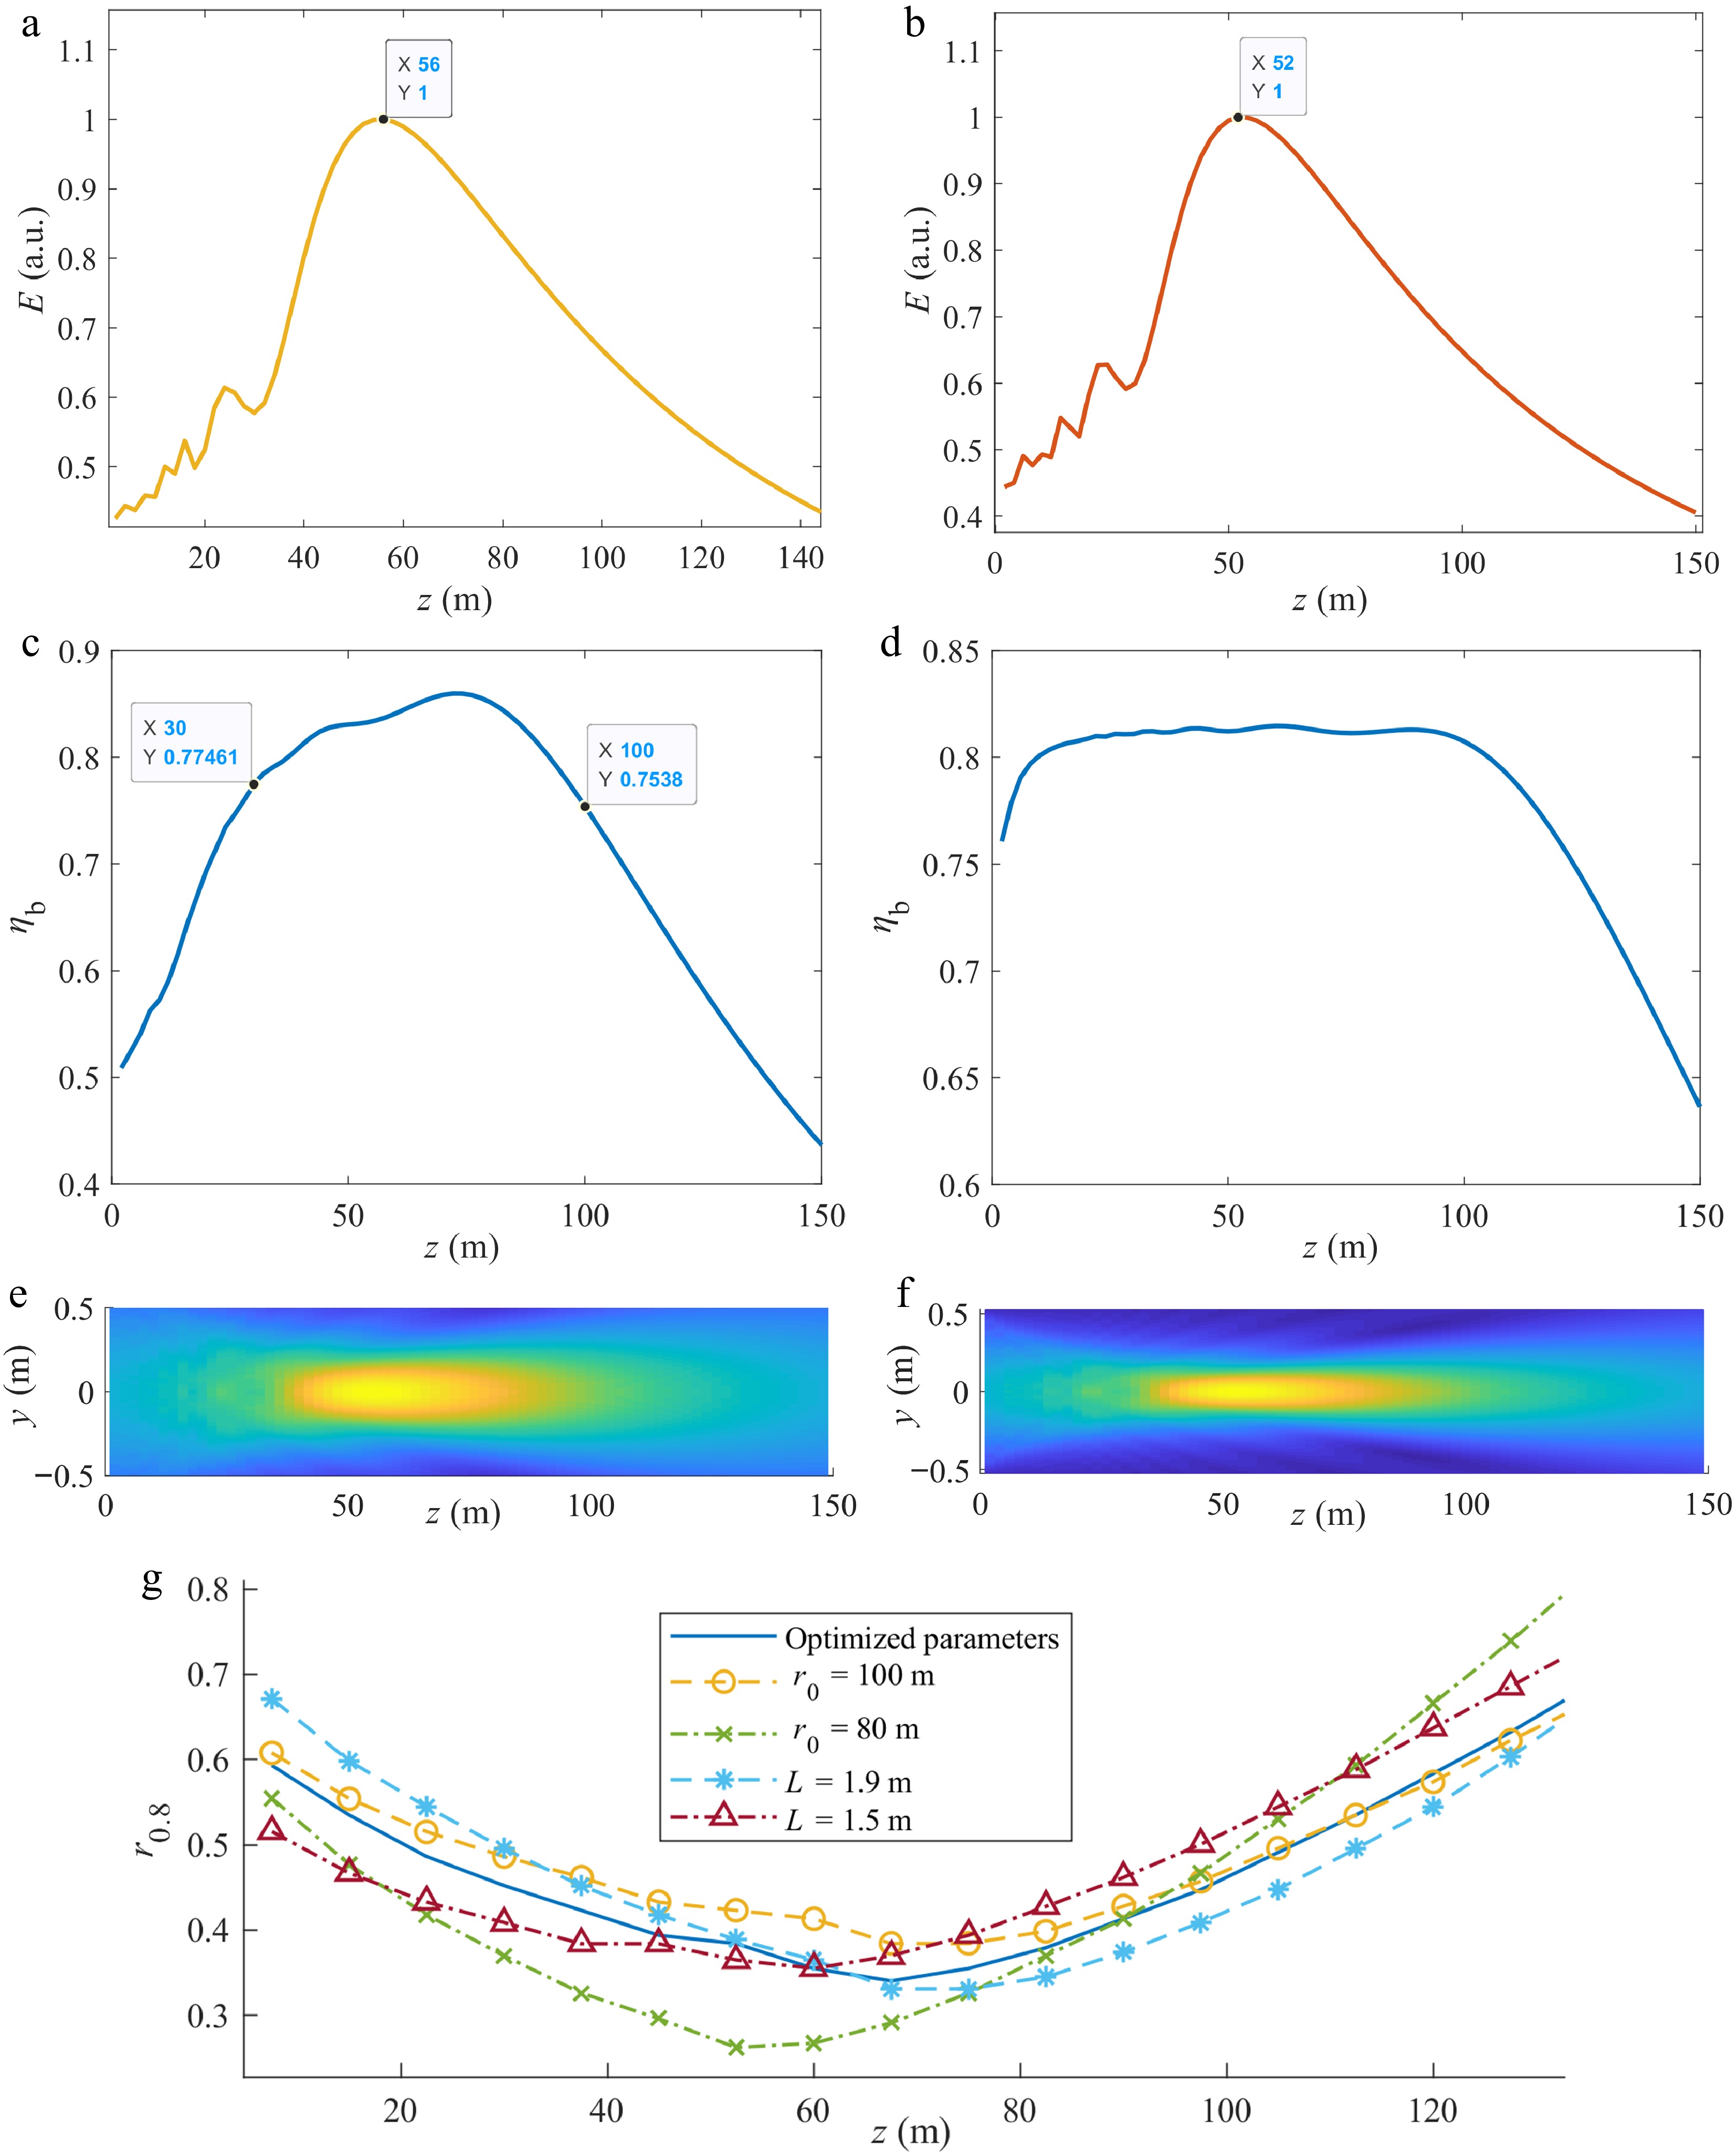
Figure 3.
Power transmission properties with optimized focal distances at 37 and 90 GHz. (a) Electric field along the z-axis at 37 GHz, (b) electric field along z-axis at 90 GHz, (c) ηb vs z at 37 GHz, (d) ηb vs z at 90 GHz, (e) field distribution on yoz plane at 37 GHz, (f) field distribution on yoz plane at 90 GHz, and (g) r0.8 vs z at 37 GHz under different beam parameters.
Figure 3 shows the beam propagation properties at 37 and 90 GHz. The beam parameters for Fig. 3a, c, e, and g are optimized and chosen as follows: frequency is 37 GHz, the initial aperture size is 1.7 m, and the focal length is 90 m. The beam parameters for Fig. 3b, d and f are: frequency is 90 GHz, the initial aperture size is 1.05 m and the focal length is 90 m. Figure 3e, f show the field distributions in a longitudinal cross-section. It can be observed that the spot size decreases with an increase in frequency, which proves the mismatch between the spot size and the receiving aperture in the case of 10 and 90 GHz. It should be mentioned that the MAPSs for the 37 GHz and 90 GHz beams are about 73° and 79°, respectively, when h/L = 0.64 and the cell size equals 0.33λ.
Figure 3c, d illustrate the beam efficiency at different distances. From Fig. 3d, it can be found that within the range of 30–100 m, the beam efficiency remains stable at approximately 82%. In contrast, in Fig. 3c, it can achieve a beam efficiency of 85% at 75 m, and ηb first rises and then falls within the range from 30 to 100 m, reaching 77% and 75% at 30 and 100 m, respectively.
In Fig. 3g, the minimum radius for containing 80% of the beam power, denoted as r0.8, is considered as a function of the propagation distance z. The practical focal position, where the smallest r0.8 occurs, is located at ~65 m after optimizing the average beam efficiency in the range from 30 to 100 m, as shown by the solid line in Fig. 3g. When the beam parameters are changed from the optimized parameters at 37 GHz, the other curves show that the practical focal positions deviate from 65 m, resulting in poor focusing at either z = 30 m, or z = 100 m.
The average beam efficiencies of the two optimized beams within the 30–100 m range are similar. However, since the wavelength at 90 GHz is smaller, the phase error caused by manufacturing will be larger than that at 37 GHz. In terms of cost, 90 GHz requires more elements—approximately 2.7 times the number needed for 37 GHz—without any improvement in average beam efficiency. Therefore, for the purpose of charging UAVs discussed in this paper, the optimized beam at 37 GHz is more advantageous.
-
The influence of random phase errors on the beam propagation properties is investigated in the case of the optimized 37 GHz focusing beam. The causes of random phase errors here include the error in the geometric dimensions of unit cells, the error in the dielectric constant of dielectric materials, and the geometric error from the unevenness of the aperture during the assembly process. Although several technologies have been developed to reduce these errors[7,8], it is still necessary to study the influences of the phase error on beam propagation properties, thereby providing suggestions for the selection of materials and manufacturing technologies.
A random term of the initial phase is introduced into the model, which is directly added to the designed initial phase. The modified initial phase can be expressed as:
$ \mathit{\Phi}_{\mathrm{mn}}\mathrm{\ =\ }\mathit{\varphi}_{\mathrm{mn}}\mathrm{\ +\ \Delta(}\mathit{\sigma}\mathrm{)in\; degree} $ (4) where, Δ follows a normal distribution with a mean of 0 and a standard deviation of σ, and Φmn is the modified initial phase after introducing random phase errors.
Figure 4 shows the beam efficiency as a function of propagation distance considering the random phase errors. Comparing this with Fig. 3a, it can be seen that the beam efficiency becomes worse for all distances when the total random phase error exists. When the total phase error follows a normal distribution with a mean of 0 and a standard deviation of 10, the total phase error can hardly exceed 30°, and the average beam efficiency remains at 80% with a fluctuation of no more than 2%; when the total phase error follows a normal distribution with a mean of 0 and a standard deviation of 15, it can hardly exceed 30°, and the average beam efficiency remains above 75% with a fluctuation of no more than 3%. Larger random phase errors will be quite harmful for the focusing beam, and should be avoided in practice.
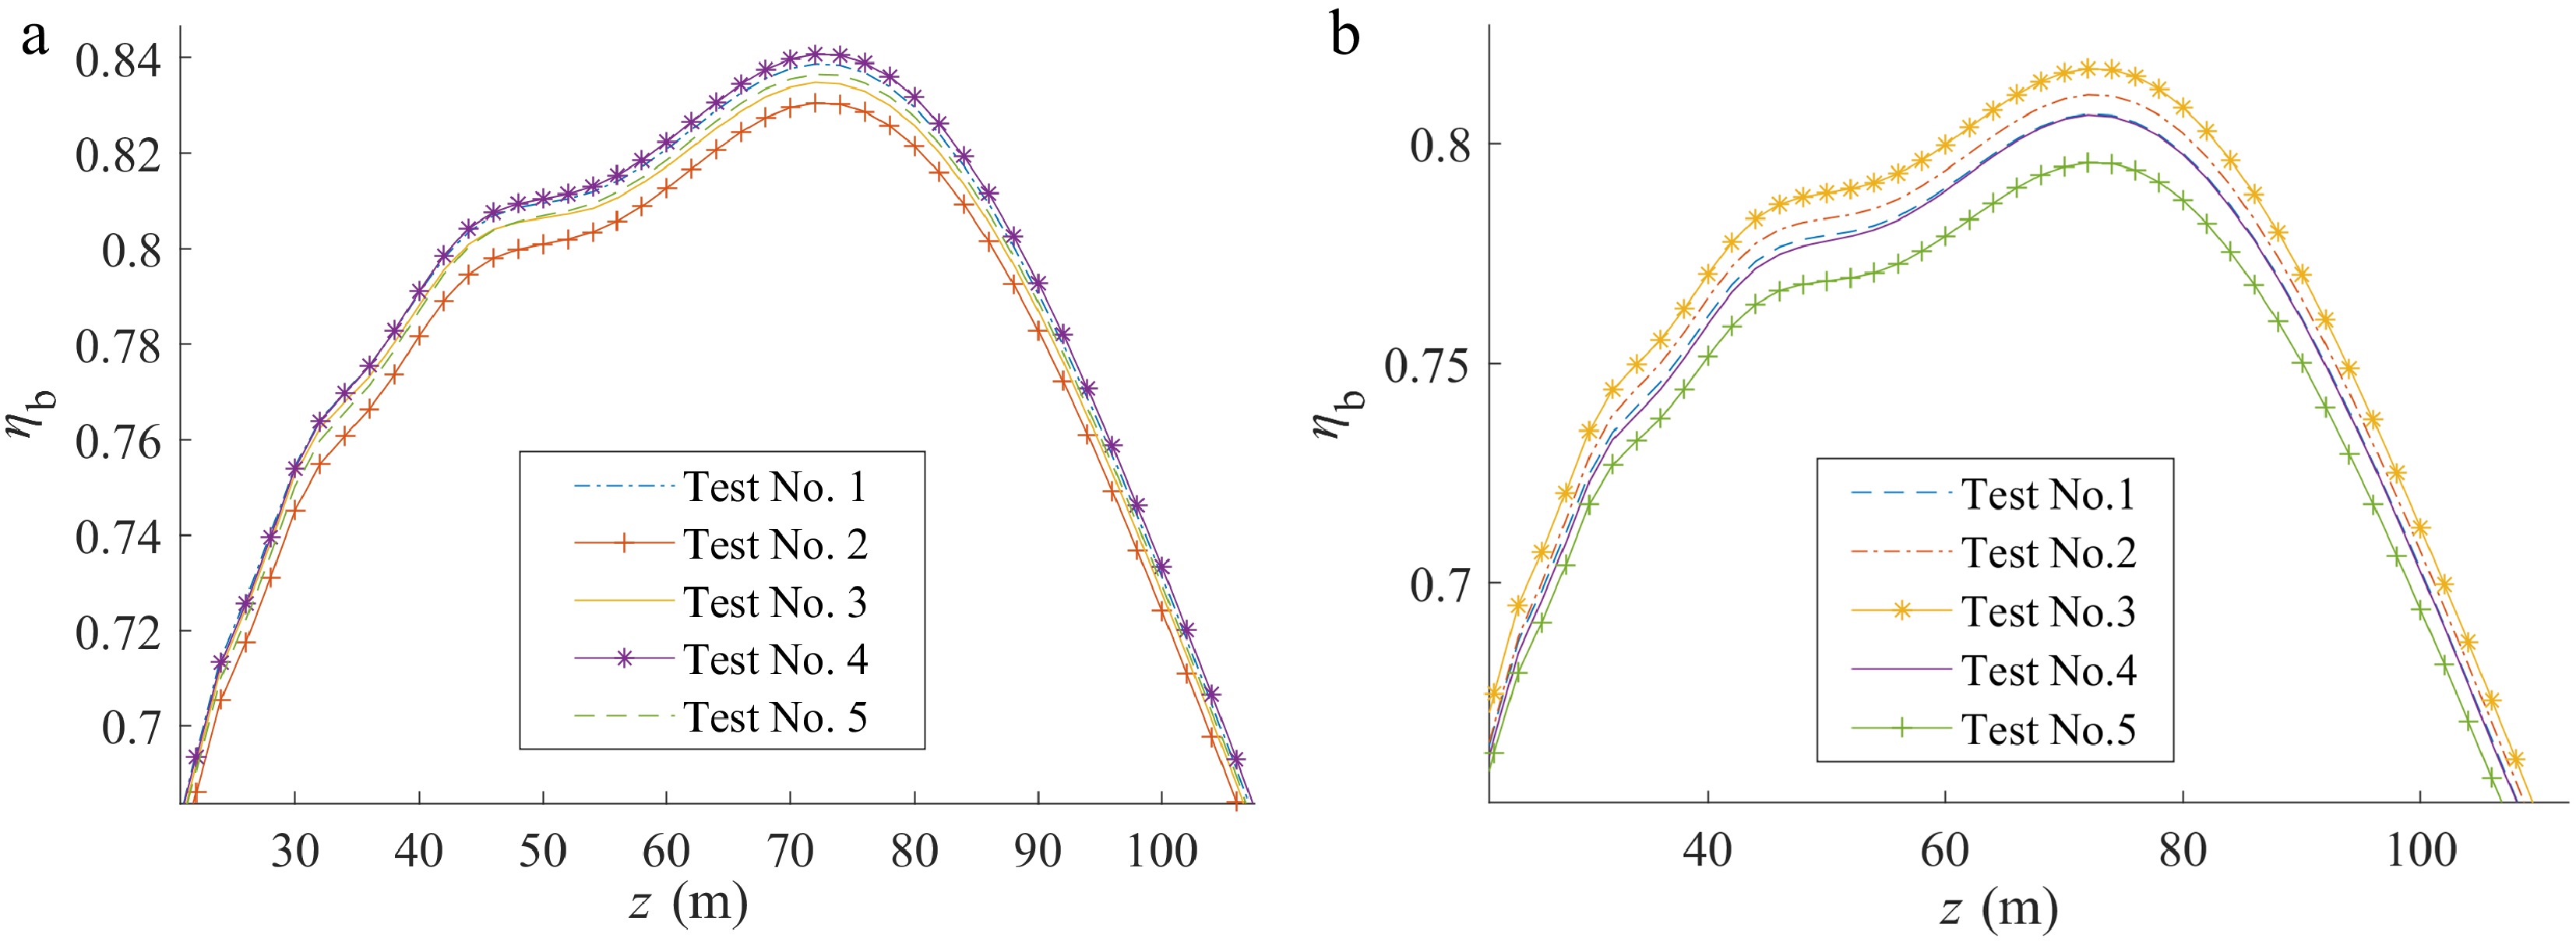
Figure 4.
Beam efficiency as a function of z obtained by five random tests considering phase error in initial phase distribution. (a) σ = 10, and (b) σ = 15.
Corresponding to the geometric dimensions of unit cells, the dielectric constant of dielectric materials, and the unevenness of the aperture, the three items in the total random phase error, assumed as independent random variables, satisfy the relationship given by
$ \sigma^{_2}\ =\ \sigma_1^2\ +\ \sigma_2^2\ +\ \sigma_3^2 $ (5) where, σ is the standard deviation of the total phase error and σ1, σ2, and σ3 are the standard deviations corresponding to the three causes, respectively. Considering Eq. (5), both σ1, σ2, and σ3 are suggested to be no larger than 8.5° so that σ stays no larger than 15°. This indicates the required precision during the manufacturing process is ~10 μm at 37 GHz.
Adjusting the orientation of a planar reflect-array antenna using a turntable has limitations in terms of precision. The required precision in the orientation may be accomplished by slightly moving the horn. In this section, the influences of small displacements of the feed horn on the beam direction and power transmission properties are discussed.
It is assumed that the UAV operates within a working plane approximately parallel to the surface of the transmission tower; this section only considers the deflection of the beam within this plane. As shown in Fig. 5, the red plane represents the UAV's working plane. The direction of the linearly-polarized electric field emitted from the horn is along the x-axis, and the direction of the electric field remains unchanged when the horn moves inside the red plane, as shown in Fig. 5.
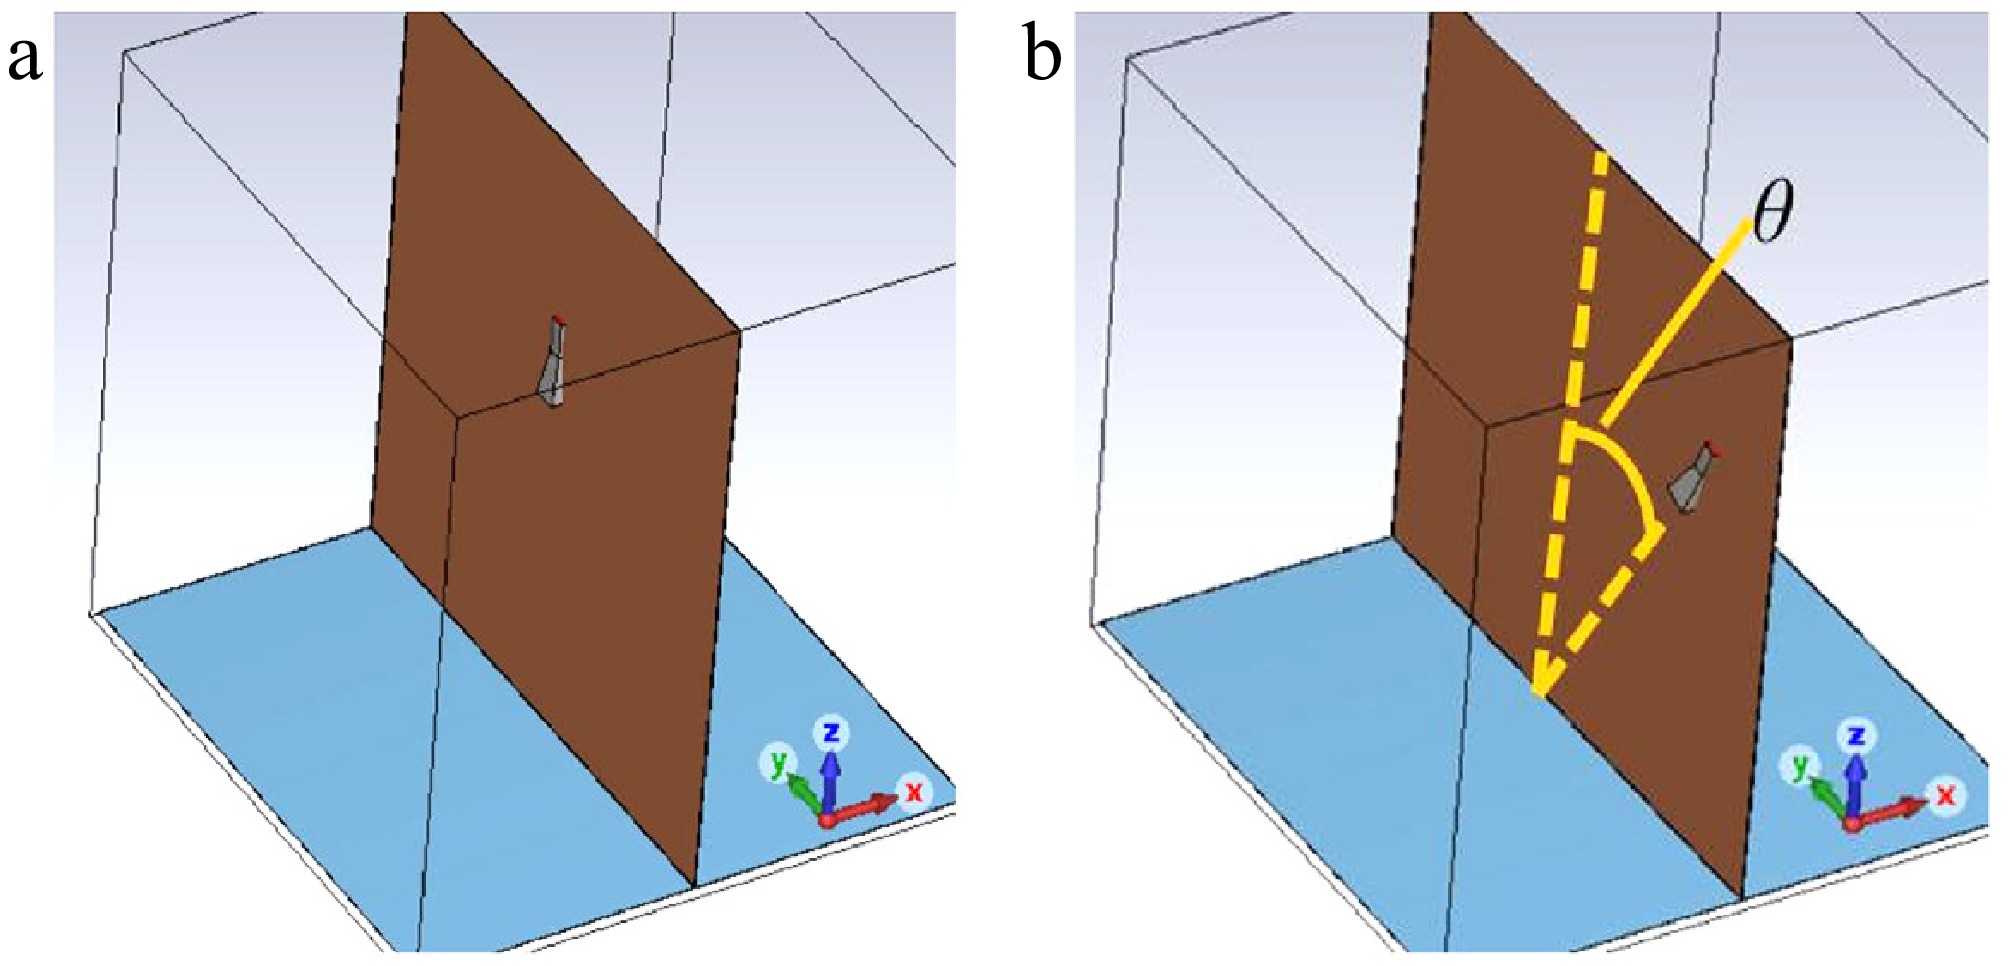
Figure 5.
Geometry of the horn and antenna aperture. (a) Boresight feed, and (b) offset feed.
The ratio between the height of the horn and L should not change, and the horn must be directed towards the array center when the offset feed angle changes. The offset feed angle is denoted as θ. Considering the offset feed angle, the initial phase can be rewritten as:
$ {\varphi } _{ {\theta } {\text{,}{\mathrm{mn}}}} =( {\psi } _{ {\theta } {\text{,}}{\mathrm{mn}}}\,-\, {\psi } _{ {\theta } {\text{,}{\mathrm{mn}}}} {|}_{ {\theta } =0} )\,+\, {\varphi } _{ \mathrm{mn}} $ (6) where, the term in parentheses represents the phase increment of the incident field when θ increases from zero to a specific value; the second term on the right is the designed initial phase. The phase increment and the amplitude distribution can be obtained by numerical simulation using CST MS Studio. Figure 5 also gives the geometry of the simulation model in CST software.
By substituting the amplitude and phase distributions on the initial aperture into the theoretical model under different values of θ, the field distribution and beam efficiency, considering the beam deflection, can be calculated. The receiving aperture remains a circular area with a radius of 0.4 m. Figure 6 shows the calculated field distributions on the longitudinal cross-section for the optimized 37 GHz beam when the offset angles are 1°, 2.5°, and 5°, respectively. It can be observed from Fig. 6 that the beam deflection angles corresponding to the three offset angles, in ascending order, are 0.875°, 2.22°, and 4.57°, respectively, and the beam deflection angle is slightly smaller than the horn offset angle.
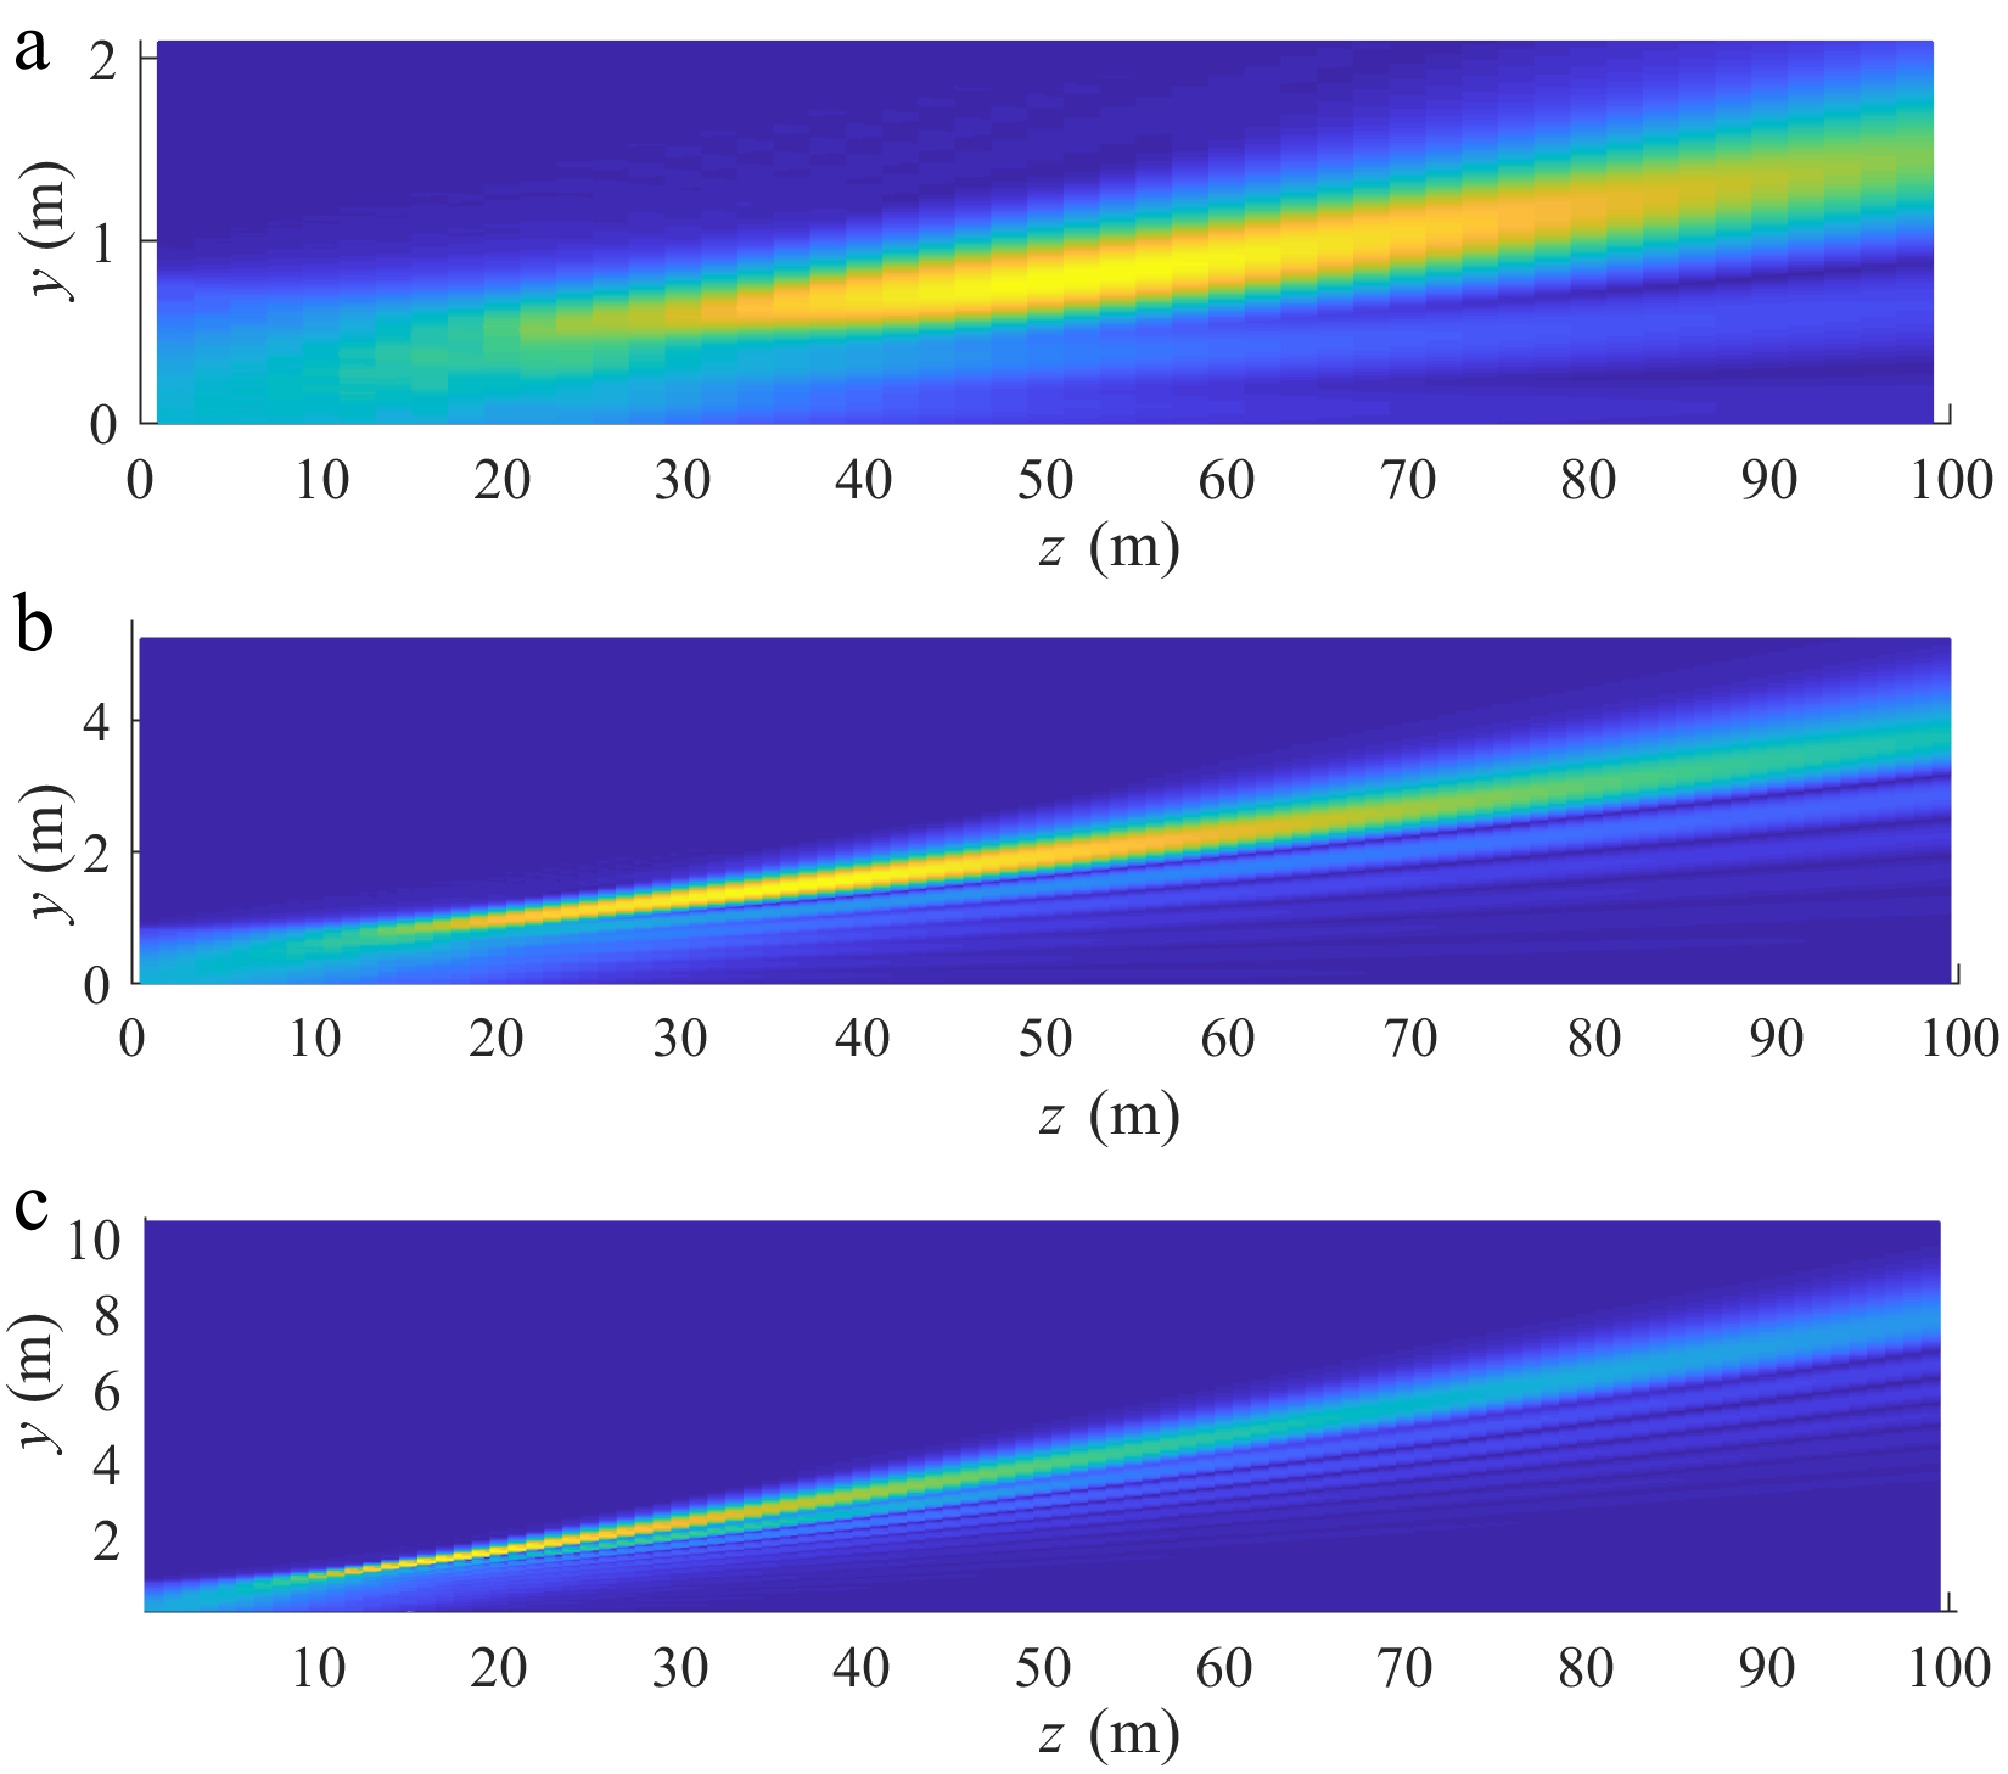
Figure 6.
Field distribution on yoz plane at 37 GHz for offset feed. (a) θ = 1°, (b) θ = 2.5°, and (c) θ = 5°.
Figure 7 shows ηb as a function of the propagation distance. It should be noted that the propagated beam does not reach the receiving aperture normally. However, due to the incident angle being quite small, it will not affect the efficiency of the receiving antenna, and the power density can be directly integrated over the circular receiving area. It can be observed from Fig. 7 that both the transmission distance and efficiency of the beam are significantly lower than those in the boresight feed situation. When the offset feed angle is 1°, the beam efficiency remains above 70% within the range of 40−90 m. When the offset feed angle is 2.5°, the beam efficiency stays no less than 70%, within the range of 30−70 m.
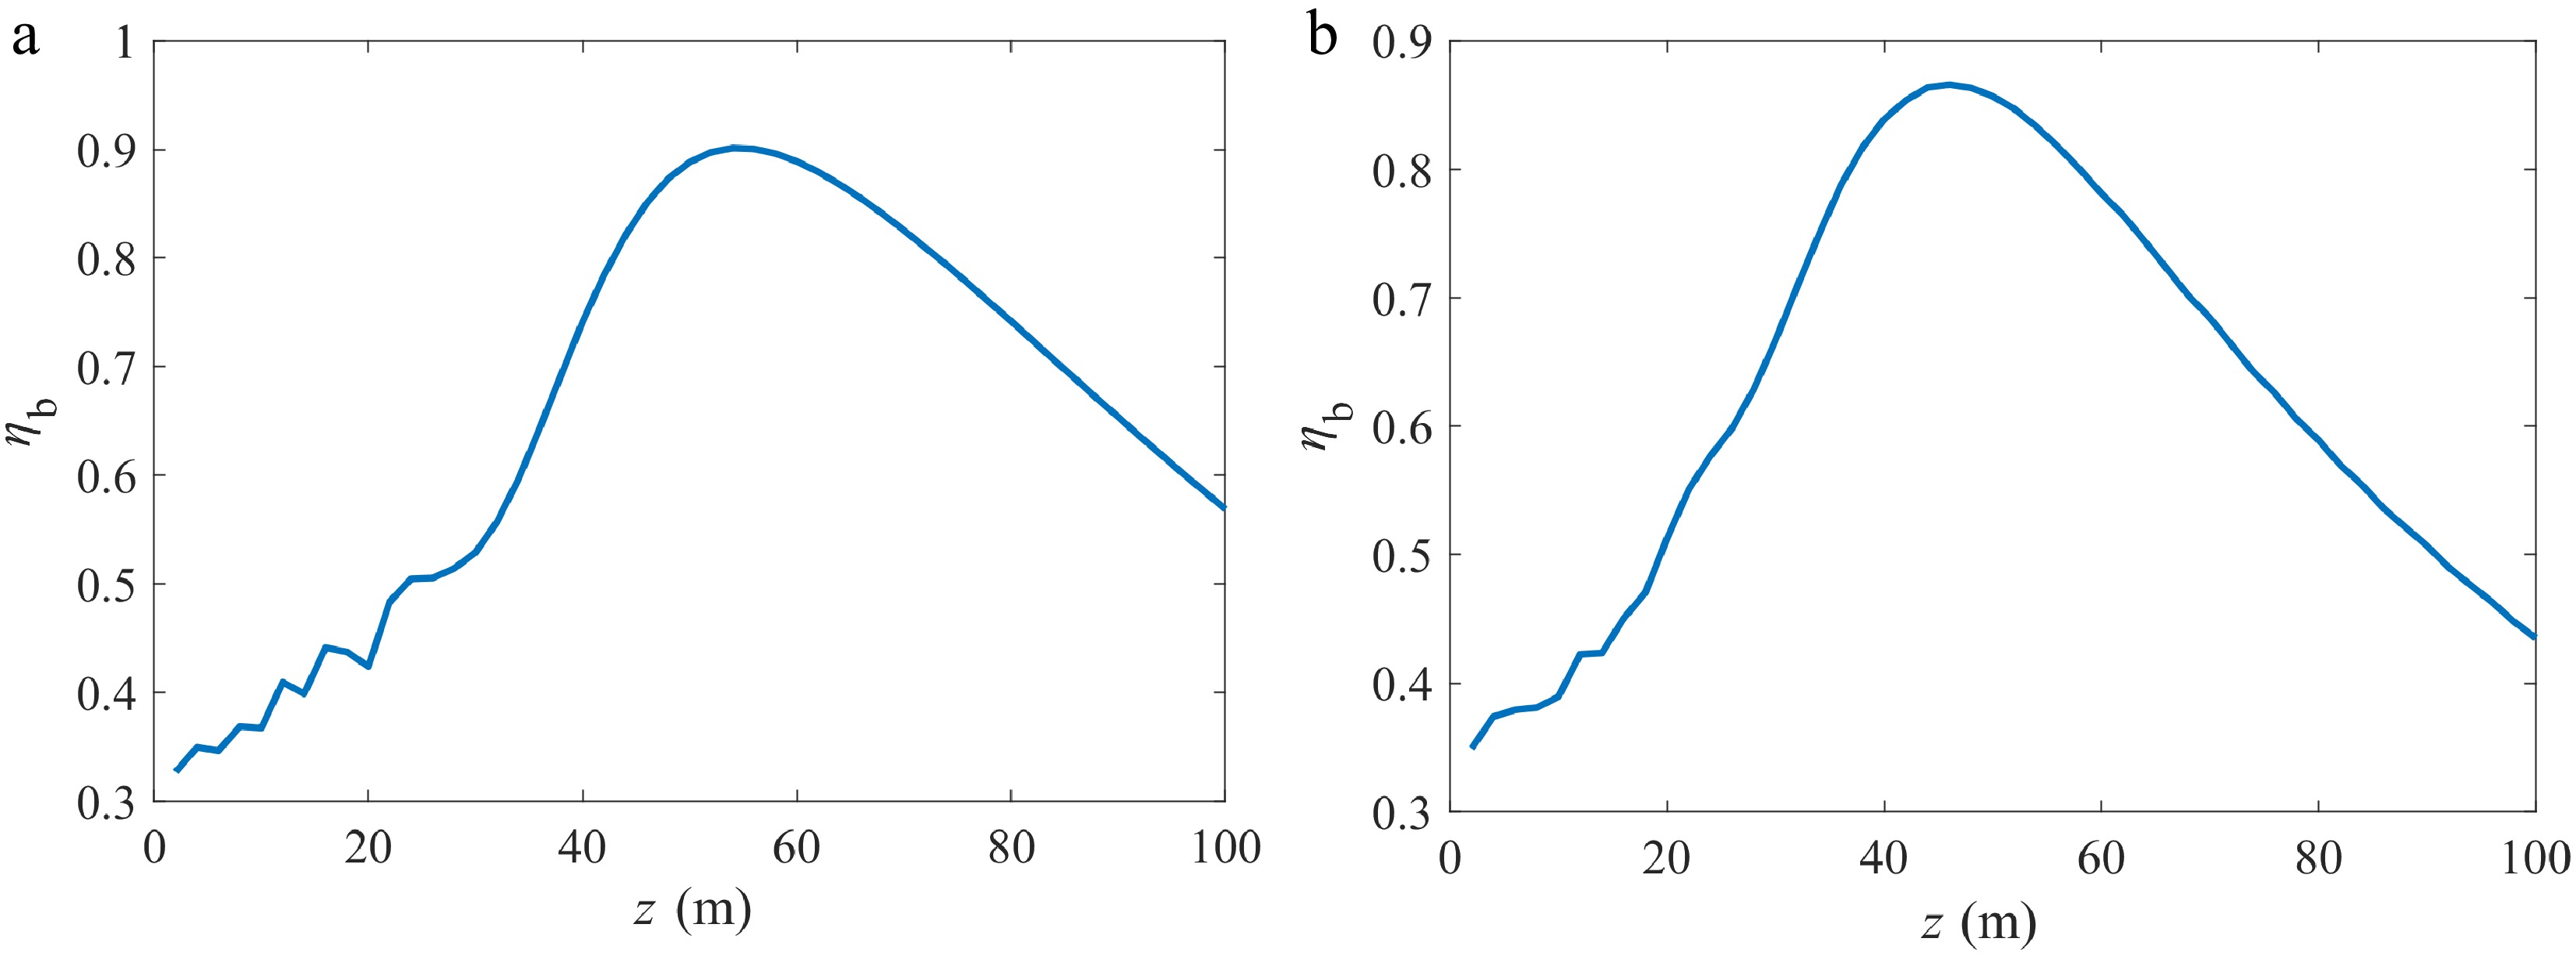
Figure 7.
ηb as a function of z at 37 GHz for offset feed. (a) θ = 1°, and (b) θ = 2.5°.
Figure 8 shows the field distributions along the horizontal and vertical directions in the receiving aperture at a distance of 50 m when the offset angle is 1°. Due to the symmetry on the initial surface, the field distribution is symmetric in the x-direction but asymmetric in the y-direction, with side lobes appearing. As the transmission distance increases, the power contained in the side lobes gradually increases, and the side lobes clearly deviate from the receiving region.
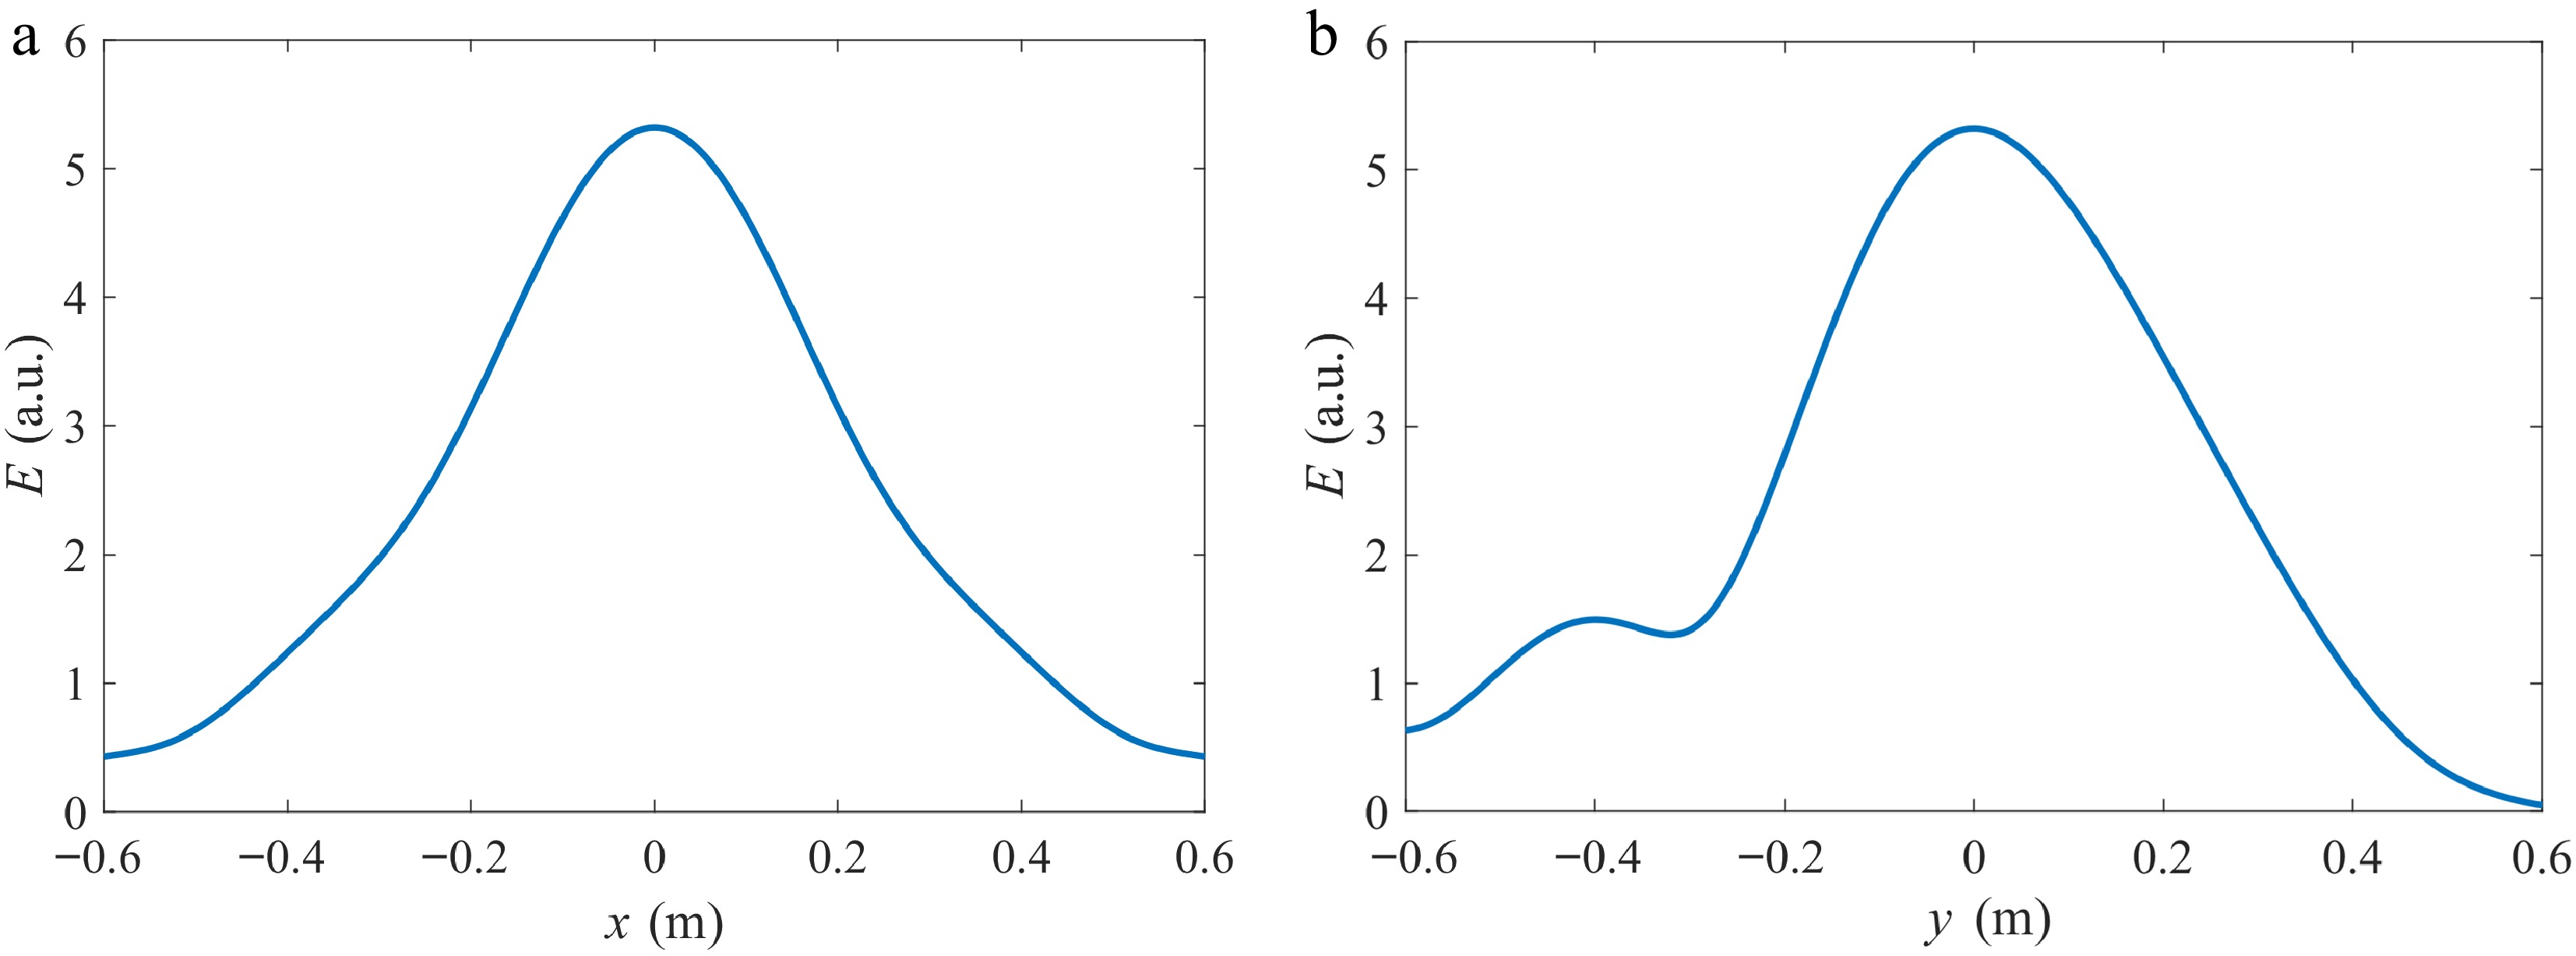
Figure 8.
Electric field distribution along horizontal x-axis and vertical direction in receiving aperture with θ = 1° and z = 50 m. (a) Along the horizontal x-axis, and (b) along the vertical direction.
Figure 7 shows ηb as a function of the propagation distance. It should be noted that the propagated beam does not reach the receiving aperture normally. However, due to the incident angle being quite small, it will not affect the efficiency of the receiving antenna, and the power density can be directly integrated over the circular receiving area. It can be observed from Fig. 7 that both the transmission distance and efficiency of the beam are significantly lower than those in the boresight feed situation. When the offset feed angle is 1°, the beam efficiency remains above 70% within the range of 40−90 m. When the offset feed angle is 2.5°, the beam efficiency stays no less than 70%, within the range of 30−70 m.
Figure 8 shows the field distributions along the horizontal and vertical directions in the receiving aperture at a distance of 50 m when the offset angle is 1°. Due to the symmetry on the initial surface, the field distribution is symmetric in the x-direction but asymmetric in the y-direction, with side lobes appearing. As the transmission distance increases, the power contained in the side lobes gradually increases, and the side lobes clearly deviate from the receiving region.
The phase increment caused by the displacement of the horn can be regarded as a phase error. Figure 9 presents the distributions of the phase increment when the offset feed angles are 1°, and 2.5°. It can be observed that when the deflection angle is 2.5°, the phase error ranges from −23° to 23°. The maximum difference is ~46°, which reaches the maximum phase error suggested earlier. As a result, the offset angle is limited and cannot be larger than 2.5°. When the offset angle is 5°, the average phase error can reach 90°, and the noticeable reduction in the beam transmission distance also proves this limitation, as shown in Fig. 6c.
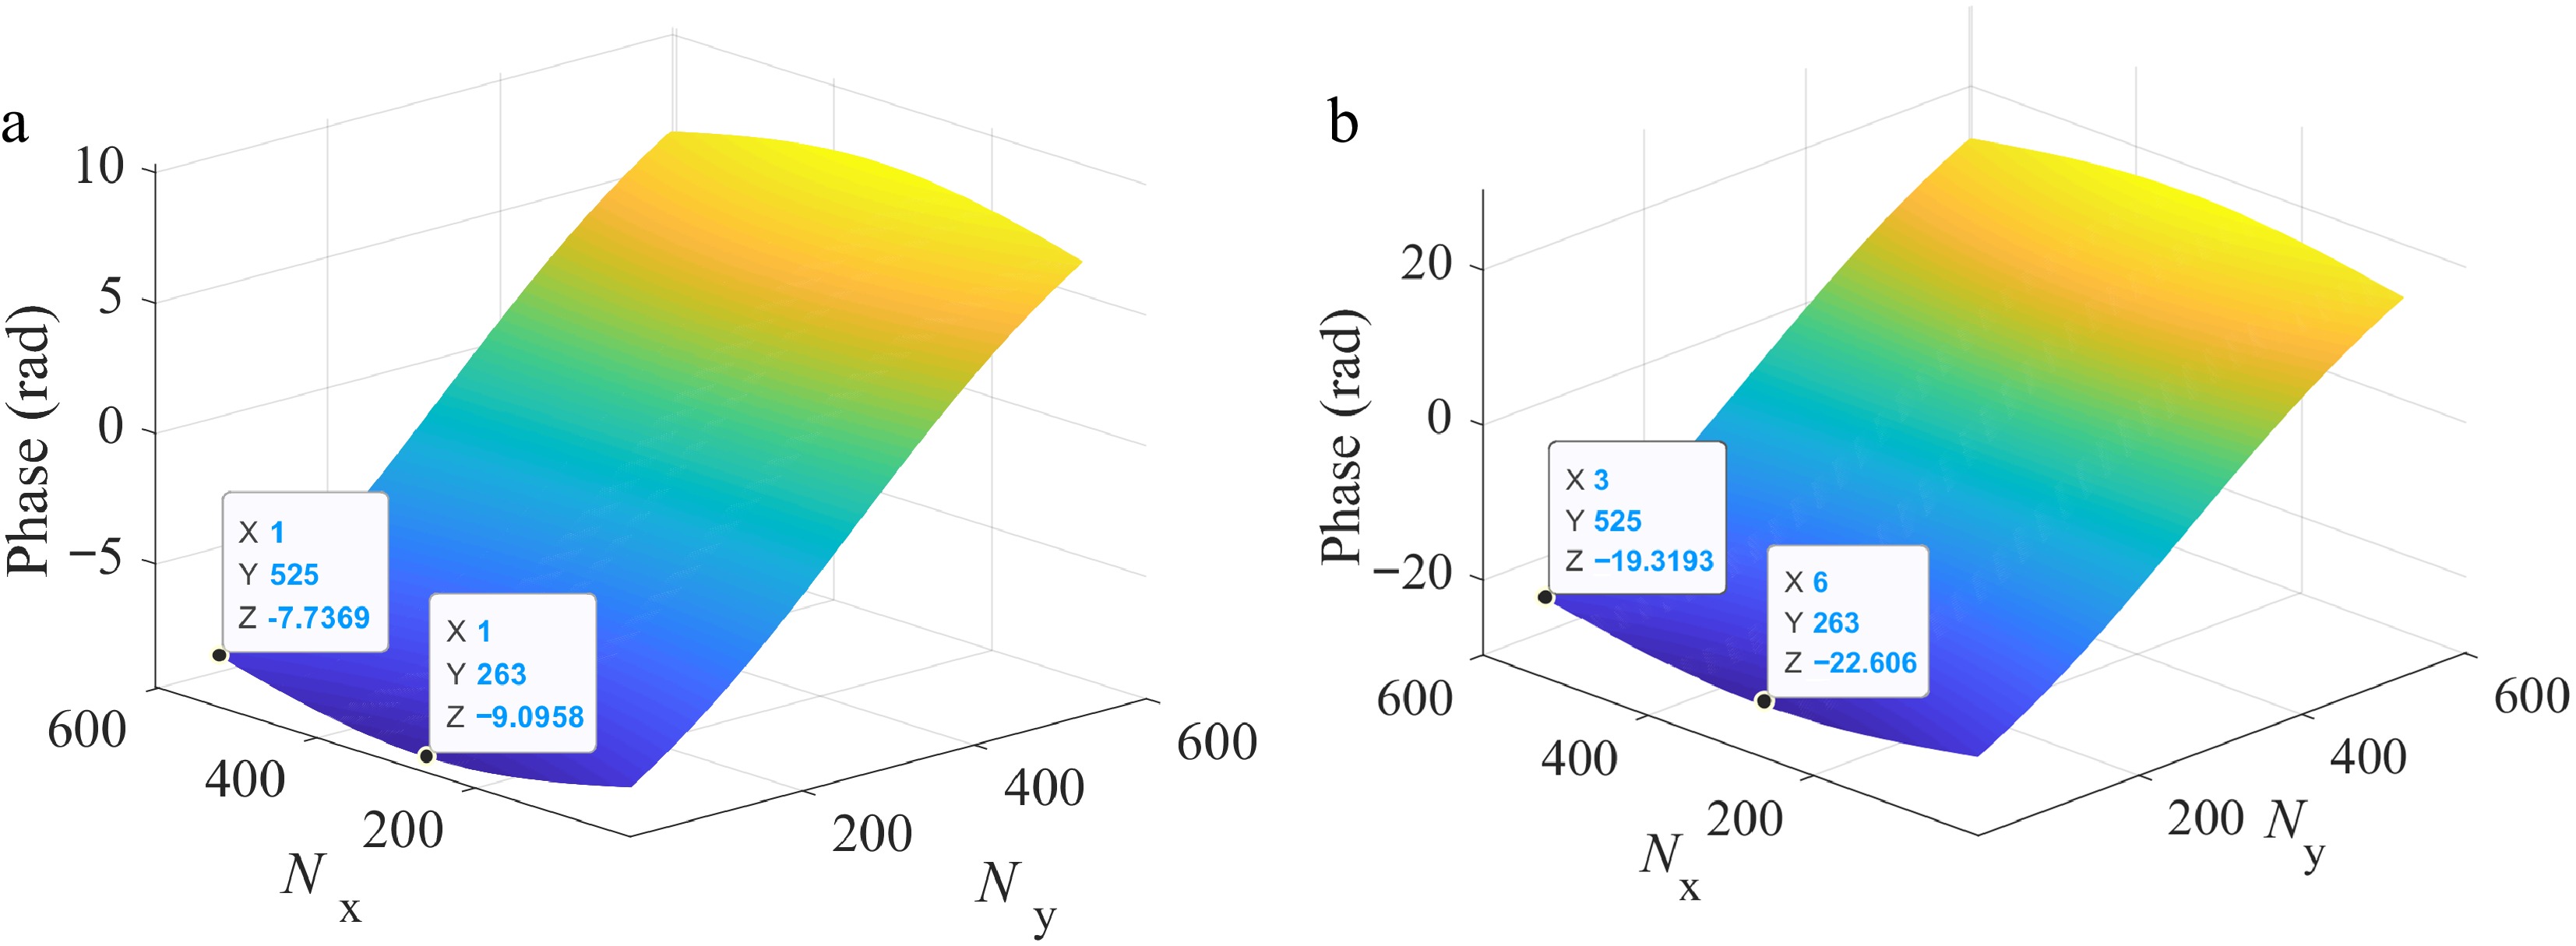
Figure 9.
Deviation of initial phase distribution caused by offset horn (a) θ = 1°, and (b) θ = 2.5°.
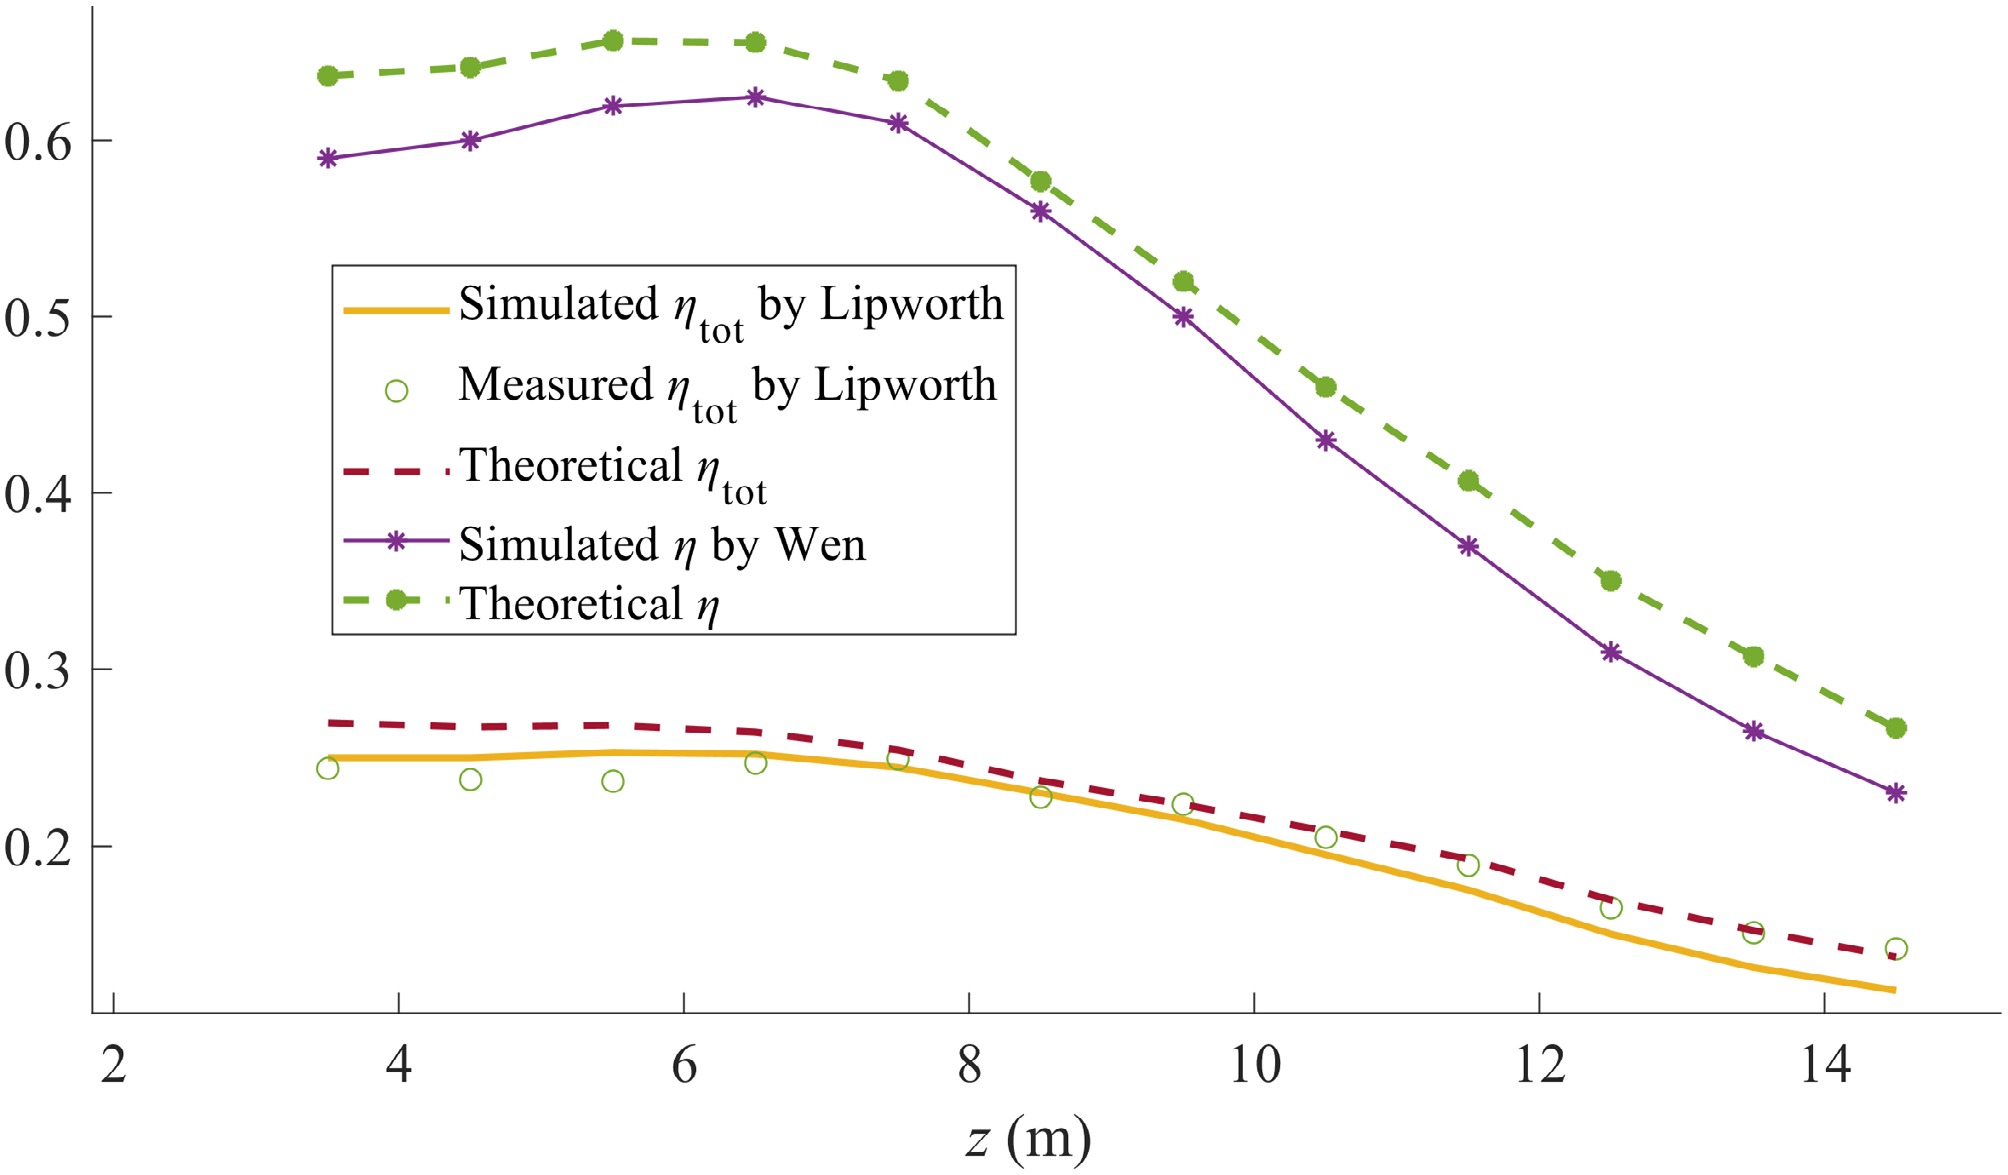
Due to a lack of millimeter microwave sources, it is now difficult for us to directly perform an experimental demonstration. A verification of the theoretical model is performed. In Fig. 10, the theoretical results are compared with the simulation and experimental results presented by Lipworth et al.[13] and Wen et al.[14], respectively. The efficiency η shown in Fig. 10 is the product of η1 and ηb, which indicates the power incident on the receiving aperture divided by the power radiated by the horn. By comparing the solid line and the marked solid line with the dashed line and the marked dashed line, respectively, the theoretical and simulated results agree well. As mutual coupling and manufacturing errors have little influence on the magnitude distribution on the aperture, it is indicated that the mutual coupling effect and the corresponding phase errors can be well limited when the MAPS is smaller than 100°, as suggested by previous studies[5−7]. The simulated field strength could be slightly smaller than that of the theoretical results at distances where the beam is no longer focused, probably because of the mutual coupling between adjacent unit cells. It is easy to find that the distance from the horn to the reflect-array is much shorter than the focal point. As a result, the MAPS is determined by the optical path difference (OPD) between the two routes, which starts from the horn and ends at the two adjacent unit cells near the furthest edge of the initial aperture, respectively[14]. Then, the MAPS can be calculated by:
$ \text{MAPS}=\dfrac{\sqrt{h^2+\left(h\mathrm{tan}\theta+L/2\right)^2}-\sqrt{h^2+\left(h\mathrm{tan}\theta+L/2-d\right)^2}}{\lambda}\times360^{\circ}\text{,} $ (7) where, h, θ, and L are the height of the horn, the feed angle, and the edge length of the initial aperture, which have been defined before; d is the period length of the unit cell, which is ⅓ of the wavelength. The values of MAPS on the initial aperture are 73°, 76°, and 91°, for the optimized beams in this work, in Lipworth et al.[13], and in Wen et al.[14], respectively. The conservative value of the MAPS can ensure that the mutual coupling effect is not obvious.
The efficiency ηtot shown in Fig. 10 is the product of η1, η2, and ηb, which indicates the received DC power Pt divided by the power radiated by the horn, denoted as P0. By comparing the theoretical and experimentally measured results in Fig. 10, it is indicated that the phase errors caused by the manufacturing errors have been effectively limited, but which still cause small fluctuations near the focal position. So, a passive reflect-array antenna is capable of realizing the optimized 37 GHz microwave beam; meanwhile, advancing techniques and manufacturing processes are required[8,9].
The structures in a unit cell in Fig. 11a are, from top to bottom, a circular metal patch, F4BM-2 dielectric upper layer, metal ring, F4BM-2 dielectric lower layer, and the grounded metal plate. h1 and h2 are the thicknesses of the upper and lower dielectric layers. The unit cell works at 9.7 GHz. Figure 11b shows the simulation model, which includes the antenna, horn, and its support. Wood plates are shown by green plates. The reflect-array is illuminated by a 10 dB standard horn which radiates toward the z axis and is placed in front of the array at a height of 15.55 cm. The aperture size of the 18 × 18 array is 0.288 m. The designed focal distance is infinite.
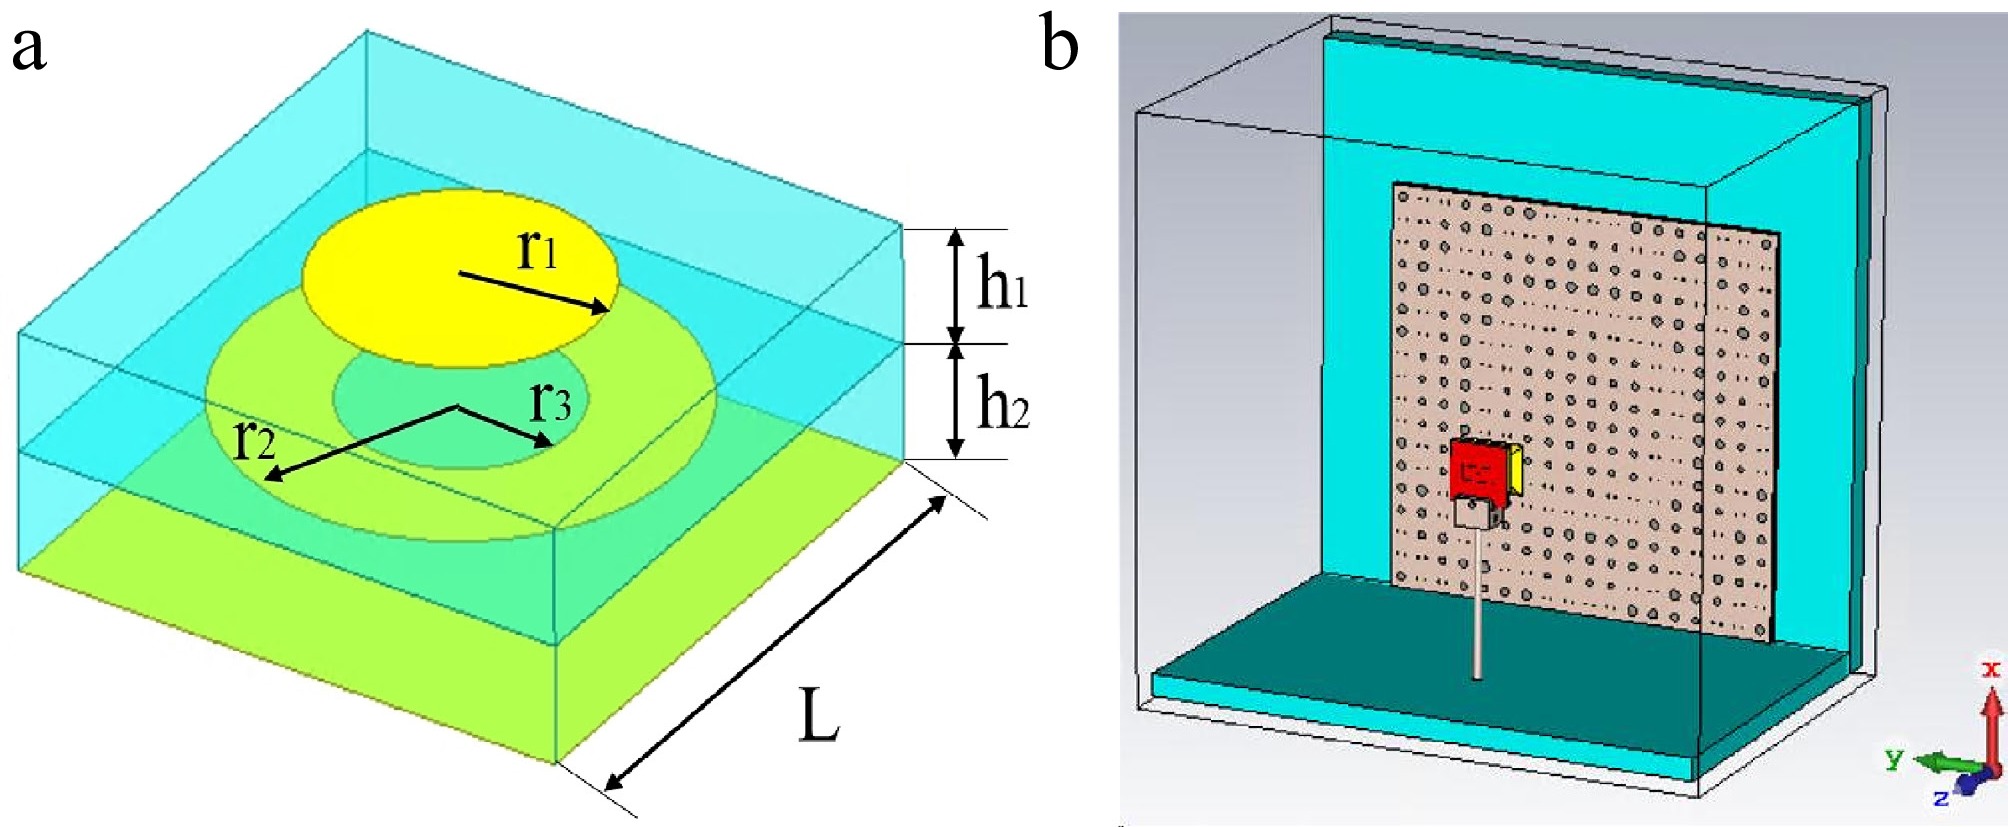
Figure 11.
Simulation models in a CST microwave studio. (a) Geometrical structure of unit-cell, and (b) whole reflect-array antenna.
The experimental demonstration was performed by our team. The practical antenna and the experimental setup are shown in Fig. 12a and b, respectively. The patterns and the distribution of |E| on the z axis were measured and shown in Fig. 13. The measured, simulated, and theoretical maximum gains are 27.71, 28.01, and 28.36 dB, respectively. The H-plane pattern is not symmetric about the z-axis due to the scattering by the horn and its support. The maximum gain in the H-plane pattern is reached at an elevation angle of −0.6°, as shown in Fig. 13a. The theoretical model cannot predict the scattering effect. The horn and its support are modeled in the simulation so that the simulated H-plane pattern matches well with the measured results. The E-plane pattern shown in Fig. 13b is symmetric about the z axis, as well as the horn and its support.
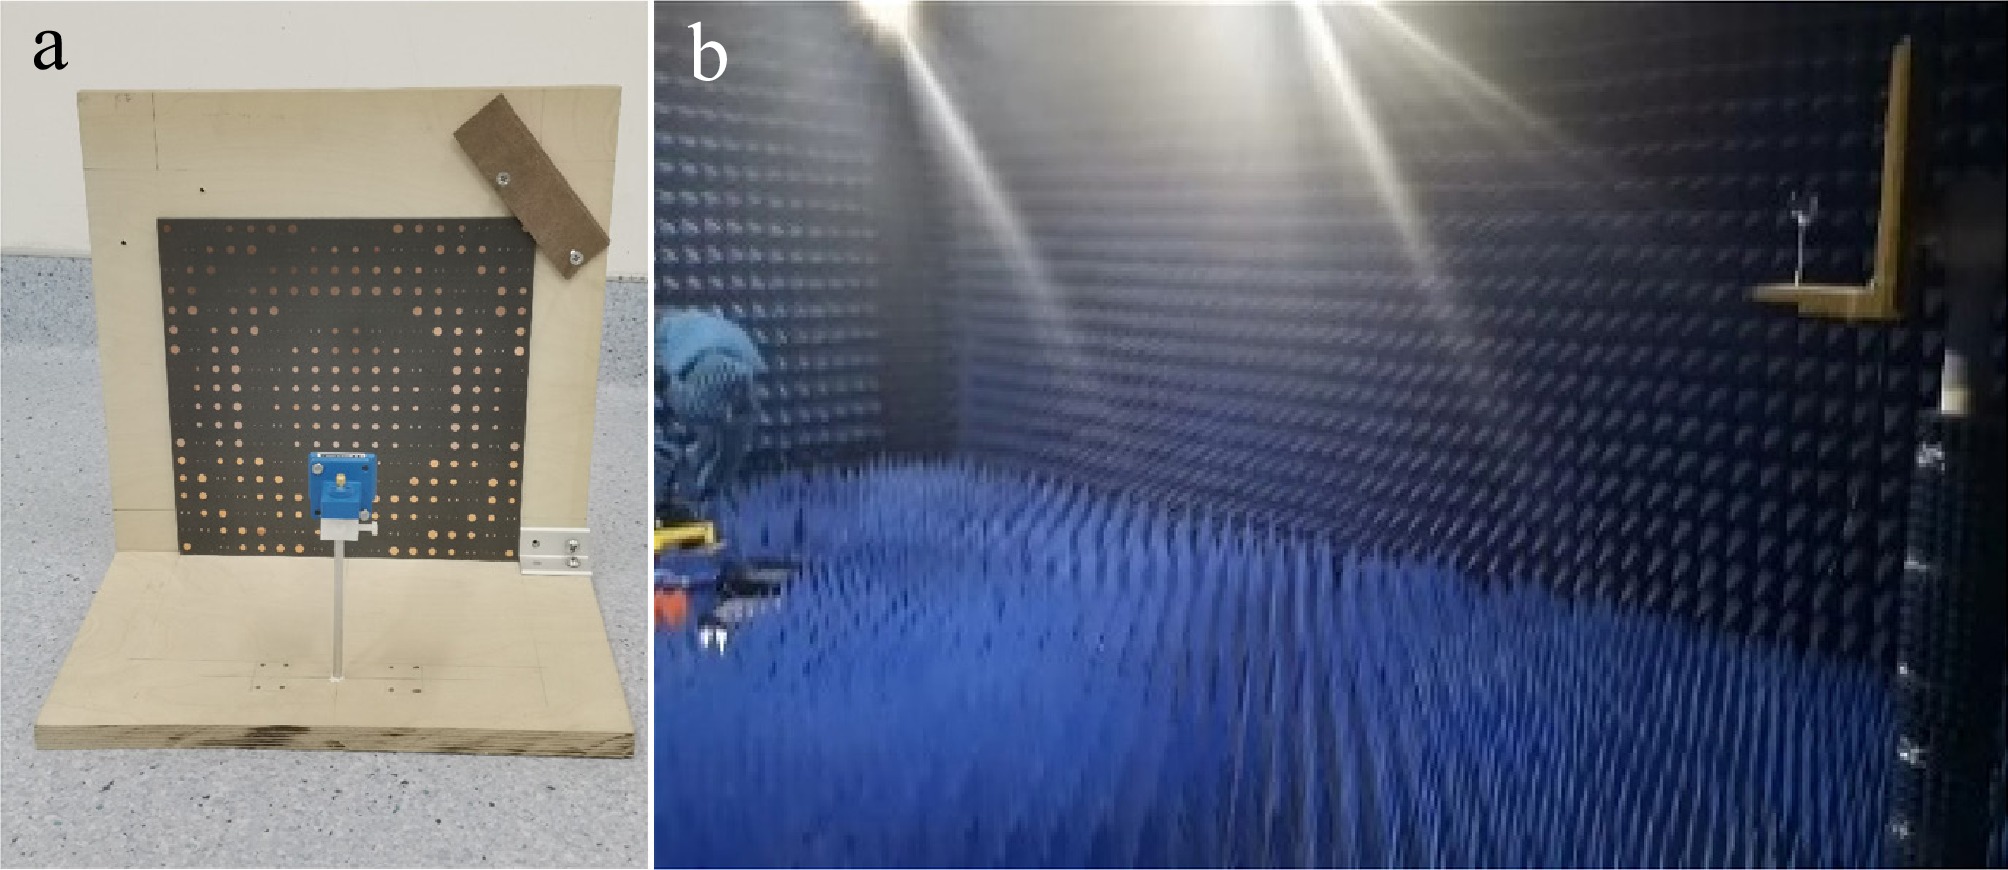
Figure 12.
Reflect-array antenna for experimental demonstration. (a) Practical antenna, and (b) experimental setup.
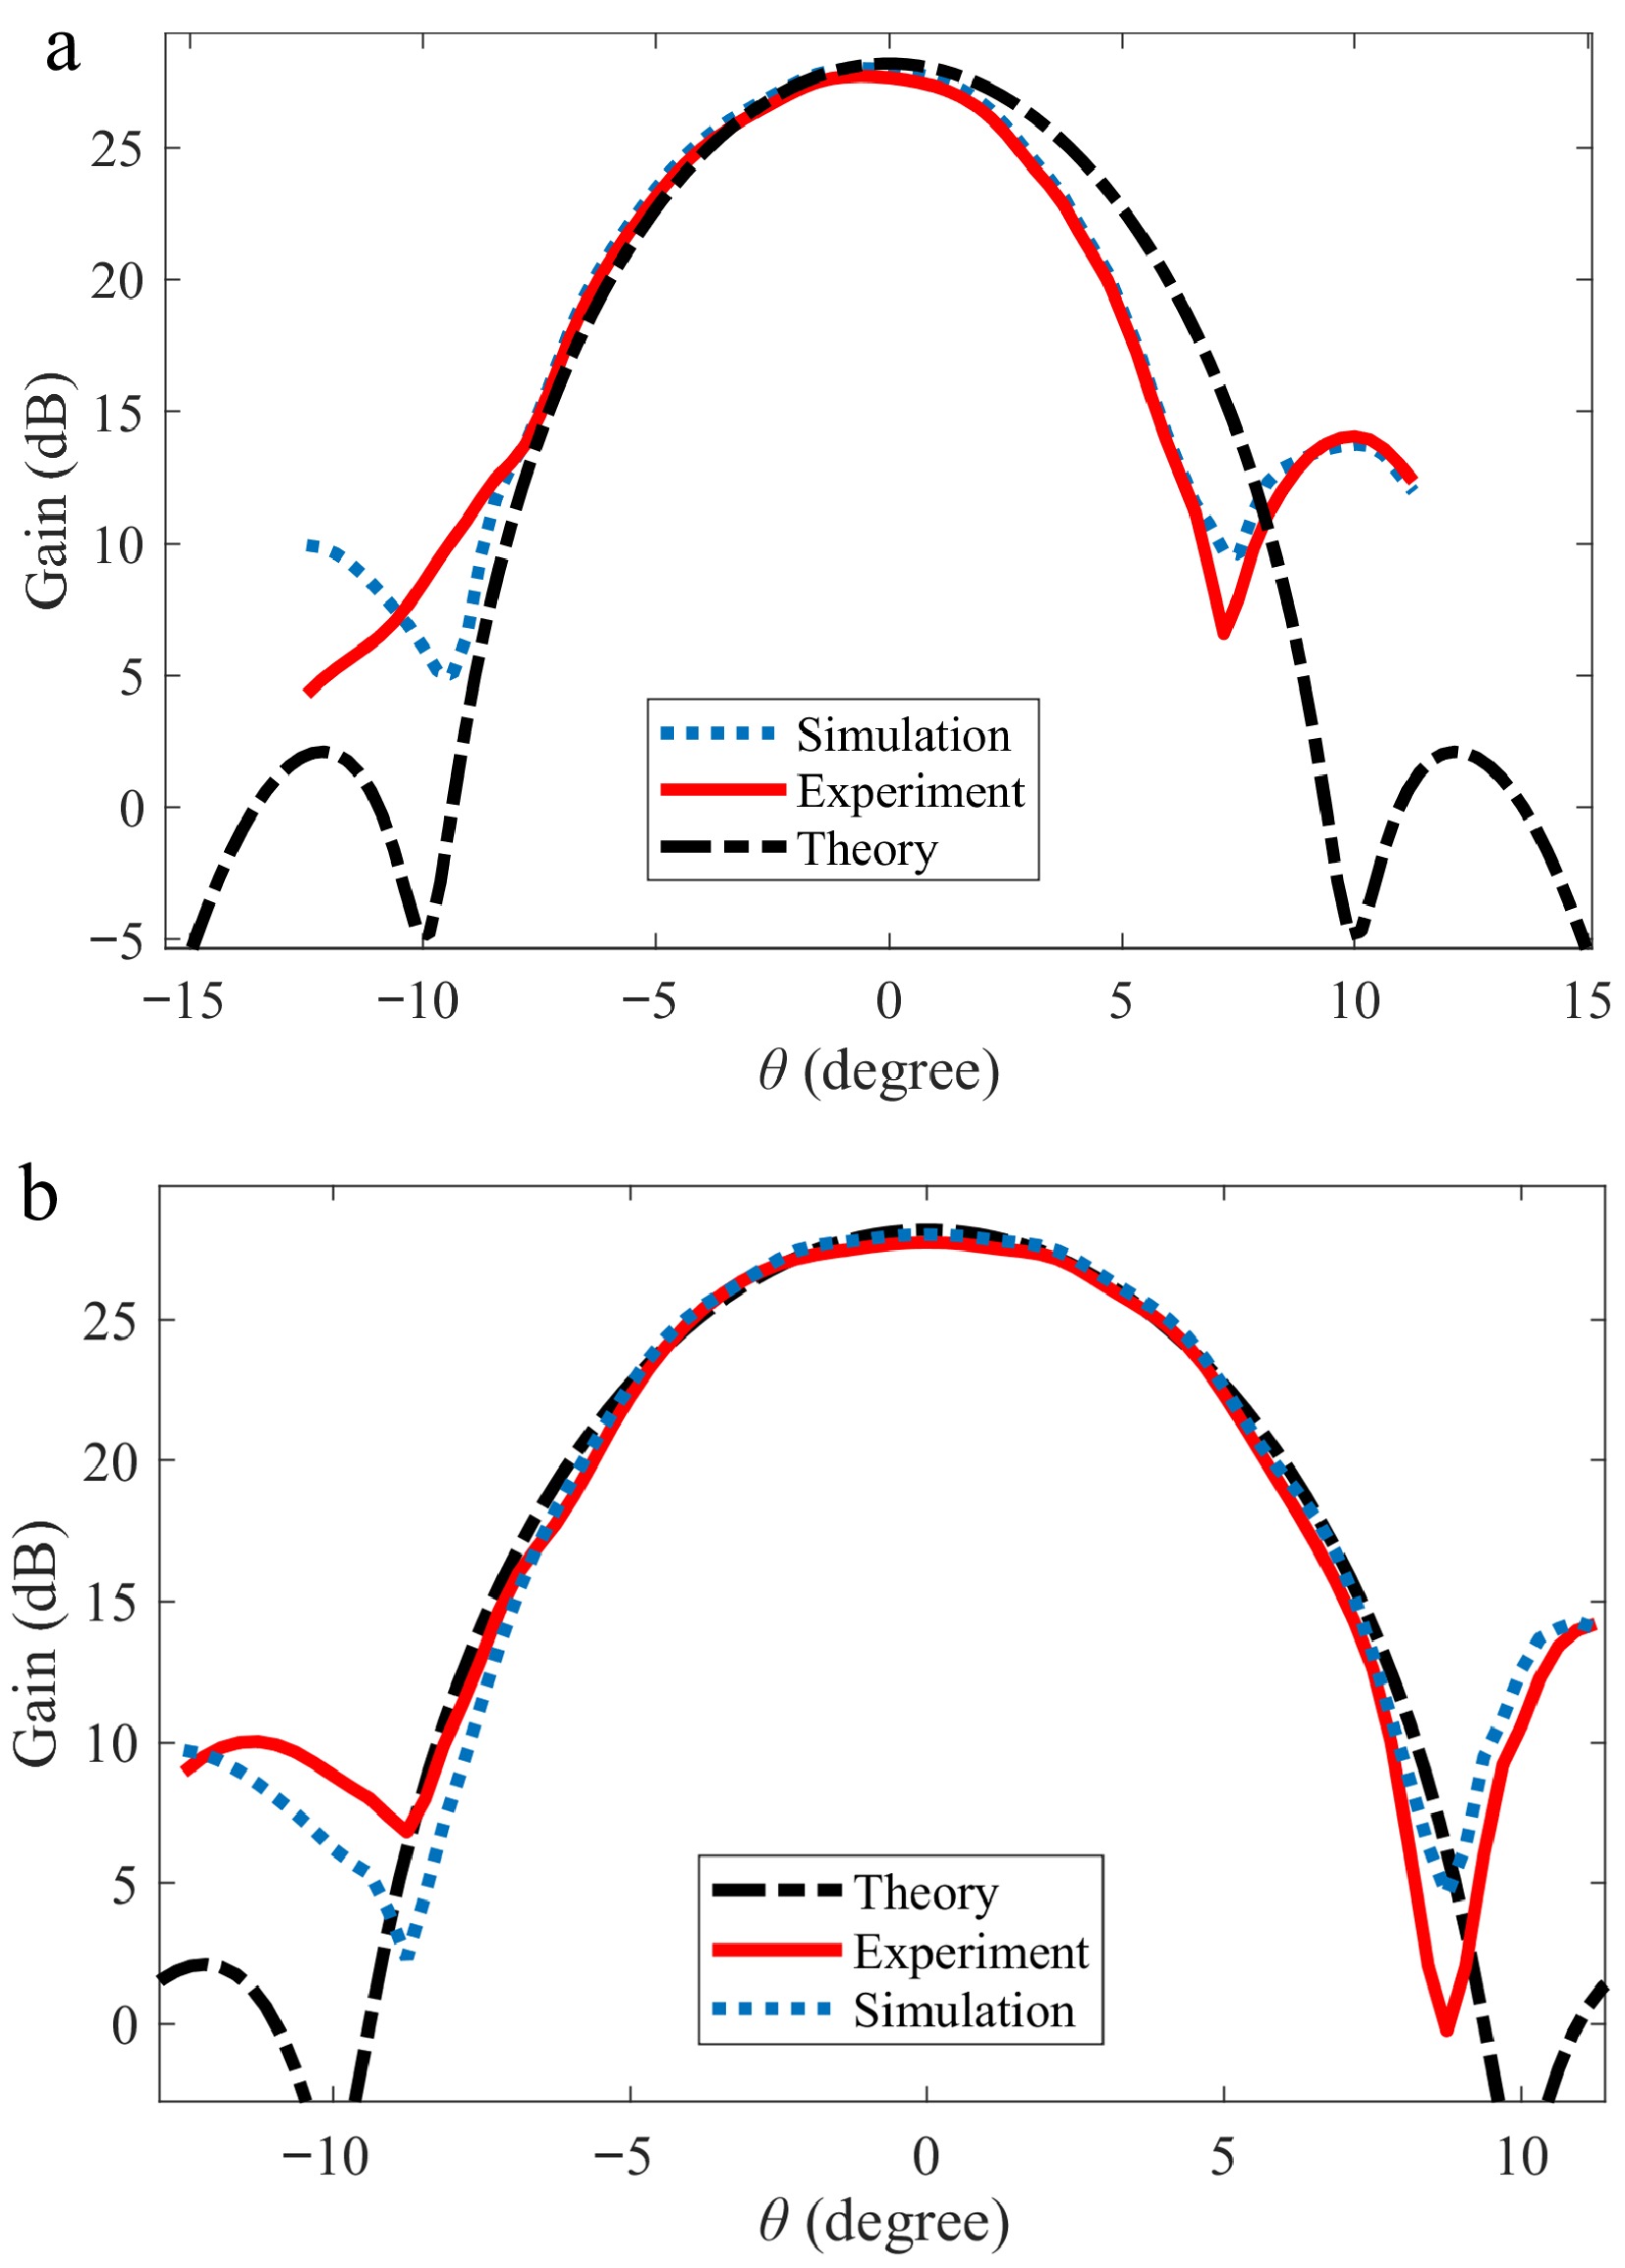
Figure 13.
Radiation patterns of reflect-array antenna. (a) H-plane pattern, and (b) E-plane pattern.
Figure 14 shows the distribution of |E| on the z axis. It can be found that a local maximum occurs near z = 0.25 m as a result of spatial coherence. The measured field strength is smaller than the theoretical value on the z axis behind the horn. The deviation of the measured |E| from the theoretical value near the local maximum is about 4%, where the scattering effect of the horn cannot be neglected. The practical focal appears at z = ~0.6 m. The deviation decreases to about 2%, which is well accepted. As the propagation distance increases, the deviation gradually decreases.
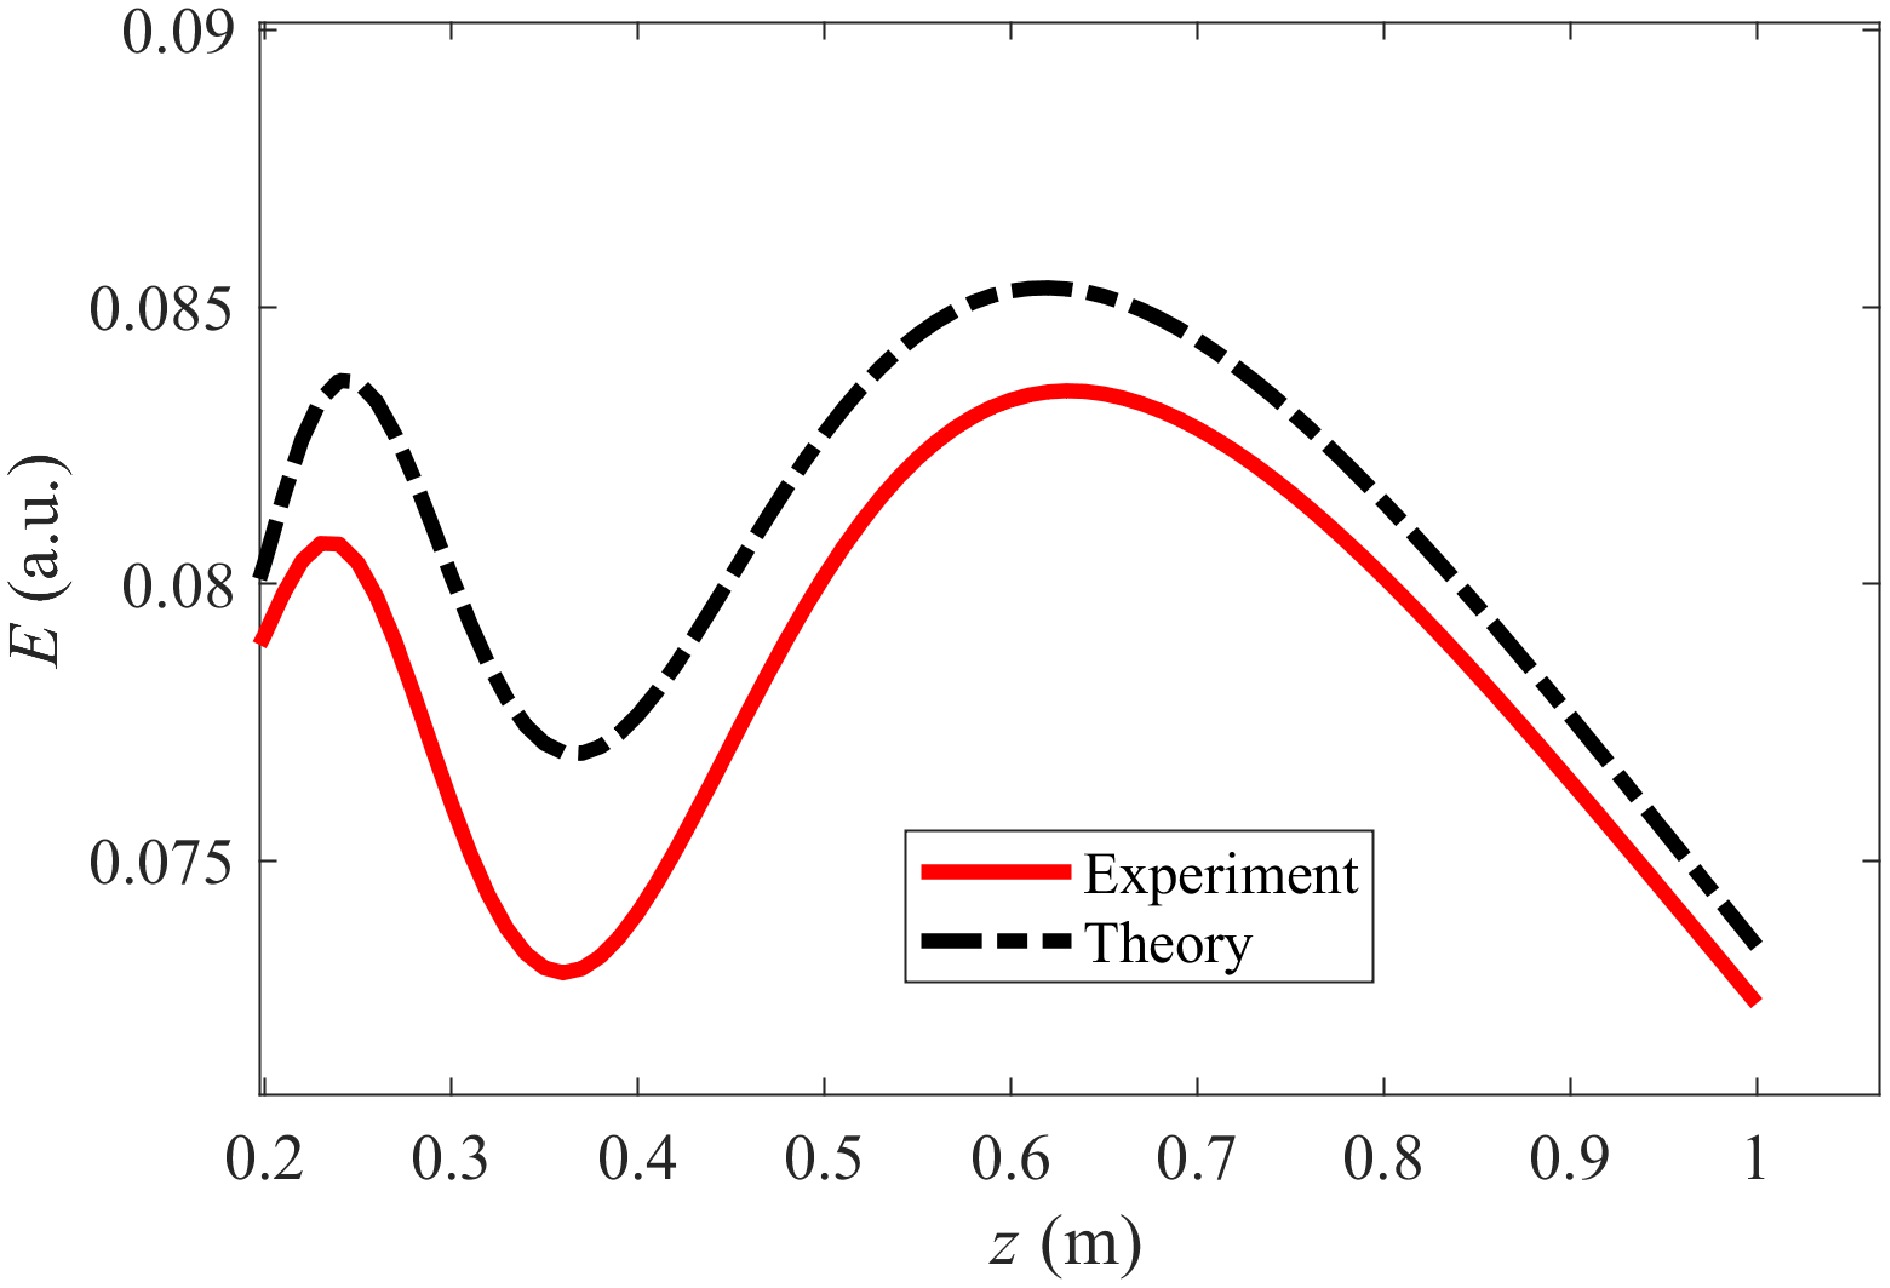
Figure 14.
Distributions of magnitude of electric field along the z-axis obtained by experimental and theoretical results.
-
This paper compares the power transmission properties of focusing beams at different frequencies under the condition of a fixed receiving aperture, and investigates the influences of random phase error and feed horn offsets. Suppose that the feeding efficiency and the receiving efficiency are 0.8, the final transferring efficiency can achieve ~0.5 with the beam efficiency close to 0.8. Thus, a 37 GHz focusing beam has the potential for 100 m microwave wireless charging to UAVs for maintenance of ultra-high voltage transmission towers.
Special thanks to Gansu Electric Power Research Institute for providing the necessary resources and financial support by the Self-Managed Project of State Grid Gansu Electric Power Company (Grant No. 52272225001J).
-
The authors confirm their contributions to the paper as follows: study conception and design: Zhang H; data collection: Zhang E; analysis and interpretation of results: Zhu X; draft manuscript preparation: Guo D. All authors reviewed the results and approved the final version of the manuscript.
-
The datasets generated during and/or analyzed in the current study are available from the corresponding author upon reasonable request.
-
The authors declare that they have no conflict of interest.
- Copyright: © 2026 by the author(s). Published by Maximum Academic Press, Fayetteville, GA. This article is an open access article distributed under Creative Commons Attribution License (CC BY 4.0), visit https://creativecommons.org/licenses/by/4.0/.
-
About this article
Cite this article
Zhu X, Zhang H, Guo D, Zhang E. 2026. Power transmission properties of microwave focusing beams for UAV-based inspection and maintenance of high-voltage power lines. Wireless Power Transfer 13: e022 doi: 10.48130/wpt-0026-0010 

Power transmission properties of microwave focusing beams for UAV-based inspection and maintenance of high-voltage power lines
- Received: 04 October 2025
- Revised: 24 January 2026
- Accepted: 02 March 2026
- Published online: 05 August 2026
Abstract: Unmanned Aerial Vehicles (UAVs) are widely used in the inspection and maintenance of ultra-high voltage transmission towers. When hovering at high altitudes, UAVs can reach a height of 100 m, while the area of their receiving antennas is small. Under these constraints, this paper focuses on the microwave focusing beam for charging UAVs. A theoretical model was adopted under the reasonable maximum adjacent phase shift and cell size, ensuring the validity of the model. The calculation results show that at a frequency of 37 GHz, with a transmitting aperture of 1.7 m and a receiving aperture with a radius of 0.4 m, the beam efficiency is no less than 75% within the range of 30–100 m, and the focused beam can tolerate normally-distributed random initial phase errors with a standard deviation of 15°. By changing the offset feed angle to 1 degree, the beam efficiency remains above 70% within the range of 40–90 m, and slightly moving the feed horn is beneficial for aligning the beam with the UAV.
-
Key words:
- Wireless power transfer /
- Reflect-array antenna /
- Microwave focusing beam /
- UAV charging