-
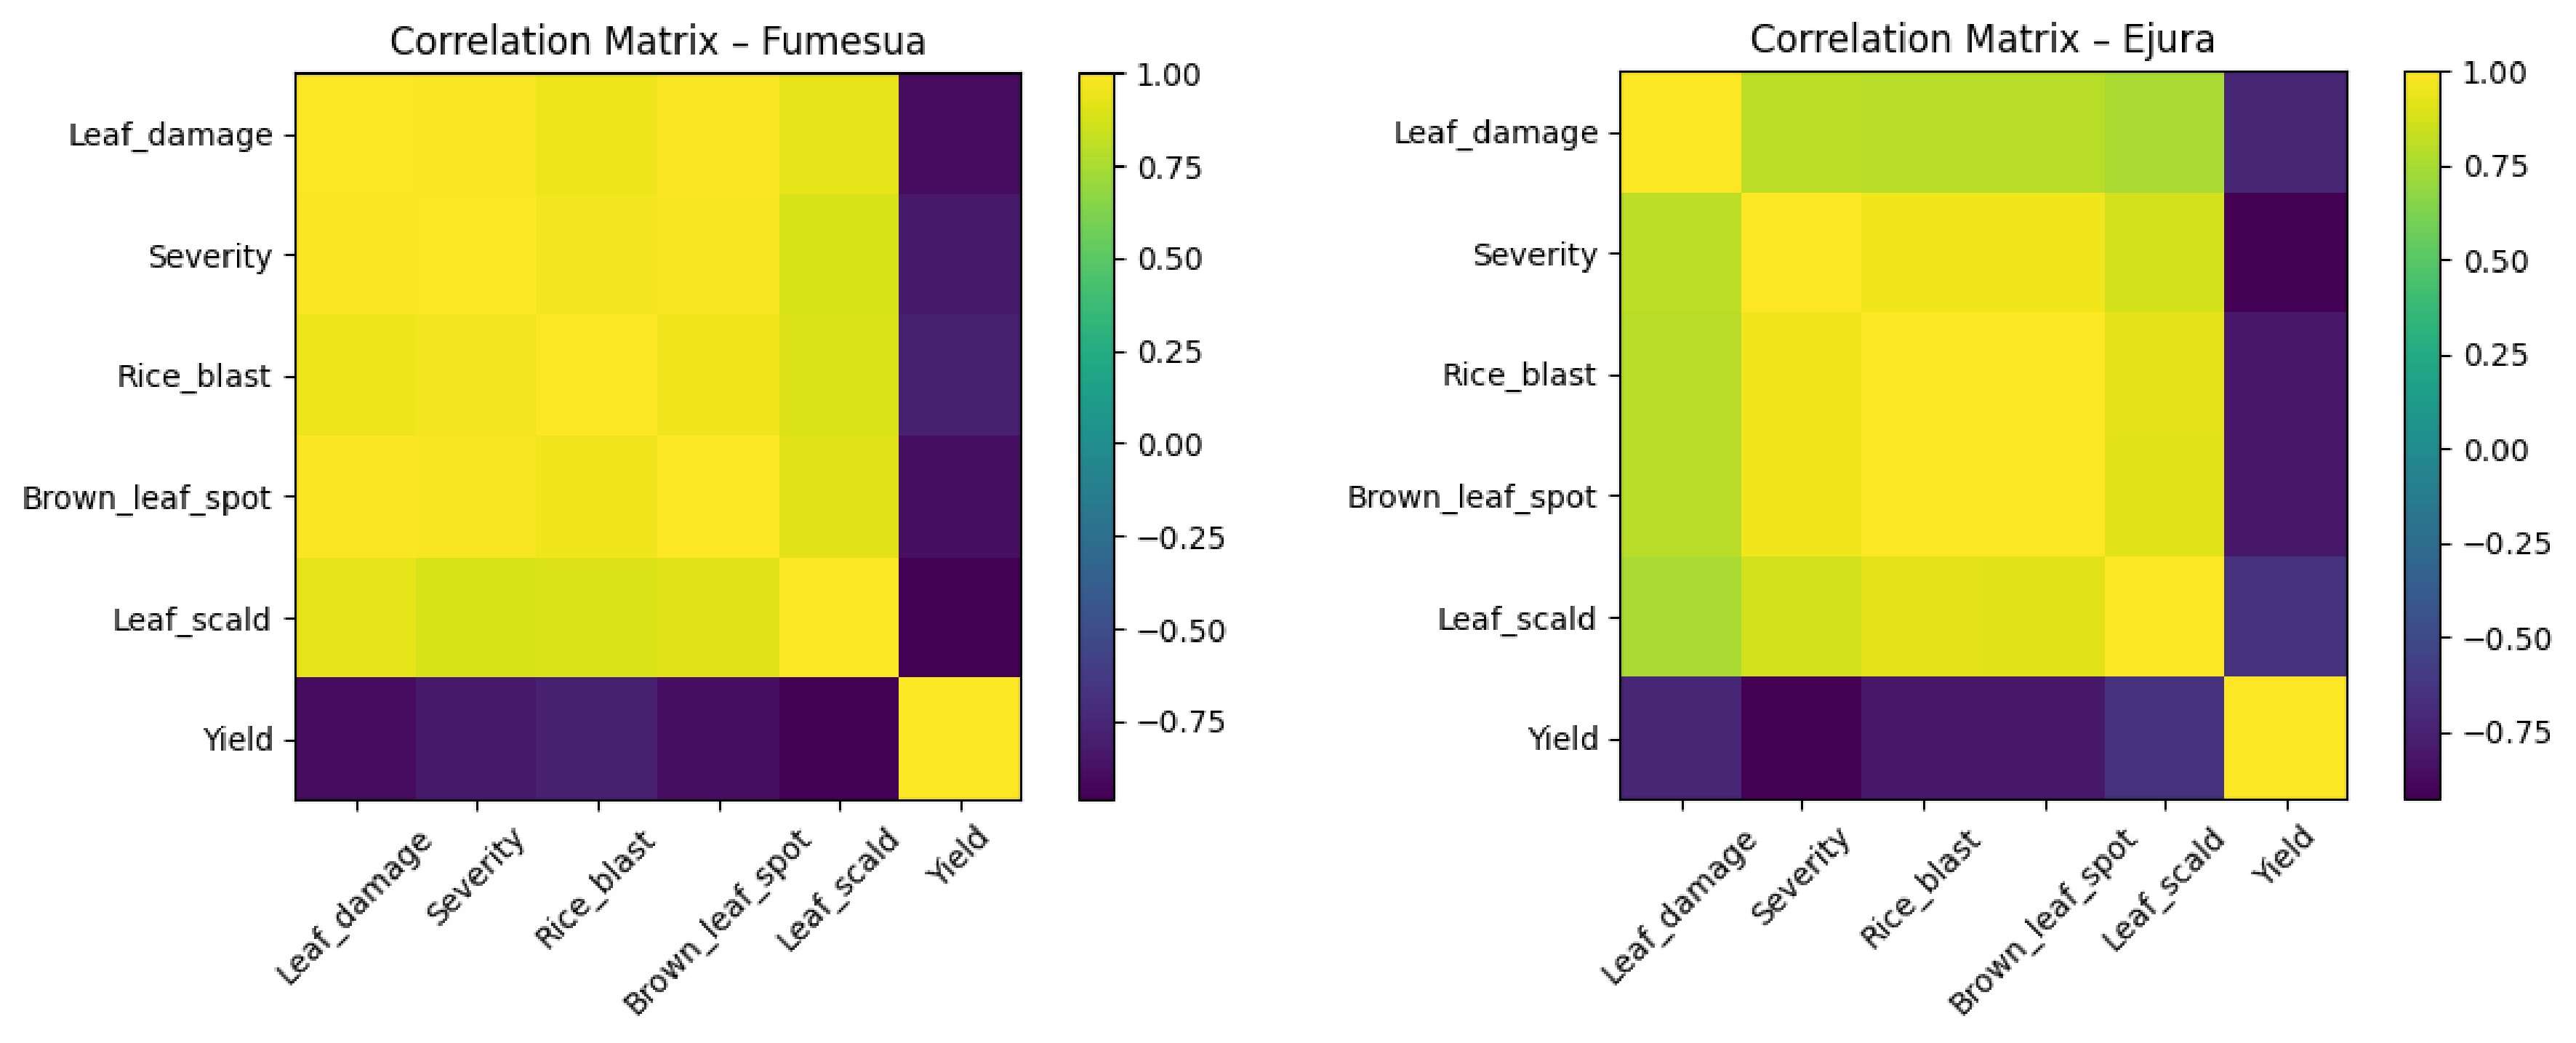
Figure 1.
Pearson correlation analysis of disease indices and grain yield.
-
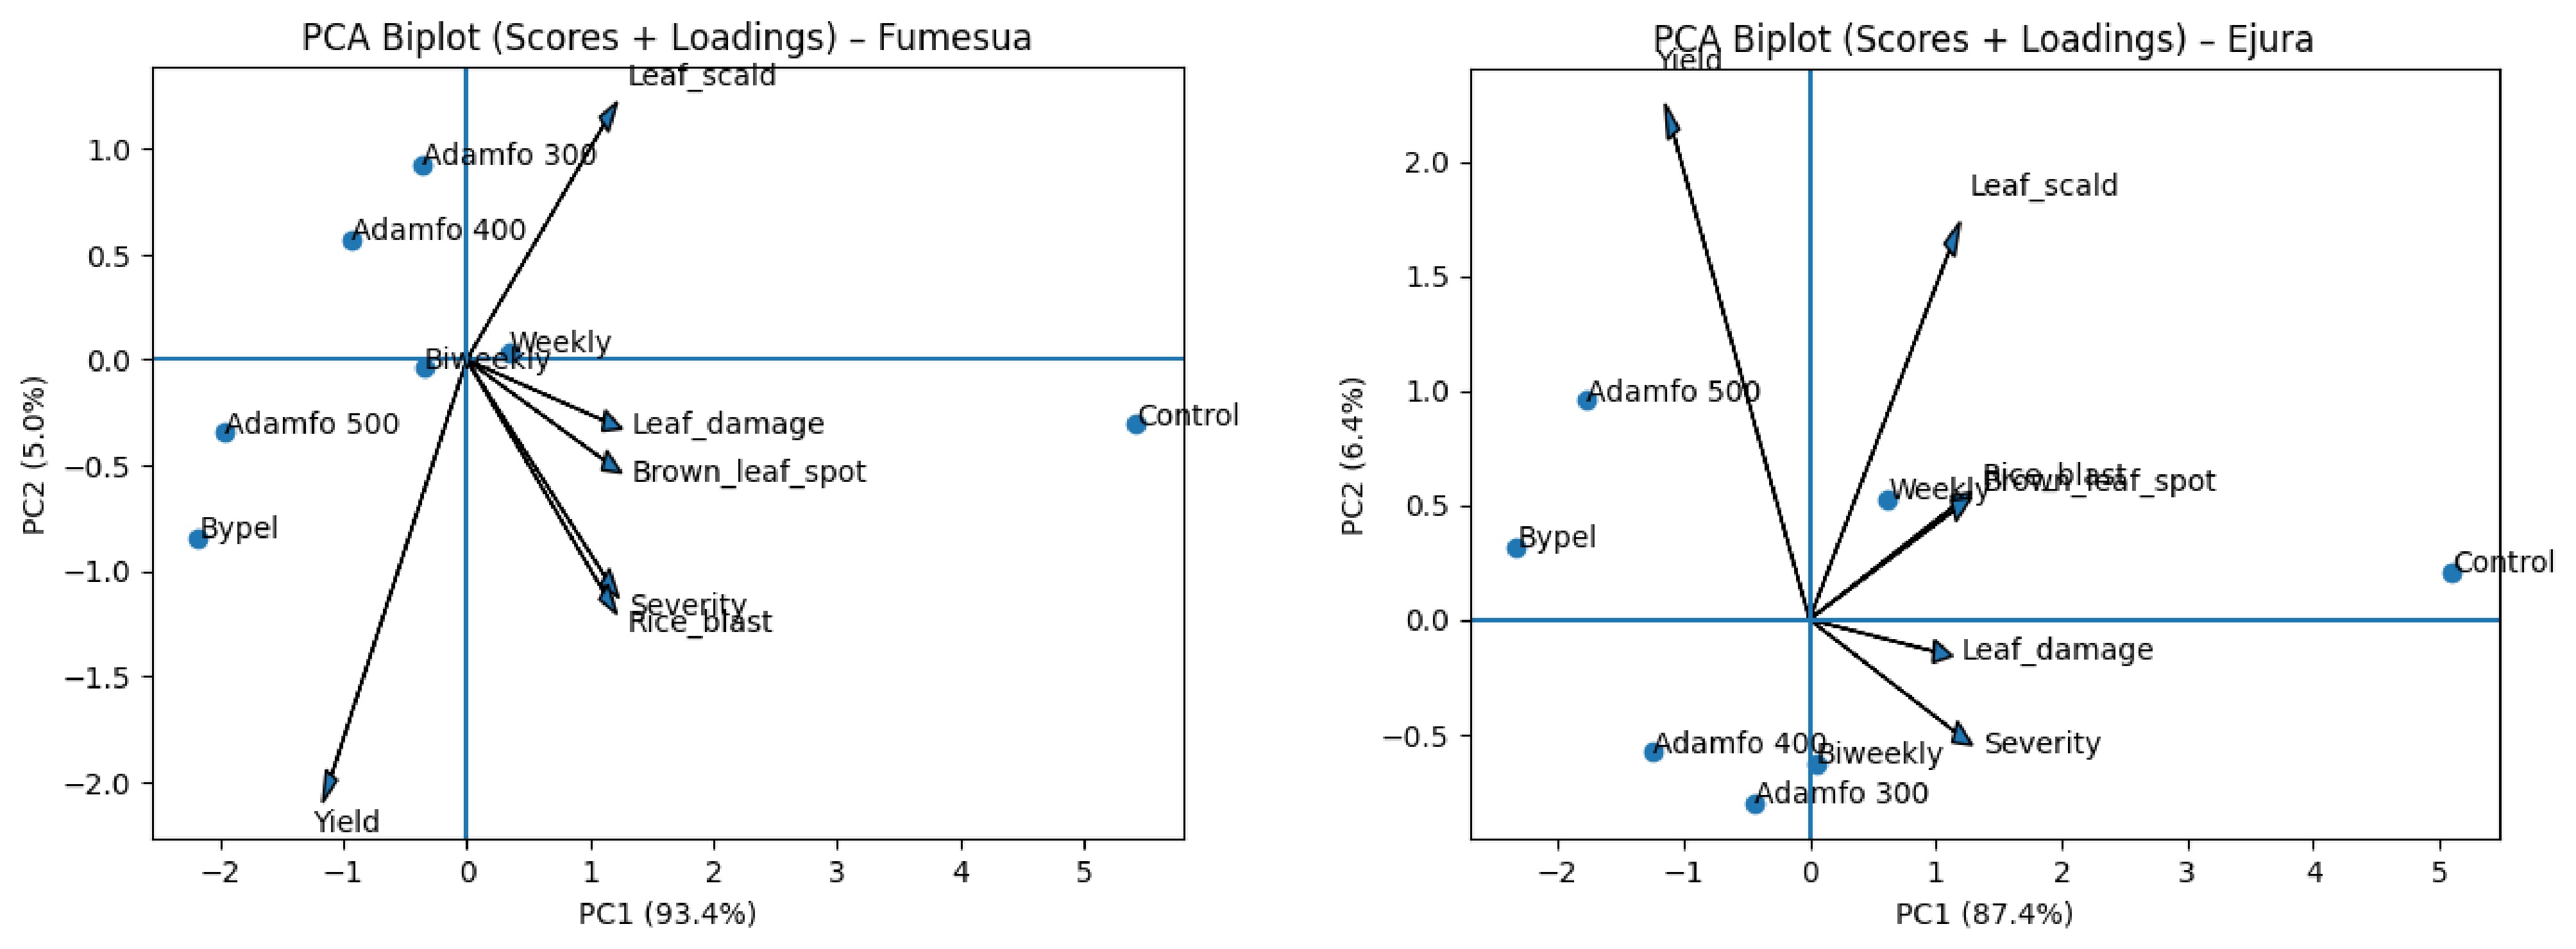
Figure 2.
Principal Component Analysis of disease indices and grain yield.
-
Leaf damage incidence (%) Severity score (scale 1–5) Fumesua Ejura Fumesua Ejura Application interval Weekly 29.93 ± 4.02a 29.36 ± 8.10a 2.99 ± 1.05a 2.80 ± 1.30a Bi-weekly 31.07 ± 9.93a 25.71 ± 9.36a 3.08 ± 1.16a 2.73 ± 1.43a Application dose Control at 0 mL·100 L−1 water 66.43 ± 8.94a 32.18 ± 6.56a 5.25 ± 1.38a 4.69 ± 1.12a Adamfo Pa at 300 mL·100 L−1 of water 28.04 ± 8.03b 17.41 ± 5.33b 2.53 ± 0.13b 2.74 ± 0.70b Adamfo Pa at 400 mL·100 L−1 of water 21.59 ± 7.76bc 14.44 ± 3.76bc 2.50 ± 0.97b 2.55 ± 0.83bc Adamfo Pa at 500 mL·100 L−1 of water 18.80 ± 6.70bc 11.94 ± 1.92c 2.47 ± 0.91b 2.02 ± 0.81cd Reference biopesticide (Bypel) 17.64 ± 7.50c 11.72 ± 4.12c 2.42 ± 0.82b 1.83 ± 0.96d Results are presented as mean ± standard deviation (SD) values. Mean followed by the same letter(s) within a column are not significantly different according to Tukey's Honest Significant Difference (HSD) test at 5% probability level. Table 1.
Effect of Adamfo Pa on rice insect pests leaf damage, and severity.
-
Rice blast Brown leaf spot Leaf scald Fumesua Ejura Fumesua Ejura Fumesua Ejura Application interval Weekly 28.59 ± 16.9a 27.33 ± 16.9a 31.74 ± 13.6a 26.33 ± 13.7a 9.36 ± 11.5a 9.00 ± 7.1a Bi-weekly 20.90 ± 14.1b 26.07 ± 17.6a 28.90 ± 13.2a 25.73 ± 17.1a 6.90 ± 7.9a 4.53 ± 5.3a Application dose Control at 0 mL·100 L−1 of water 47.67 ± 16.9a 57.67 ± 9.5a 51.37 ± 10.3a 54.67 ± 6.8a 18.64 ± 11.7a 14.17 ± 8.6a Adamfo Pa at 300 mL·100 L−1 of water 18.75 ± 13.6b 20.83 ± 4.9b 28.50 ± 8.3b 20.83 ± 2.0b 8.50 ± 7.9ab 5.50 ± 4.6ab Adamfo Pa at 400 mL·100 L−1 of water 20.25 ± 5.4b 18.33 ± 5.2b 24.00 ± 7.0b 18.00 ± 2.5b 8.75 ± 8.3ab 4.17 ± 4.9ab Adamfo Pa at 500 mL·100 L−1 of water 16.54 ± 9.0b 19.17 ± 5.9b 24.97 ± 7.6b 19.17 ± 6.6b 2.26 ± 4.8b 3.67 ± 3.0ab Reference chemical (Mancozeb) 20.50 ± 5.5b 17.50 ± 6.9b 22.75 ± 4.8b 17.50 ± 2.7b 2.50 ± 4.6b 3.33 ± 2.6b Results are presented as mean ± standard deviation (SD) values. Means followed by the same letter(s) within a column are not significantly different according to Tukey's Honest Significant Difference (HSD) test at 5% probability level. Table 2.
Effect of Adamfo Pa on rice disease incidence.
-
Grain yield (kg·ha−1) Fumesua Ejura Application Interval Weekly 5,497.00 ± 769.9a 5,626.00 ± 904.7a Bi-weekly 5,655.00 ± 753.7a 5,296.00 ± 786.1b Application dose Control at 0 mL·100 L−1 of water 4,539.00 ± 340.2d 4,377.00 ± 39.4c Adamfo Pa at 300 mL·100 L−1 water 5,266.00 ± 259.5bc 5,105.00 ± 463.4b Adamfo Pa at 400 mL·100 L−1 water 5,624.00 ± 312.9b 5,463.00 ± 502.7b Adamfo Pa at 500 mL·100 L−1 water 6,058.00 ± 669.3ab 6,213.00 ± 1020.5a Reference biopesticide 6,394.00 ± 447.8a 6,149.00 ± 741.3a Results are presented as means ± standard deviation (SD) values. Means followed by the same letter(s) within a column are not significantly different according to Tukey's Honest Significant Difference (HSD) test at 5% probability level. Table 3.
Effect of Adamfo Pa on rice grain yield.
Figures
(2)
Tables
(3)