-
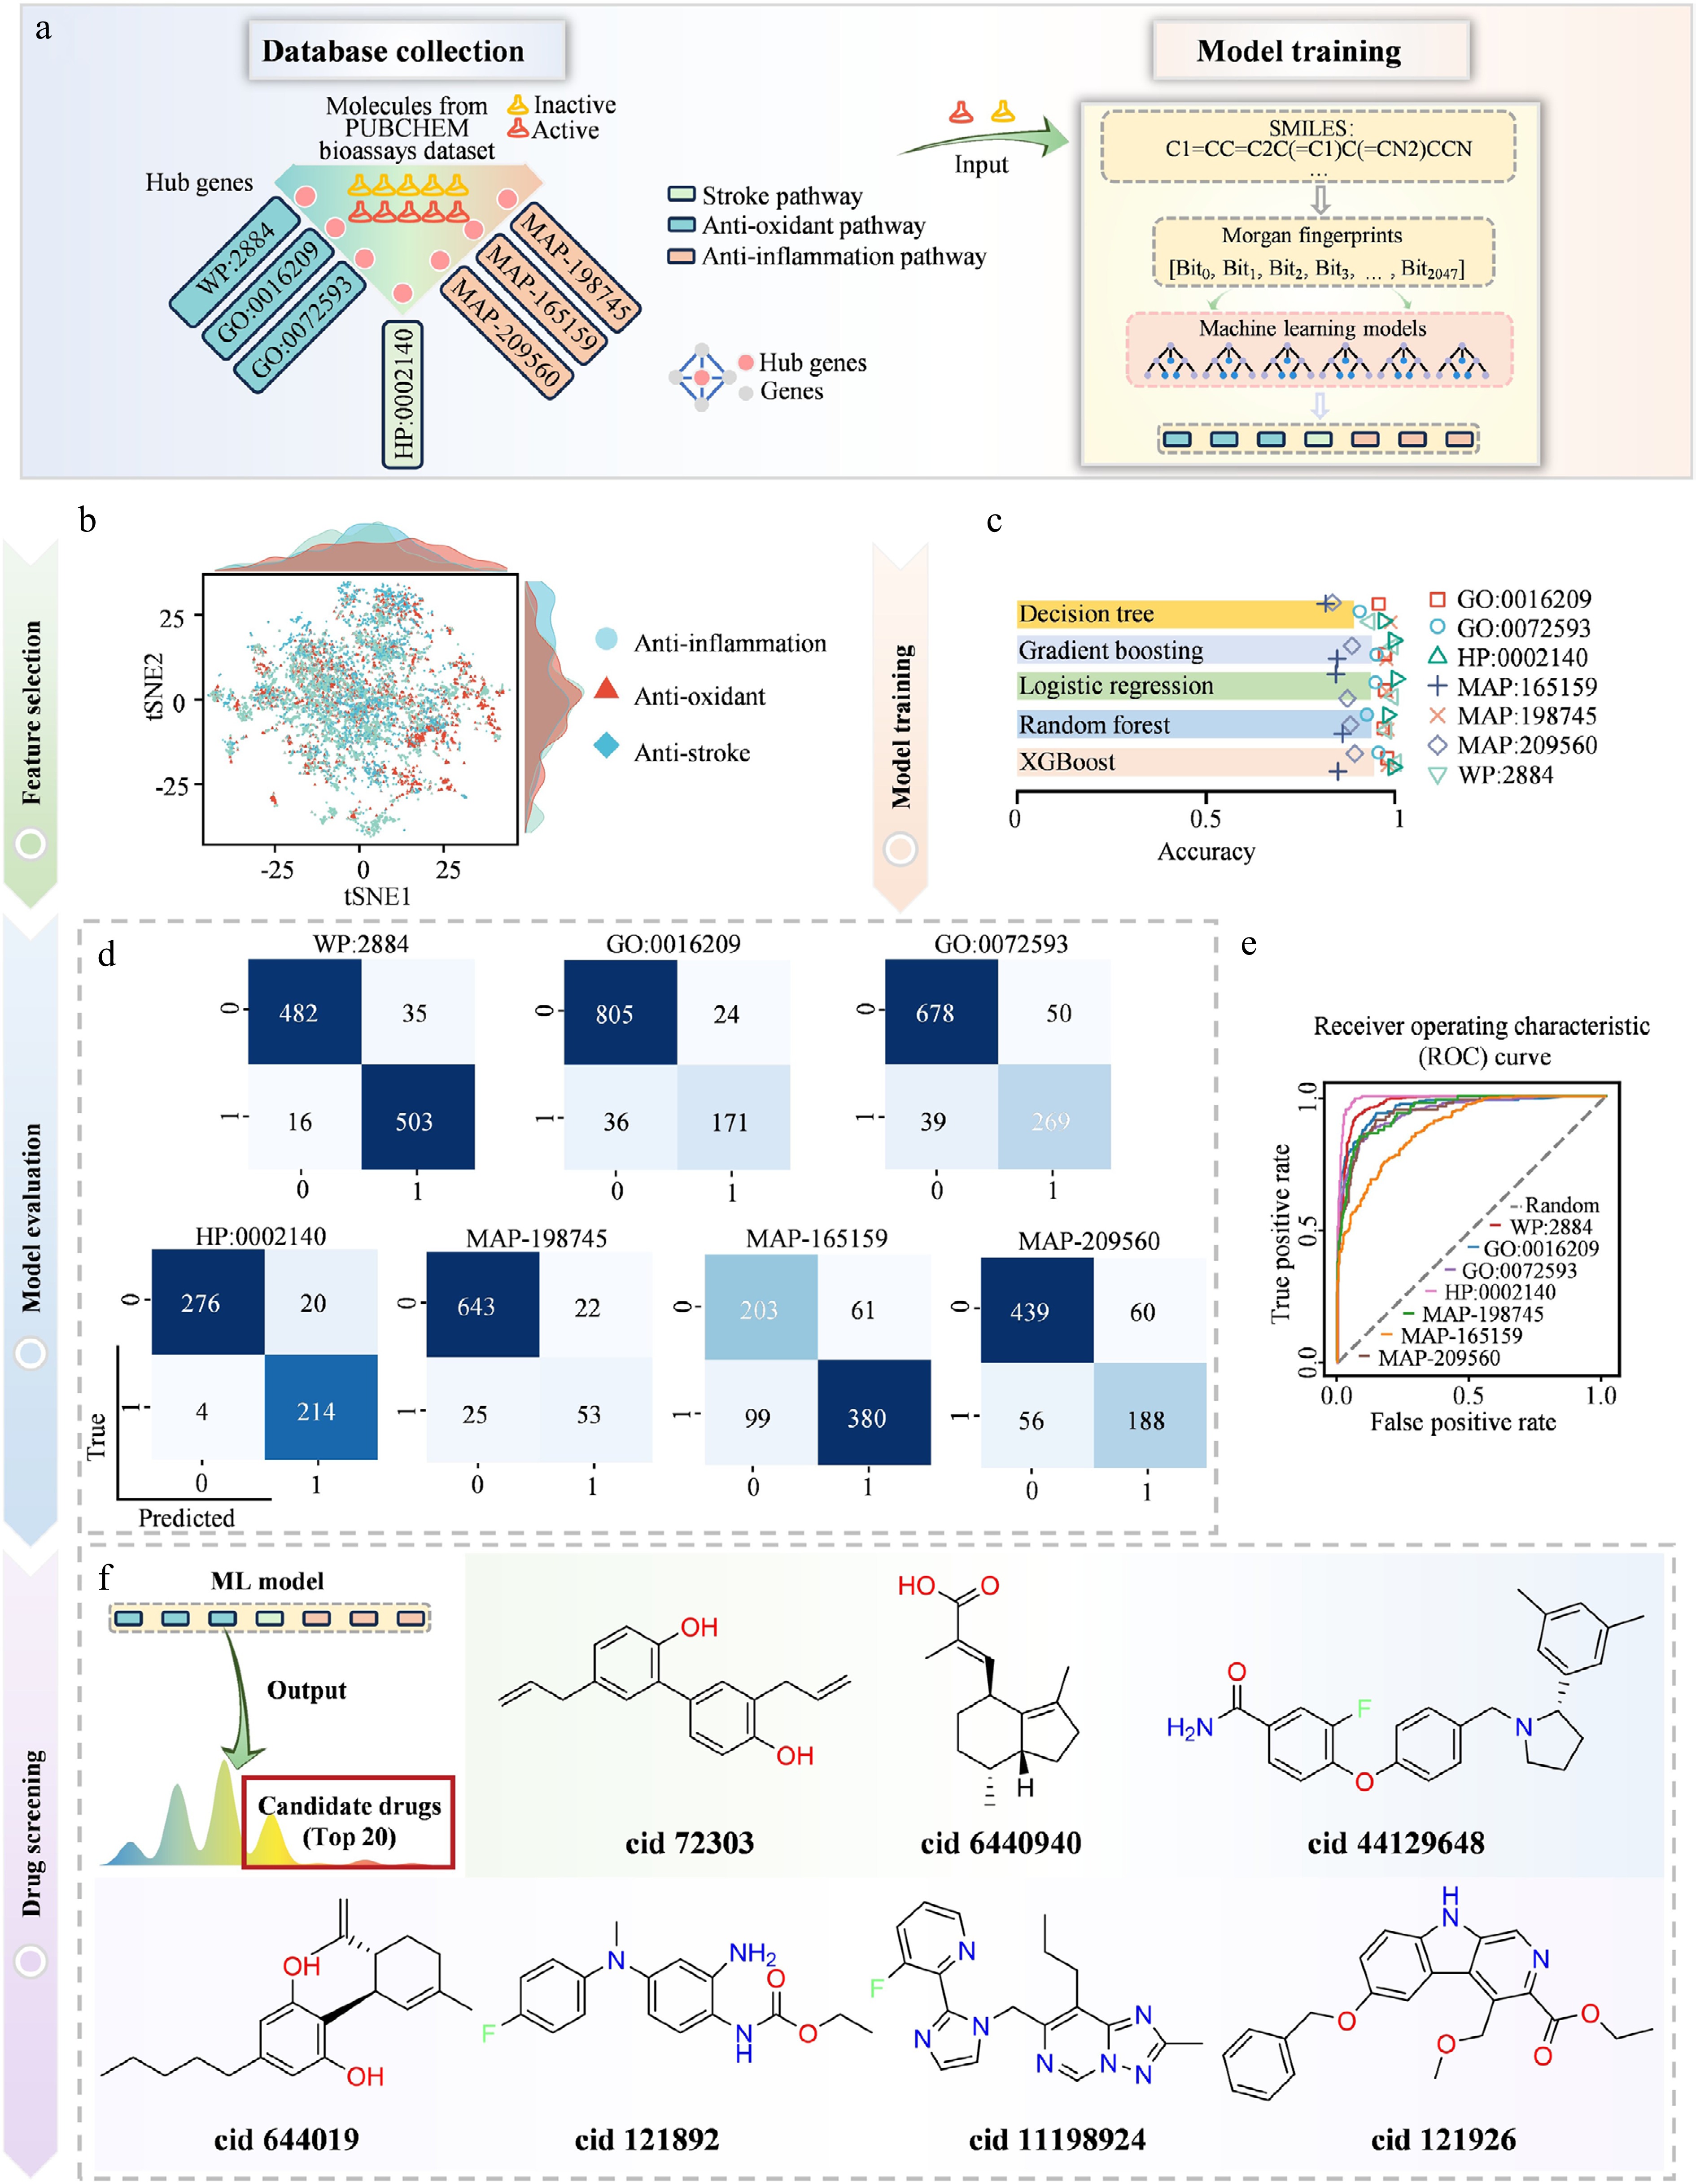
Figure 1.
The development of an ML model involving the inclusion of stroke-related biological processes. (a) Structure of data gathering and architecture of the compound-pathway classifier. (b) t-SNE plot indicating the spread of the training-set molecules that were used to generate a good-quality ML model to predict the anti-IS capabilities of compounds. (c) Comparative evaluation of five ML algorithms in tasks related to pathway classification on the held-out test set. (d) Confusion matrix of the highest-performing models of each stroke-related pathway, assessed on the held-out test set. (e) The held-out test set ROC curves show good discrimination properties (average ROC AUC > 0.89). (f) The major compounds forecasted by the ML models.
-
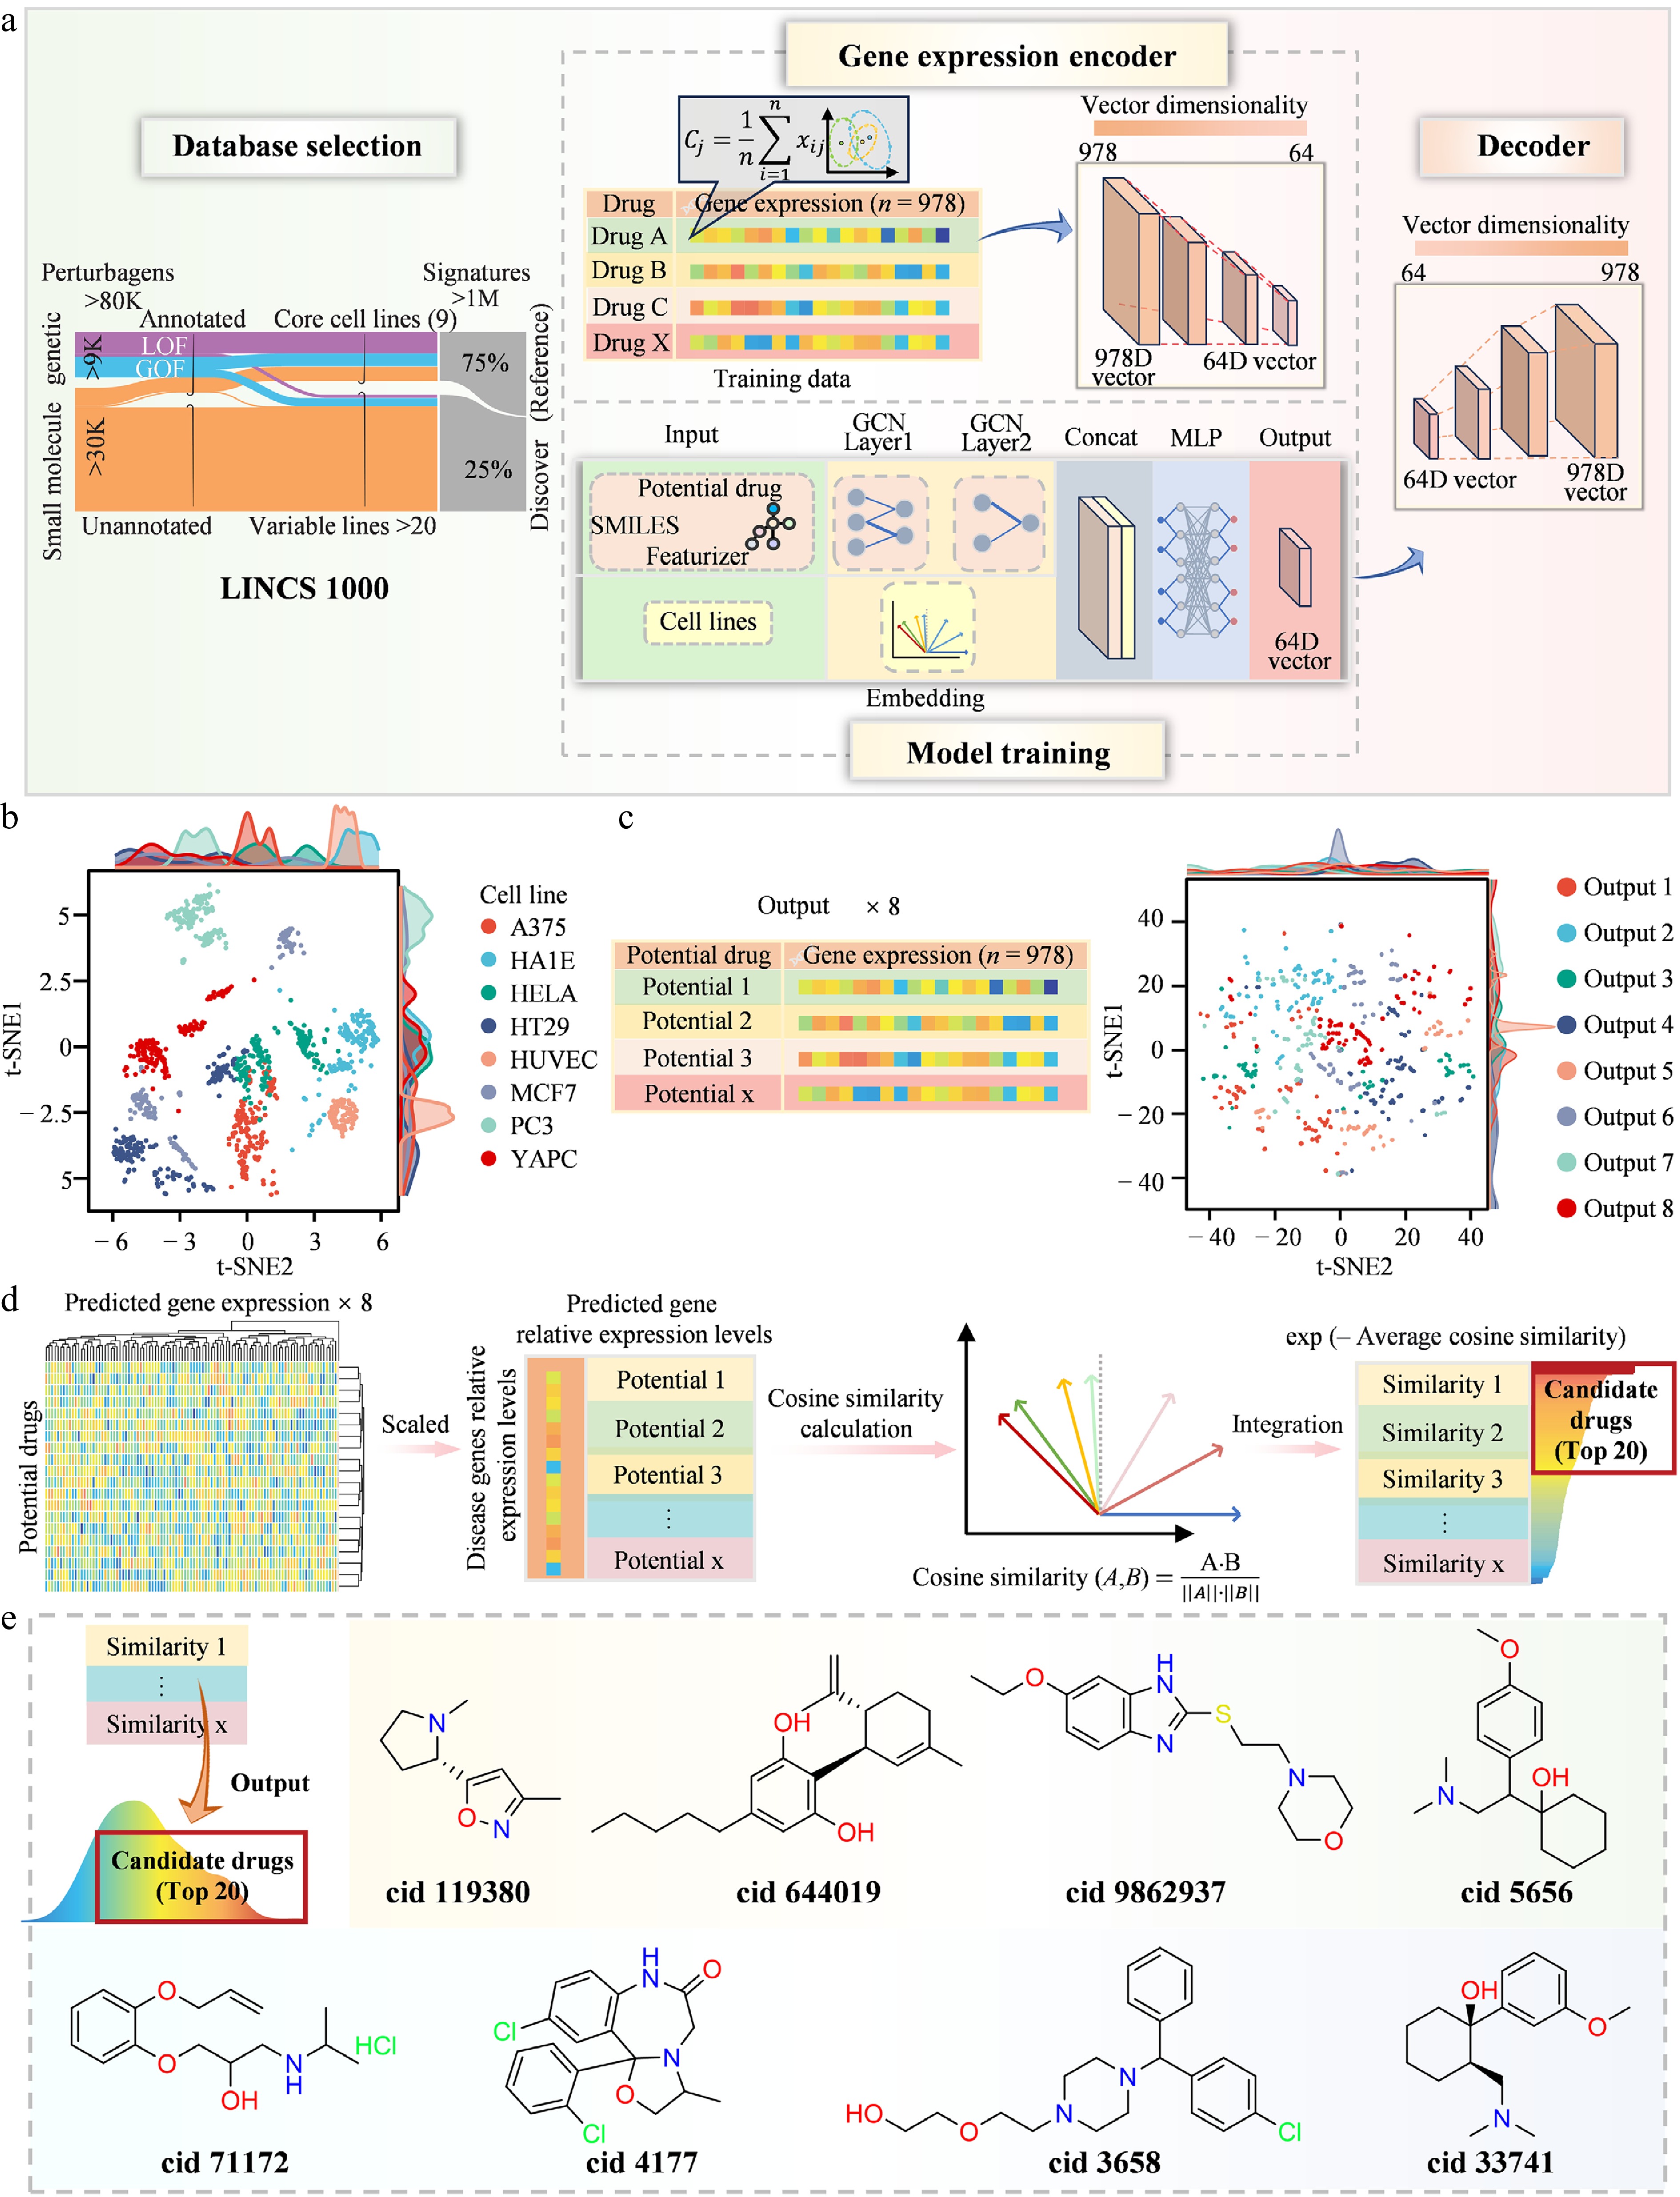
Figure 2.
The development and application of the LGE-GNN model predicting gene expression profiles. (a) Flowchart illustrating the data collection process and model architecture of the LGE-GNN for gene expression prediction. (b) t-SNE plot showing the distribution of compounds from different cell lines in the training set. (c) t-SNE plot of predicted transcriptomic profiles for anxiolytics, generated from repeated LGE-GNN predictions. (d) Pipeline of the drug screening workflow for anti-IS candidates using the LGE-GNN model. (e) Representative top-ranked candidate compounds identified by the LGE-GNN model.
-
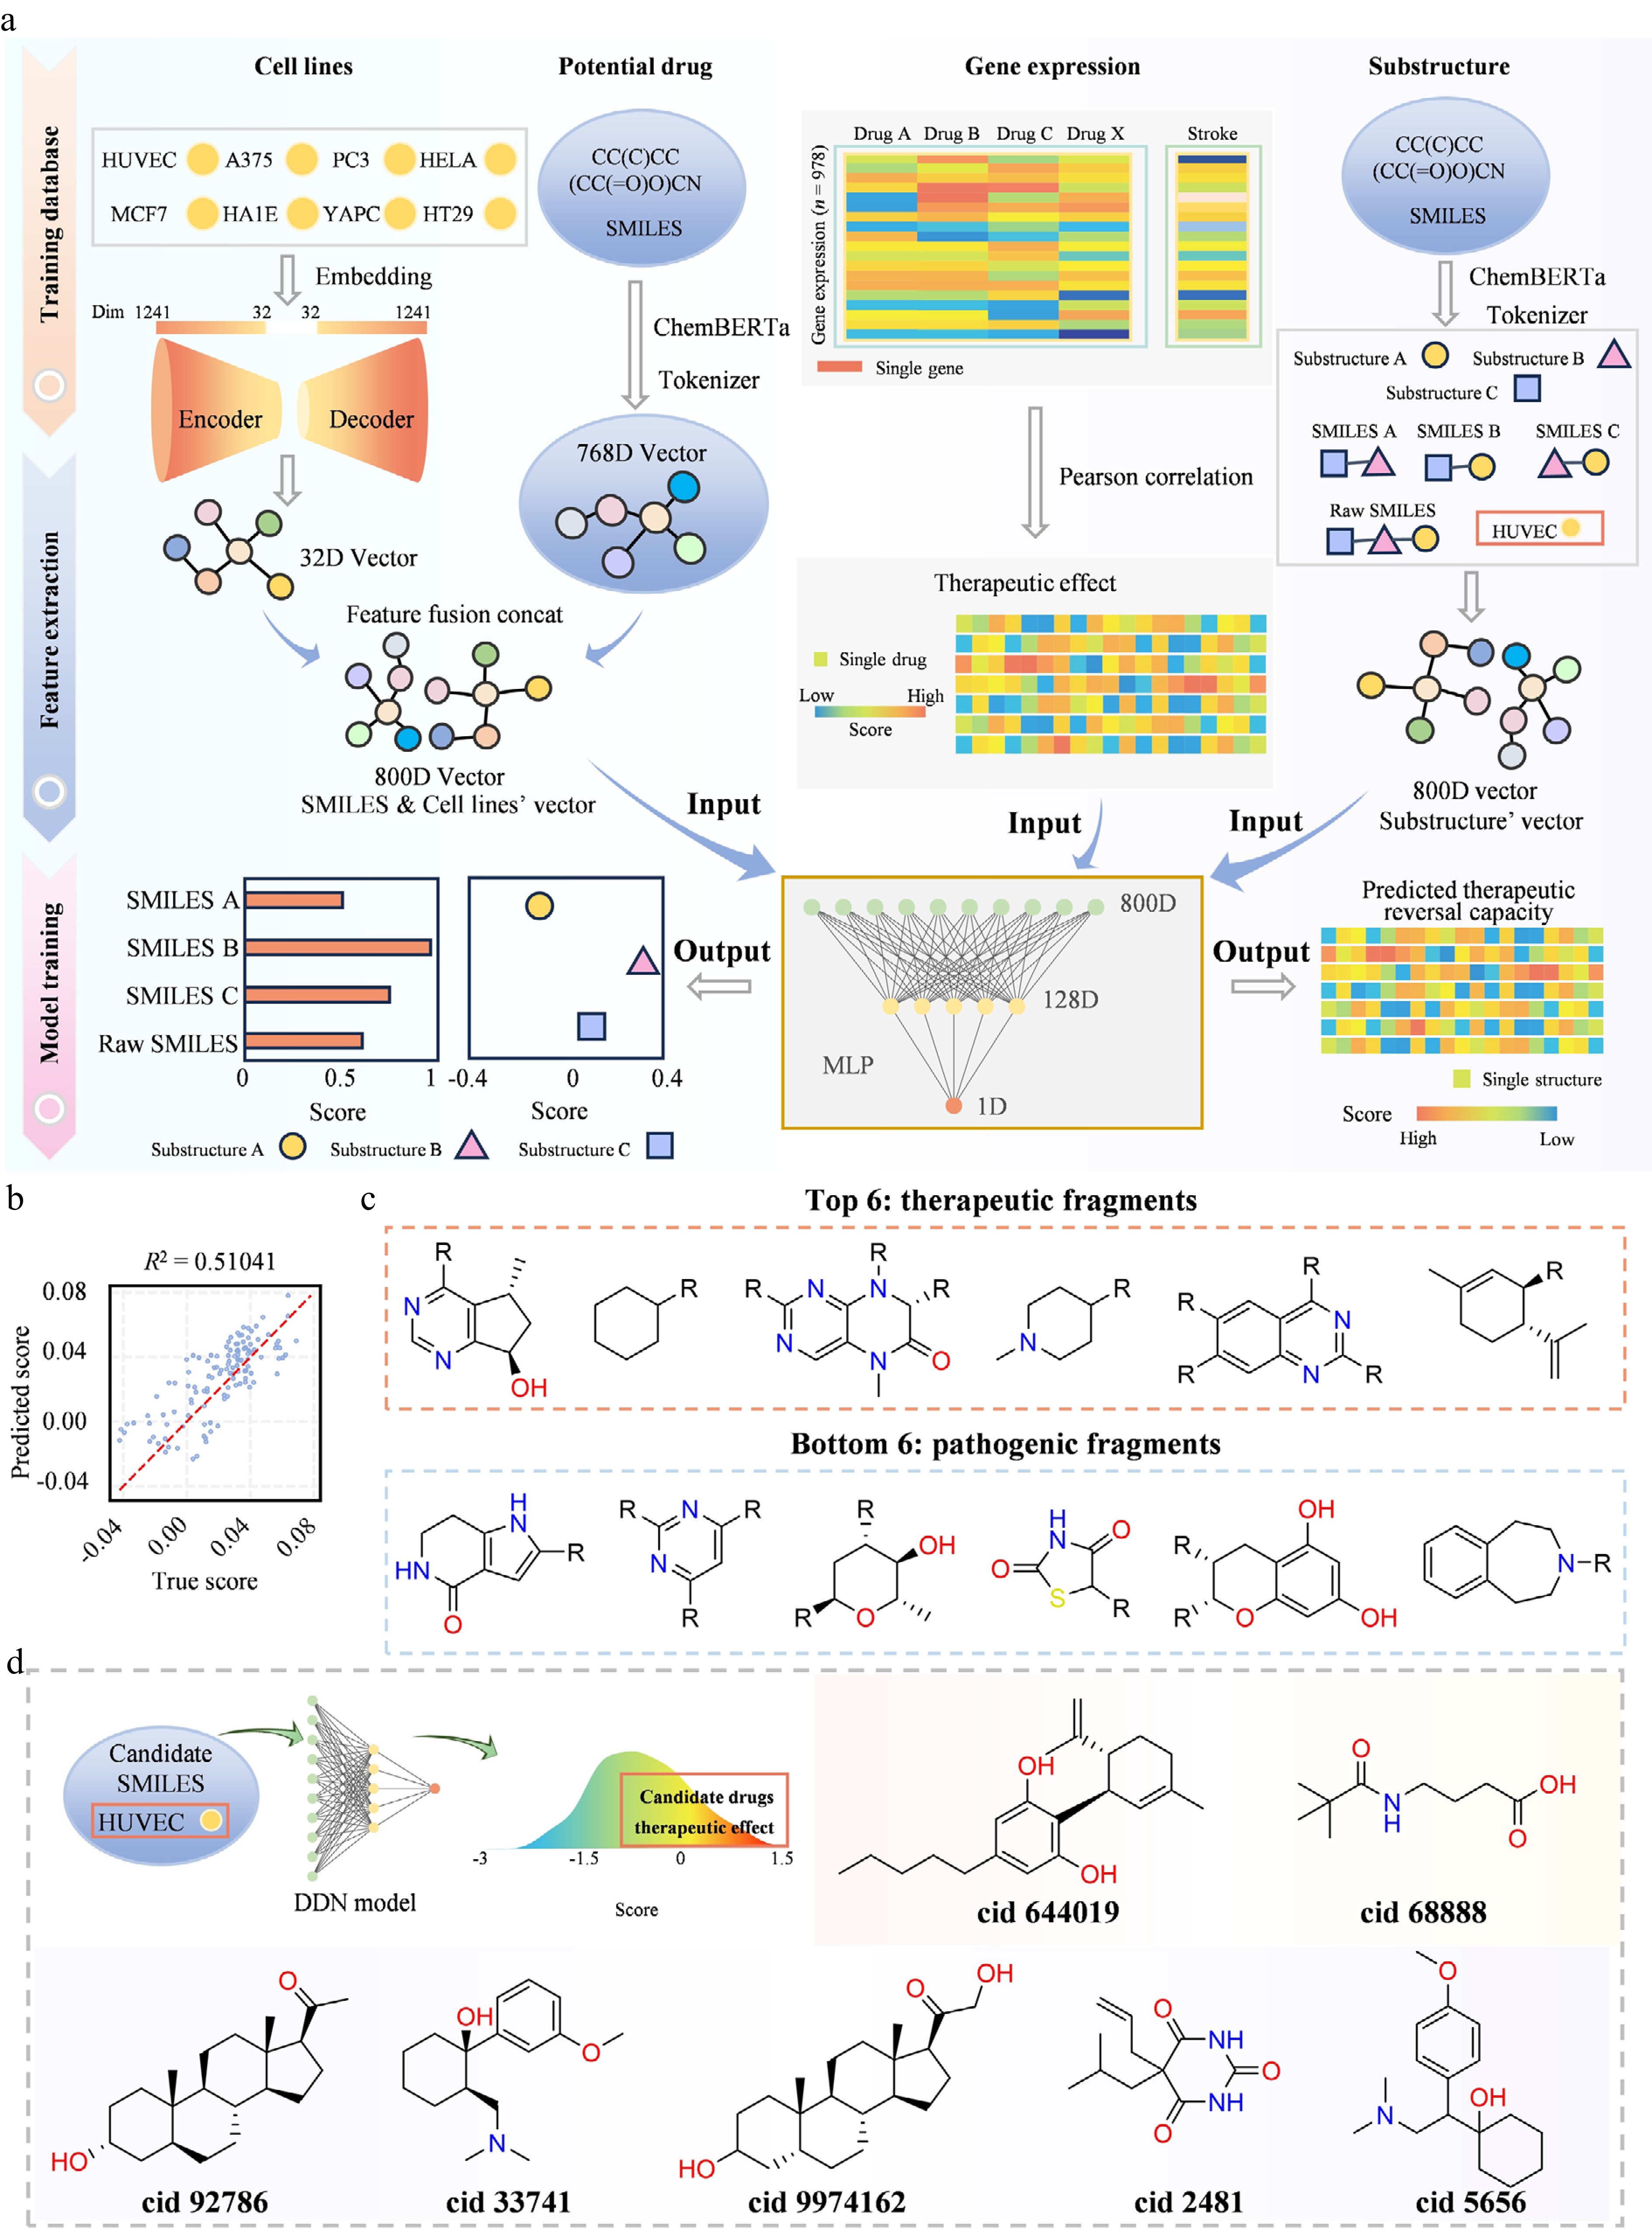
Figure 3.
The establishment and application of the DDN model predicting bioactive substructure for IS. (a) Schematic overview of the DDN model architecture. (b) Scatter plot illustrating predicted vs true reversal scores for compound-cell line pairs in the held-out test set. (c) Representative high-scoring therapeutic and low-scoring pathogenic substructures for IS. (d) Example compounds prioritized by the DDN model.
-
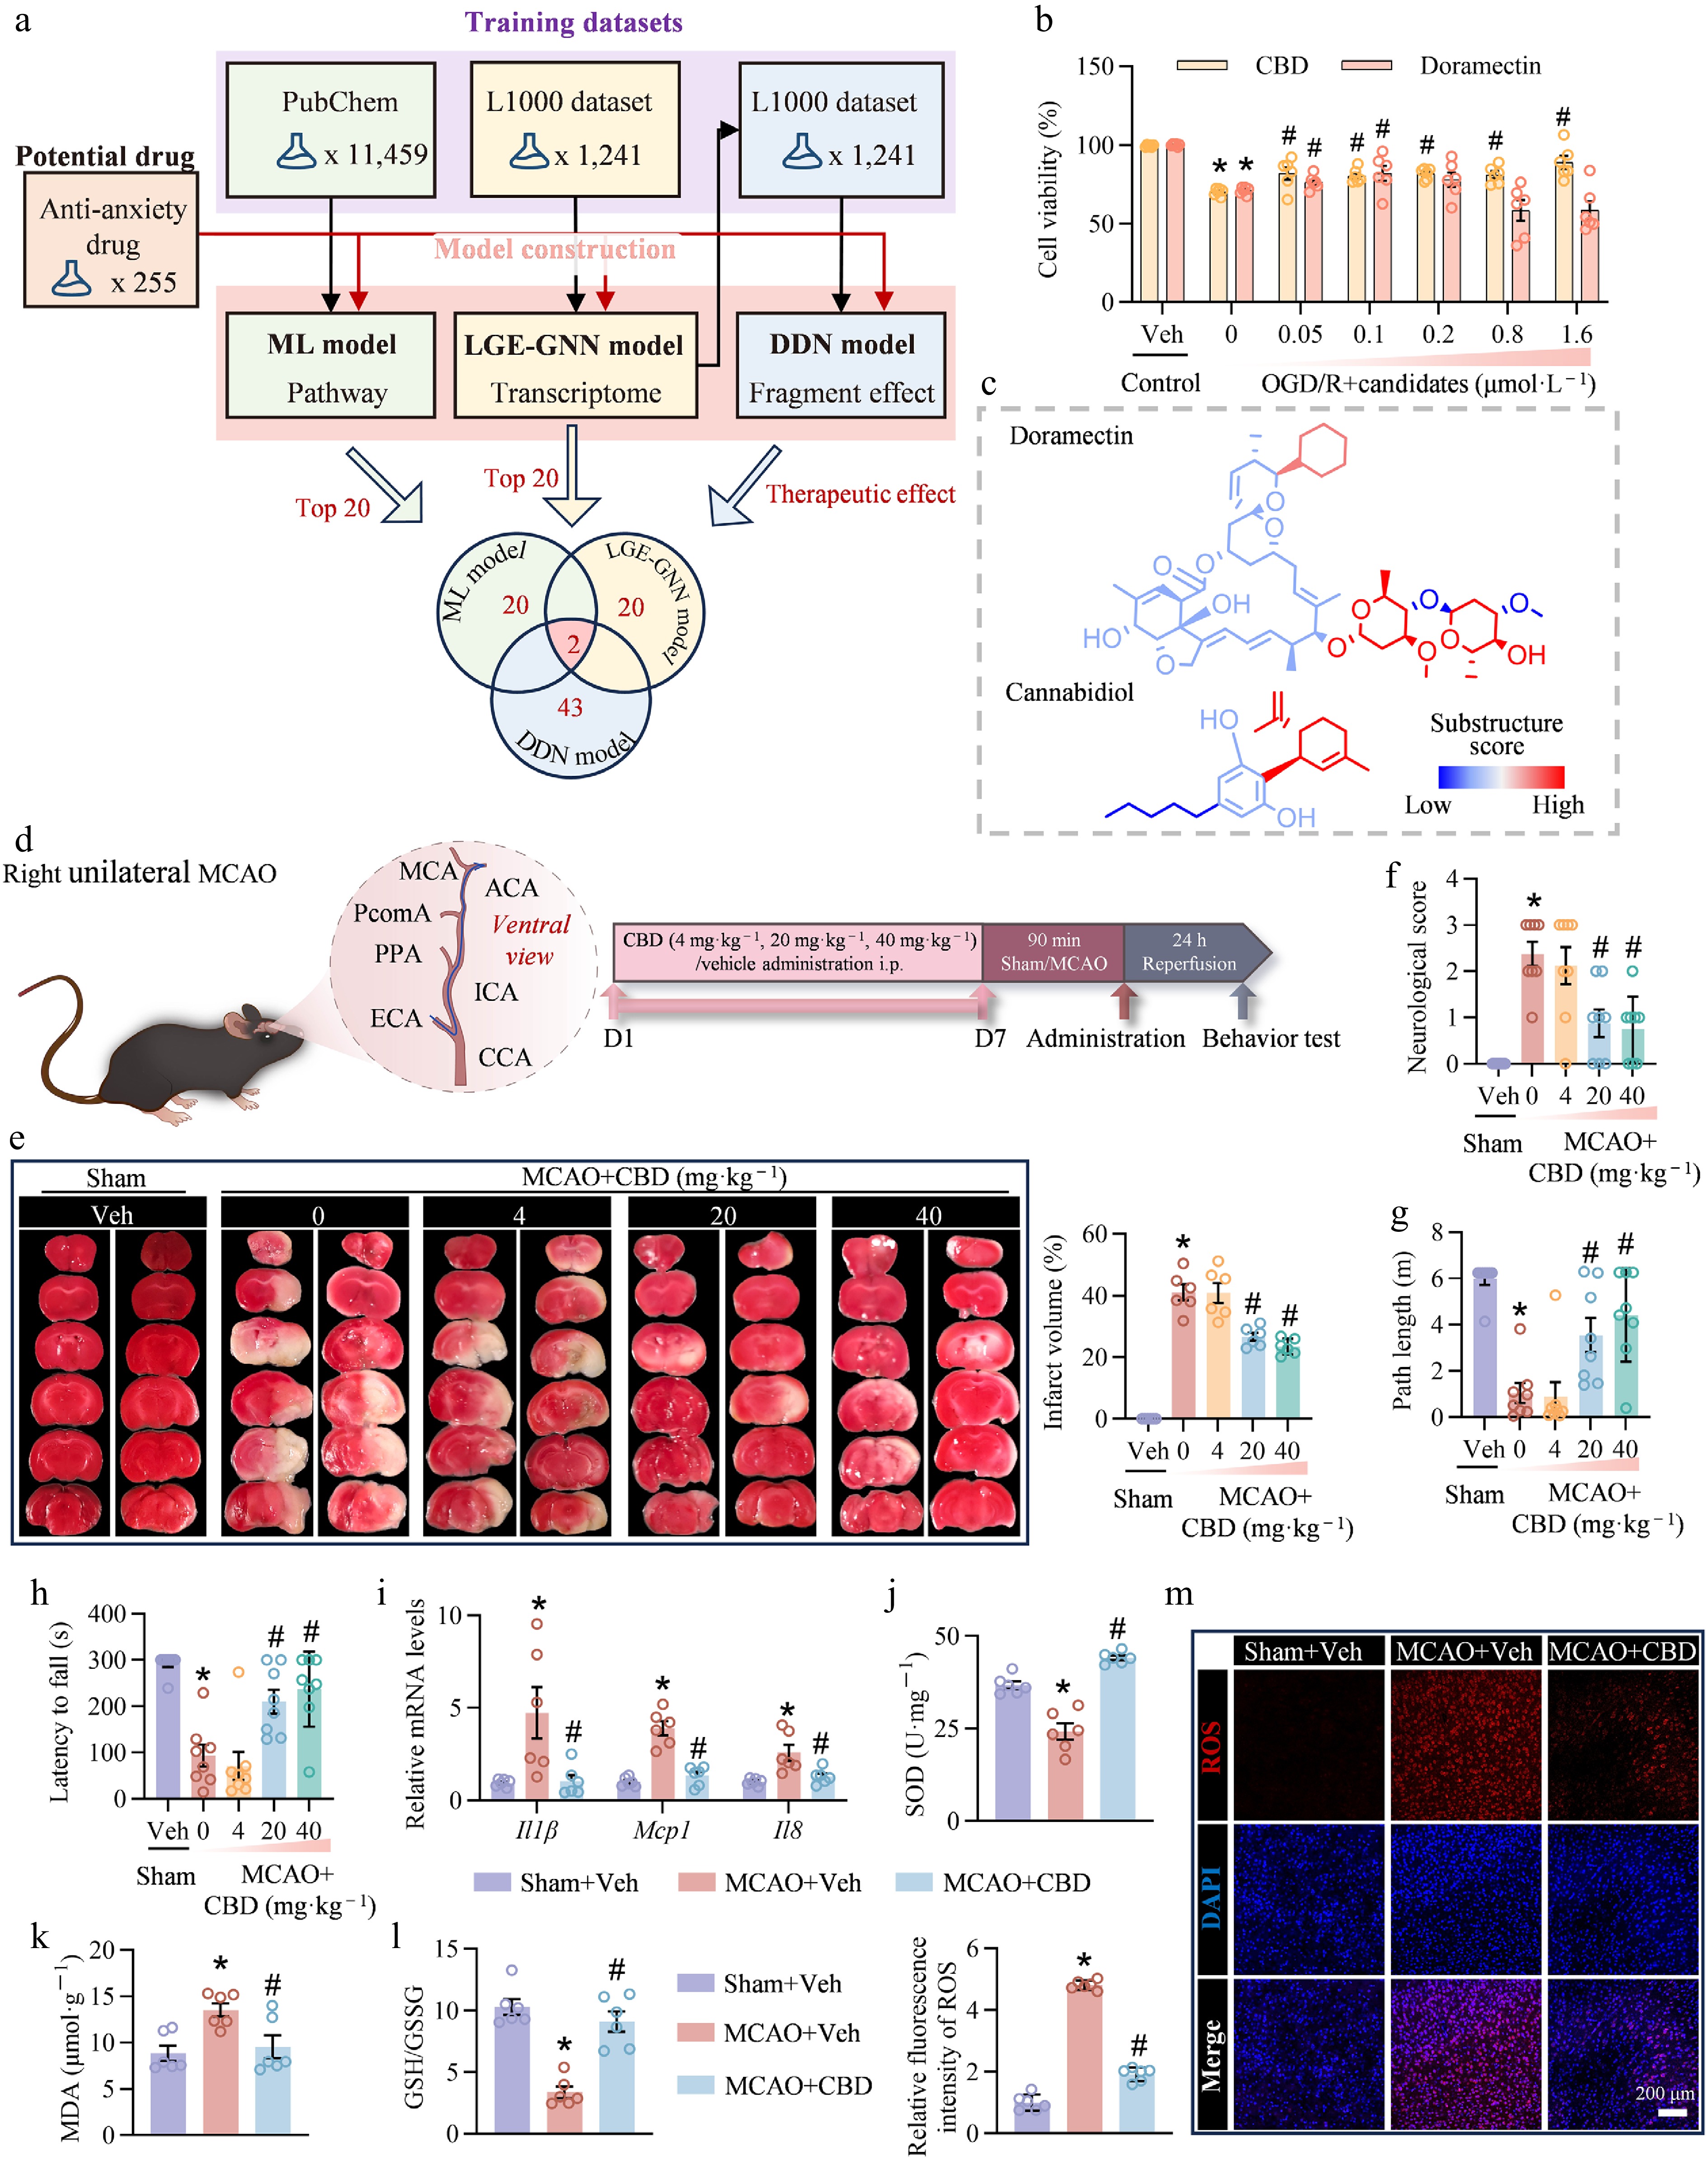
Figure 4.
AI-aided drug repurposing identifying CBD as a promising therapeutic candidate for IS. (a) Two candidates identified by the ML model, LGE-GNN model, and DDN model. (b) HT22 cells subjected to OGD/R were employed to evaluate the anti-IS efficacy of two candidates (n = 6 per group). (c) Fragment-level visualization based on the predicted therapeutic scores. Each compound was decomposed into structural fragments using the BRICS algorithm. Fragments were colored according to their individual contribution scores, using a blue-to-red gradient: blue indicates lower therapeutic potential, while red highlights fragments with higher predicted therapeutic efficacy. (d) Schematic of the animal experimental design. (e)–(h) CBD showed a threshold-like protective effect across the tested doses. These data were used to identify a working dose for subsequent mechanistic studies and were not intended to define a formal dose-response curve. (e) Brain infarction volume was determined by TTC staining and the analysis of brain infarction volume (n = 6 per group). (f) Assessment of short-term neurological function by Longa neurological score (n = 8 per group). (g) Total distance traveled in the rotarod test (n = 8 per group). (h) Latency to fall from the rotating rod (n = 8 per group). (i) Relative mRNA levels of inflammatory factors (Il1β, Mcp1, and Il8) (n = 6 per group). (j)–(l) SOD activity, MDA levels, and GSH/GSSG levels at 24 h after MCAO (n = 6 per group). (m) Representative fluorescence micrographs and the statistics of DHE staining in perilesional cortex (scale bar = 200 μm, n = 6 per group). Data are presented as mean ± SEM. * P < 0.05 compared to sham group or control group; # P < 0.05 compared to MCAO group or OGD/R group.
-
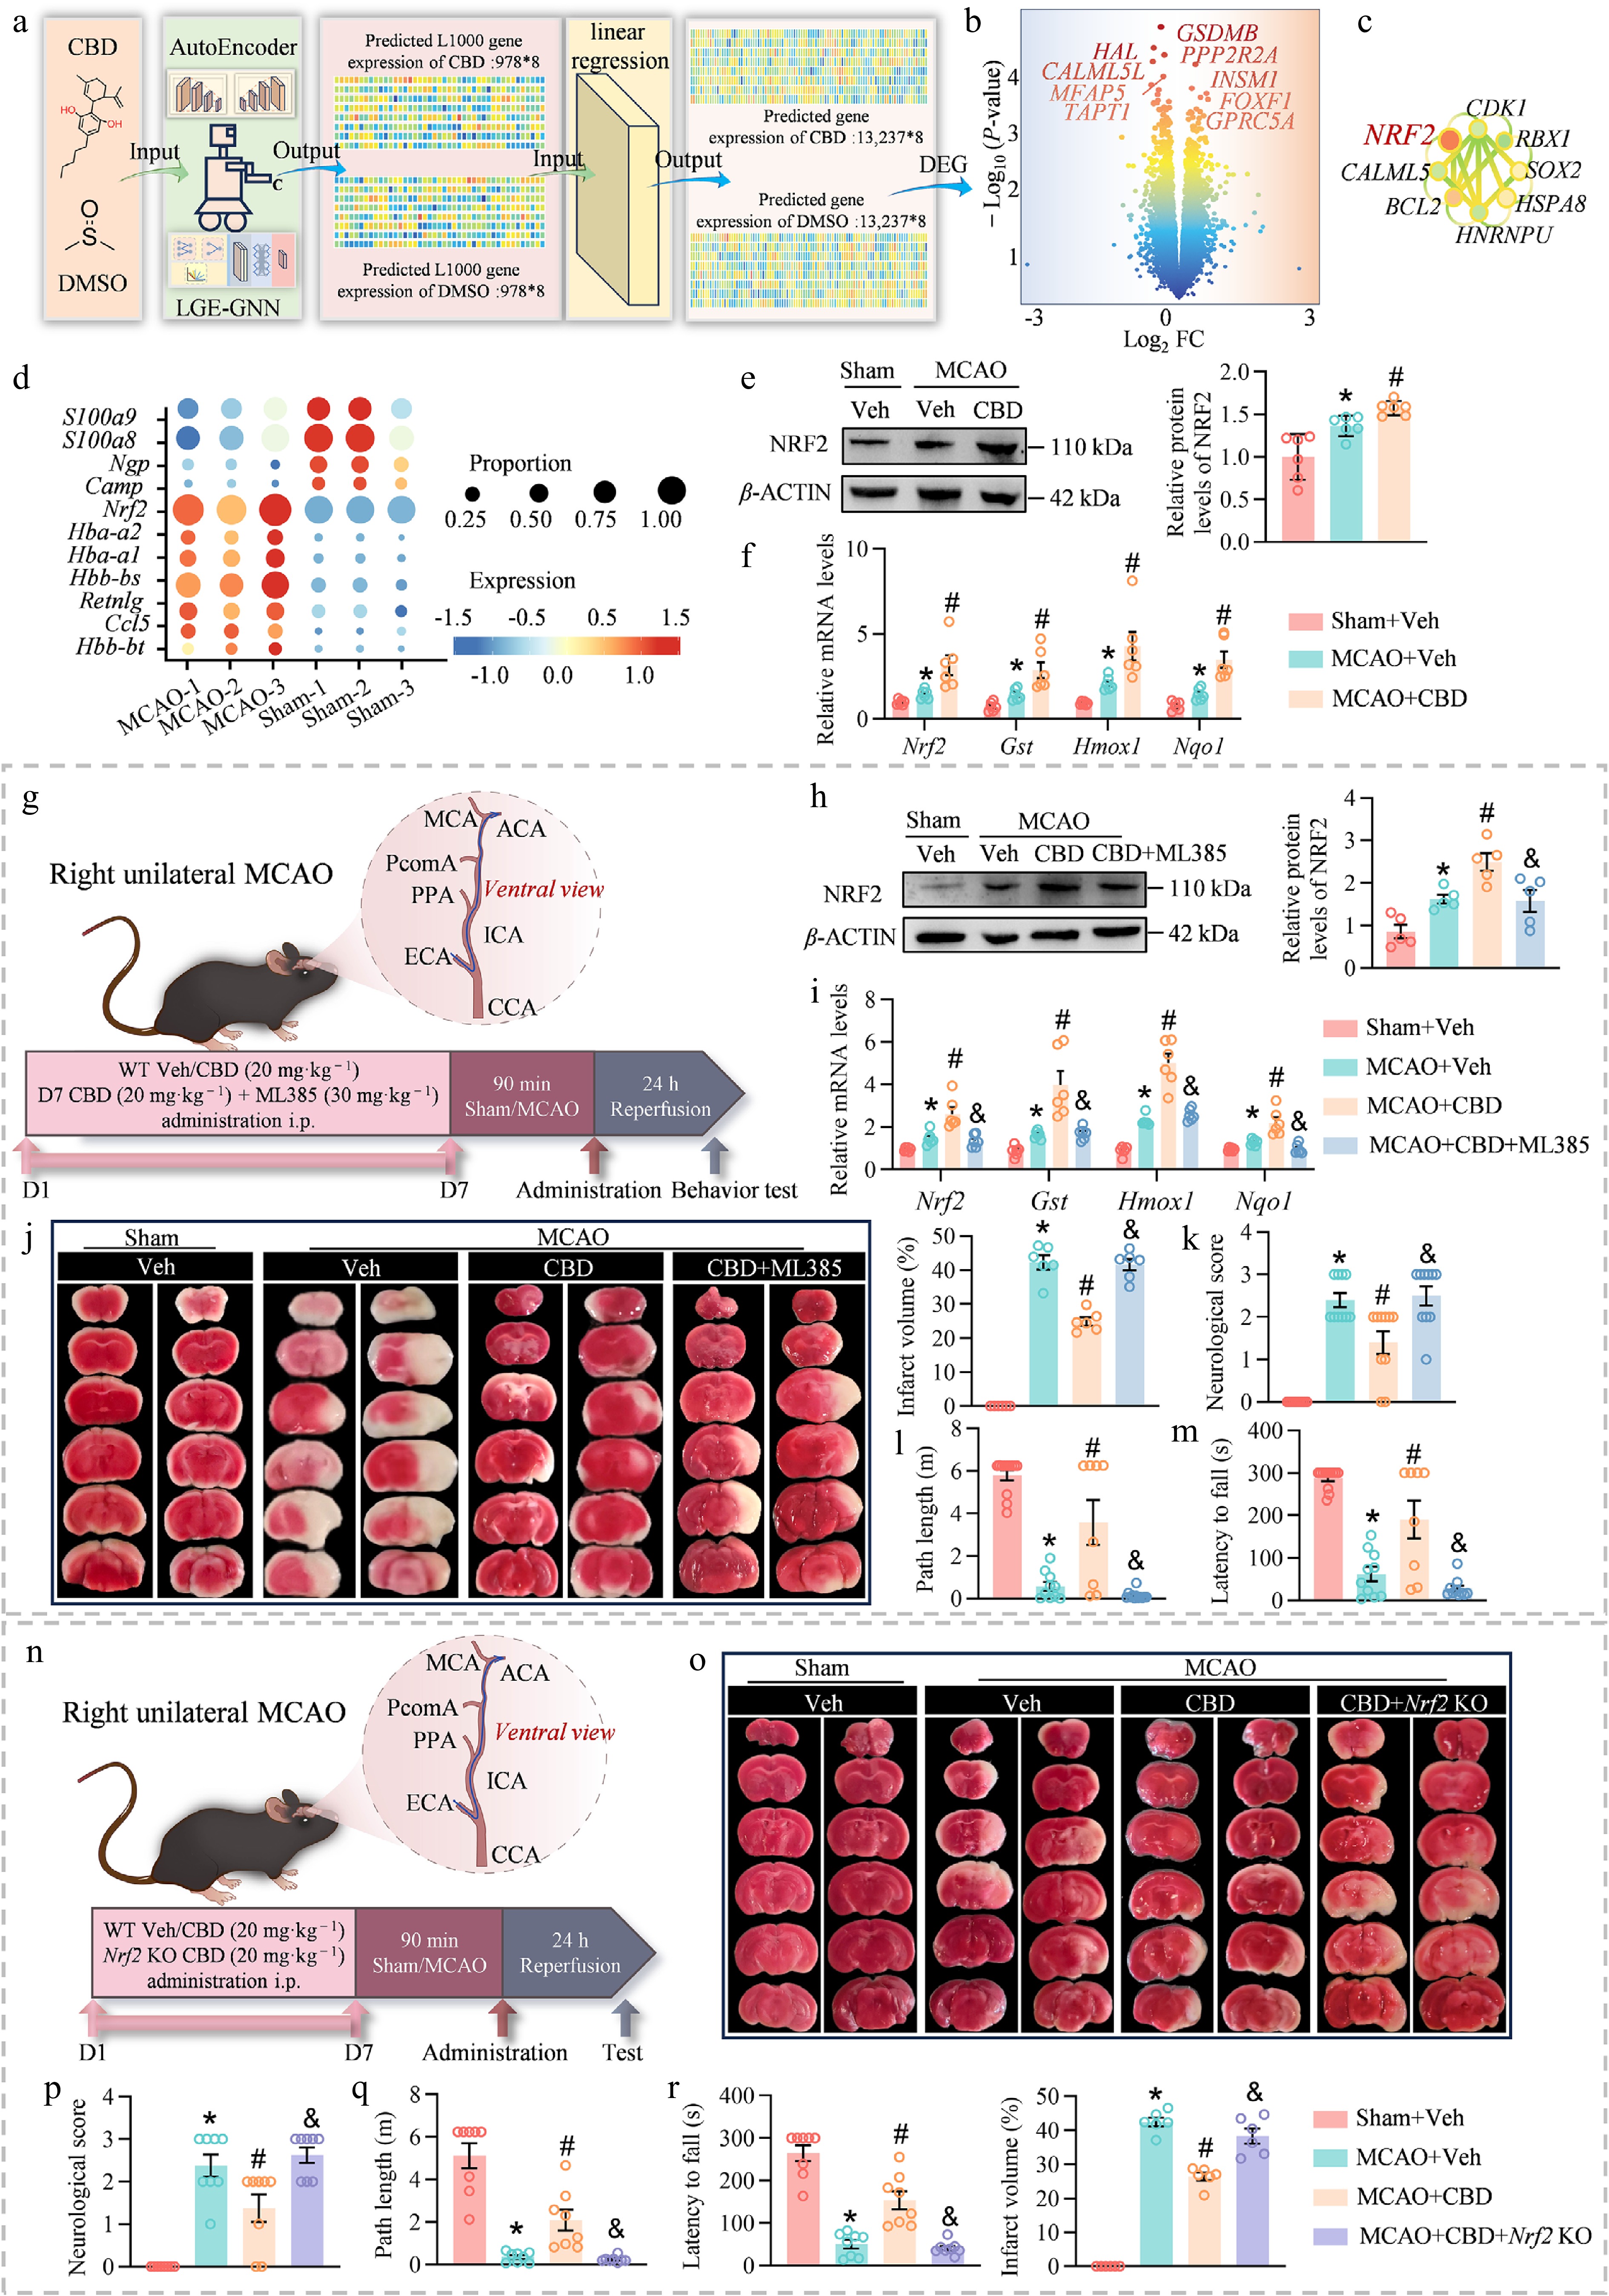
Figure 5.
CBD protects against I/R injury through NRF2-mediated antioxidant defense. (a) Flowchart depicts the potential differential gene analysis in CBD using LGE-GNN (n = 16). (b) A volcano plot shows the hypothetical differential genes in CBD. (c) The network diagram shows the hub genes of the differential genes with their interactions. (d) Heat map exhibits the expression of several genes of endothelial cells belonging to the sham group and the MCAO group. (e) Western blot assays show the relative protein level of NRF2 (n = 6 per group). (f) Relative mRNA levels of Nrf2, Gst, Hmox1, and Nqo1 (n = 6 per group). (g) Schematic of the animal experimental design. (h) Western blot assays show the relative protein level of NRF2 (n = 5 per group). (i) Relative mRNA levels of Nrf2, Gst, Hmox1, and Nqo1 (n = 6 per group). (j) Brain infarction volume was determined by TTC staining and the analysis of brain infarction volume (n = 6 per group). (k) Assessment of short-term neurological function by Longa neurological score (n = 10 per group). (l) Total distance traveled in the rotarod test (n = 8−12 per group). (m) Latency to fall from the rotating rod (n = 8−12 per group). (n) Schematic of the animal experimental design. (o) Brain infarction volume was determined by TTC staining and the analysis of brain infarction volume (n = 6 per group). (p) The measurement of short-term neurological function through Longa neurological score (n = 8 per group). (q) The amount of total distance moved during the rotarod test (n = 8 per group). (r) The time until the rotating rod falls (n = 8 per group). Data are presented as mean ± SEM. * P < 0.05 in comparison with the sham group; # P < 0.05 in comparison with the MCAO group; & P < 0.05 in comparison with the CBD-treated group.
-
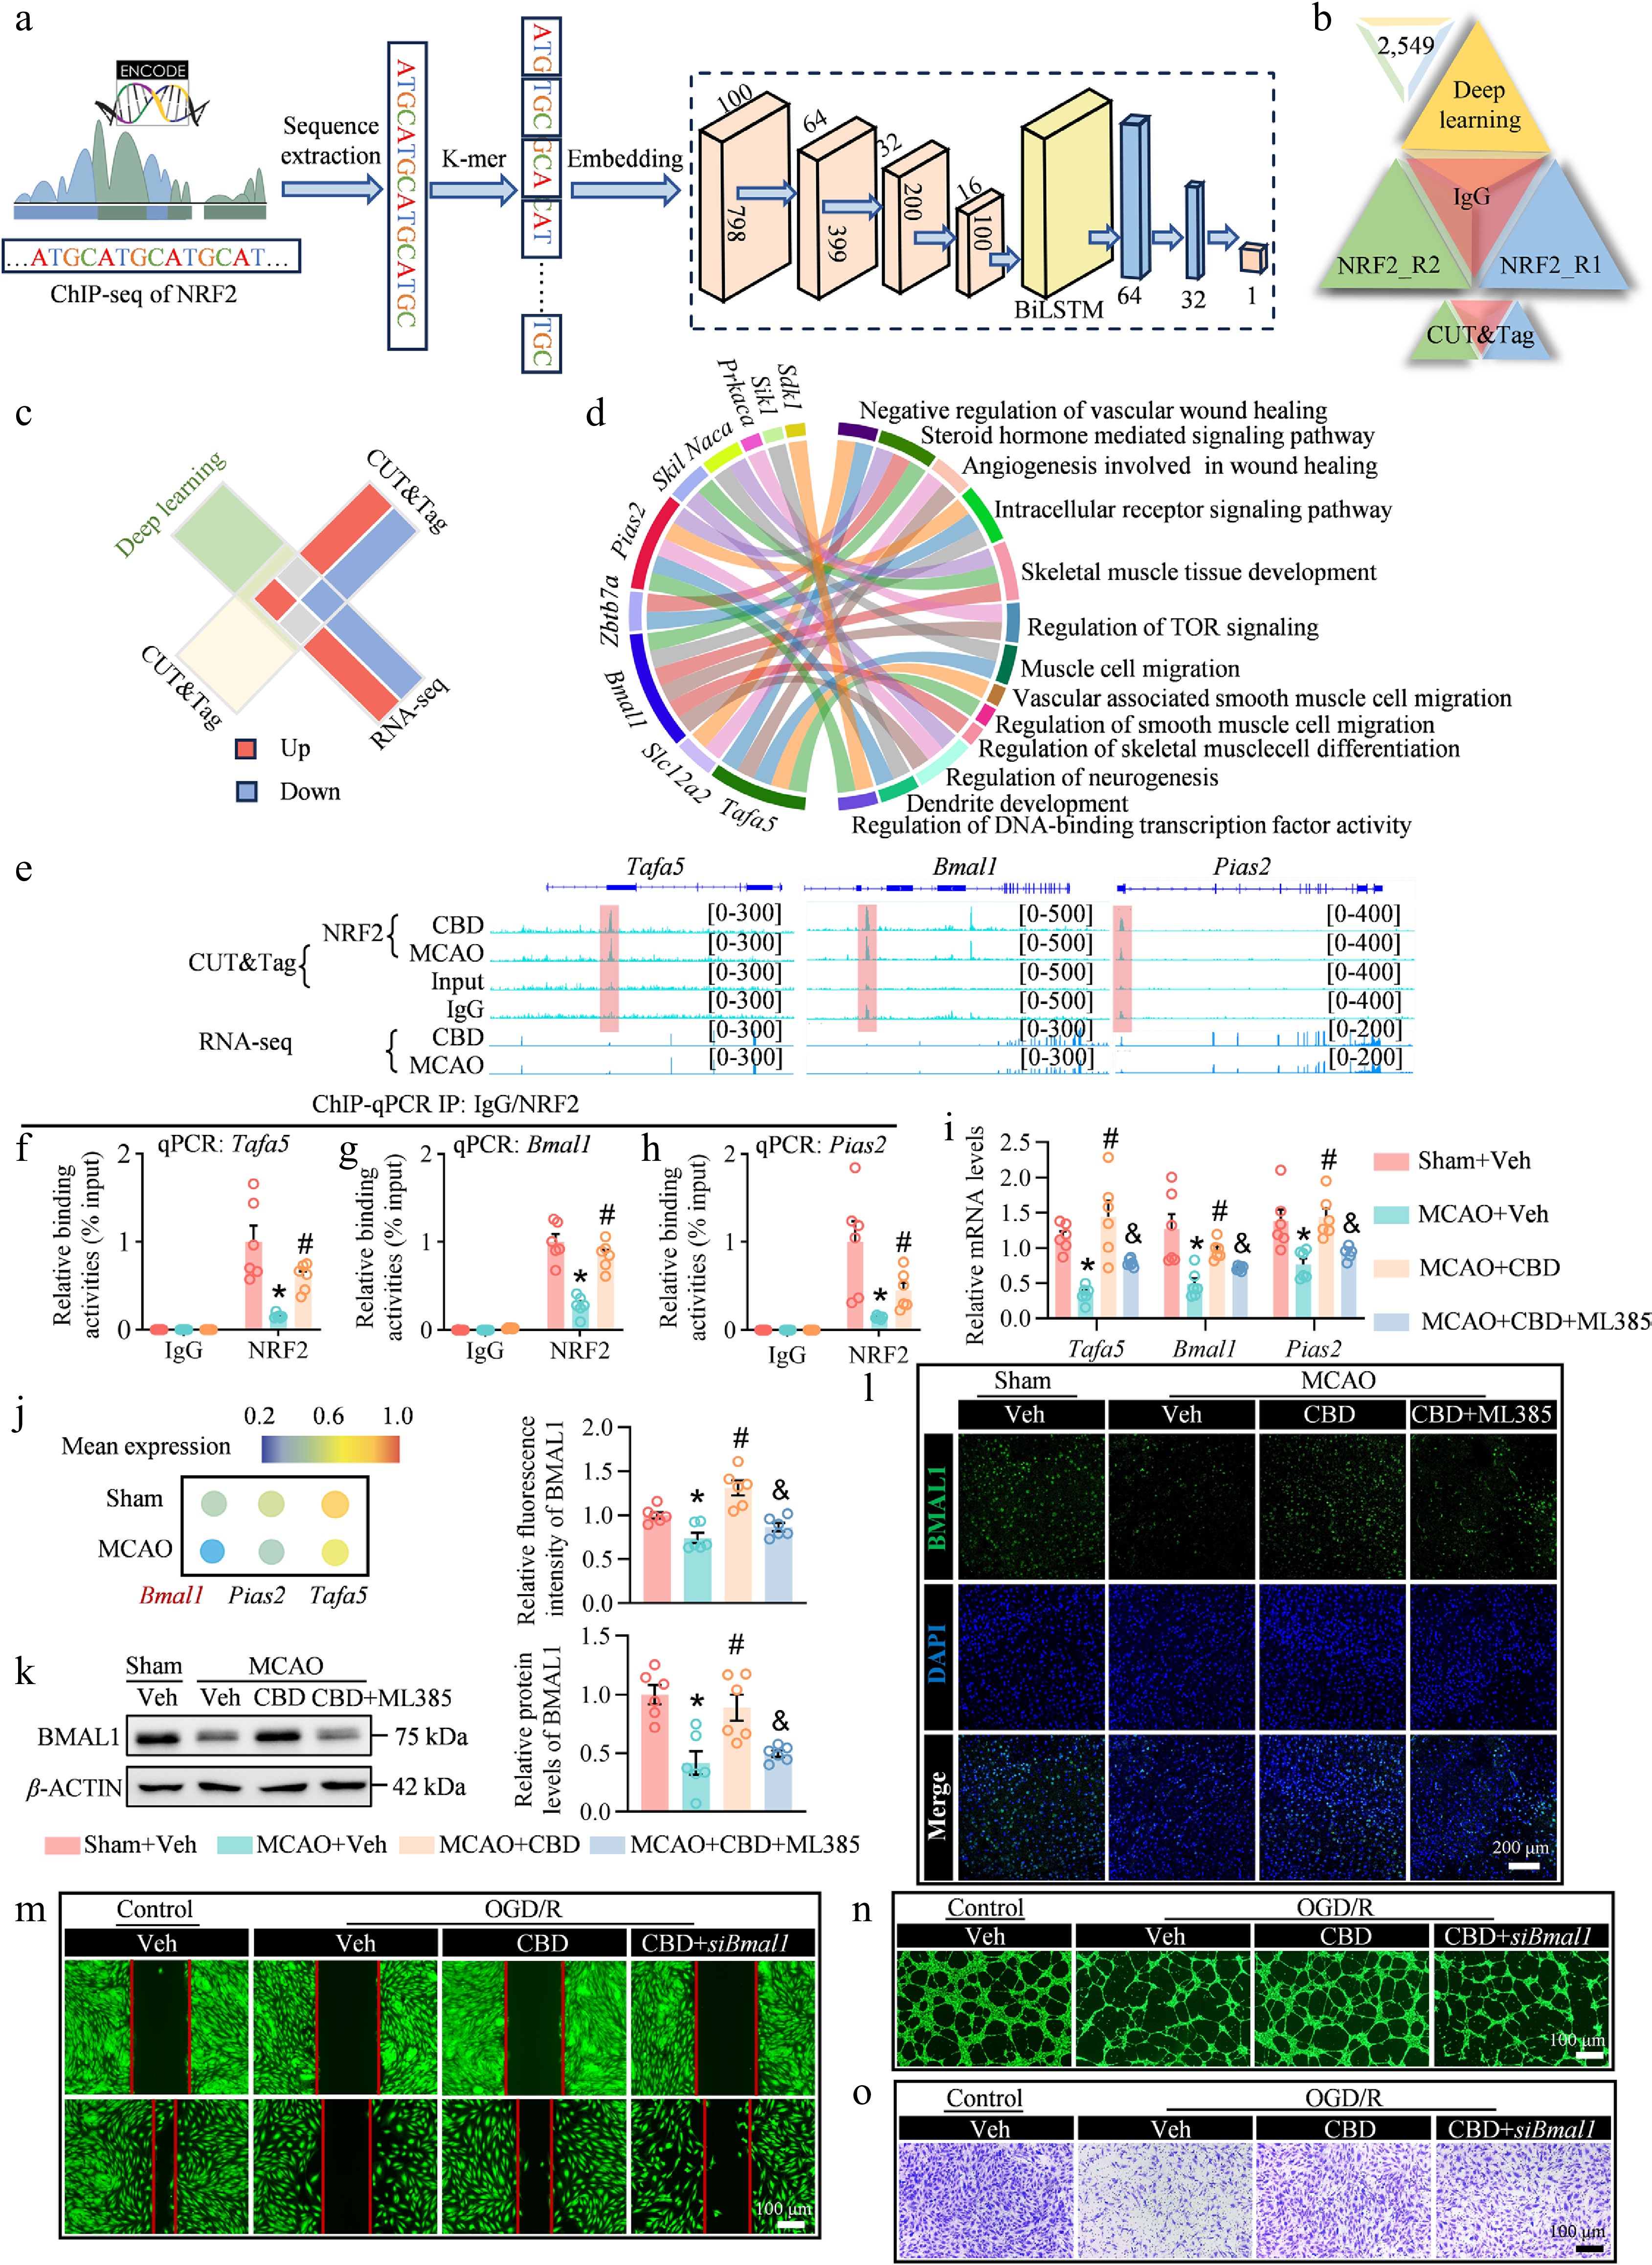
Figure 6.
AI-enhanced identification of BMAL1 as a candidate NRF2-associated effector contributing to CBD-induced angiogenesis. (a) Diagram of data collection and model architecture of the DeepD2V model. (b) Regulated genes bound to NRF2 in the mouse brain. (c) Schematic diagram of the target genes of NRF2 was screened by DeepD2V model prediction combined with CUT&Tag and RNA-seq. (d) Chord diagram of NRF2 target genes. (e) Genome browser tracks showed the binding sites and differential binding levels of NRF2 and Tafa5, Bmal1, and Pias2, and the expression levels of Tafa5, Bmal1, and Pias2 genes. (f)–(h) ChIP-qPCR analysis showed increased NRF2 enrichment at the promoter regions of Tafa5, Bmal1, and Pias2 after CBD administration (n = 6 per group). (i) Relative mRNA levels of Tafa5, Bmal1, and Pias2 (n = 6 per group). (j) The heatmap displays the expression levels of Bmal1, Tafa5, and Pias2 in the endothelial cell-enriched regions of brain slices from sham and MCAO mice. (k) Western blot assay shows the relative protein level of BMAL1 (n = 6 per group). (l) Representative fluorescence micrographs and statistical analysis of relative fluorescence intensity of BMAL1 in the perilesional cortex (scale bar = 200 μm, n = 6 per group). (m) Scratch assay showed that proliferation and migration repair ability of HUVECs after 8 h of oxygen-glucose deprivation (OGD) and 24 h of reoxygenation (scale bar = 100 μm, n = 6 per group). (n) Tube formation assay evaluated the angiogenesis capacity of HUVECs (scale bar = 100 μm, n = 6 per group). (o) Transwell migration analysis showed the migration ability of HUVECs (scale bar = 100 μm, n = 6 per group). Data are presented as mean ± SEM. * P < 0.05 compared to sham group or control group; # P < 0.05 compared to MCAO group or OGD/R group; & P < 0.05 compared to CBD-treated group.
-
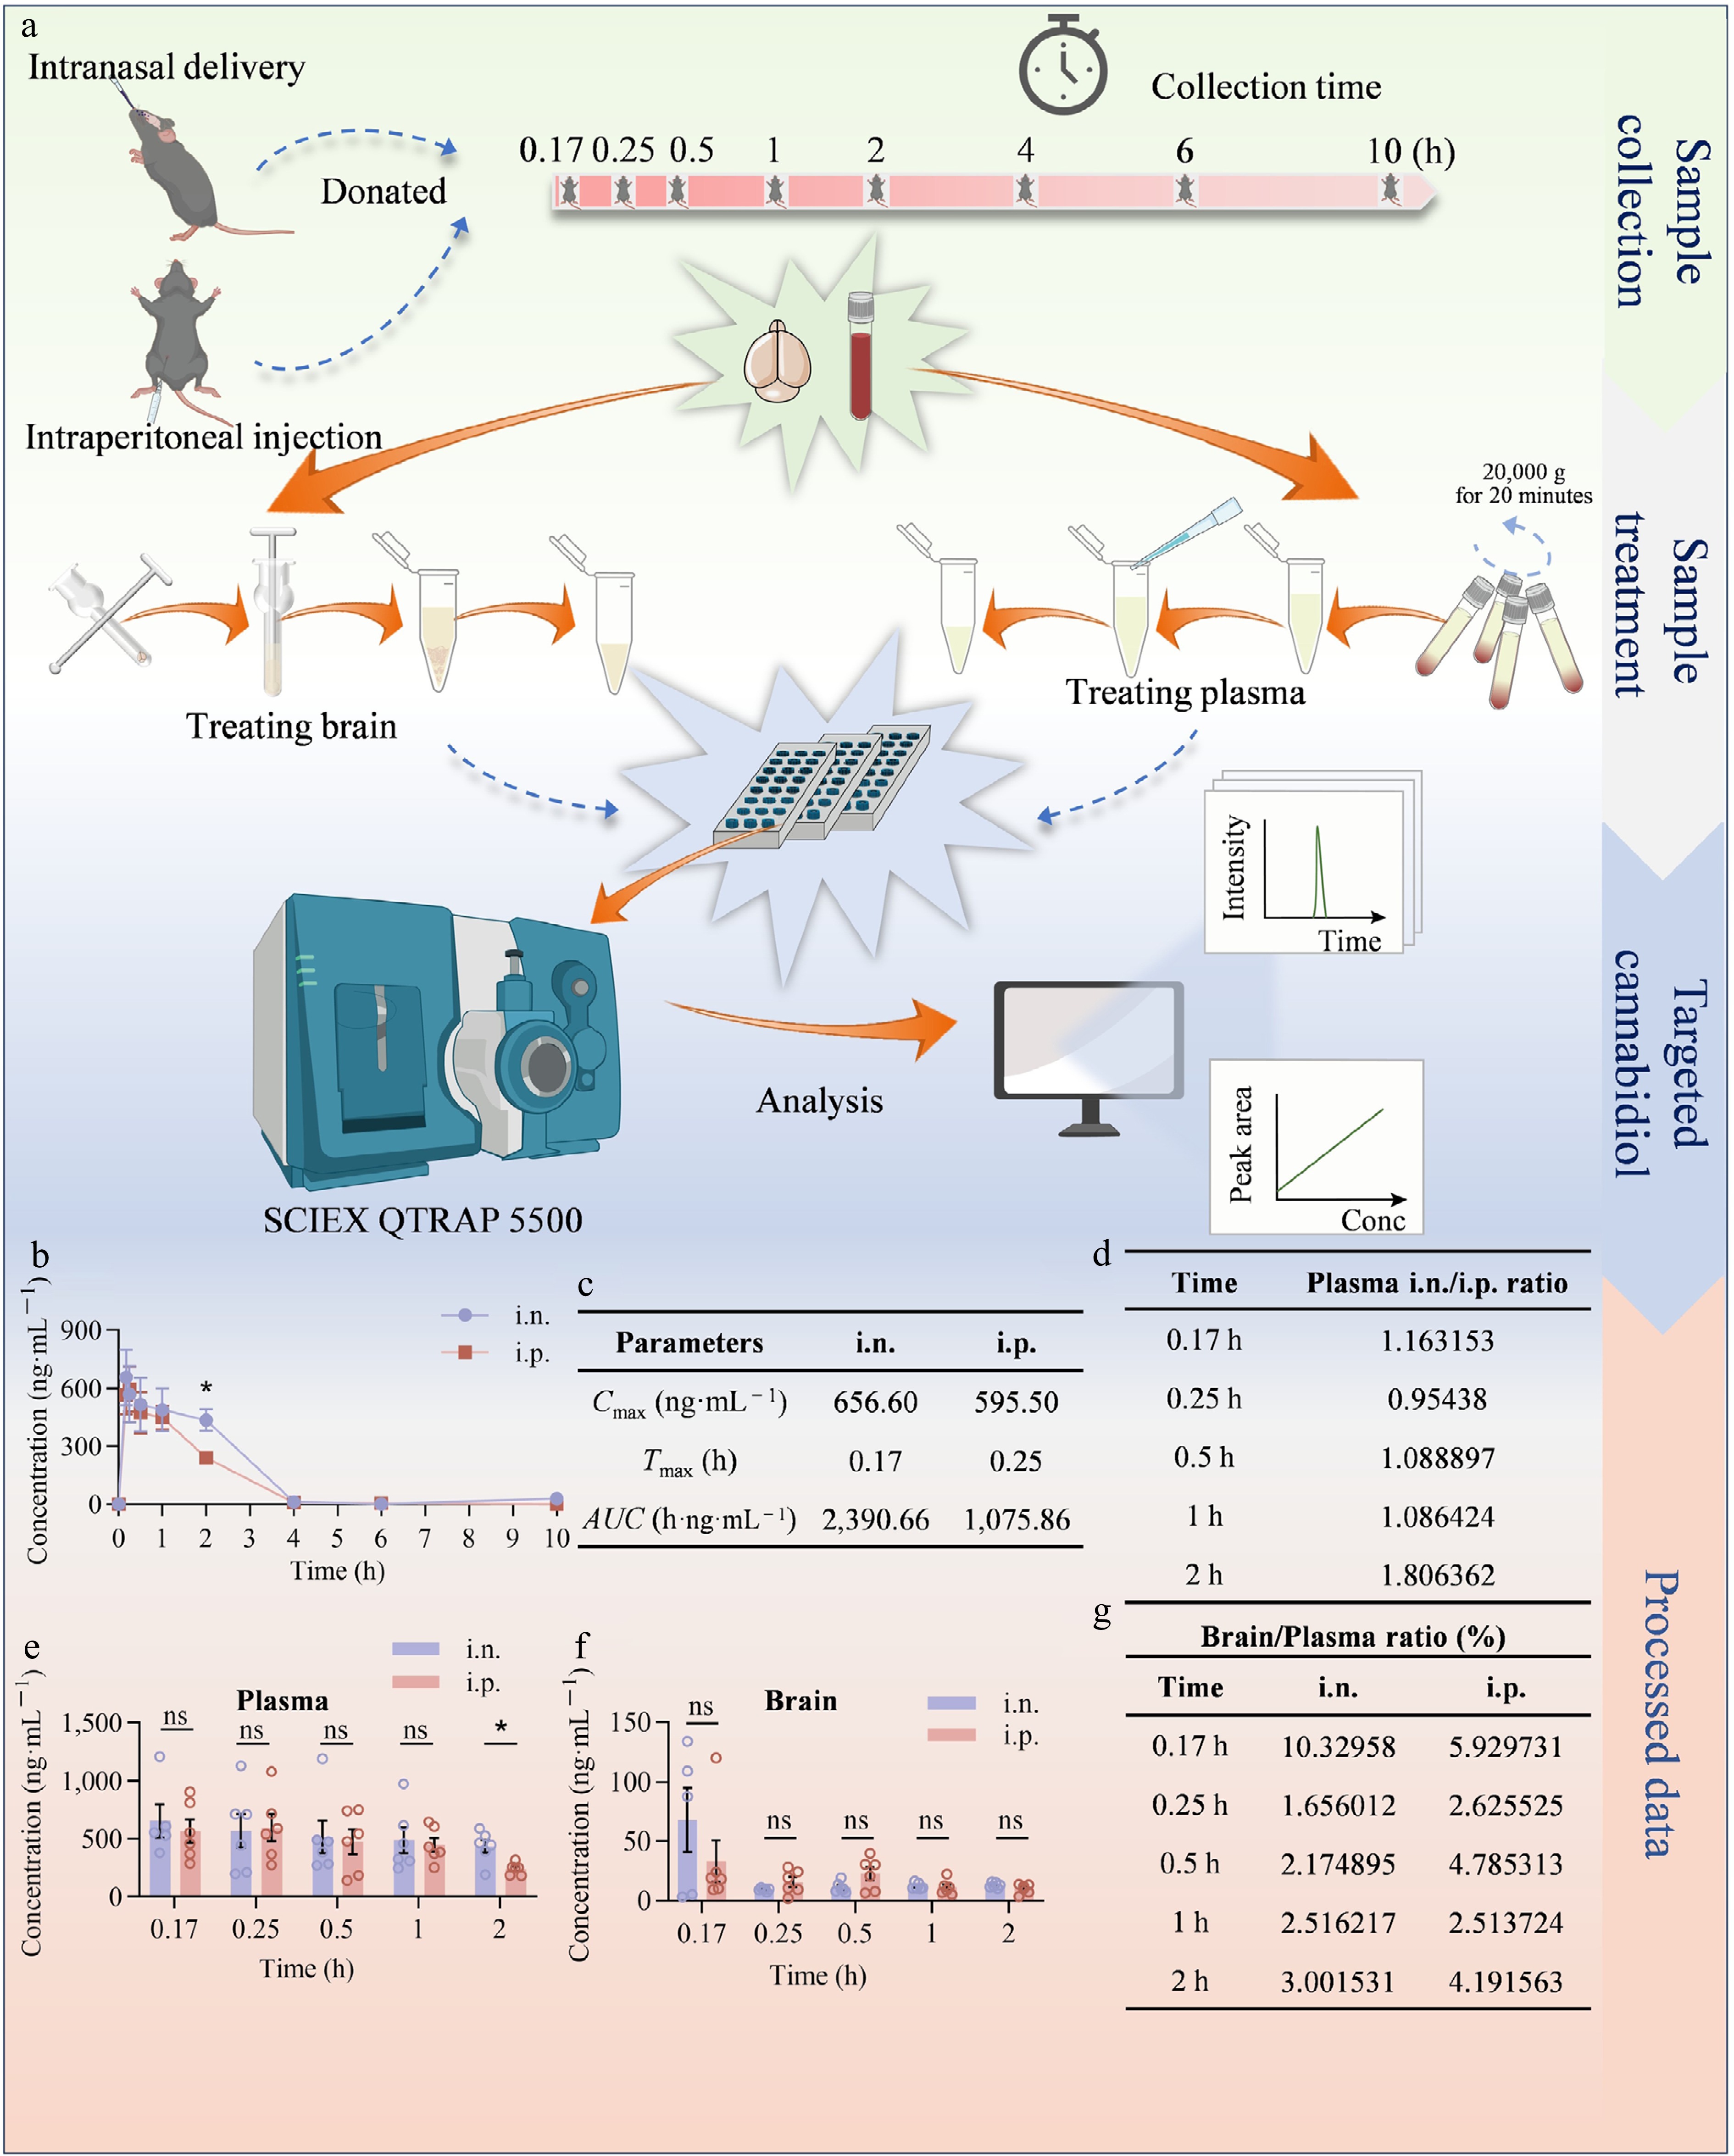
Figure 7.
There was a comparison of the intraperitoneal administration of CBD delivery efficiency with the intranasal delivery. (a) General idea of the target concentration of CBD drug metabolism over time by the intranasal route and intraperitoneal injection (n = 5−6 per group). (b), (c) The pharmacokinetics and parameters of CBD through the intranasal route and intraperitoneal injection. (d) CBD levels ratio in plasma between two different modes of administration. (e) Plasma drug concentrations, and (f) brain at 0.17, 0.25, 0.5, 1, and 2 h after administering 20 mg·kg−1 of CBD. (g) Brain uptake efficiency of the two administration routes. Data are presented as mean ± SEM. * P < 0.05 intranasal administration vs the intraperitoneal administration group.
-
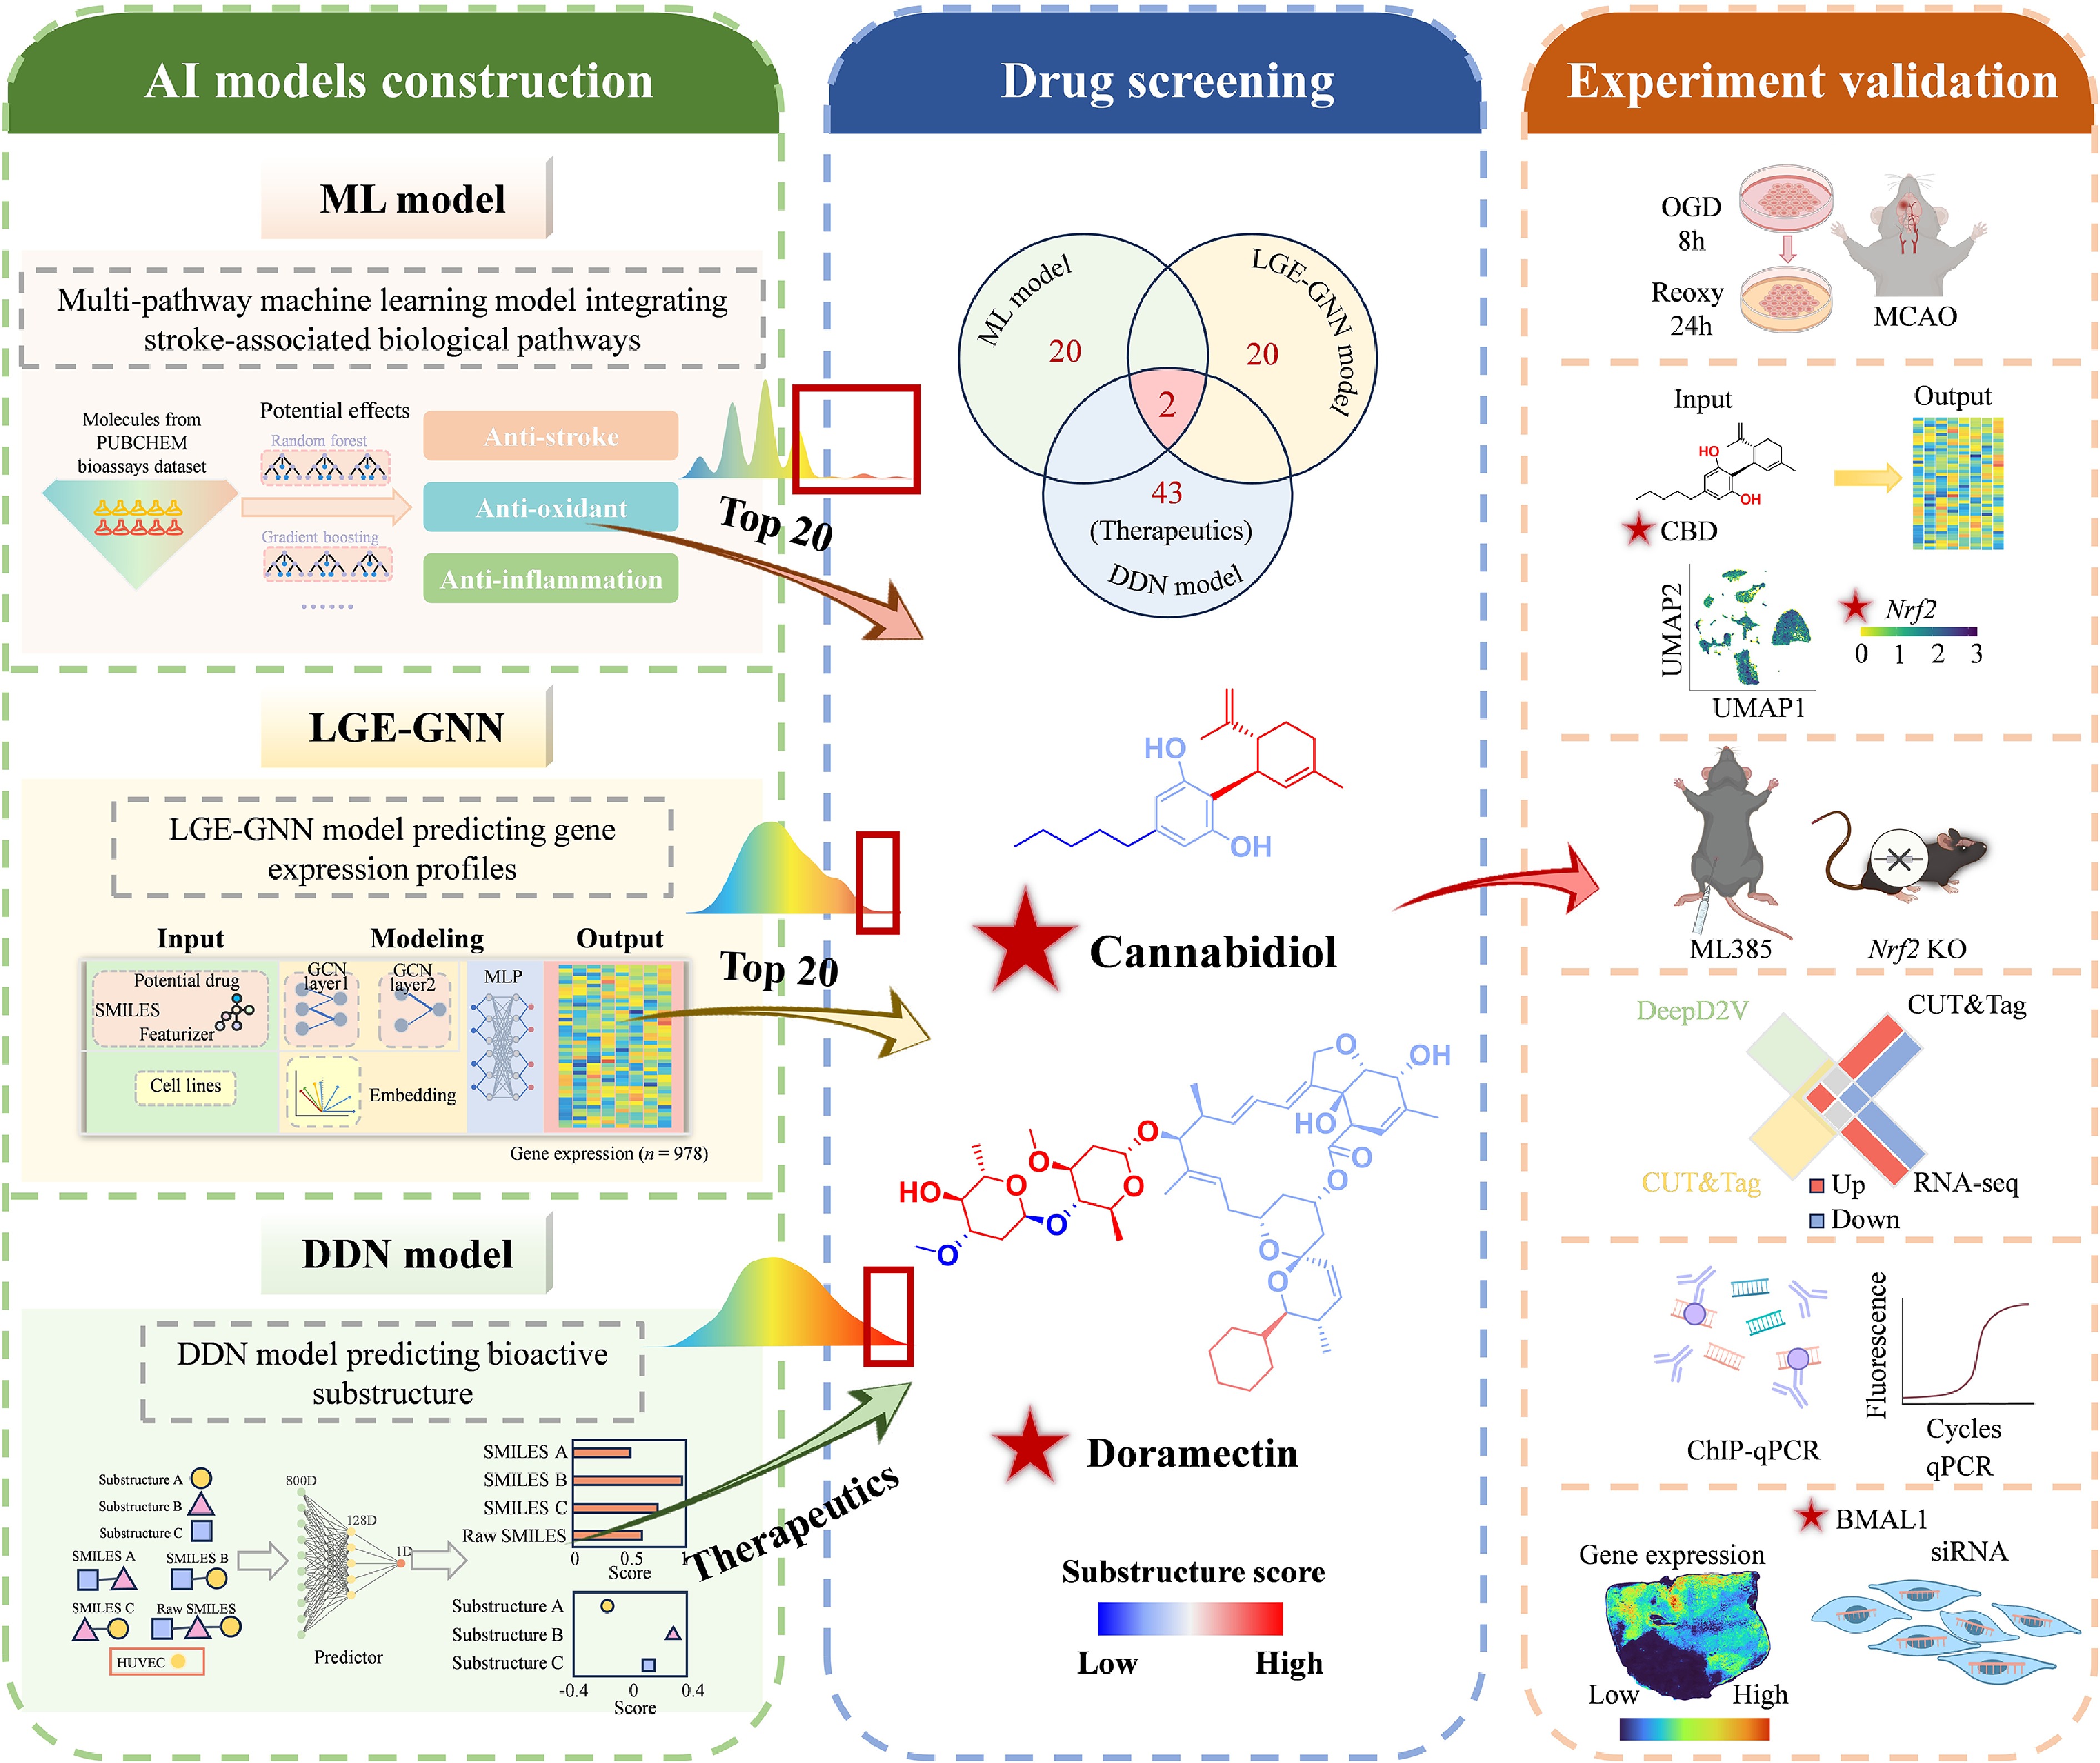
Figure 8.
An AI-driven framework accelerates drug discovery and elucidates therapeutic mechanisms, offering a scalable approach for treating ischemic stroke and other complex diseases.
-
Pathway ID Model selection Hyperparameters Anti-oxidant GO:0016209 XGBoost colsample_bytree = 0.8418 gamma = 0.2699 learning_rate = 0.0506 max_depth = 7 n_estimators = 200 subsample = 0.7159 GO:0072593 XGBoost colsample_bytree = 0.8123 gamma = 0.2239 learning_rate = 0.1206 max_depth = 9 n_estimators = 200 subsample = 0.9046 WP:2884 GradientBoosting learning_rate = 0.2 max_depth = 20 n_estimators = 200 subsample = 0.8 Anti-inflammation MAP-198745 LogisticRegression C = 0.1 penalty = l2 MAP-165159 XGBoost colsample_bytree = 0.8123 gamma = 0.2238 learning_rate = 0.1206 max_depth = 9 n_estimators = 200 subsample = 0.9046 MAP-209560 RandomForest max_features = sqrt min_samples_split = 5 n_estimators = 200 Stroke HP:0002140 XGBoost colsample_bytree = 0.6298 gamma = 0.4934 learning_rate = 0.1644 max_depth = 6 n_estimators = 200 subsample = 0.9262 Table 1.
Optimized hyperparameters for the selected algorithms.
Figures
(8)
Tables
(1)