












-
Ischemic stroke (IS) is a worldwide health problem with the features of sudden occurrence, drastic neurological damage, and restricted options of treatment owing to a small time period of opportunity to treat it[1,2]. The currently used clinical approaches like thrombolysis and mechanical thrombectomy have serious limitations such as stringent patient eligibility criteria, potential hemorrhagic complications, and no pharmacological agents available that can act quickly and also have strong safety profiles[3−6]. Therefore, the immediate clinical priority is to come up with fast-acting, noninvasive treatments that can increase the treatment window or enhance post-operative recovery, thus making significant changes in patient prognosis and reducing the burden of medical care.
Nevertheless, the standard drug discovery systems, with their extended and expensive experimental pipelines, cannot easily answer the question of multifactorial diseases, such as IS, where a highly complex network of oxidative stress, inflammation cascading, mitochondrial failure, and vascular impairment is involved[7−9]. These combined pathways are too complicated, and this makes the traditional trial-and-error processes ineffective; the necessity to implement transformative methodologies that will allow exploring large areas of chemistry in a systematic way and finding therapeutically useful possibilities is very urgent.
Artificial intelligence (AI) is an innovative paradigm shift in this field, incorporating computational chemistry, structure-based molecular modeling, and machine learning (ML)-based predictive models into the process of discovering, characterizing, and optimizing therapeutic molecules[10−14]. Especially, graph neural networks (GNNs) and deep learning models have become a potent technology in the prediction of molecular interactions, pharmacological profiles, and activity–structure interaction (SAR) and are currently playing a big role in the acceleration of the process of drug discovery through fast, in silico screening of compound libraries and target validation accuracy[15−17].
Now, this is a new AI-based approach that has been created to identify and optimize small-molecule candidates that are involved in IS-related pathological pathways in a systematic manner. Curation and integration of massive chemical and biological information available in many databases, including STRING and LINCS 1000[18], allow us to create several innovative computational methods such as a Latent Gene Expression Graph Neural Network (LGE-GNN) and a Drug Decompose Network (DDN) model. The models help in the identification of compounds that can be used to effectively manipulate various disease-relevant targets. Using the platform, we have been able to identify cannabidiol (CBD), a non-psychoactive cannabinoid with an established safety profile and previously reported neuroprotective potential, as a clinically tractable repurposed lead for ischemic stroke. Its therapeutic relevance was then systematically validated through in vitro and in vivo experiments[19−24].
We used a unique combination of our integrative methodology with both state-of-the-art pharmacology validation and AI-based computational chemistry approaches (i.e., virtual screening, prediction of properties of molecules) and pharmacophore-level optimization of structures. In addition to its relevance to ischemic stroke alone, this framework provides some sort of universalizable model for speeding up the discovery of therapies in a broad spectrum of diseases. Our plan also easily extends to other systemically dysregulated pathologies due to the fact that we have taken the opportunity to capture and simulate several-factor molecular communications underlying neurological illness, including malignancies, the illness of diabetes, as well as metabolic illnesses like obesity. The present research illustrates how AI has the potential to revolutionize the field of chemical biology and medicinal product development, providing a scalable and interdisciplinary background to the future of therapeutic innovation.
-
CBD was obtained from Push Bio-Technology Co., Ltd (Chengdu, China) and dissolved in ethanol, Tween-20, and saline (1 : 1 : 18). Animals were allocated to different groups at random. MedChemExpress (HY-100523) was the source of ML385. Pretreatment of mice was given intraperitoneally once daily with CBD or vehicle 7 d prior to surgery, whereas ML385 (30 mg·kg−1) was given intraperitoneally on the day before the surgery, and then again as a once-only dose before starting reperfusion. All experiments were conducted in compliance with ethical considerations made by the Ministry of Science and Technology of the People's Republic of China.
For animal experiments, C57BL/6J adult male mice, weighing 20−25 g, were supplied via the Vital River Laboratory Animal Technology Co., Ltd (Beijing, China), and the Nfe2l2-Eko2 mice were purchased from the Shanghai Model Organisms Center, Inc. (Shanghai, China). Female mice were not included in the present study. Therefore, all in vivo efficacy and mechanistic conclusions should be interpreted as being derived from male mice. Prior to the experiment, the mice were initially housed for 1 week in an SPF-level barrier environment with constant temperature and pressure, and free access to water and food. All animal procedures utilized in this investigation received the approval of the Ethics Committee of China Pharmaceutical University (2024-09-126). The Nfe2l2-Eko2 mice were genotyped by PCR using mouse tail DNA. Genomic DNA was extracted by alkaline lysis. Primers used for genotyping are listed in Supplementary Table S1.
Data collection and cleaning for ML models (pathway classifiers)
-
We curated stroke-related pathways from STRING via Cytoscape (v3.9.1) with CytoHubba (v0.1), selecting those supported by prior literature on ischemic stroke pathogenesis, including Antioxidant Activity (GO:0016209), NRF2 (WP:2884), Reactive Oxygen Species (GO:0072593), STAT3 (MAP-198745), mTOR (MAP-165159), NF-κB (MAP-209560), and Stroke (HP:0002140)[25]. For each pathway, hub genes were computed with CytoHubba. Gene-centric bioactivity assay records were retrieved from PubChem; entries with labels ('active' and 'inactive') were retained, and binarized per pathway (active = 1, inactive = 0). 'Uncertain' and other assays lacking definitive labels were excluded.
To assemble an external prospective screening library (used only for post-training prioritization), we queried DrugBank and PubChem with the keyword 'anxiety', yielding 152 and 167 compounds, respectively. Because keyword search can admit agents known to induce anxiety, all hits were manually verified against primary database annotations and peer-reviewed literature; inducing-anxiety drugs and duplicates were removed, resulting in 255 anxiolytics. This screening library was excluded from all model training and evaluation to avoid data leakage.
To prevent leakage, any compound present in the screening library was removed from the model-development pool. All datasets for model training, validation, and evaluation were subjected to compound-level splitting (80% training, 20% held-out test) with a fixed random seed, ensuring that no molecule appears in more than one split. CBD (cannabidiol; CID = 644019) was not present in any training set, and across all training molecules, none had a Tanimoto similarity ≥ 0.7 to CBD, except for one homolog (cannabidivarin; CID = 11601669) in the pathway classifier's training set. This homolog differs in side-chain length and pharmacological profile according to DrugBank and ChEMBL annotations. Tanimoto similarity was computed using RDKit with ECFP4 fingerprints (radius = 2, 2,048-bit). For transparency, Supplementary Fig. S1 presents a histogram of the Tanimoto similarity to CBD for compounds in all training sets used by the ML, LGE-GNN, and DDN models.
Compound-pathway response prediction ML model
-
Molecules were represented by ECFP4 fingerprints (radius = 2, 2,048-bit). For each pathway, we trained separate binary classifiers using Random Forest, Logistic Regression, XGBoost, Gradient Boosting, and Decision Tree algorithms. Data were split at the compound level into training (80%) and held-out test (20%) subsets with a fixed random seed, ensuring that no compound appears in more than one split. Hyperparameter tuning was performed exclusively within the training split via five-fold cross-validation (GridSearchCV and RandomizedSearchCV), and no test data were used for model selection or tuning.
All reported performance metrics and plots-including ROC curves, AUC, and confusion matrices-were computed on the held-out test set using the best model selected from cross-validation. After models were finalized, the 255-compound external screening library was scored for prospective prioritization; this library never entered training or evaluation. The selected models and their optimized hyperparameters for each pathway-specific classification task are summarized in Table 1.
Table 1. Optimized hyperparameters for the selected algorithms.
Pathway ID Model selection Hyperparameters Anti-oxidant GO:0016209 XGBoost colsample_bytree = 0.8418 gamma = 0.2699 learning_rate = 0.0506 max_depth = 7 n_estimators = 200 subsample = 0.7159 GO:0072593 XGBoost colsample_bytree = 0.8123 gamma = 0.2239 learning_rate = 0.1206 max_depth = 9 n_estimators = 200 subsample = 0.9046 WP:2884 GradientBoosting learning_rate = 0.2 max_depth = 20 n_estimators = 200 subsample = 0.8 Anti-inflammation MAP-198745 LogisticRegression C = 0.1 penalty = l2 MAP-165159 XGBoost colsample_bytree = 0.8123 gamma = 0.2238 learning_rate = 0.1206 max_depth = 9 n_estimators = 200 subsample = 0.9046 MAP-209560 RandomForest max_features = sqrt min_samples_split = 5 n_estimators = 200 Stroke HP:0002140 XGBoost colsample_bytree = 0.6298 gamma = 0.4934 learning_rate = 0.1644 max_depth = 6 n_estimators = 200 subsample = 0.9262 Drug-transcriptome data prediction LGE-GNN model
-
First, we gathered information on the responses of various compounds to perturbation in different cell line models using the L1000 database (GSE92742)[18]. It was later structured according to the compound, cell line, dosage of the drug, and drug administration time. After that, we chose molecular perturbation data of 1,241 compounds in eight cell lines (A375, HA1E, HELA, HT29, HUVEC, MCF7, PC3, and YAPC) with both drug administration times of 24 h and a drug dose of 10 µmol·L−1. We subsequently determined the centroid of the matrices of molecular perturbation data associated with each compound to be utilized in model training. The dataset was divided into training (80%) and holdout-test (20%) datasets.
In order to test whether it is possible to predict gene expression profiles by using molecular SMILES data in a direct way, we used a linear regression model as a starting point. The dataset that was given as an input was molecular SMILES strings along with their matching gene expression profiles. The feature representation was a binary vector (ECFP/Morgan) of size 2,048 bits, which represented the chemical structure in terms of chemical features. One-hot encoding is used to add cell line identities as categorical features. The combined feature set (ECFP/Morgan plus cell line encodings) was used to train the linear regression model. The results were compared based on the Pearson correlation coefficient between predicted and real gene expression measurements. The linear regression model had a Pearson correlation coefficient of −0.018, implying that it did not explain the relationship between input characteristics and gene expression measurements.
Our initial step was to teach an autoencoder how to represent a low-dimensional latent space using the high-dimensional gene expression data. The LGE-GNN autoencoder can reduce intricate transcriptomic landscapes to a latent space, and the decoder can recover the original profiles based on these latent characteristics. It reduces noise as well as dimensionality but still provides a strong representation of the gene expression landscape used in downstream modeling, with the important biological information intact.
We have created an LGE-GNN model that combines molecular graph-based features and cell line-based embeddings to map into the latent expression space, which is set by the autoencoder, in order to predict transcriptomic responses. The molecular structures were translated into graphs by applying DeepChem's MolGraphConvFeaturizer. Those graph-based molecular features were combined with cell line embeddings so that they would also include the chemical and cellular information on every single compound.
The LGE-GNN uses Graph Convolutional Networks (GCNs) and fully connected layers to estimate the latent features that represent gene expression profiles. In order to predict biological replicates and enhance predictive robustness, the transcriptomic profile of each compound was predicted eight times. The process minimises variability and guarantees the fidelity of the simulated information. Combining the use of autoencoder-based dimensionality reduction with GNN-based prediction in latent space, LGE-GNN provides a combined representation of gene expression data, molecular graph data, and cell line data. The model had a Pearson correlation coefficient of 0.9517, which indicates the accuracy of the model in predicting the transcriptomic responses of the compounds.
This combined strategy will be an excellent instrument that can help determine and screen out possible anti-stroke medications, along with the ability to obtain mechanistic information about their biological consequences.
Active substructure prediction DDN model
-
The DDN model was also built using the L1000 dataset. Initially, the drug-induced gene expression profile of 978 landmark genes of each compound under certain cell line conditions was extracted. The next step was to compute the Pearson correlation coefficient between all these genes and the endothelial cell gene expression profile, which was determined by single-cell RNA sequencing of mouse brain tissue in a stroke model. The therapeutic score was taken as the negative of the correlation coefficient. By such operation, we have created a matrix with the data on compounds, cell lines, and their corresponding therapeutic scores, which were used as input into the model training process.
Prediction of therapeutic potential of structural fragments: To evaluate the possible curative effect of selected architectural fragments in stroke treatment, we designed the DDN model, which combines a pretrained ChemBERTa molecule encoder, cell line embedding module, and molecular structure decomposer. Feature extraction and integration: Compounds were entered in SMILES and encoded through a ChemBERTa-pretrained model (seyonec/ChemBERTa-zinc-base-v1), which extracted a 768-dimensional molecular embedding vector serving as overall molecular representations.
The cell line characteristics of each cell line were created using the therapeutic scores of all the compounds. After z-score normalization, these characteristics were passed through an autoencoder to obtain a 32-dimensional latent embedding of each cell line.
Fusion and prediction network: The molecular and cell line embeddings were concatenated to form an 800-dimensional joint feature vector, which was subsequently fed into a three-layer fully connected neural network (MLP) with ReLU activation functions. The network produced a continuous output representing the predicted therapeutic reversal score. For model training, the dataset was randomly split into a training set (90%) and a held-out test set (10%). The model was optimized by minimizing the mean squared error (MSE) between the predicted and actual scores, and training continued until convergence. Structural fragment contribution analysis: In order to improve the interpretability of models, BRICS (Breaking of Retrosynthetically Interesting Chemical Substructures) decomposition was used on all the compounds present in the training set. Each of the molecules was considered with a series of removals of a single structural fragment each time to produce the related altered molecular structures. The therapeutic potential values of these altered molecules were thereafter predicted using the trained model. The value of contribution of each fragment was evaluated by determining the discrepancy between the initial therapeutic score and that of the altered structure, given by the equation below: Contribution = Original Score − Modified Score. Positive contribution scores mean that the removal of the fragment reduces the level of therapeutic efficacy, so that the fragment adds positively to the treatment. In contrast, negative contribution scores mean that when the fragment is removed, it leads to increased therapeutic efficacy, indicating that there is a probability that the fragment would reduce therapeutic efficacy or even have a pathogenic effect. Schrödinger and Discovery Studio: The AutoQSAR workflow of Maestro 12.8 was used to develop the quantitative structure–activity relationship (QSAR) models based on the Schrödinger modeling. The LigPrep preprocessing was performed on molecular structures (desalting, hydrogen addition, tautomer generation, and standardization). Modeling was conducted with a training set of 80, having 10 models and evaluating them using the built-in ensemble strategy. QSAR models were constructed based on the small molecules and created using the QSAR model workflow in Client v19 to model Discovery Studio. Once the ligands were prepared and the dependent properties given, the dataset was randomly divided into training (80%) and held-out test (20%) subsets. The models were built through the use of both the MLR model and PLS model modules with five-fold cross-validation based on default settings. The two workflows used the same therapeutic scores as the dependent property.
CBD whole transcriptome data prediction model
-
The LGE-GNN model was applied to forecast transcriptomic data on 978 genes in response to CBD and DMSO therapies, modeling biological replicas in eight cases. To extrapolate these predictions to the gene expression profile, we have made use of a publicly accessible gene expression dataset that has been maintained by the Broad Institute with use of the Affymetrix microarray system in the GEO database.
Dataset preparation: The raw dataset contained 129,158 raw gene-expression profiles with 23,200 gene probes in each profile. The raw dataset was accessed through the LINCS cloud platform and then analyzed in this way: quantile normalization was conducted, and the expression values were converted to a scale of 4−15. Redundancy was eliminated by eliminating duplicate samples, which gave a curated dataset of 114,366 gene expression profiles. Consistency was achieved using the intersection of the 978 L1000 landmark genes and the training-set genes to base the predictions of full gene expression. On this task, we split the dataset into training and test sets in a proportion of 80 : 20 and trained a linear regression model suggested by the L1000 model, which performed reasonably well (Pearson correlation = 0.8048)[18].
Full gene expression prediction for CBD and DMSO: With transcriptomic data on 978 genes produced by the LGE-GNN model (i.e., eight biological replicates of both CBD and DMSO), we used the trained linear regression model to predict the complete gene expression profiles of CBD and DMSO in all the replicates.
Differential expression and enrichment analysis: We used differential expression analyses in all the replicates to determine which of the genes were significantly changed by the treatment of CBD with the help of limma (v3.58.1). Genes with an adjusted P-value (adjusted P < 0.05, adjusted by the Benjamini–Hochberg correction) were considered significant. These genes were subjected to downstream analyses: protein–protein interaction (PPI) analysis using STRING-db (v11, Homo sapiens). Gene Ontology (GO) analysis and Gene Set Enrichment Analysis (GSEA) using clusterProfiler (v4.10.1) in R (v4.3.2) using default parameters.
NRF2 downstream genes prediction model
-
To construct a model capable of accurately predicting downstream binding sites of transcription factors, we collected ChIP-seq results for NRF2 from the ENCODE database in BED format (ENCSR000ESK, ENCSR584GHV, and ENCSR707IUN). After merging the BED files, we aligned the combined dataset to the GRCh38.14 genome database, which served as the positive dataset representing sequences where the transcription factor is known to bind. We generated negative control sequences three times the number of positives using genNullSeqs (gkmSVM, v0.83.0) with nMaxTrials = 60, xfold = 3, and the masked hg38 reference (BSgenome. Hsapiens. UCSC. hg38. masked). In this section, we directly adopted the DeepD2V architecture. Following the DeepD2V training protocol and raw parameters, we used the transcription start sites (TSS) of known genes within 200 bp as testing data. The predicted binding sites were then used for further analysis.
Mendelian randomization
-
This study employed a two-sample MR design using publicly available GWAS summary statistics (Supplementary Fig. S2). Genetic association data for both exposures and outcomes were obtained through the OpenGWAS platform via the TwoSampleMR (v0.4.2.6) and ieugwasr (v1.0.1) R packages and were based on the populations included in the original GWAS studies[26]. As this study was a secondary analysis of publicly available summary-level data, no new participant recruitment or follow-up was conducted. Information regarding recruitment periods, data collection, and follow-up in the original studies was obtained from the corresponding GWAS publications or database records and is summarized in the Supplementary Table S2. Only SNPs with available summary statistics in both the exposure and outcome GWAS and that could be harmonized (allele alignment) were retained for MR analysis. SNPs lacking outcome data or failing harmonization were excluded from the final MR dataset.
All analyses were conducted using summary-level GWAS effect estimates (beta coefficients) and their standard errors as provided by the original GWAS studies. The scale and units of each exposure and outcome followed the corresponding GWAS definitions. No additional transformation of quantitative variables was applied beyond the original GWAS modeling.
Initially, we identified all SNPs associated with exposures (P < 1 × 10⁻⁴). Subsequently, these SNPs underwent clumping using the 1,000 Genomes Project Phase 3 LD and reference panel to ensure independence of instrumental variables within a 100,000 Kb window and pairwise linkage disequilibrium (LD) R2 < 0.0001. Instrument strength was quantified using the F statistic, and the variance explained was measured by R2. Variant harmonization was performed by aligning the effect allele betas across different studies using the TwoSampleMR package. We performed primary MR analyses for each exposure and outcome association. The inverse-variance weighted method was employed as the principal statistical model to assess potential causal associations.
Between-instrument heterogeneity was assessed using Cochran's Q statistic implemented in the TwoSampleMR function mr_heterogeneity (), with Q statistics and corresponding P values reported for each exposure-outcome analysis to evaluate variability in SNP-specific causal estimates. In addition, leave-one-out analyses were conducted using mr_leaveoneout (), in which each SNP was sequentially removed and the causal estimate recalculated to determine whether the overall MR estimate was driven by any single instrumental variant. Substantial changes in the estimate after removal of a specific SNP were considered indicative of influential instruments.
Analysis of single-cell RNA-sequencing (scRNA-seq)
-
The scRNA-seq data of MCAO mice were obtained from the GEO database (GSE225948 and GSE174574). Seurat (v4.2.3) was used to conduct the reduction and clustering analysis, and Harmony (v1.2.1) was used to eliminate batch effects[27,28]. Cellmarker2 was used to conduct cell annotation. The DEG analysis was conducted using Seurat. In detail, the data were normalized and preprocessed using Seurat's NormalizeData function. Variable features were identified with FindVariableFeatures, followed by data scaling with ScaleData. Principal component analysis (PCA) was conducted with RunPCA to reduce dimensionality. To integrate datasets and correct for batch effects, Harmony was applied using the RunHarmony function with the sampleID as the grouping variable. UMAP and t-SNE dimensionality reduction techniques were performed based on the Harmony-corrected embeddings using the RunUMAP and RunTSNE functions, respectively, with the top 30 principal components (PCs). For clustering, nearest neighbors were identified using FindNeighbors, and clusters were defined with FindClusters, both utilizing the Harmony-corrected reduction and the top 30 PCs. Differentially expressed genes across clusters were identified using the FindAllMarkers function, focusing only on positive markers with a minimum expression in 15% of cells (min.pct = 0.15) and a log fold-change threshold of 0.55 (logfc.threshold = 0.55). The RNA assay was set as the default for marker identification.
Middle Cerebral Artery Occlusion model (MCAO)
-
Mice were subjected to 1.5 h right middle cerebral artery occlusion (MCAO) and 24 h reperfusion after 7 d of pre-administration or solvent treatment. MCAO was performed using the internal carotid artery line embolization method. Mice were anesthetized with 1.5%−2% isoflurane inhalation, and the right common carotid and internal and external carotid arteries of the brain were isolated. A microvascular shear was used to cut an incision at the distal end of the external carotid arteries, and a silicone-coated nylon monofilament (Beijing Cinontech, 1620A2, Beijing, China) was inserted to block the blood supply. When the blood flow was blocked for 90 min, the wire plug was removed, and the blood supply was restored. Mice in the sham-operated group had the same procedure as those in the ischemia group, except that they were not given insertion of a nylon monofilament. During the whole operation, the temperature of the mouse was controlled at around 37 °C by an automatic temperature-controlled heating pad. After 24 h of reperfusion, further experiments were performed.
Neurological deficit score
-
Neurological deficits were scored 24 h after surgery using the modified Zea Longa scoring system, and the score ranges from 0 to 4. When activity was normal and there was no neurological defect, the score was 0. When the left (the opposite side of the infarcted hemisphere) forelimb was not fully expanded, and nerve function was slightly deficient, the score was 1. When the mice turned to the left when walking with moderate neurological deficits, the score was 2. When the mouse walked, the body fell to the left, and there was severe neurological impairment, the score was 3. When there was an inability to walk spontaneously with conscious disturbance, the score was 4. Both measurement and analysis personnel were unaware of the group assignments and treatments.
Detection of the infarct volume
-
The mice were anesthetized by inhalation of 1.5% isoflurane. After reperfusion for 24 h, the mice were sacrificed, and the cerebral infarct volume was measured. The brain slices were exposed to 1% 2,3,5-triphenyltetrazolium chloride (TTC, MedChemExpress, HY-D0714) and 4% dipotassium hydrogen phosphate (50 : 3) at 42 °C for 15 min. The brain slices were then fixed by immersion in 4% paraformaldehyde and photographed. The percentage of ischemic areas was calculated using the formula: (sum of the areas of white ischemic areas in each brain slice)/(sum of the areas in each brain slice) × 100%.
Rotarod test
-
To test the ability to maintain balance and move coordinately, a rotarod test was carried out. The diameter of the roller was 3 cm, and the speed was from 2.5 to 25 r·min−1 over 5 min. The test was implemented in a quiet environment. The mice were placed on the rollers and trained to avoid slipping and getting nervous. The time required for mice to fall from the pole, the speed of the pole, and the distance traveled during the fall were recorded.
RNA extraction and RNA-seq analysis
-
The isolation of RNA from brains was conducted using the RNA isolation agent Total RNA Extraction Reagent (Vazyme, R401-01, Nanjing, China). First, 1 mL of the RNA isolation agent was mixed with 30 mg of brain sample and ground at 4 °C using a freeze grinder. After grinding, the samples were centrifuged at 11,200 r·min−1 for 5 min at 4 °C, and the supernatant was aspirated. A 20% volume of chloroform was added to the lysate to form an emulsion by vigorous shaking for 15 s, and after standing for 5 min at 4 °C, the emulsion was centrifuged at 11,200 r·min−1 for 15 min. After the addition of an equal volume of isopropanol precooled at 4 °C, the colorless aqueous phase layer formed by centrifugation was reversed, mixed, and left for 10 min. The mixed solution was centrifuged at 11,200 r·min−1 for 10 min at 4 °C. After centrifugation, a white precipitate was obtained. The supernatant was discarded, and 1 mL of 75% ethanol was added to wash the precipitate. The precipitate was left for 5 min and centrifuged at 11,200 r·min−1 for 5 min at 4 °C; the supernatant was discarded, and the precipitate was dried in a clean environment at room temperature for 3 min. RNase-free ddH2O was added to dissolve the precipitate. The RNA extract was stored at −80 °C after determination of the concentration.
The raw RNA-seq reads were subjected to mapping onto the GRCm39 via HISAT2 (v2.2.1)[29]. Following this mapping step, quantification was conducted using FeatureCounts of subread (v2.0.1)[30], and the resulting quantification dataset was subjected to further evaluation using R (v4.3.2). Subsequently, the limma (v3.62.1) R package was employed to discern DEGs[31].
Real-time PCR
-
Mice under deep anesthesia were perfused with frozen PBS (pH = 7.4) transcardially, and the brains were collected and stored at −20 °C. Total RNA was purified from the cerebral cortex with Trizol Reagent (Vazyme) and reverse-transcribed to cDNA with HiScript III RT SuperMix (Vazyme) according to the manufacturer's instructions. cDNA samples were amplified by CFX Opus Real-Time PCR System (Bio-Rad) using Taq Pro Universal SYBR qPCR Master Mix (Vazyme). Relative expression changes were analyzed using the 2−ΔΔCᴛ method, and the target gene expression levels were normalized to GAPDH. The specific primer sequences for RT-qPCR were listed in Supplementary Table S3.
CUT&Tag
-
The cell nuclei for the CUT&Tag assay were extracted from brain tissues of different treatments of mice by using the Nuclear Extraction Kit (Solarbio, SN0020). The CUT&Tag assay was performed using the Hyperactive Universal CUT&Tag Assay Kit for Illumina (Vazyme, TD903) according to the manufacturer's instructions. Briefly, concanavalin A-attached magnetic beads were added to bind the resuspended cell nuclei at room temperature. Five percent digitonin was used to allow the primary antibody (NRF2 [Proteintech, 16396-1-AP]) and secondary antibody (Goat Anti-Rabbit IgG H&L [Vazyme]) to permeate the nuclear membrane. Then, DNA fragments binding with the targeted protein were cut off by Hyperactive pA-Tn5 Transposase. Finally, the DNA fragments were ligated with P5 and P7 adaptors, and the library amplification was performed with TruePrep Index Kit V2 for Illumina (Vazyme, TD202) by PCR. The evaluation of purified PCR products and the sequencing on NovaSeq 6000 were carried out by Novogene (Beijing, China).
The sequencing data were first quality-controlled using fastp (v0.23.4)[32] and subsequently aligned to the GRCm39 using Bowtie2 (v2.3.5.1). The alignment results were processed with deepTools (v3.5.1)[33] to generate bw format files for IGV visualization and other downstream analyses. Peak calling was performed using MACS2 (v2.2.7.1), and the identified peaks were annotated using ChIPseeker (v1.42.0)[34]. Motif analysis was performed using MEME (v5.5.7)[35] to identify enriched sequence motifs.
Chromatin immunoprecipitation (ChIP)
-
Brain tissues from mice were fixed with 1% (W/V) formaldehyde and subsequently quenched with 125 mmol·L−1 glycine. After washing with PBS, the fixed samples were suspended in cell lysis buffer (20 mmol·L−1 Tris-HCl pH 8.0, 85 mmol·L−1 KCl, 0.5% [V/V] NP40). After centrifugation, collected nuclei were dissolved in nuclei lysis buffer (50 mmol·L−1 Tris-HCl pH 8.0, 10 mmol·L−1 EDTA, 1% [W/V] SDS). For NRF2 ChIP, lysates were thawed and sonicated to obtain chromatin fragments of 300–1,000 bp, and diluted with ChIP dilution buffer (16.7 mmol·L−1 Tris-HCl pH 8.0, 1.2 mmol·L−1 EDTA, 0.01% [W/V] SDS, 1% [V/V] Triton X-100, 167 mmol·L−1 NaCl). After washing, a complex of nuclear protein/DNA and antibodies against NRF2 was retrieved with Protein A/G beads (Thermo Scientific Pierce, 88803). After the cross-linking was reversed, chromatin fragments were treated with RNase A and proteinase K. DNA was purified with phenol-chloroform extraction. The purified DNA was used for subsequent qPCR analysis.
Frozen slices of brain tissue and immunofluorescence
-
Mice were perfused with frozen PBS (pH 7.4) transcardially, followed by perfusion with 4% paraformaldehyde for tissue fixation. After cardiac perfusion, the brains were harvested, fixed in 4% paraformaldehyde for at least 24 h, and protected from light at 4 °C. The fixed brain tissue was transferred into 30% sucrose solution for dehydration. After dehydration for 48 h, the brains were cut into 25 μm-thick coronal slices using a freezing microtome (Leica, CM1950), and the slices with an intact hippocampus were stored in the freezing solution (PBS : ethylene glycol : glycerin = 5 : 3 : 2) and stored at −20 °C.
The brain slices were washed three times in PBS, followed by treatment in 0.3% Triton X-100 (Beyotime Biotechnology, ST795) for 20 min at room temperature. After blocking the sections with 5% bovine serum albumin (Beyotime Biotechnology, ST023) and diluting in PBS for 1 h at room temperature, the sections were incubated with primary antibodies (CD31 [R&D Systems, AF3628]; BMAL1 [Proteintech, 14268-1-AP]) overnight at room temperature. The next day, after incubation with fluorescent secondary antibodies (Fluorescein [FITC]-conjugated Rabbit Anti-Goat IgG [H+L] [Proteintech, SA00003-4]; CoraLite488-conjugated Goat Anti-Rabbit IgG [H+L] [Proteintech, SA00013-2]) for 1 h at room temperature, brain slices were finally stained with 1 μg·mL−1 DAPI (Beyotime Biotechnology, C1002) for 10 min. After washing with PBS, samples were imaged with an ultra-high-resolution laser confocal microscope (Leica, STELLARIS 5). Finally, Leica confocal software (Leica Application Suite X) was used to analyze and quantify the acquired images.
DHE staining
-
Brain slices were stained with dihydroethidium (DHE) to detect ROS levels in vivo. After washing the brain slices with PBS three times, they were incubated with DHE at 37 °C for 30 min. Subsequently, after washing with PBS three more times, the nuclei were stained with DAPI. The resulting samples were imaged using ultra-high-resolution laser confocal microscopy (Leica, STELLARIS 5), and Leica confocal software (Leica Application Suite X) was used to visualize and quantify the fluorescence signals in the brain sections.
Cell culture and oxygen glucose deprivation/reoxygenation model (OGD/R)
-
HT22 cell lines (mouse hippocampal neuron cell lines, RRID: CVCL_C0DX) and HUVEC cells (human umbilical vein endothelial cells, RRID: CVCL_2959) were treated in Dulbecco's Modified Eagle medium (obtained from Invitrogen) and Endothelial cell medium (obtained from ScienCell) containing 10% FBS, 100 IU·mL−1 penicillin, and 100 μg·mL−1 streptomycin. It was cultured in a humidified atmosphere of 5% CO2 at 37 °C.
The original medium was replaced with a sugar-free medium, and the cells were cultured in a hypoxia incubator containing 2% O2 (Thermo) at 37 °C for 8 h. Then the cells were returned to normal medium including CBD (1 μmol·L−1), ML385 (10 μmol·L−1), or solvent treatment, and reperfusion was performed at normal pressure (95% air, 5% CO2) for 24 h to induce OGD/R injury.
Cell viability
-
HT22 cells (5 × 10³) were seeded into 96-well plates under normal conditions for 24 h. To evaluate the cytotoxicity of the candidate compounds, cells were treated with CBD or doramectin at concentrations of 0.05, 0.1, 0.2, 0.4, 0.8, 1.6, 3.2, 6.4, or 12.8 μmol·L−1 for 24 h under normal culture conditions. Vehicle-treated cells served as the control. To evaluate the protective effects of the candidate compounds against OGD/R-induced injury, HT22 cells were treated with oxygen–glucose deprivation (OGD) for 8 h and subsequently returned to normal culture conditions for 24 h of reoxygenation in the presence of CBD or doramectin at the indicated concentrations (0.05, 0.1, 0.2, 0.8, and 1.6 μmol·L−1). Cell viability was evaluated with MTT (Beyotime Biotechnology, ST316), and the absorbance was measured with a microplate reader (Molecular Devices, SpectraMax Mini, USA) at 570 nm wavelength.
Fluorescence probe detection of ROS in vitro
-
Six-well plates were used to grow cells, which were further cultured overnight until confluence was reached at 70%. The cells were incubated in DCFH-DA (Beyotime Biotechnology, S0033M) at a final concentration of 10 μmol·L−1 at a temperature of 37 °C in a cell incubator for 20 min. Subsequently, the cells were washed thrice with serum-free cell culture medium, and an inverted fluorescence microscope (Nikon Ts2R) was used to visualize and photograph them.
Measurement of SOD, MDA, and GSH
-
The tissue and cellular oxidative stress marker levels were measured with the help of a multifunctional microplate reader (Molecular Devices Co., Ltd, SpectraMax Mini). The SOD level, MDA content, and GSH activity were determined in accordance with the directions of commercially available kits (Beyotime Biotechnology, S0101M; S0131M; S0053).
Analysis of spatial transcriptomics data
-
With no intermediate steps, we used the RDS format of spatial transcriptomics data available at GSE233815 and subjected it to analysis according to the standard workflow of the Seurat package. Spots with fewer than 200 unique genes (low quality) were eliminated, and all datasets were normalized individually by applying the SCTransform method to reduce the effects of batches. SelectIntegrationFeatures was used to select integration features, and then missing SCTransform residuals were calculated with PrepSCTIntegration. FindIntegrationAnchors was used to identify integration anchors, followed by merging the datasets using IntegrateData. The calculation of the top 100 PCs of nuclear-origin genes used a matrix of centered and corrected Pearson residuals. Using ElbowPlot and DimHeatmap analyses, the most informative 30 PCs were obtained to reduce the dimensionality to UMAP. The clustering function was performed with both FindNeighbors and FindClusters functions, whereby the parameter of evaluation of robustness was the range of resolution between 0.6 and 2.0. The final annotation was reached by merging the clustering results of whole-section and cortical integrations, yielding 16 brain regions and six ischemic regions. As it was differently localized, the post-ischemic day-7 sample (bregma + 0.5 mm) was not included in the last presentation; however, it was included in the integration to make possible the mutual anchoring of lesion clusters.
The super-resolution spatial transcriptomics data were calculated with the use of iSTAR on the raw GSE233815 dataset. The parameters in iSTAR were all at their default settings. Marker genes for different cell types were obtained from CellMarker2. The iSTAR analysis was conducted in Python (v3.10) and performed on an NVIDIA A4000 GPU using Torch (v2.0.1 + cu117).
siRNA transfection experiments in vitro
-
The cells were transferred on the day before transfection, and an appropriate number of cells were seeded in each well. The confluence degree of cells was about 60% during transfection to ensure that the cells were completely adherent and in good condition. Bmal1-targeting siRNA (F: 5'-CCGAGGGAAGAUACUCUUUTT-3'; R: 5'-AAAGAGUAUCUUCCCUCGGTT-3') was then transfected. Transfection compounds were prepared before the start of transfection (siRNA and Lipo3000 were diluted with transfection medium, respectively, and then siRNA was slowly added to Lipo3000 by dropping), left at room temperature for 15 to 20 min, and transfected immediately. Six hours after transfection, the medium was replaced, and subsequent experiments were performed 24 h later.
Tissue protein extraction
-
The appropriate weight of mouse brain tissue was weighed. RIPA lysis buffer containing protease and phosphatase inhibitors was added (10 μL·mg−1). The mixture was ground at 4 °C and lysed on ice for more than 30 min. Subsequently, it was centrifuged at 11,200 r·min−1 for 30 min to obtain the protein supernatant, which was stored at −80 °C.
Western blot analysis
-
The collected tissue proteins or cell protein lysates were quantified using a BCA kit (Beyotime Biotechnology, P0009). After adding loading buffer, the protein was fully denatured by boiling at 100 °C, cooled to room temperature, and stored at −20 °C.
An equal weight of the denatured protein was added to the SDS-PAGE (sodium dodecyl sulfate-polyacrylamide gel electrophoresis) lanes. After electrophoresis separation, they were transferred to the PVDF (polyvinylidene fluoride) membranes. The PVDF membranes carrying the protein were placed in a TBST solution containing 5% skimmed milk for 2 h for blocking. Subsequently, the membranes were incubated with the primary antibody (NRF2 [1 : 1,000, Cell Signaling Technology, 12721T]; BMAL1 [1 : 1,000, Proteintech, 14268-1-AP]; β-actin [1 : 5,000, Proteintech, 20536-1-AP]) overnight at 4 °C. Then, they were washed with TBST three times, each for 10 min, to remove the non-specifically bound primary antibody. After that, the bands were incubated with the respective HRP-conjugated secondary antibodies at room temperature for 1 h. After the incubation was completed, the bands were washed again. Detection of protein expression was accomplished using an enhanced chemiluminescence kit (Tanon, 180-5001) and visualized using a Gel Imaging System (Bio-Rad, ChemiDoc MP, USA). The gray values of the bands were analyzed using ImageJ software.
Cell scratch assay
-
A uniform horizontal line was drawn at the bottom of the six-well plate as a reference for localization, and HUVEC cells were seeded in the six-well plate to achieve 100% overnight confluence. A 20 μL pipette tip was used to scratch the cell layer vertically after OGD modeling. Scratches should be kept as straight as possible and of consistent width to reduce experimental errors. Cells were photographed with an inverted fluorescence microscope (Nikon Ts2R) immediately after washing three times with PBS as a primary test control. After that, the culture was continued with CBD or solvent treatment for 24 h and then photographed again. HUVEC cells were stained using a Calcein AM fluorescent probe (Beyotime Biotechnology, C2012). Images were processed and analyzed using ImageJ software. Cell migration rate (wound healing rate) = (initial scratch area−scratch area after 24 h)/initial scratch area.
Tube formation assay
-
The 24-well plate was precooled, and 20 μL of Matrigel (Becton, Dickinson and Company, 356234) was added to each well to avoid air bubbles. The well plates were incubated in an incubator at 37 °C for 1 h to form a gel substrate. Then, the HUVEC cells after OGD modeling were digested, and 1.2 × 10⁵ cells per well were added to the well plate covered with Matrigel and treated with CBD or solvent. After 8 h of culture, the blood vessel formation was photographed by an inverted fluorescence microscope (Nikon Ts2R). HUVEC cells were stained using a Calcein AM fluorescent probe (Beyotime Biotechnology, C2012). The ImageJ plugin Angiogenesis Analyzer image analysis software was used to quantitatively analyze the images of the vascular network.
Transwell invasion assay
-
A 24-well transwell chamber was precooled, and 200 μL of Matrigel (Becton, Dickinson and Company, 356234) was diluted 1 : 8 with serum-free medium in each well to avoid air bubbles. The chambers were incubated in a 37 °C incubator for 1 h to allow the formation of a gel basement membrane. After incubation, the excess fluid in the upper chamber was sucked off, and then the HUVEC cells after OGD were digested. A 200 μL sample of cell suspension (treated with CBD or solvent) was added to the upper chamber covered with Matrigel, and 700 μL of complete medium was added to the lower chamber. After 24 h of incubation, 200 μL of paraformaldehyde was added to the chamber and fixed for 30 min. After washing, the cells were stained with crystal violet staining solution (Beyotime Biotechnology, C0121) for 30 min. Images were collected with an inverted fluorescence microscope (Nikon Ts2R) after gently wiping off the cells in the small wells. Quantitative analysis of captured images was performed using ImageJ software.
Pharmacokinetics assessment
-
The pharmacokinetic study in mice was performed with both intranasal and intraperitoneal routes, administered with a single dose of 20 mg·kg−1. The medication was prepared in the vehicle using 0.5% CMC-Na. A 10 μL pipette tip was used to drip the medication into the nasal cavity of the mice. After each nasal drip, the mouse's head was held upright for 30 to 60 s before the next administration. For each route, six animals were sacrificed at the following time points: 0.17, 0.25, 0.5, 1, 2, 4, 6, and 10 h post-administration. Control animals were administered the vehicle and sacrificed 1 h after dosing. Following sacrifice, blood and brain samples were collected. Blood was obtained via orbital puncture, collected into anticoagulant tubes, and centrifuged at 3,000 r·min−1 for 10 min. The plasma was then stored at −80 °C until further analysis. After orbital puncture, the entire brain was harvested and stored at −80 °C for subsequent analysis.
An equal volume of plasma from each sample was mixed with five volumes of pre-chilled methanol (containing the internal standard, pioglitazone hydrochloride, 10 ng·mL−1 in methanol) to precipitate proteins. The mixture was vortexed thoroughly and incubated at 4 °C for 30 min, followed by centrifugation at 20,000 g for 20 min. The supernatant was then carefully transferred into sample vials for subsequent analysis. Each brain was weighed, and 1.5 × (W/V) cold methanol (containing the pioglitazone hydrochloride) was added. The brain tissue was homogenized for 5 min, and the homogenate was centrifuged at 20,000 g for 20 min. The supernatant was reserved for further analysis.
CBD stock solutions (1 mg·mL−1 in methanol) were added to blank plasma homogenate to prepare working solutions with final concentrations of 0.5, 1, 2, 5, 10, 20, 50, 100, 200, 500, and 1,000 ng·mL−1, or added to blank brain homogenate to prepare working solutions with final concentrations of 0.1, 0.2, 0.5, 1, 2, 5, 10, 20, 50, 100, 200, 500, and 1,000 ng·mL−1, and were processed in the same manner as the samples. These standards were employed to construct a calibration curve, which exhibited a linear response over the entire concentration range (r > 0.99).
The concentrations were assessed using ultra-performance liquid chromatography with mass spectrometer detection. Chromatographic separation was performed using UHPLC LC-30A (Shimadzu, Tokyo, Japan). An injection volume of 1 µL of processed samples was separated on ACQUITY UPLC HSS T3 (1.8 µm, 2.1 mm × 100 mm; sourced from Waters) maintained at 40 °C. The total flow rate was 0.4 mL·min−1. Solvent A consisted of LC-MS grade water containing 0.1% formic acid, and solvent B consisted of LC-MS grade acetonitrile. The gradient elution program is as follows: 0−0.5 min, 5% B; 0.5−2.5 min, increase to 95%; 2.5−4 min, 95%; 4−4.2 min, decrease to 5%, and finally, 4.2−5 min, 5% for reconditioning the column.
CBD was quantitatively analyzed using a SCIEX QTRAP 5500 mass spectrometer in multiple reaction monitoring (MRM) mode with positive ionization. The mass spectrometry conditions were as follows: ion spray voltage (IS) was set to 5,500 V, turbo spray temperature (TEM) to 550 °C, and nebulizer and heater gas flows were both set to 55 arbitrary units. The curtain gas (CUR) was maintained at 35 arbitrary units, and the interface heater was activated. The declustering potential (DP) and collision energy (CE) were optimized to 143 V and 30 eV for CBD, and 130 V and 41 eV for the internal standard (IS), respectively. Nitrogen was used as the collision gas in all cases. The MS transitions for quantification were optimized as follows: CBD at m/z 315.2→193.1, and IS at m/z 357.0→134.1.
Pharmacokinetic parameters of CBD were determined using WinNonlin (v5.2.1). The peak concentration (Cmax) and the time to peak drug concentration (Tmax) were directly obtained from experimental data, while the area under the drug concentration-time curve (AUC) was calculated using the trapezoidal method.
Statistical analysis
-
All data are expressed as mean ± standard error of the mean using GraphPad Prism 8. Student's t-test was used for comparisons between two groups. Comparisons of more than two groups were assessed using a one-way analysis of variance (ANOVA) with Tukey's multiple comparisons test. The statistical information pertaining to the experimental data is presented within the figure legends.
-
Since there is an urgent unfulfilled clinical requirement for safe, rapid-acting, and non-invasive treatment to provide IS[36] with a safe outcome, we came up with a computational framework incorporating ML and pathway biology (Fig. 1a). The association between stroke and biological pathways, as well as its corresponding hub genes, was derived through the STRING database by employing the Cytoscape. Data on bioactivity assays related to these hub genes were obtained through the PubChem database to develop compound-pathway classification models. Each compound was represented by a molecular fingerprint, and duplicate compounds were removed across the training and external screening datasets to reduce data leakage. The resulting dataset consisted of 11,459 compound-pathway bioactivity measurements of seven different biological pathways that were involved in inflammation (Fig. 1a); oxidative stress, stroke, and individual datasets contained between 2,569 and 5,179 compounds with positive class fractions of between 10.46% and 64.51%. Five ML algorithms were used: Random Forest, Logistic Regression, XGBoost, Gradient Boosting, and Decision Trees. The hyperparameters, which were optimized with GridSearchCV when fewer than five parameters were optimized and RandomizedSearchCV when more than five parameters were optimized, were chosen by determining the highest area under the receiver operating characteristic curve (ROC AUC) on a held-out test set. On each pathway, the highest-performing algorithm was chosen, resulting in an accuracy of over 82% on held-out test sets and ROC AUCs of over 0.89 (Fig. 1c–e).
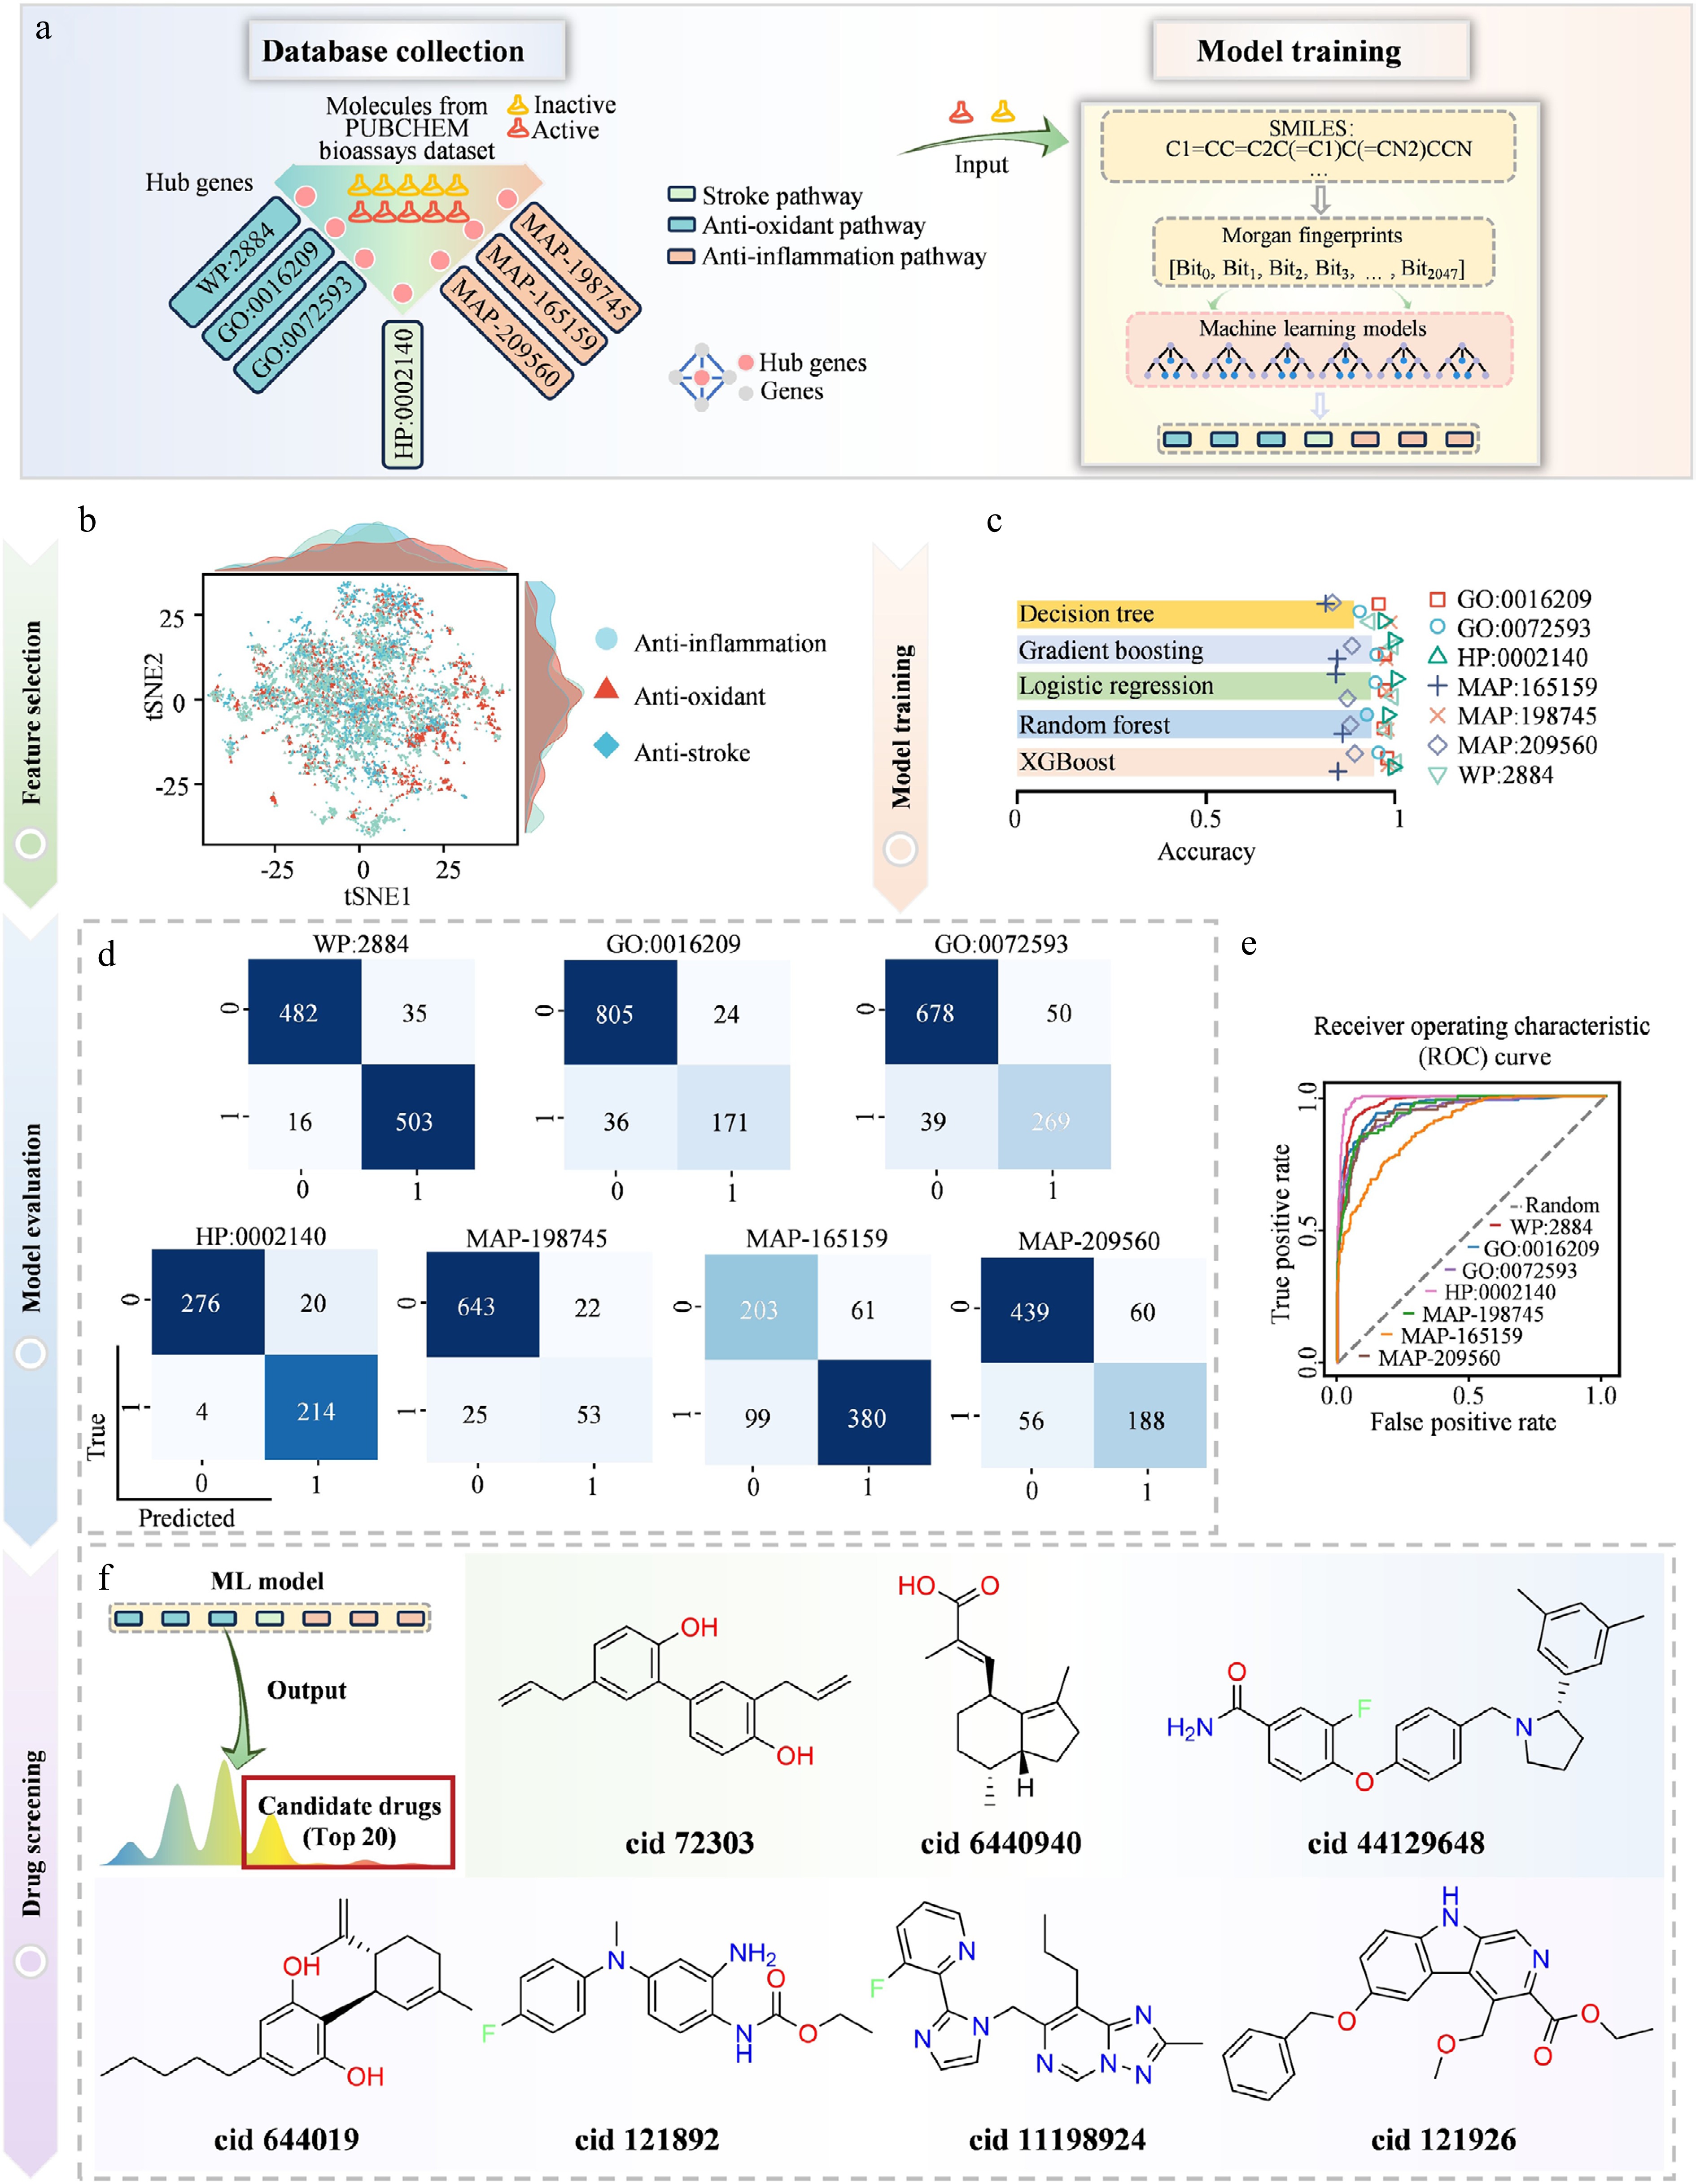
Figure 1.
The development of an ML model involving the inclusion of stroke-related biological processes. (a) Structure of data gathering and architecture of the compound-pathway classifier. (b) t-SNE plot indicating the spread of the training-set molecules that were used to generate a good-quality ML model to predict the anti-IS capabilities of compounds. (c) Comparative evaluation of five ML algorithms in tasks related to pathway classification on the held-out test set. (d) Confusion matrix of the highest-performing models of each stroke-related pathway, assessed on the held-out test set. (e) The held-out test set ROC curves show good discrimination properties (average ROC AUC > 0.89). (f) The major compounds forecasted by the ML models.
Based on the ML framework evaluated on held-out test sets, we performed virtual screening. Mental disorders have significant consequences on the health of individuals, their quality of life, and the welfare of society at large. Based on the new indications of pathophysiological overlap of mental diseases and IS, it was systematically investigated using data from a genome-wide association study (GWAS) and a Mendelian randomization (MR) methodology to clarify the possible interaction. We began by gathering GWAS data on different types of mental disorders, such as anxiety, depression, and bipolar disorder, as exposure variables. Also, we included GWAS data on representative diseases of older people comprising both neurodegenerative and cardiovascular diseases in addition to metabolic ones, in particular Alzheimer's disease, heart failure, and stroke, as outcome variables. Our MR analysis found a positive genetic relationship between anxiety and hypertension (β = 0.0783; IVW P < 0.001) and stroke (β = 0.1315; IVW P < 0.05) (Supplementary Fig. S3a–S3c; Supplementary Table S2). Combined, our results strongly support the presence of a significant link between the level of anxiety and the risk of stroke, and can thus be considered a possible causal factor in the development of stroke; it is important to address this in preventive measures against stroke. Based on the observed genetic association between anxiety-related traits and stroke, we hypothesized that some licensed anxiolytic drugs may possess potential anti-IS activity. We identified 255 small-molecule anxiolytics based on DrugBank and PubChem, removed duplicates and compounds with inconsistent annotations, and extracted features with the same ECFP4 fingerprinting process used by the training data. The best-performing ML model for each pathway was used to prioritize these compounds, and the top-ranked 20 compounds were selected as computational candidates (Supplementary Table S4), with some examples given in Fig. 1f. This is an example of an AI-assisted drug repurposing procedure based on pathophysiological convergence to focus on clinically relevant candidates.
Development and application of LGE-GNN model predicting gene expression profiles
-
In order to improve the accuracy of compound predictions, we further refined the screening process by including the directionality of modifications of gene expression. We obtained transcriptomic information on 978 landmark genes of different cell types in the LINCS L1000 (Library of Integrated Network-based Cellular Signatures 1000, L1000) Database[18,37]. This database contains gene expression profiles induced by various compounds at different doses, treatment durations, and cell lines. The perturbation profiles were preprocessed to generate average expression profiles for each compound-cell line-dose-time condition. Each averaged profile represented the typical transcriptional response of one compound under a defined experimental condition. These profiles were then divided at the compound-cell line level into a training set (80%) and a held-out test set (20%) using a fixed random seed, ensuring that the same compound-cell line profiles did not appear in both sets. On top of such training data, we have applied a two-stage modeling system to estimate gene expression patterns (Fig. 2a and b). In the first stage, the 978-gene expression profiles were compressed into a simplified representation that retained major gene expression patterns. In the second stage, LGE-GNN used compound structure information and cell-line information to predict this simplified gene expression representation. To predict these latent features, LGE-GNN combines molecular graph representations (created using DeepChem MolGraphConvFeaturizer[38]) with cell line embeddings as inputs. The predicted representation was then converted back into the full 978-gene expression profile. To consider biological variability, the model was executed eight times, as a surrogate of biological replicates (Fig. 2c). When compared to earlier experiments using linear regression, the LGE-GNN performed significantly better with a Pearson correlation coefficient of 0.9517 on the held-out test set. These results suggest that LGE-GNN can effectively predict compound-associated transcriptomic responses in this dataset.
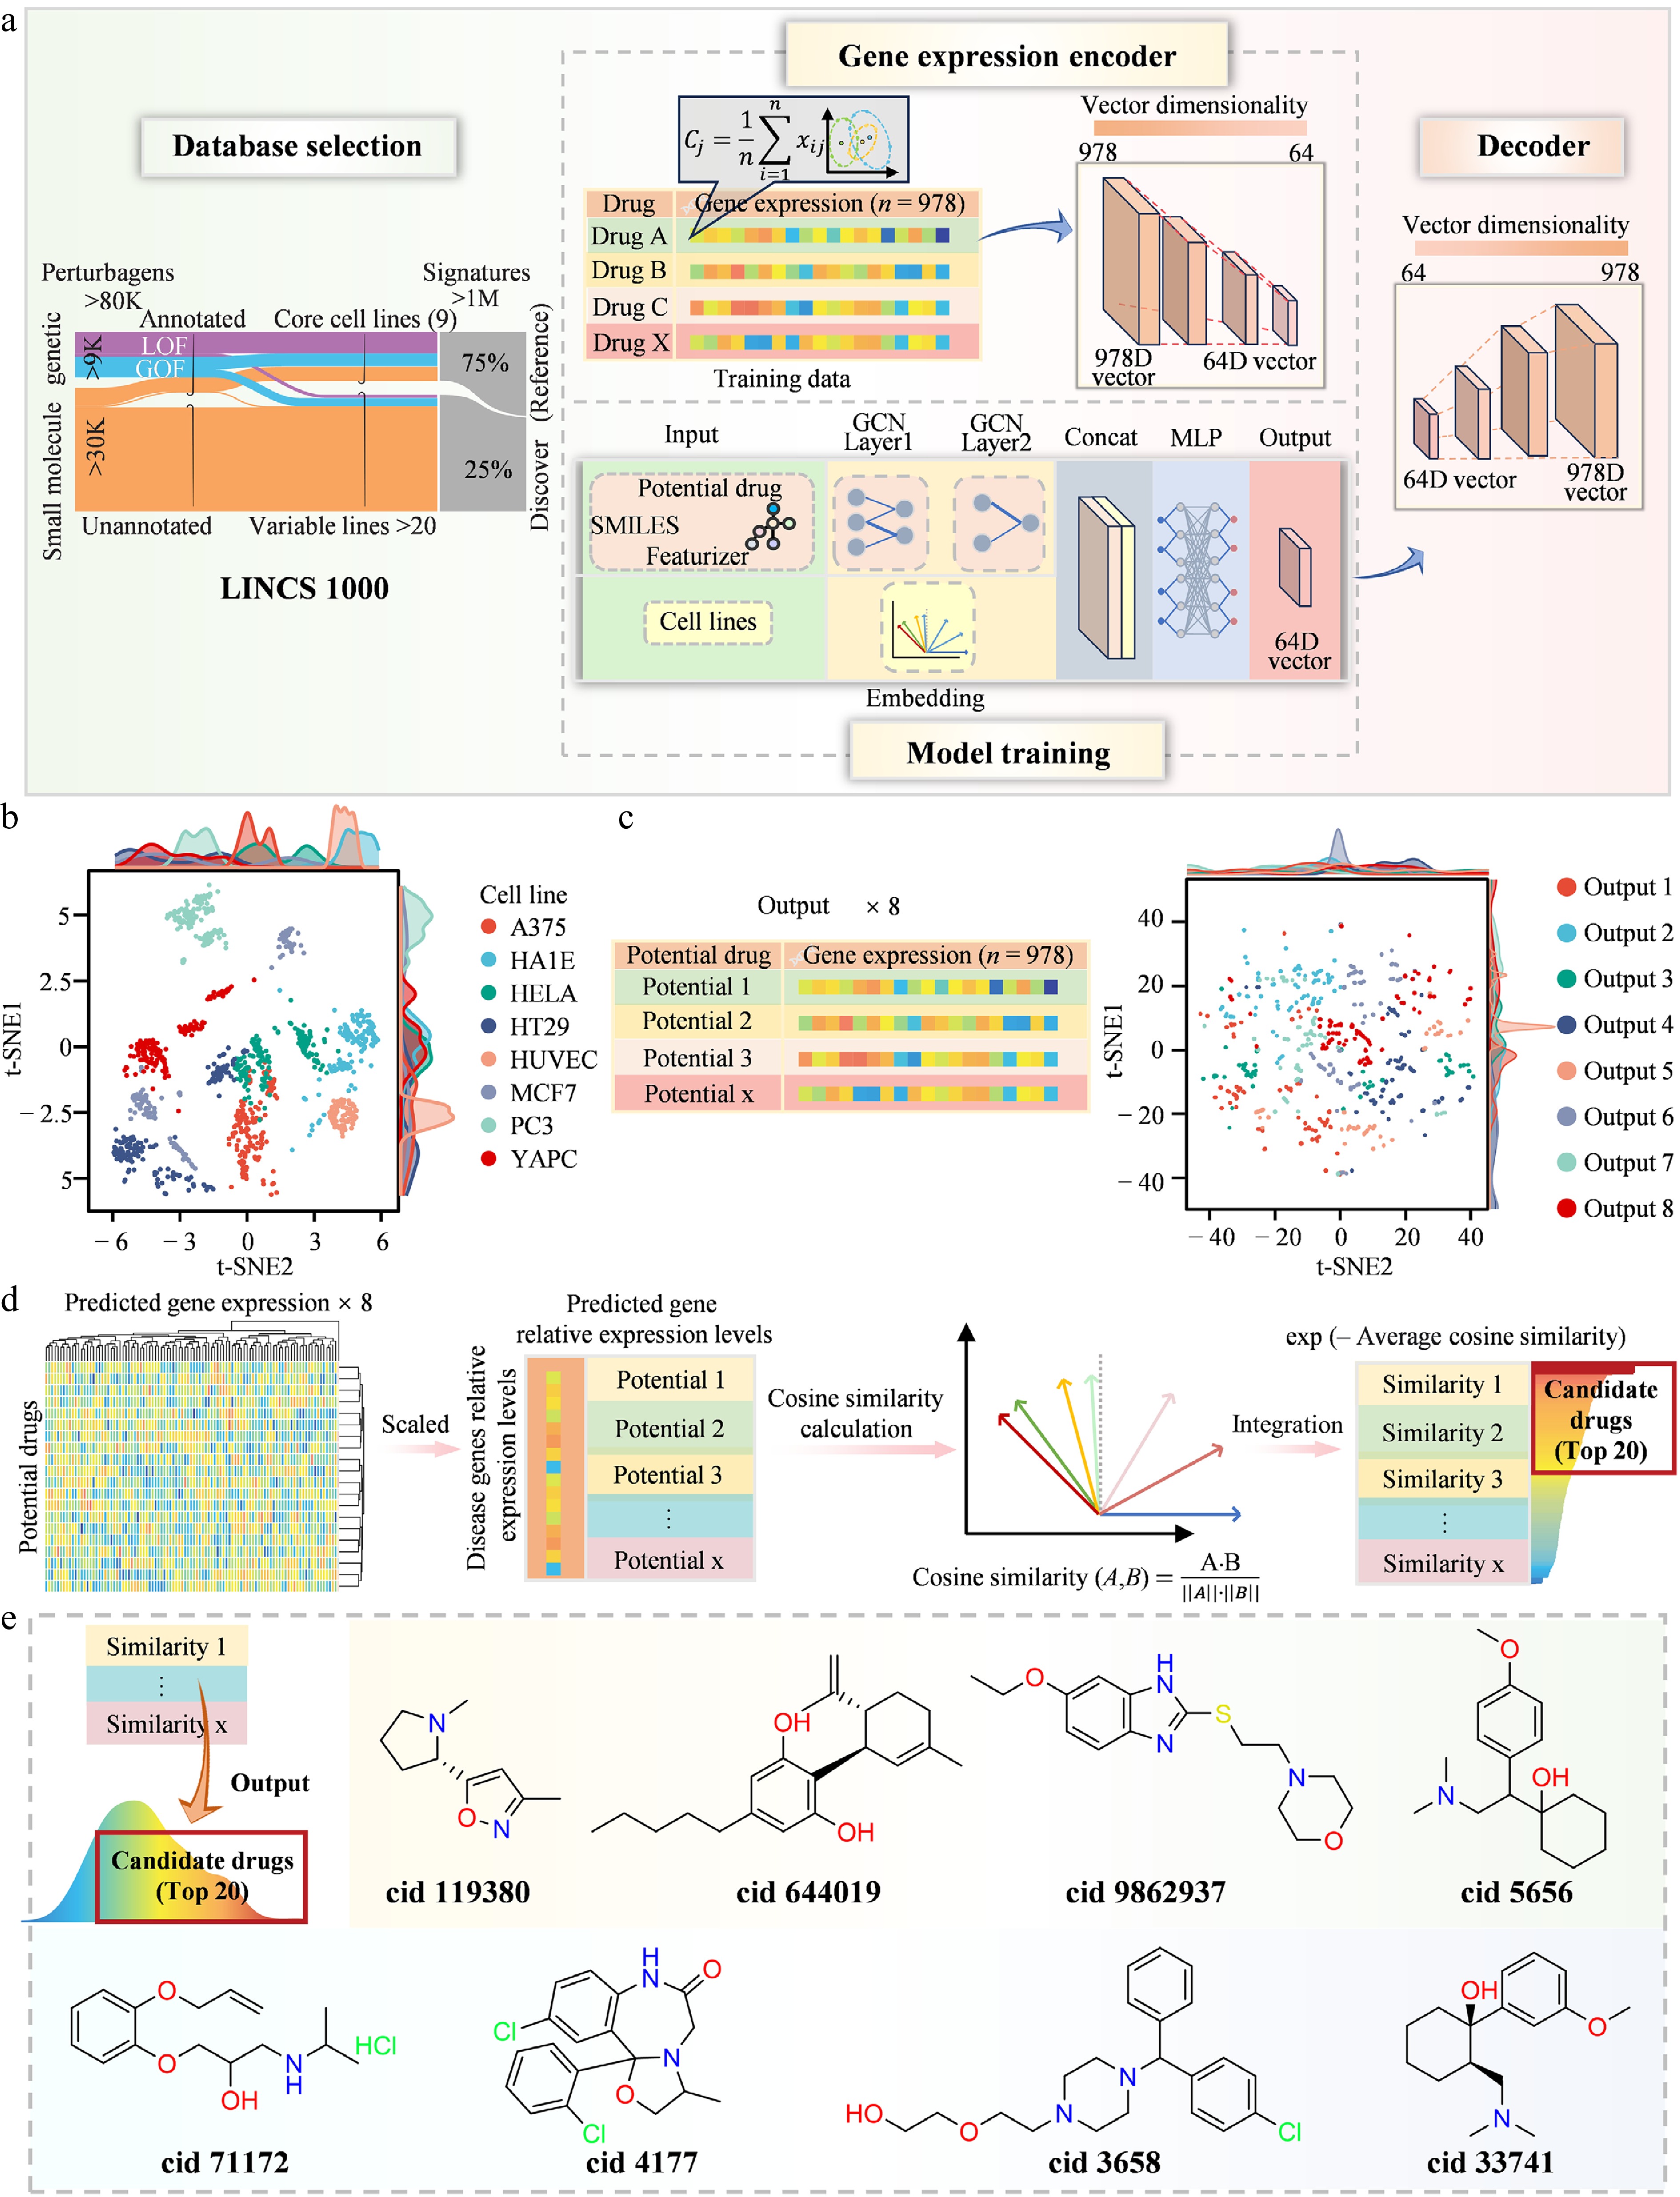
Figure 2.
The development and application of the LGE-GNN model predicting gene expression profiles. (a) Flowchart illustrating the data collection process and model architecture of the LGE-GNN for gene expression prediction. (b) t-SNE plot showing the distribution of compounds from different cell lines in the training set. (c) t-SNE plot of predicted transcriptomic profiles for anxiolytics, generated from repeated LGE-GNN predictions. (d) Pipeline of the drug screening workflow for anti-IS candidates using the LGE-GNN model. (e) Representative top-ranked candidate compounds identified by the LGE-GNN model.
Pharmacological efficacy of the predicted compounds was investigated based on single-cell sequencing data obtained using the tissue of cortical tissue in the middle cerebral artery occlusion (MCAO) mouse (GSE225948[39] and GSE174574[40]) datasets. After batch correction, clustering, and cell-type annotation, endothelial cells showed the largest number of differentially expressed genes, suggesting that endothelial cells are strongly affected during ischemic stroke pathology (Supplementary Fig. S4a–S4d). This was followed by LGE-GNN to infer the transcriptomic profiles of candidate compounds in human umbilical vein endothelial cells (HUVECs). Negative cosine similarity values were computed to measure the alignment between each compound and the disease transcriptomic profile to rank them (Fig. 2d; Supplementary Table S5). The top 20 compounds were qualified as candidates; some examples are presented in Fig. 2e. Overall, the LGE-GNN framework provided a transcriptome-informed strategy for prioritizing potential anti-IS compounds for subsequent experimental validation.
Establishment of a DDN model for predicting bioactive substructures
-
To investigate the structure–activity relationships (SAR) of anti-IS therapeutics and facilitate rational drug design, we developed the DDN deep learning framework, which predicts the therapeutic potential of bioactive substructures in cellular microenvironments through integrative analysis of molecular signatures (Fig. 3a). In brief, DDN combined compound structure information, cell-line information, and transcriptomic response data to generate a predicted reversal score for each compound-cell line pair. For this task, we randomly partitioned the data into training and held-out test sets with a 90/10 split at the compound-cell line level. After data splitting, each compound was decomposed into smaller chemical fragments using the BRICS method. To reduce information leakage, we ensured that fragments present in the training set were not included in the held-out test set. Model performance was evaluated by comparing the predicted reversal scores with the observed reversal scores. High concordance indicated by clustered points along the diagonal (y = x) showed strong prediction strength (Fig. 3b). The coefficient of determination (R2) of the DDN model in the held-out test set was 0.5104. As a comparative method, two common QSAR software packages were run against the same training data, namely Schrödinger and Discovery Studio, with both their respective models based on partial least squares (PLS) and multiple linear regression (MLR). The DDN model performed much better compared to Schrödinger models such as the MolPrint2D model (R2 = 0.1185) and Radial model (R2 = 0.0969), and to the Discovery Studio models such as the PLS model (R2 = 0.0449) and MLR model (R2 = 0.2167) as seen in Supplementary Fig. S5a–S5d. With the aid of a quantitative scoring scheme, the model organized the 5,928 bioactive substructures derived from the L1000 database into systematic classifications of 1,015 substructure fragments as therapeutic and 4,913 as pathogenic. Representative high- and low-scoring fragments are shown (Supplementary Table S6; Fig. 3c). These categories should be interpreted as model-based fragment prioritization results rather than direct experimental evidence of therapeutic or pathogenic activity.
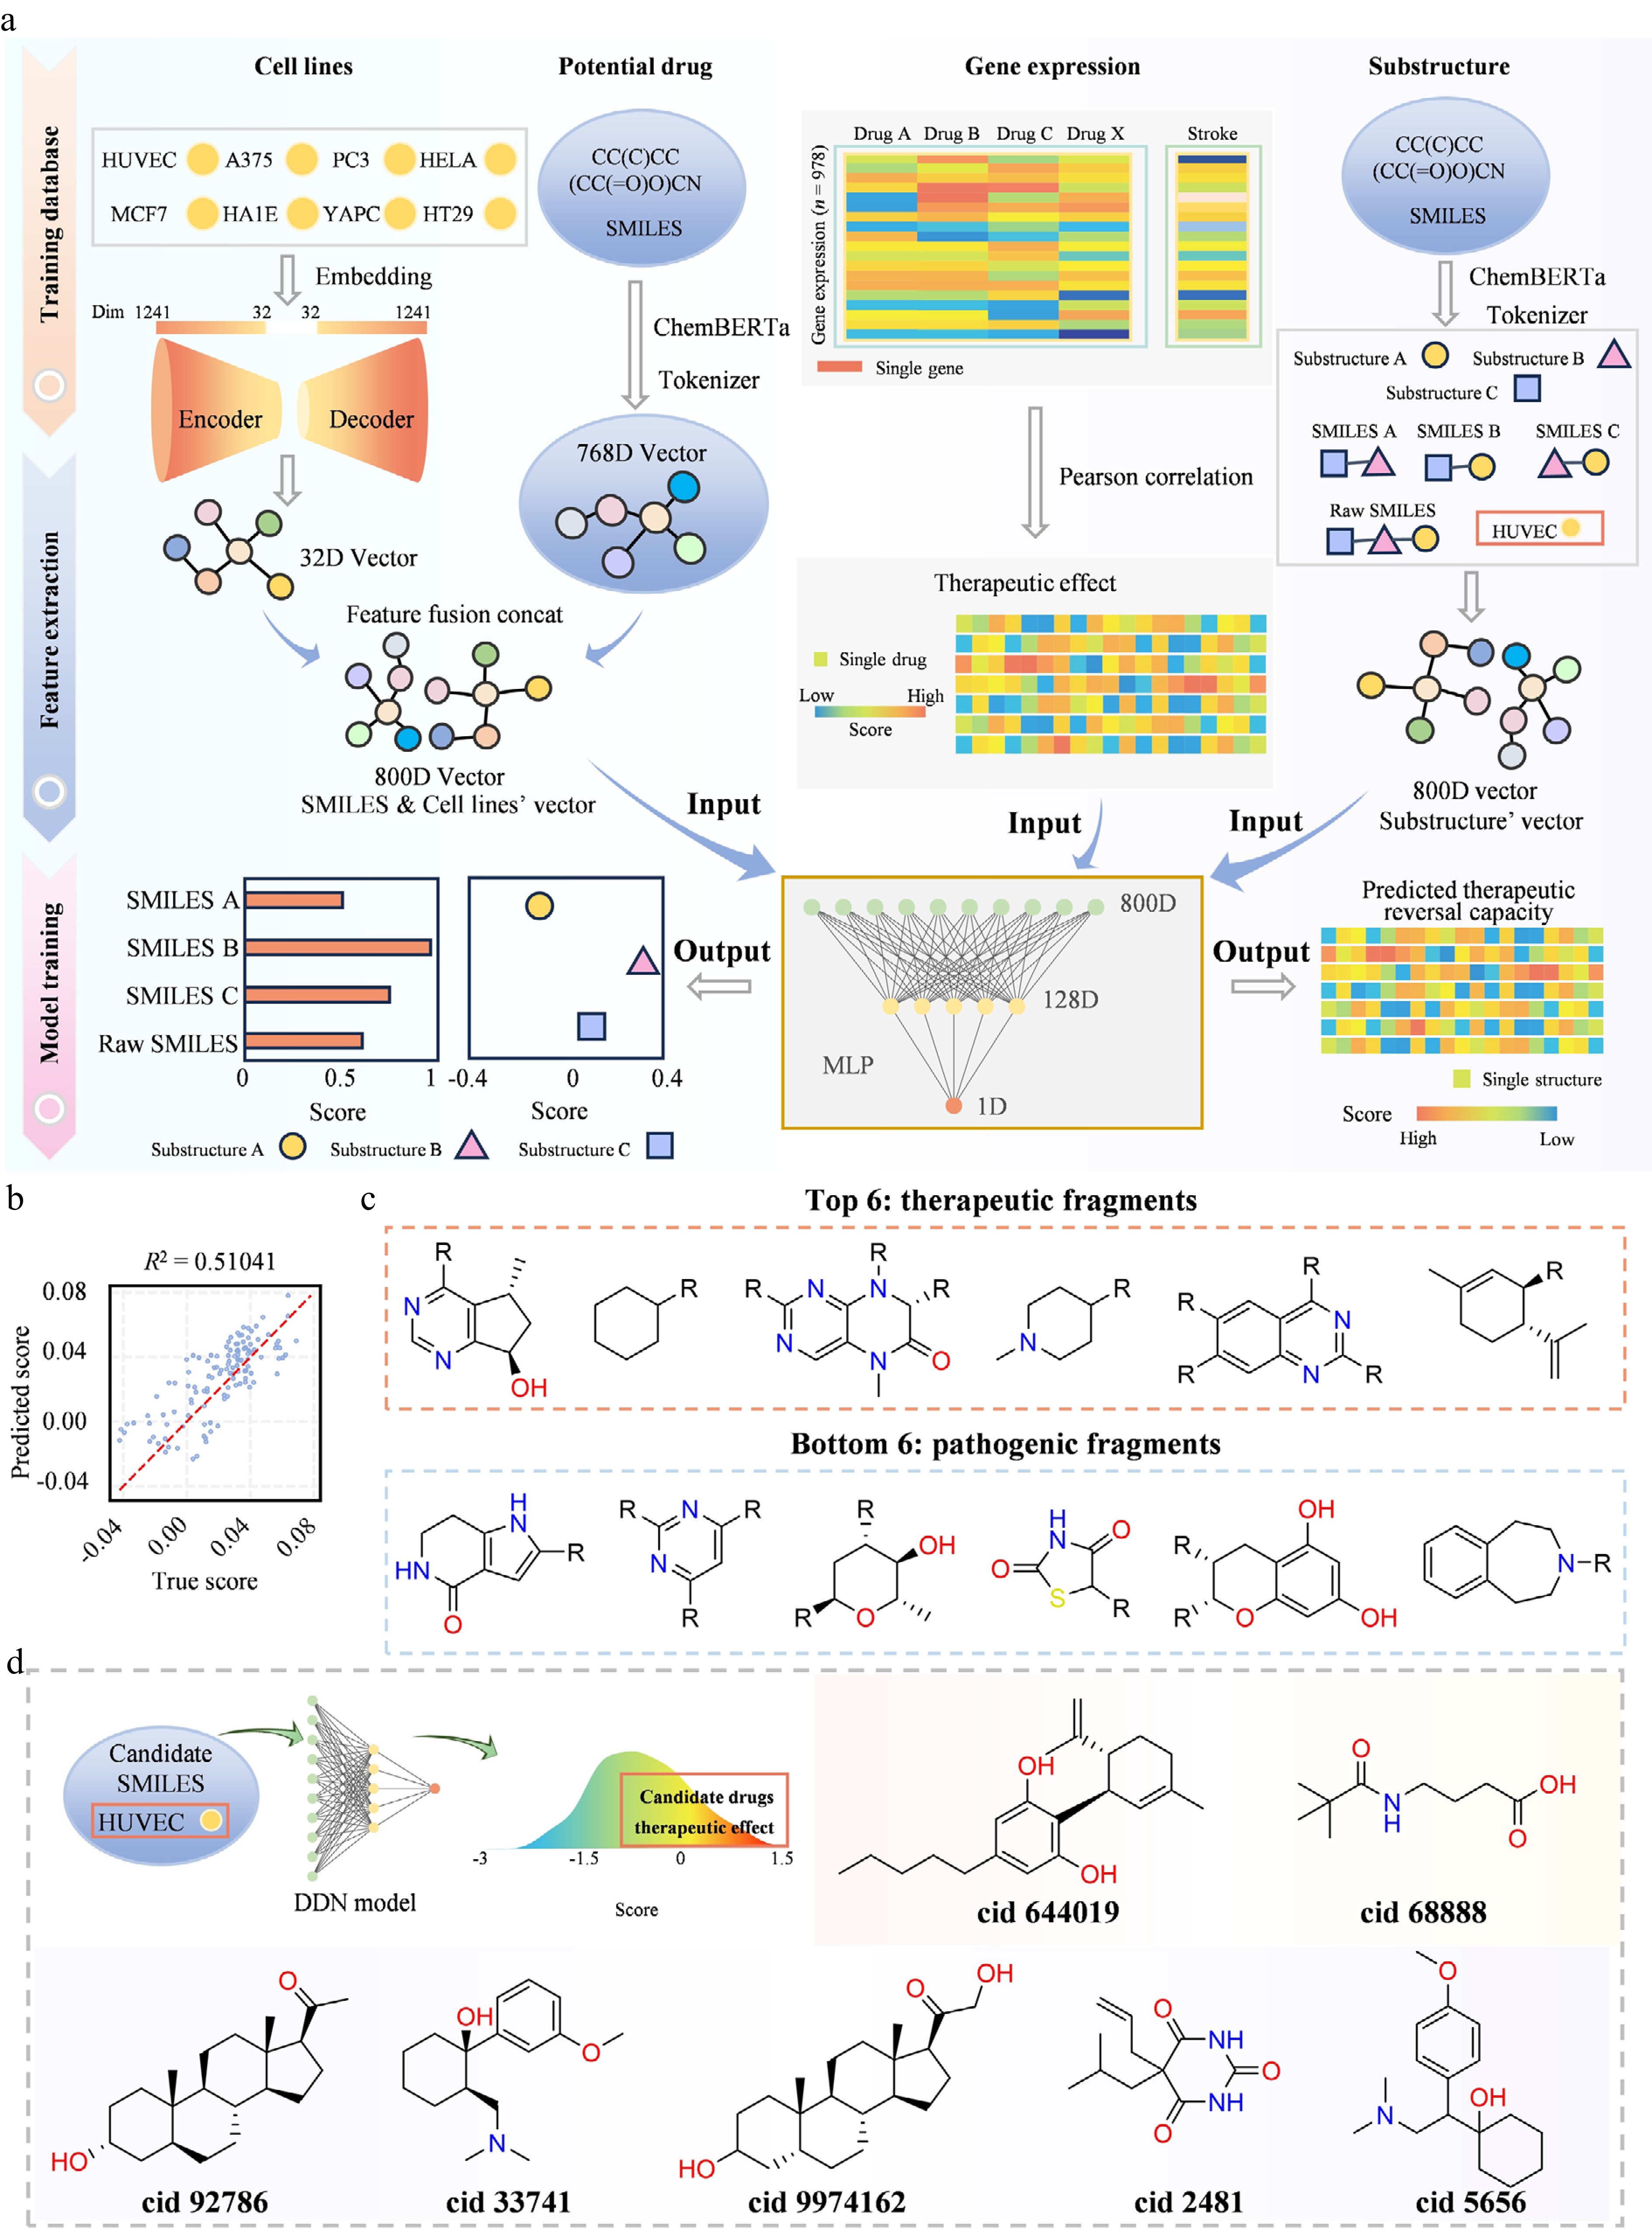
Figure 3.
The establishment and application of the DDN model predicting bioactive substructure for IS. (a) Schematic overview of the DDN model architecture. (b) Scatter plot illustrating predicted vs true reversal scores for compound-cell line pairs in the held-out test set. (c) Representative high-scoring therapeutic and low-scoring pathogenic substructures for IS. (d) Example compounds prioritized by the DDN model.
Based on the established DDN model, the 255 anxiolytic drugs were further screened through therapeutic potential scoring, revealing 43 candidates with predicted neuroprotective efficacy (Supplementary Table S7). Scores were derived through DMSO-normalized scoring under matched experimental conditions, with several prioritized high-scoring candidates presented (Fig. 3d). Collectively, the DDN model identified IS-therapeutic bioactive substructures and established a fragment-based optimization framework for subsequent rational anti-IS drug development.
AI-aided drug repurposing identified CBD as a promising therapeutic candidate for IS
-
After implementing a multimodal computational framework to discover IS treatment, we combined all the possible predictions made by our three different AI screening pipelines to allow prioritization of candidates based on mechanism of action. Using three stringent rounds of AI-based screening, two out of 255 compounds, namely cannabidiol and doramectin, were selected (Fig. 4a). Our in vitro experiments in HT22 cells subjected to OGD/R injury provided experimental support for the computational prioritization of CBD. CBD exhibited lower cytotoxicity than doramectin at higher concentrations under normal culture conditions (Supplementary Fig. S6a). In OGD/R-exposed HT22 cells, CBD preserved cell viability more effectively than doramectin (Fig. 4b). In addition, CBD was also an effective regulator of the antioxidant indexes of HT22 cells post-OGD/R (Supplementary Fig. S6b–S6e).
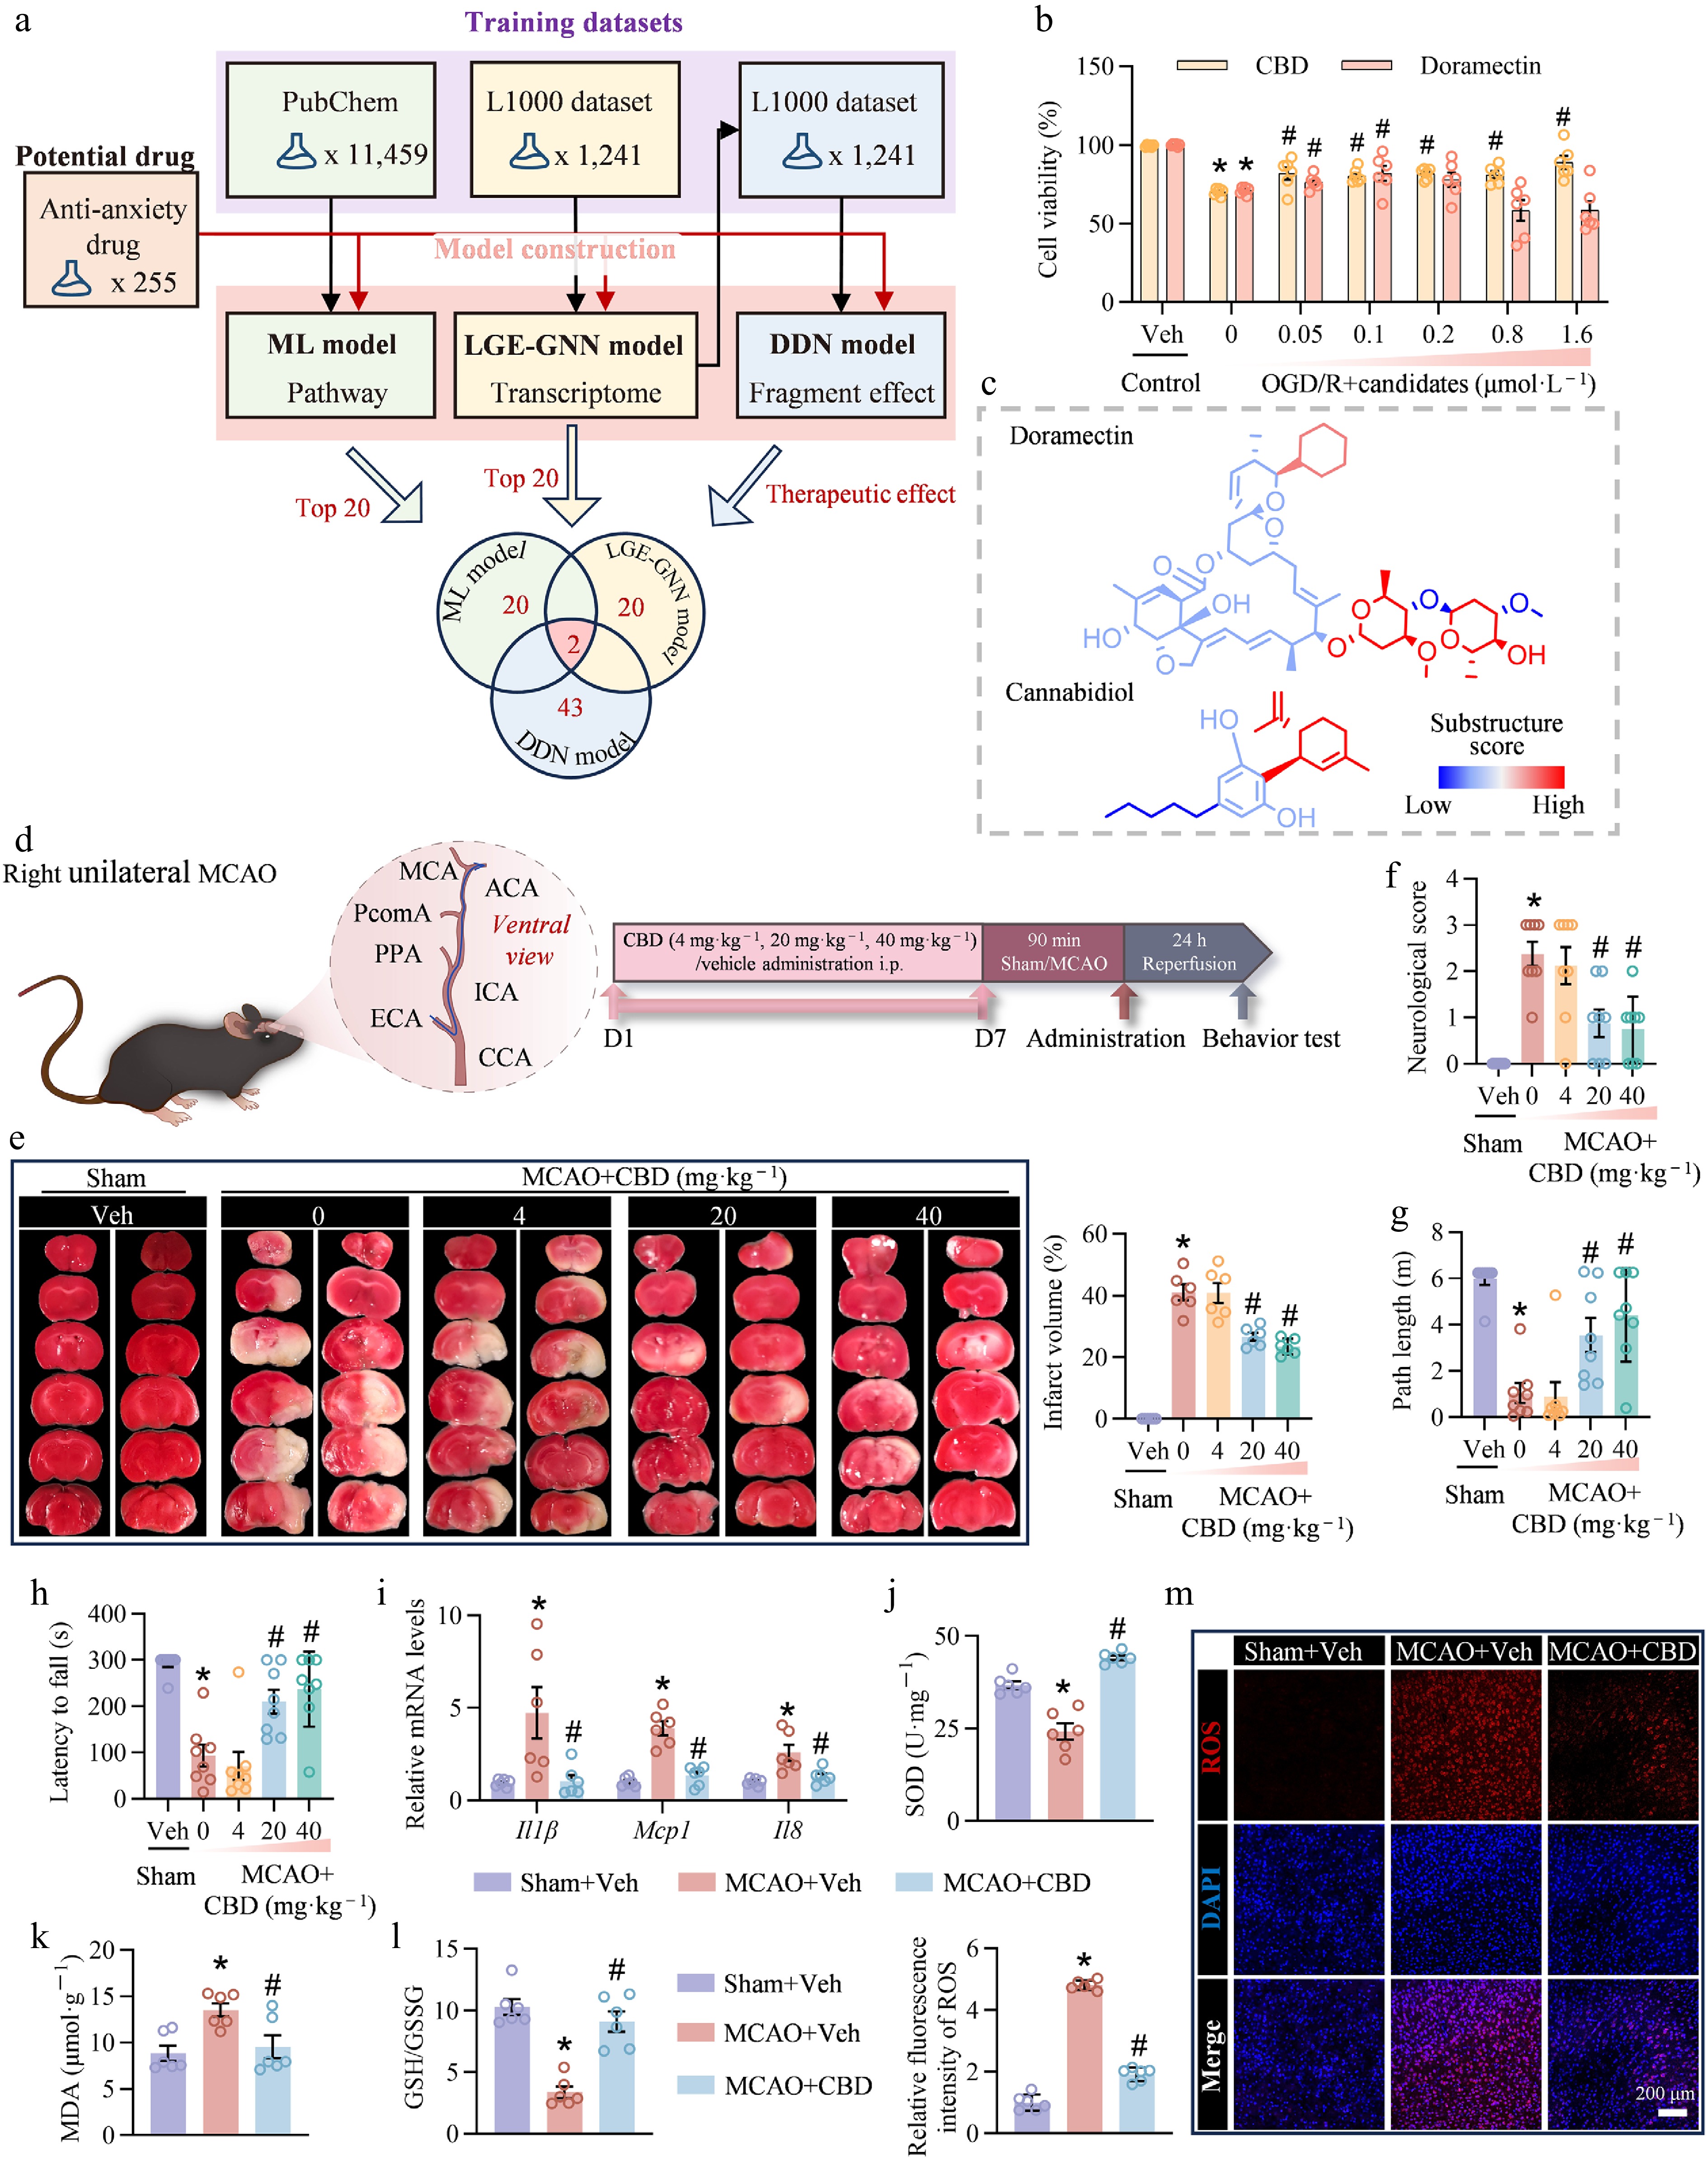
Figure 4.
AI-aided drug repurposing identifying CBD as a promising therapeutic candidate for IS. (a) Two candidates identified by the ML model, LGE-GNN model, and DDN model. (b) HT22 cells subjected to OGD/R were employed to evaluate the anti-IS efficacy of two candidates (n = 6 per group). (c) Fragment-level visualization based on the predicted therapeutic scores. Each compound was decomposed into structural fragments using the BRICS algorithm. Fragments were colored according to their individual contribution scores, using a blue-to-red gradient: blue indicates lower therapeutic potential, while red highlights fragments with higher predicted therapeutic efficacy. (d) Schematic of the animal experimental design. (e)–(h) CBD showed a threshold-like protective effect across the tested doses. These data were used to identify a working dose for subsequent mechanistic studies and were not intended to define a formal dose-response curve. (e) Brain infarction volume was determined by TTC staining and the analysis of brain infarction volume (n = 6 per group). (f) Assessment of short-term neurological function by Longa neurological score (n = 8 per group). (g) Total distance traveled in the rotarod test (n = 8 per group). (h) Latency to fall from the rotating rod (n = 8 per group). (i) Relative mRNA levels of inflammatory factors (Il1β, Mcp1, and Il8) (n = 6 per group). (j)–(l) SOD activity, MDA levels, and GSH/GSSG levels at 24 h after MCAO (n = 6 per group). (m) Representative fluorescence micrographs and the statistics of DHE staining in perilesional cortex (scale bar = 200 μm, n = 6 per group). Data are presented as mean ± SEM. * P < 0.05 compared to sham group or control group; # P < 0.05 compared to MCAO group or OGD/R group.
In order to clarify structural reasons that could explain different anti-IS efficacy between CBD and doramectin, we have performed SAR studies utilizing the DDN model, based on the decomposition of substructures and pharmacophoric scores (Fig. 4c). In this analysis, each compound was decomposed into structural fragments, and the contribution of each fragment was estimated according to the change in predicted therapeutic reversal score after virtual fragment removal. A positive contribution score indicates that the fragment is predicted to support the anti-IS transcriptomic reversal profile, whereas a negative score suggests a potential structural liability. The DDN analysis recognized the (+)-dipentene-containing region of CBD as a putative favorable substructure. This finding suggests that the terpene-like hydrophobic moiety of CBD may contribute to its predicted anti-IS activity, possibly by maintaining a favorable molecular topology, lipophilicity, and CNS-relevant exposure properties. In addition, the phenolic hydroxyl groups and alkyl side chain of CBD may further contribute to redox-modulating activity, membrane permeability, and overall pharmacological balance. In contrast, doramectin contained several lower-scoring substituted tetrahydropyran-like fragments, which may represent structural liabilities and may partially explain its weaker therapeutic profile in our validation assays. Notably, the DDN-derived SAR should be interpreted as a computational, hypothesis-generating analysis that requires further experimental validation of CBD analogs or derivatives.
The DDN model assigned a high predicted contribution score to the (+)-dipentene fragment of CBD, suggesting that this fragment may contribute to its predicted anti-IS activity. Conversely, doramectin suffered structural liabilities, such as poor-scoring substituted tetrahydropyran moieties, which may account for its weaker therapeutic efficacy. Such SAR lessons therefore outline an appropriate pathway along which future medicinal chemistry optimization needs to proceed, i.e., remove structural weaknesses to optimize anti-IS effectiveness.
In order to confirm possible neuroprotective effects of CBD on cerebral I/R injury we gave CBD (4, 20 or 40 mg·kg−1)[41,42] or vehicle to MCAO mice over 7 d, and an added dose to them at the start of reperfusion (Fig. 4d). TTC staining findings showed that unlike the sham group, the MCAO group had a substantial increase in cerebral infarct volume. Conversely, CBD treatment reduced infarct volume in a threshold-like manner within the tested dose range. The 4 mg·kg−1 dose produced little or no significant protection, whereas both 20 and 40 mg·kg−1 markedly reduced infarct volume (Fig. 4e). Consistently, neurological deficit scores and rotarod performance were improved mainly at 20 and 40 mg·kg−1 (Fig. 4f–h). Because the three doses were not evenly spaced on either a linear or logarithmic scale, these results should not be interpreted as defining a complete dose-effect relationship. Rather, the comparable efficacy between 20 and 40 mg·kg−1 suggests that 20 mg·kg−1 was sufficient to approach the maximal protective effect under the present experimental conditions. Therefore, 20 mg·kg−1 was selected for subsequent mechanistic studies as the lowest tested dose with robust efficacy, while avoiding unnecessary exposure to a higher dose. Moreover, CBD effectively suppressed the MCAO-mediated elevation of inflammatory cytokines, thus alleviating the inflammatory response (Fig. 4i). The antioxidant enzyme activities of superoxide dismutase (SOD) and glutathione (GSH) were significantly lowered, and malondialdehyde (MDA) levels, which are used as markers of oxidative stress, were increased in the MCAO group. SOD and GSH activities and MDA levels were restored by treating with CBD (Fig. 4j–l). The reduction of reactive oxygen species (ROS) production in ischemic brain tissue by CBD was further supported by dihydroethidium (DHE) staining (Fig. 4m). Importantly, these experimental results support the utility of the AI-assisted screening framework for prioritizing CBD as a candidate compound, emphasizing its ability to determine safe and effective drugs. CBD is a non-psychoactive Cannabis sativa extract with proven low human toxicity[43,44] and is licensed to be used in several European countries in Lennox–Gastaut (LGS) and Dravet syndrome (DS) treatments[45], besides the FDA orphan drug status in treating difficult-to-control childhood seizures[46]. Our AI pipelines efficiently point out CBD as an anti-IS lead compound through drug repurposing. These results demonstrate that the proposed AI-integrated framework can efficiently recover biologically plausible candidates, rank them through multi-layered computational evidence, and provide mechanistic and pharmacophore-level explanations for subsequent validation.
LGE-GNN-guided identification of the NRF2 pathway as a mediator of the neuroprotective action of CBD
-
In order to clarify the background mechanism of protection offered by CBD in the injury caused by I/R, we used a prediction predictive model driven by the technology of AI to assist in discovering drug targets in detail (Fig. 5a). With the GEO dataset provided by LINCS, we initially fitted a linear regression model to estimate the entire gene expression profiles using L1000 landmark genes (Supplementary Fig. S7a). We also used our established LGE-GNN model to create transcriptomic profiles of CBD-treated and DMSO-treated cells to yield in silico biological replicates to simulate biological variability. These replicates made it possible to perform downstream analysis of differential gene expression (Fig. 5b; Supplementary Table S8). Differentially expressed genes were analyzed with Gene Ontology (GO), and the analysis suggested that CBD may affect important biological processes, such as phosphatidylinositol biosynthesis, organelle disassembly, epithelial cell development, cell count regulation, and protein stability regulation (Supplementary Fig. S7b). It is important to note that hub gene analysis indicated NRF2 as a core node in the protein–protein interaction (PPI) network, with a significant change in expression levels (Fig. 5c). Single-cell RNA sequencing (scRNA-seq) data also confirmed upregulation of NRF2 in endothelial cells and additional cell types in the MCAO group (Fig. 5d; Supplementary Fig. S8a–S8d). These results are solid evidence that NRF2 acts as a crucial mediator of CBD in treating a stroke. NRF2, which functions as the master regulator of the antioxidant response, is crucially involved in the fight against oxidative stress and in the maintenance of cellular redox homeostasis[47,48]. Integrating these results into the current IS literature, NRF2 activators have been demonstrated to improve neuron survival, minimize infarct size, and stimulate vasomotor remodeling in preclinical stroke models[49−51]. Biological validation based on AI predictions showed that NRF2 expression and activity significantly increased upon CBD treatment (Fig. 5e). Together with the upregulation there was elevated expression of the target genes of NRF2 which is encoding the major antioxidant enzymes and proteins such as glutathione S-transferase (Gst), quinone oxidoreductase-1 (Nqo1), and heme-oxygenase-1 (Hmox1)[52], as also supported by our findings (Fig. 5f). The findings mean that CBD protects against I/R injury by mediating NRF2-dependent antioxidant responses, which ensures redox balance and cellular resiliency.
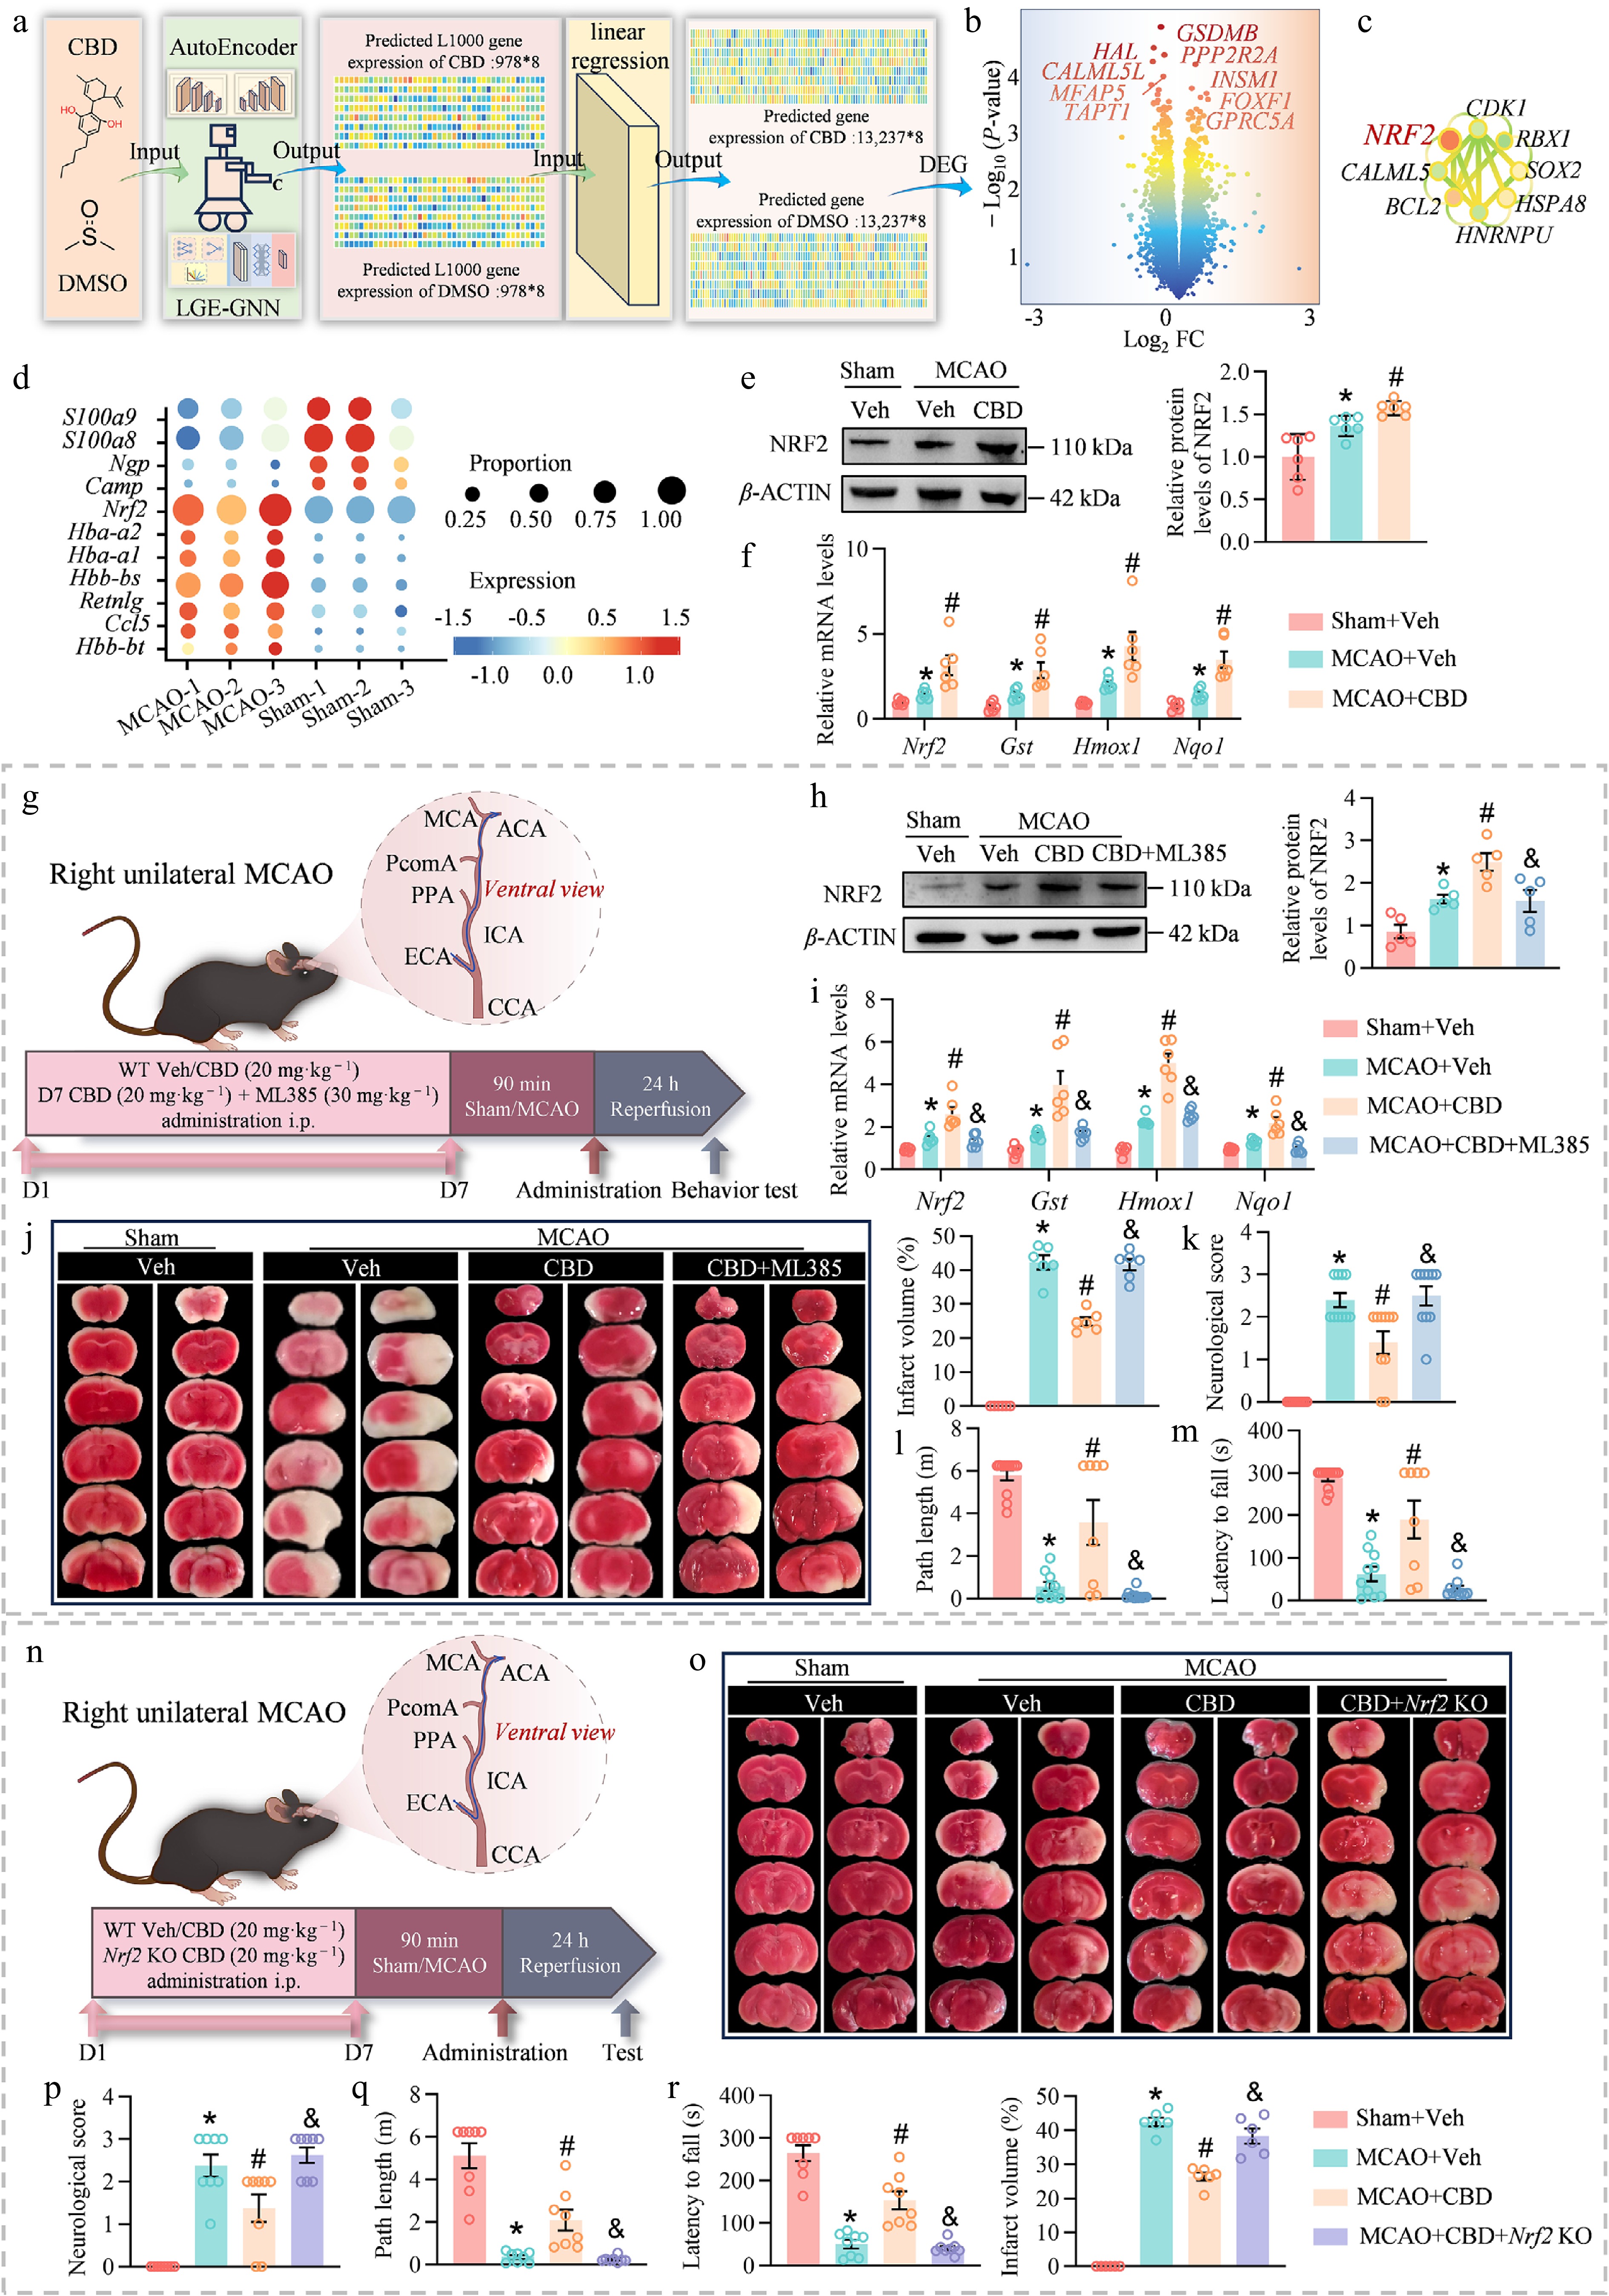
Figure 5.
CBD protects against I/R injury through NRF2-mediated antioxidant defense. (a) Flowchart depicts the potential differential gene analysis in CBD using LGE-GNN (n = 16). (b) A volcano plot shows the hypothetical differential genes in CBD. (c) The network diagram shows the hub genes of the differential genes with their interactions. (d) Heat map exhibits the expression of several genes of endothelial cells belonging to the sham group and the MCAO group. (e) Western blot assays show the relative protein level of NRF2 (n = 6 per group). (f) Relative mRNA levels of Nrf2, Gst, Hmox1, and Nqo1 (n = 6 per group). (g) Schematic of the animal experimental design. (h) Western blot assays show the relative protein level of NRF2 (n = 5 per group). (i) Relative mRNA levels of Nrf2, Gst, Hmox1, and Nqo1 (n = 6 per group). (j) Brain infarction volume was determined by TTC staining and the analysis of brain infarction volume (n = 6 per group). (k) Assessment of short-term neurological function by Longa neurological score (n = 10 per group). (l) Total distance traveled in the rotarod test (n = 8−12 per group). (m) Latency to fall from the rotating rod (n = 8−12 per group). (n) Schematic of the animal experimental design. (o) Brain infarction volume was determined by TTC staining and the analysis of brain infarction volume (n = 6 per group). (p) The measurement of short-term neurological function through Longa neurological score (n = 8 per group). (q) The amount of total distance moved during the rotarod test (n = 8 per group). (r) The time until the rotating rod falls (n = 8 per group). Data are presented as mean ± SEM. * P < 0.05 in comparison with the sham group; # P < 0.05 in comparison with the MCAO group; & P < 0.05 in comparison with the CBD-treated group.
To prove the important position of NRF2 in CBD protection against I/R injury, we administered ML385, an exclusive NRF2-inhibiting agent into MCAO mice treated with CBD (Fig. 5g). The administration of ML385 could block both the NRF2 activation and its downstream gene expression caused by CBD (Fig. 5h). Such inhibition was associated with decreased mRNA levels of major antioxidant genes of NRF2 pathway including Gst, Hmox1, and Nqo1 suggesting that inhibition of NRF2 negatively affects the efficacy of CBD as a therapy (Fig. 5i). Conversely, it was found out that ML385 markedly attenuated the CBD-mediated reduction in infarct volume and diminished the neuroprotective effect of CBD (Fig. 5j). In addition, neurological evaluations also revealed that ML385 increased the severity of ischemic injury (as indicated by increased neurological deficit scores and lower performances in rotarod test) (Fig. 5k–m). We next assessed the oxidative stress markers in order to establish the effect of NRF2 inhibition on redox homeostasis. ML385-induced inhibition of NRF2 resulted in increased MDA and ROS levels, decreased activities of SOD and GSH (Supplementary Fig. S9a–S9d). These findings are consistent with the conclusion that CBD mitigates oxidative stress via NRF2-linked antioxidant reactions, which stabilize redox balance in the presence of I/R.
The necessity of NRF2 to mediate CBD-based neuroprotection was reinforced with an experiment on Nrf2 knockout (KO) mice (Fig. 5n; Supplementary Fig. S9e and S9f). The results of TTC staining showed that the area of infarcts in these mice was significantly larger than that of wild-type mice (Fig. 5o). A behavioral test indicated significant neurological and motor function impairment of Nrf2 KO mice that supported the loss of the therapeutic effect of CBD (Fig. 5p–r). It is important to note that CBD has the potential to minimize oxidative stress and increase antioxidant protection, which was also seen in the wild-type mice but not in the knockout animals (Supplementary Fig. S9g–S9j). These pharmacological and genetic perturbation experiments provide functional evidence that NRF2 activation is required for the antioxidant and neuroprotective effects of CBD in I/R injury. The attenuation of CBD-mediated protection by both ML385 treatment and Nrf2 deficiency indicates that the NRF2 pathway is not merely transcriptomically associated with CBD response, but functionally participates in regulating downstream antioxidant gene expression, redox homeostasis, infarct development, and neurological recovery.
Altogether, these pharmacological and genetic data support a necessary role for NRF2 in CBD-mediated neuroprotection in the MCAO model. CBD has a wide variety of pharmacological properties, and the biochemical pathways that regulate its action within the neural system are significantly complex. Within IS, CBD increases NRF2-mediated gene transcription of an antioxidant gene and reduces oxidative stress-induced injury, which leads to synergetic expression of anti-apoptotic and anti-neuroinflammatory effects and establishes its potential role as a major therapeutic candidate in IS pathophysiology. These results further support the value of the AI-based framework in generating experimentally testable mechanistic hypotheses.
DeepD2V-enhanced identification of BMAL1 as a centrally NRF2-regulated target driving CBD-induced angiogenesis
-
Although best known as a master regulator of redox homeostasis, NRF2 is also a multi-functional transcriptional factor regulating the expression of numerous downstream genes encoding various biological processes[53]. To test whether the activated NRF2 by CBD has pleiotropic effects apart from its antioxidative activity, we used deep learning technology to predict and prioritize potential downstream target genes[54,55]. Particularly, we used DeepD2V architecture based on ENCODE data[56], where data preprocessing was done with gkmSVM[57] (Fig. 6a). It had high accuracy (0.94) and ROC values (0.98) (Supplementary Fig. S10a–S10c) and predicted 7,655 NRF2-regulated genes, which were enriched in vital events like rhythmic regulation and development of the muscles (Supplementary Fig. S10d). CUT&Tag sequencing also confirmed these predictions, showing strong overlap between motifs found in brain tissues (Supplementary Fig. S10e and S10f). Combining these data, we have found that among humans and mice, there are 2,549 conserved regulatory genes of NRF2, and they were also significantly enriched in pathways including angiogenesis and neurogenesis (Fig. 6b; Supplementary Fig. S10g), indicating that NRF2 plays a central role in the regulation of angiogenesis and the neurogenesis process. To additionally support the fact that NRF2 downstream regulatory genes are modified in MCAO-treated mice after being given CBD, we used the CUT&Tag method to examine changes in NRF2 binding to gene promoters in the MCAO and CBD-treated groups of mice. It is notable that by combining predictions of the DeepD2V model, CUT&Tag and RNA-seq analysis, we determined 20 downstream targets with expression levels regulated by CBD administration and modulated by NRF2 (Fig. 6c; Supplementary Fig. S10h and S10i; Supplementary Tables S9 and S10). The chord diagram showed us that the pathways connected with these genes were enriched in several biological processes, especially those associated with neurodevelopment, angiogenesis, and rhythmic regulation (Fig. 6d). The results imply an indication that CBD has a therapeutic effect on improving recovery of blood vessels after stroke through NRF2 activation.
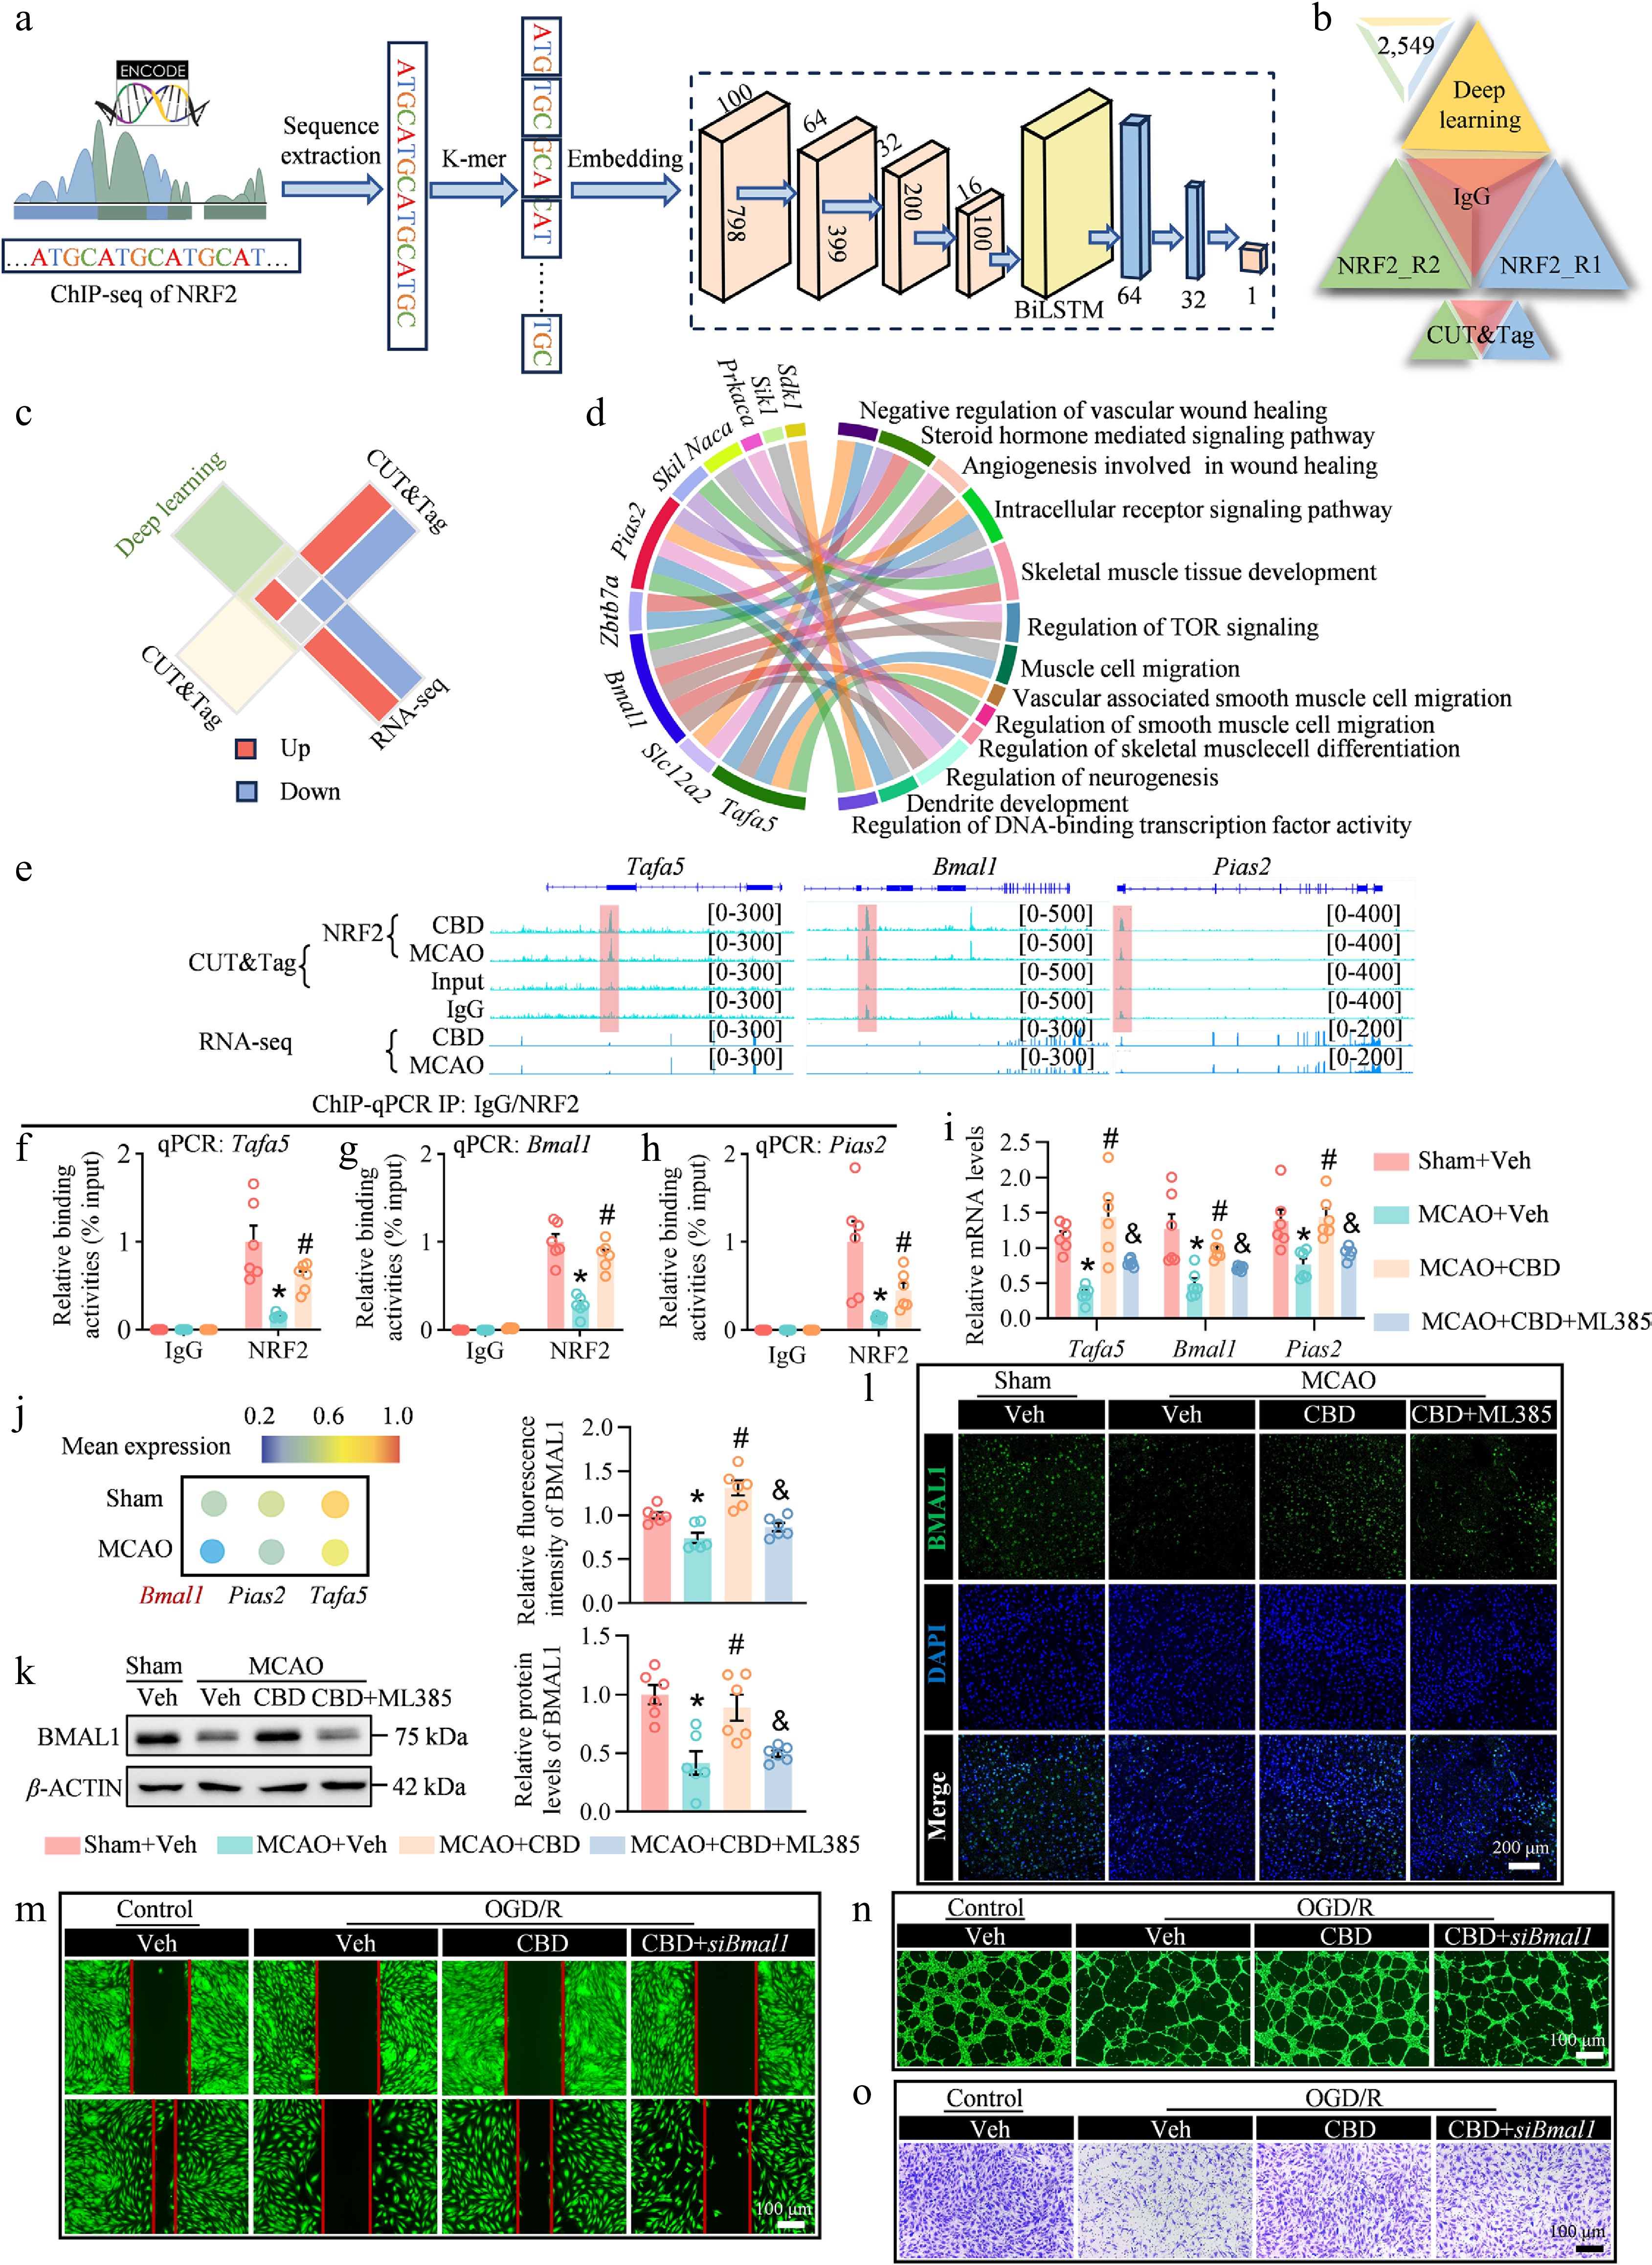
Figure 6.
AI-enhanced identification of BMAL1 as a candidate NRF2-associated effector contributing to CBD-induced angiogenesis. (a) Diagram of data collection and model architecture of the DeepD2V model. (b) Regulated genes bound to NRF2 in the mouse brain. (c) Schematic diagram of the target genes of NRF2 was screened by DeepD2V model prediction combined with CUT&Tag and RNA-seq. (d) Chord diagram of NRF2 target genes. (e) Genome browser tracks showed the binding sites and differential binding levels of NRF2 and Tafa5, Bmal1, and Pias2, and the expression levels of Tafa5, Bmal1, and Pias2 genes. (f)–(h) ChIP-qPCR analysis showed increased NRF2 enrichment at the promoter regions of Tafa5, Bmal1, and Pias2 after CBD administration (n = 6 per group). (i) Relative mRNA levels of Tafa5, Bmal1, and Pias2 (n = 6 per group). (j) The heatmap displays the expression levels of Bmal1, Tafa5, and Pias2 in the endothelial cell-enriched regions of brain slices from sham and MCAO mice. (k) Western blot assay shows the relative protein level of BMAL1 (n = 6 per group). (l) Representative fluorescence micrographs and statistical analysis of relative fluorescence intensity of BMAL1 in the perilesional cortex (scale bar = 200 μm, n = 6 per group). (m) Scratch assay showed that proliferation and migration repair ability of HUVECs after 8 h of oxygen-glucose deprivation (OGD) and 24 h of reoxygenation (scale bar = 100 μm, n = 6 per group). (n) Tube formation assay evaluated the angiogenesis capacity of HUVECs (scale bar = 100 μm, n = 6 per group). (o) Transwell migration analysis showed the migration ability of HUVECs (scale bar = 100 μm, n = 6 per group). Data are presented as mean ± SEM. * P < 0.05 compared to sham group or control group; # P < 0.05 compared to MCAO group or OGD/R group; & P < 0.05 compared to CBD-treated group.
In order to ascertain whether there is an effect of CBD treatment-induced NRF2 activation on angiogenesis in the course of I/R injury, we analyzed the expression of CD31 as a marker indicating neovascularization. The CBD-treated group had significantly higher numbers of CD31-positive blood vessels than the MCAO group, but it was significantly reduced by ML385 intervention (Supplementary Fig. S11a). Additional examination of the influence of CBD on angiogenesis was performed using the HUVEC cells subjected to OGD/R damage. The rate of wound closure in CBD-treated HUVECs was significantly increased under conditions of OGD/R injury compared with the control cells, and this effect was alleviated by inhibiting NRF2 with ML385 (Supplementary Fig. S11b). In the same way, in the tube formation assay, CBD-treated HUVECs had a greater capacity to form capillary-like structures containing multiple branching points, and this decreased with ML385 inhibition (Supplementary Fig. S11c). Finally, the transwell migration assay demonstrated that ML385 abrogated the action of CBD on cell migration and decreased the level of cellular motility (Supplementary Fig. S11d). Together, these findings offer very strong support to the idea that CBD treatment stimulates angiogenesis after I/R injury. Additionally, the suppression of angiogenesis by ML385 confirms the importance of the role of NRF2 signaling in the regulation of the vascular responses induced by CBD. These findings point out the possible therapeutic use of CBD in promoting vascular recovery post-I/R through NRF2 activation.
Moreover, in the gene list screened using the DeepD2V model, we have also found TAFA chemokine-like family member 5 (Tafa5)[58], basic helix-loop-helix ARNT-like 1 (Bmal1)[59], and protein inhibitor of activated STAT 2 (Pias2)[60] to be most highly engaged in the neurogenesis- and angiogenesis-related biological processes with various regulatory functions (Fig. 6d and e). In order to test this hypothesis, ChIP-qPCR experiments established that NRF2 binding to promoters of these genes decreased in the MCAO mice, but it was much more restored after CBD injection (Fig. 6f–h). Besides, CBD therapy successfully reversed the reduction of Tafa5, Bmal1, and Pias2 mRNA expression due to I/R injury, and the NRF2 inhibitor ML385 negated these responses (Fig. 6i). The findings strongly indicate that NRF2 activation through CBD regulates the three genes, which can induce neurodevelopment and angiogenesis and shield tissues against I/R injury, providing multi-target validation of NRF2-mediated transcriptional regulation after CBD treatment. Rather than focusing on a single downstream effector, we integrated DeepD2V prediction, CUT&Tag profiling, RNA-seq, and ChIP-qPCR to identify and validate a set of NRF2-associated targets, including Tafa5, Bmal1, and Pias2. The restoration of NRF2 promoter binding and the parallel increase in target-gene expression after CBD administration, together with their attenuation by ML385, support a coordinated NRF2-dependent regulatory program involved in vascular remodeling and neurorepair. Not only does this finding enhance our knowledge about the molecular background behind the protective actions of CBD, but it also lays the groundwork for using it as a drug that has the ability to combine antioxidant properties with angiogenesis induction capability.
In order to better explain how CBD can reduce the effects of stroke based on NRF2-dependent regulation of Bmal1, Tafa5, and Pias2, we used the information on spatial transcriptomics of slices of mouse brain after MCAO surgery[61] treated with the iSTAR system to produce super-resolution gene expression profiles (Supplementary Fig. S12a and S12b). We used marker genes identifying different cell types as annotated in the Cellmarker2 database[62] to obtain the distribution and proportion of main cell types comprising the super-resolution slices of the brain (Supplementary Fig. S12c and S12d). This result indicated that areas rich in endothelial cells showed high downregulation of Bmal1, Tafa5, and Pias2 and the most significant reduction in Bmal1 in MCAO mice (Fig. 6j; Supplementary Fig. S12e and S12f). These spatial transcriptomic findings, together with the DeepD2V, CUT&Tag, and RNA-seq results, led us to prioritize BMAL1 as a candidate NRF2-regulated effector involved in endothelial remodeling after ischemic injury. To confirm these computational results, we did biological experiments to confirm the NRF2/BMAL1 regulation axis. Following our earlier findings that CBD increased Bmal1 mRNA expression and that this response was attenuated by the NRF2 inhibitor ML385 (Fig. 6i), Western blotting and immunofluorescence analyses further showed that CBD restored BMAL1 protein expression (Fig. 6k and l). These data are consistent with NRF2-associated regulation of BMAL1 expression and support BMAL1 as a downstream transcriptional target of CBD-induced NRF2 activation.
To clarify the function of the NRF2/BMAL1 axis during angiogenesis, small interfering RNA (siRNA) was used to specifically suppress BMAL1 expression in HUVECs. The CBD-treated cells with non-disrupted BMAL1 expression demonstrated significantly increased wound healing, capillary-like structure production, and cell migration in angiogenesis assays. In contrast, BMAL1 expression silencing severely disrupted such angiogenic processes (Fig. 6m–o; Supplementary Fig. S12g–S12j). The loss of CBD-enhanced wound closure, tube formation, and endothelial migration after Bmal1 silencing indicates that BMAL1 is functionally required for the pro-angiogenic component of CBD action in endothelial cells under OGD/R conditions. These results place BMAL1 downstream of NRF2 activation and support its role as an effector linking NRF2 transcriptional regulation to endothelial repair. Notably, our combination of spatial transcriptomics and functional validation establishes a mechanistic link between CBD-induced NRF2 activation and BMAL1-dependent vascular recovery after I/R injury, thereby strengthening the functional evidence for the NRF2/BMAL1 axis in mediating the protective effects of CBD. Likewise, other research showing that CBD could regulate oxidative stress and vascular remodeling in both neurological and peripheral injury situations also supports our conclusion that the protective role of CBD in IS is partially explained by its cytoprotective and pro-angiogenic mechanisms[24,63−65]. These findings support a mechanistic model in which the NRF2/BMAL1 signaling axis is a major contributor to the therapeutic effects of CBD in IS. While CBD may act through multiple convergent pathways, our integrated transcriptomic, chromatin-binding, pharmacological inhibition, genetic loss-of-function, and BMAL1 knockdown analyses collectively indicate that NRF2-dependent transcriptional regulation and BMAL1-mediated endothelial repair represent important components of CBD-induced neurovascular protection. Our work identifies CBD as a strong anti-IS drug candidate and demonstrates repurposing as well as a new-found multi-target mechanism and treatment target of anti-IS drug development.
Administration of CBD into the nose as an alternative and quick method of treatment of ischemic stroke
-
The therapeutic use of CBD with regard to I/R injury has been well established, and time is still the most important determinant of the long-term outcome of an IS patient[66]. Considering the limited therapeutic window within which successful intervention can occur, the necessity to be able to prolong the golden rescue timeframe is the main priority. This form of administration proves to be a viable option because it can absorb drugs quickly, it is easy to give, and is friendly with patients, allowing for immediate aid before getting to the hospital. Additionally, it is appropriate as post-operative maintenance therapy since it has the benefit of rapid onset of action and enhanced adherence by the patient.
In order to compare the pharmacokinetic profiles of both intranasal and intraperitoneal administration, we measured the delivery of CBD in the mice (Fig. 7a). Our pharmacokinetic parameters showed that intranasal administration produced higher systemic exposure and had a much lower time to reach peak plasma concentration (Tmax), so it had faster absorption (Fig. 7b–d). Moreover, we explored the brain delivery efficiency of CBD even more thoroughly. The results showed no significant differences in CBD levels in the brain and plasma after the administration of the two different administration routes, which implies that the two methods were similarly effective at delivering CBD (Fig. 7e and f). It is interesting to note that a 10 min brain uptake rate was considerably higher when administered intranasally than when given intraperitoneally (Fig. 7g). Such a high speed of action puts intranasal delivery of cannabidiol in a particularly advantageous position in emergency situations, when each minute of delay increases the ischemic injury. Also, the safety and good tolerability of the method were emphasized by the absence of adverse events during the experiment.
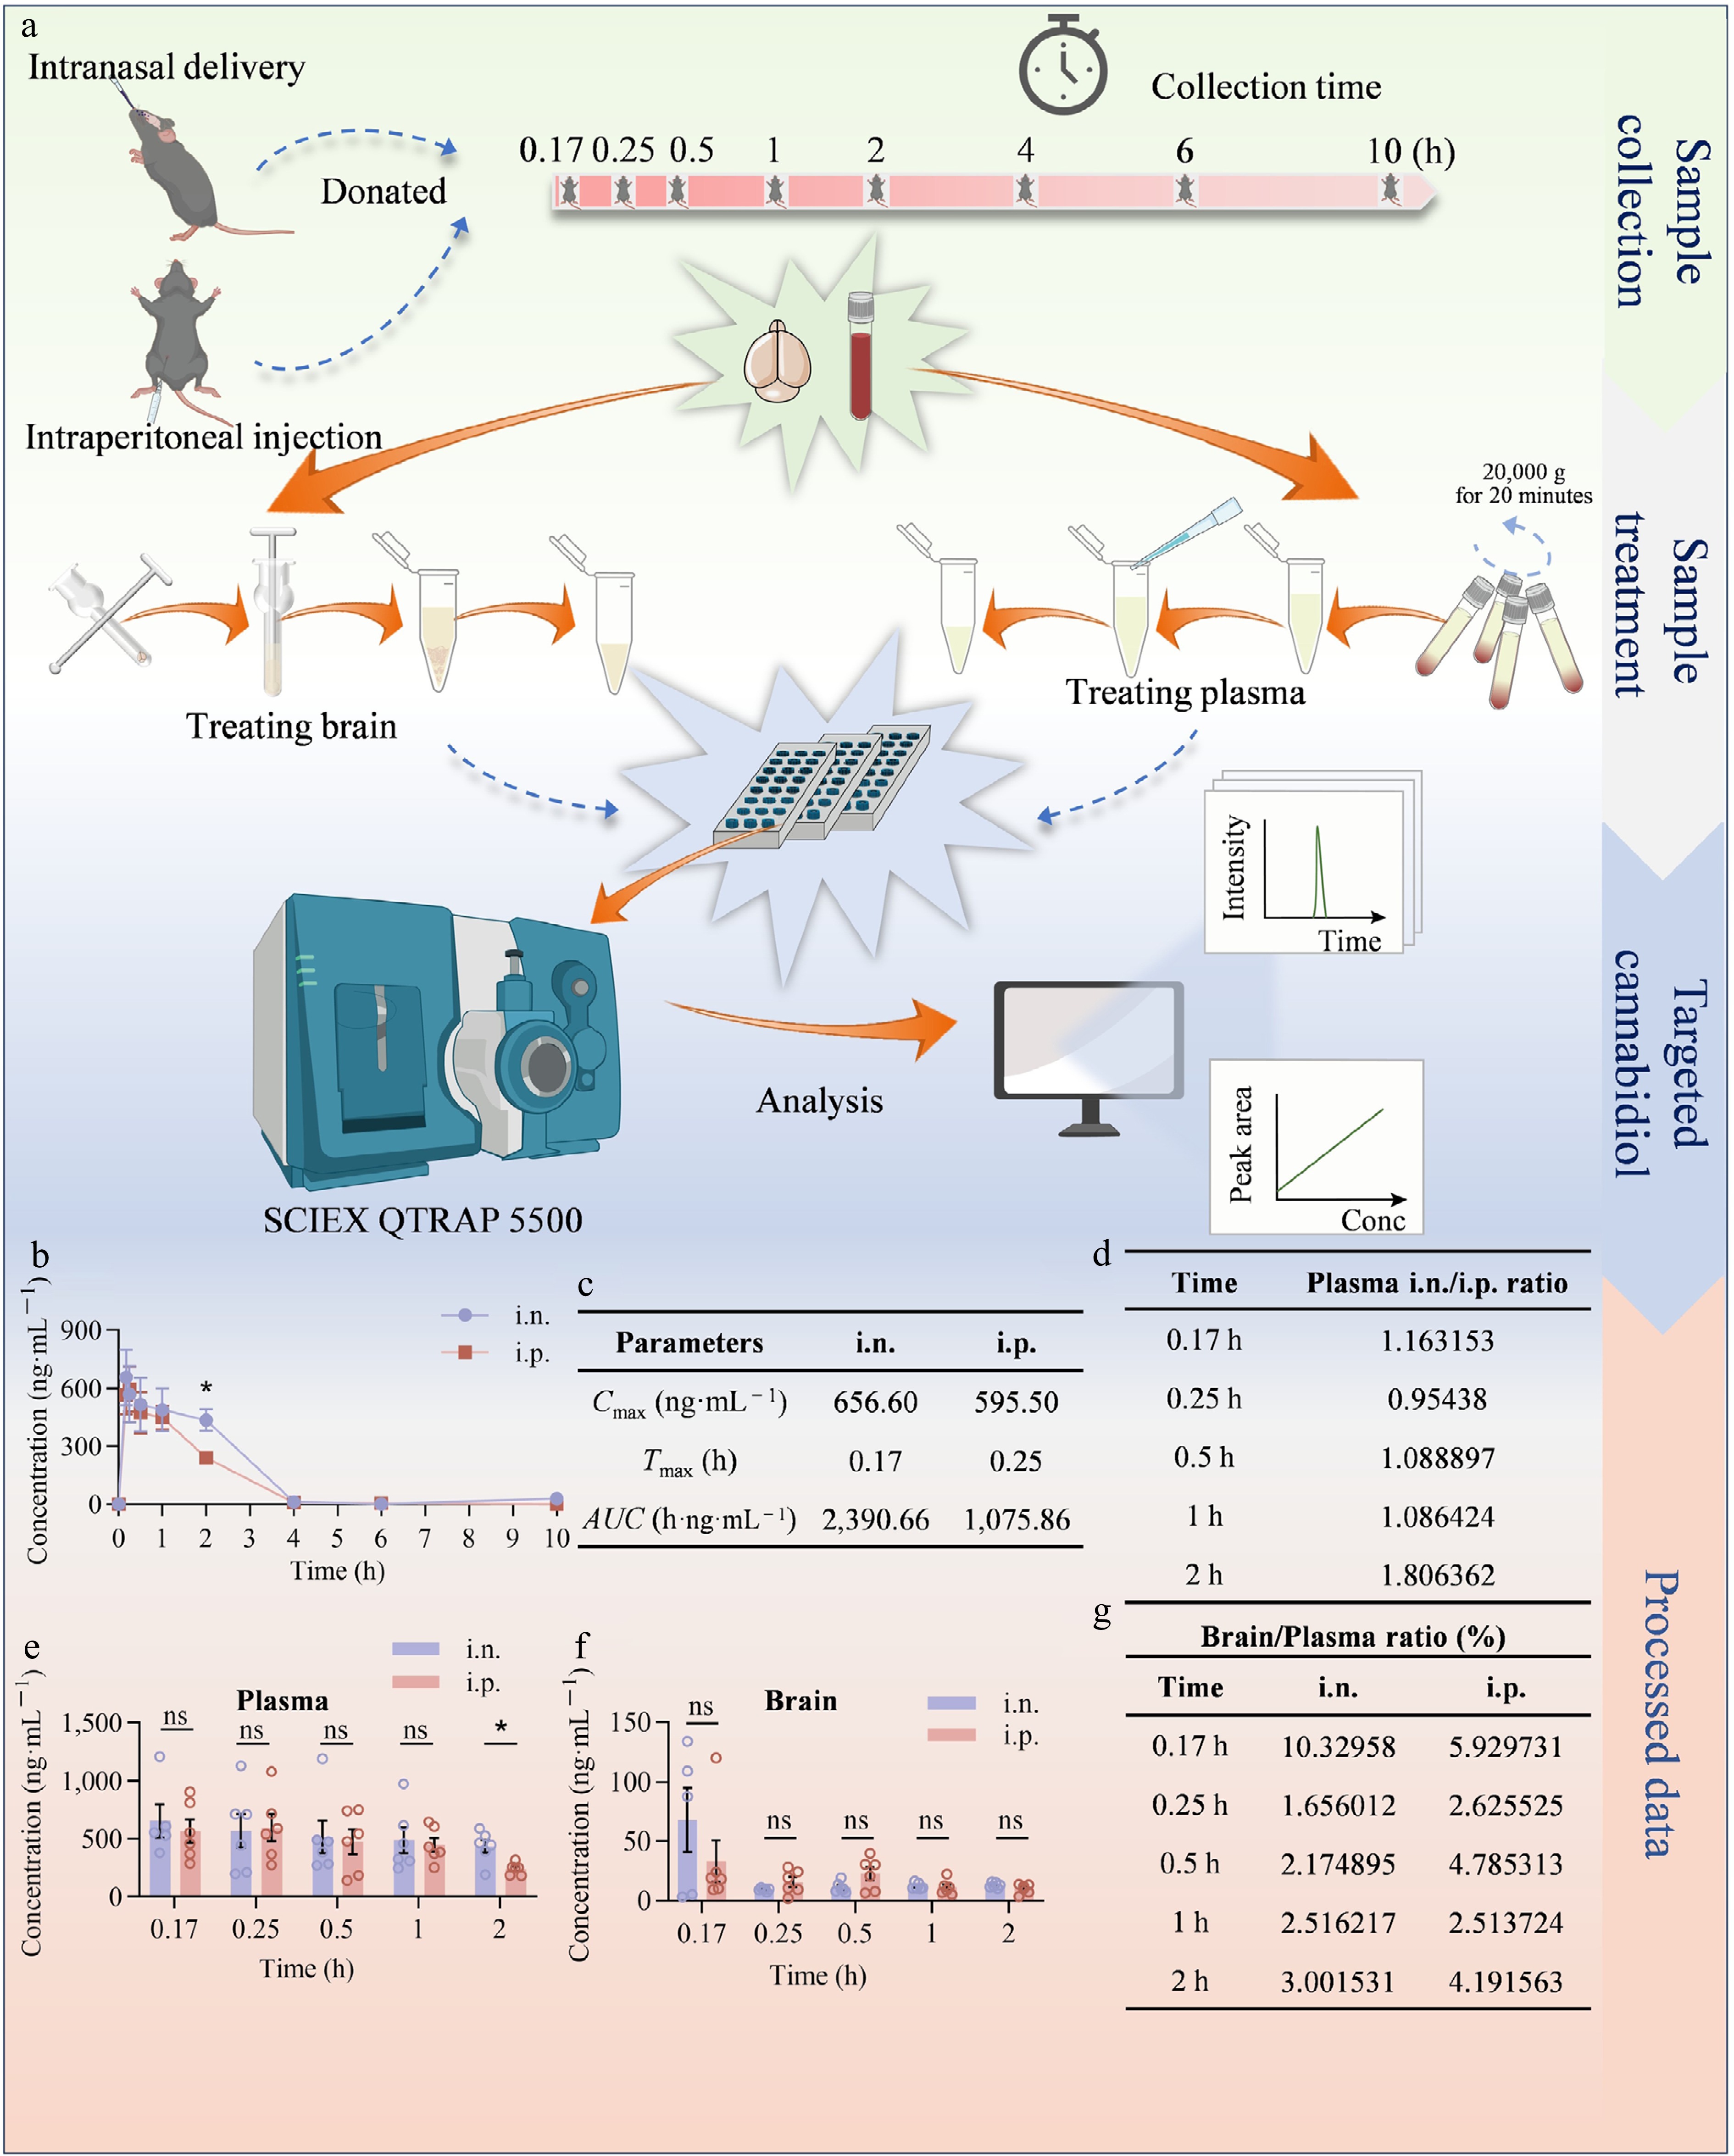
Figure 7.
There was a comparison of the intraperitoneal administration of CBD delivery efficiency with the intranasal delivery. (a) General idea of the target concentration of CBD drug metabolism over time by the intranasal route and intraperitoneal injection (n = 5−6 per group). (b), (c) The pharmacokinetics and parameters of CBD through the intranasal route and intraperitoneal injection. (d) CBD levels ratio in plasma between two different modes of administration. (e) Plasma drug concentrations, and (f) brain at 0.17, 0.25, 0.5, 1, and 2 h after administering 20 mg·kg−1 of CBD. (g) Brain uptake efficiency of the two administration routes. Data are presented as mean ± SEM. * P < 0.05 intranasal administration vs the intraperitoneal administration group.
To sum up, we have found that intranasal application of CBD can achieve similar delivery effectiveness to intraperitoneal application, plus having higher absorption rates and being more practical. Such results indicate that intranasal delivery is not merely an alternative to emergency treatment of IS but also a simple alternative to long-term therapy, with the possibility to develop clinical uses that take into account the immediate necessity of acute care and the ability of chronic care to be sustained. It is an innovative method that has the potential to change the outcomes of IS and people's quality of life.
-
The pathologic complexity of the ischemic cascade, limited treatment opportunities, and the inability to find clinical solutions to the problem have hindered the progress of effective treatments of IS over the past few decades and led to almost a stasis in the field of drug discovery. As an answer to this situation, we created and tested a family of novel AI-assisted computational algorithms that can significantly speed up the process of finding and optimizing IS therapies.
The process of identifying a genuinely feasible lead molecule in the world of small-molecule drug development has been known as the most crucial and complicated step—often the limiting factor in deciding whether a pharmaceutical innovation will succeed or fail. Conventional methods are usually slow, laborious, and ineffective. In the present work, we develop an AI-based, ultra-integrated screen that synergistically integrates the fields of medicinal chemistry, pharmacology, and systems biology. This strategy greatly improves the productivity of multi-target lead discovery and facilitates the rapid transfer between candidate molecules to the clinic. We explain, by using CBD as an example, how inter-disciplinary collaboration between AI, biology, and medicinal chemistry can facilitate drug discovery of complex diseases at high speed and rigorously validate structurally defined, safe, and clinically accessible lead scaffolds. Therefore, the novelty of the present study does not lie in claiming CBD as a de novo compound discovery. Instead, CBD serves as a proof-of-concept repurposed lead prioritized by our AI-integrated framework. The main contribution of this work is the development of a multi-layered computational and experimental pipeline that integrates pathway-level ML prediction, transcriptome-level modeling, pharmacophore-level DDN interpretation, and mechanistic validation. This framework not only prioritized CBD from a clinically relevant candidate library but also provided mechanistic and structural explanations for its anti-IS activity, including the identification of the NRF2/BMAL1 axis and CBD-associated pharmacophoric features. Importantly, CBD was not included in the model training sets, and structural similarity analysis was performed to minimize the possibility that its prioritization resulted from data leakage or simple memorization. Thus, the identification of CBD reflects the predictive capacity of the framework rather than a direct retrieval of known CBD biology. Moreover, our study extends previous knowledge of CBD by identifying and validating the NRF2/BMAL1 signaling axis as a key mechanism linking antioxidant defense and angiogenesis after ischemic injury. The DDN-guided structural analysis further identified pharmacophoric features associated with predicted neuroprotective activity, providing a rational basis for future medicinal chemistry optimization. In addition to CBD, the framework prioritized doramectin and a broader set of candidate compounds, supporting its potential utility for discovering additional neurotherapeutic leads beyond CBD.
It is important to note that pharmacophore-based SAR studies using the DDN model have allowed us to identify vital neuroprotective substructures of CBD, most notably (+)-dipentene, and provide a hypothesis-generating basis for future CBD optimization. The (+)-dipentene-containing terpene region may represent a favorable structural motif and should be retained or cautiously modified to preserve its hydrophobic topology and stereochemical features, thereby offering specific medicinal chemistry targets for structural optimization in the future. Future optimization could focus on improving metabolic stability and CNS exposure by modifying the terpene alkene/allylic positions, tuning the phenolic hydroxyl groups, and optimizing the alkyl side chain. Conversely, low-scoring fragments identified by DDN, such as substituted tetrahydropyran-like moieties represented in doramectin, should be avoided or minimized in future anti-IS compound design. The DDN platform offers two benefits to IS drug discovery: it will make it possible to identify leads with AI and allow gaining QSAR clarification, which enables mechanism-informed chemical optimization. This combination of abilities has contributed greatly to rational drug design and can be used to develop more efficient treatments for more complicated neurological diseases like IS.
We build our results on and extend earlier IS literature. The activators of NRF2 have been described to enhance neuron survival, decrease the size of the infarct, and induce vascular remodeling in animal models[49−51], whereas the regulatory function of oxidative stress and vascular repair has been demonstrated in both neurological and peripheral injury scenarios[24,63,64]. Our study is unique because it provides the first indication that this action is mediated by CBD via the NRF2/BMAL1 signaling pathway and thus confirms the value of this dual-target process and underscores the multi-faceted anti-inflammatory, antioxidant, and pro-angiogenic qualities of CBD. In contrast to conventional neuroprotectors, which focus mainly on neuronal mechanisms, CBD also serves to defend endothelial cells, providing a broader range of treatment options and being associated with the concept of the neurovascular unit as well as contributing to enhancing the global functional results. From a mechanistic perspective, the present study combines several complementary layers of validation. NRF2 was supported by transcriptomic prediction, scRNA-seq analysis, pharmacological inhibition with ML385, and genetic loss-of-function in Nrf2 knockout mice. Downstream NRF2-regulated targets were further examined by DeepD2V prediction, CUT&Tag, RNA-seq integration, and ChIP-qPCR, leading to the identification of Tafa5, Bmal1, and Pias2 as candidate NRF2-associated genes involved in neurovascular repair. Among these targets, BMAL1 was prioritized by spatial transcriptomics and was functionally tested by siRNA-mediated knockdown in endothelial angiogenesis assays. Therefore, although CBD likely exerts multi-target effects in the complex ischemic microenvironment, our data support a hierarchical mechanism in which NRF2 activation regulates multiple downstream transcriptional targets, with BMAL1 serving as a functionally important mediator of CBD-induced endothelial repair and angiogenesis.
CBD displays a large variety of pharmacological activities and complex neural action mechanisms. When discussing IS, there are two important molecules that CBD targets: NRF2 and BMAL1. NRF2 stimulation results in the transcription of antioxidant genes, reduces oxidative stress-induced damage, and has synergistic anti-apoptotic and anti-neuroinflammatory actions, making NRF2 an essential therapeutic agent. It is worth noting that our data suggest that BMAL1 is a functionally important downstream effector associated with NRF2 activation in the context of CBD-mediated endothelial repair. A core component of the circadian clock, BMAL1 is involved in neurological impairment[67,68] and has been previously discussed as playing a part in oxidative stress, inflammation, and angiogenesis in ischemic and peripheral vascular diseases[69,70]. Our data indicate that BMAL1 contributes to CBD-induced pro-angiogenic and wound-healing responses under OGD/R conditions. Additionally, mood regulation can be linked to BMAL1 as well[71]; our own research shows that anxiety and risk of stroke are related, which means that CBD may improve both neuroprotection and patient well-being through the BMAL1 pathway.
The existing IS treatment methods such as vascular recanalization and neuroprotection have limitations in terms of low therapeutic windows, limited patient eligibility, and poor clinical extrapolation[9,72]. IS is driven by a cascade of interrelated pathophysiological processes—excitotoxicity, oxidative stress, apoptosis, inflammation, and blood-brain barrier disruption—necessitating multi-target interventions[73,74]. Our solution with AI will overcome these clinical issues by finding agents capable of controlling several pathological pathways at once, which would facilitate effective medical solutions.
We further strengthen the translational value of our study by using an AI-powered framework that uses four deep learning and ML models that were trained with large-scale and high-quality datasets to be able to predict features related to diseased tissues, gene expression changes, drug targets, and molecular networks accurately. The simplified and data-driven approach makes what once used to be a difficult method much more efficient and mechanistic in nature, making it easy to apply to other complex diseases outside IS, especially when there are no effective pharmacological treatments available for them.
Timely intervention is particularly important in managing IS due to the significant decrease in neuronal damage and increased probability of successful patient recovery achieved with quick intervention. Although conventional therapy modalities of IS treatment are mostly based on intravenous therapy, which has been shown to be invasive in addition to having small therapeutic windows, our research points to intranasal CBD administration as a novel approach. Intranasal administration permits CBD to get past the blood-brain barrier as it passes the nasal mucosa and enters the central nervous system through the olfactory and trigeminal routes[75,76]. The technique not only reaches brain levels similar to those of intraperitoneal injection but also offers a safe and easy-to-administer route that can be used effectively in acute IS cases. Through enabling more rapid brain uptake, intranasal administration prolongs the time when effective intervention can be made, thus improving the odds of a positive outcome. Moreover, the method reduces the burden on patients and increases their satisfaction because it is easier to use and more comfortable than the conventional intravenous methods. Accordingly, our study not only explains the molecular processes by which CBD exerts its therapeutic properties in IS but also proves the practicality and benefits of intranasal administration, hence offering a holistic and scalable paradigm to drug discovery endeavors in intricate neurological disorders in the future.
In spite of such developments, there are some shortcomings to our research efforts. Although we validated the anti-stroke efficacy of CBD identified through the AI screening pipeline using a series of biological experiments, independent biological orthogonal validation of each individual module within the AI workflow remains limited. Large-scale external validation and strict cross-cell-line validation were not performed, mainly due to the limited availability of independent external datasets and the uneven distribution of compound-cell line perturbation profiles across cell lines. Although the held-out test set strategy helped reduce the risk of data leakage, future studies using larger, independent, and more balanced multi-cell-line datasets are needed to further evaluate the robustness and generalizability of the model across different cellular contexts. Preclinical models can fail to capture the complexity of human IS and may compromise translational relevance. Nevertheless, further mechanistic studies will be valuable to fully define the causal hierarchy of this pathway. In particular, gain-of-function rescue experiments for NRF2 or BMAL1, orthogonal perturbation of additional NRF2 downstream targets such as TAFA5 and PIAS2, pathway-specific rescue assays, luciferase reporter assays, and BMAL1 overexpression rescue in NRF2-deficient mice would further refine the mechanistic relationship between NRF2 activation, BMAL1-dependent endothelial repair, and CBD-mediated neuroprotection. We also acknowledge that the present study did not experimentally test CBD analogs or derivatives, and therefore cannot conclusively establish the (+)-dipentene-like motif as an essential pharmacophore responsible for the observed neuroprotective effects. Future work will require the synthesis or selection of a focused CBD analog library, including derivatives with retained, modified, or removed (+)-dipentene-like structural motifs, followed by systematic validation in both OGD/R and MCAO models. Integration of DDN fragment scoring, LGE-GNN-based transcriptomic prediction, BBB/ADMET filtering, and experimental validation may provide a rational and iterative pipeline for developing optimized CBD-derived neurotherapeutic leads. An additional limitation concerns the initial in vivo CBD dose selection. The doses of 4, 20, and 40 mg·kg−1 were chosen to bracket literature-supported effective ranges and to identify a working dose for downstream mechanistic validation, rather than to establish a complete pharmacodynamic dose-response curve. Future studies with more densely and evenly spaced doses, combined with pharmacokinetic/pharmacodynamic analyses, will be needed to define the minimal effective dose and full dose-response profile of CBD in IS. A further limitation of this study is that only male mice were used for the in vivo MCAO experiments, which may limit the generalizability of our findings. Sex-related biological factors may influence ischemic stroke progression and therapeutic responses. Therefore, future studies including adequately powered cohorts of both male and female animals, sex-stratified outcome analyses, and, where appropriate, consideration of estrous-cycle status or age-related hormonal changes will be needed to determine whether the neuroprotective effects of CBD are conserved across sexes and to improve clinical translatability.
To summarize, we have created a group of novel AI-supported computational structures that significantly speed up the process of finding and optimizing therapeutics to treat IS. Through the application of deep learning algorithms combined with biological and pharmacological knowledge, we were able both to explain the extensive protective mechanisms of CBD in countering IS in various ways and to offer a new prospective drug delivery pathway for the treatment of IS through the process of intranasal CBD administration. More neuroprotective motifs were also revealed through more in-depth studies on structure–activity analysis supported by pharmacophores that serve as a strong basis for rational chemical optimization. It is a good example of how AI approaches can be used to revolutionize the discovery of leads when combined with medicinal chemistry, provide greater mechanistic understanding, and facilitate precision-based drug design. The most critical factor to note here is that the developed paradigm is a versatile and scalable model that can be applied towards therapeutic discovery on IS and other multifactorial disorders like neurodegeneration, cancer, and metabolic syndromes, and will represent the next-generation drug development roadmap (Fig. 8; Supplementary Fig. S13).
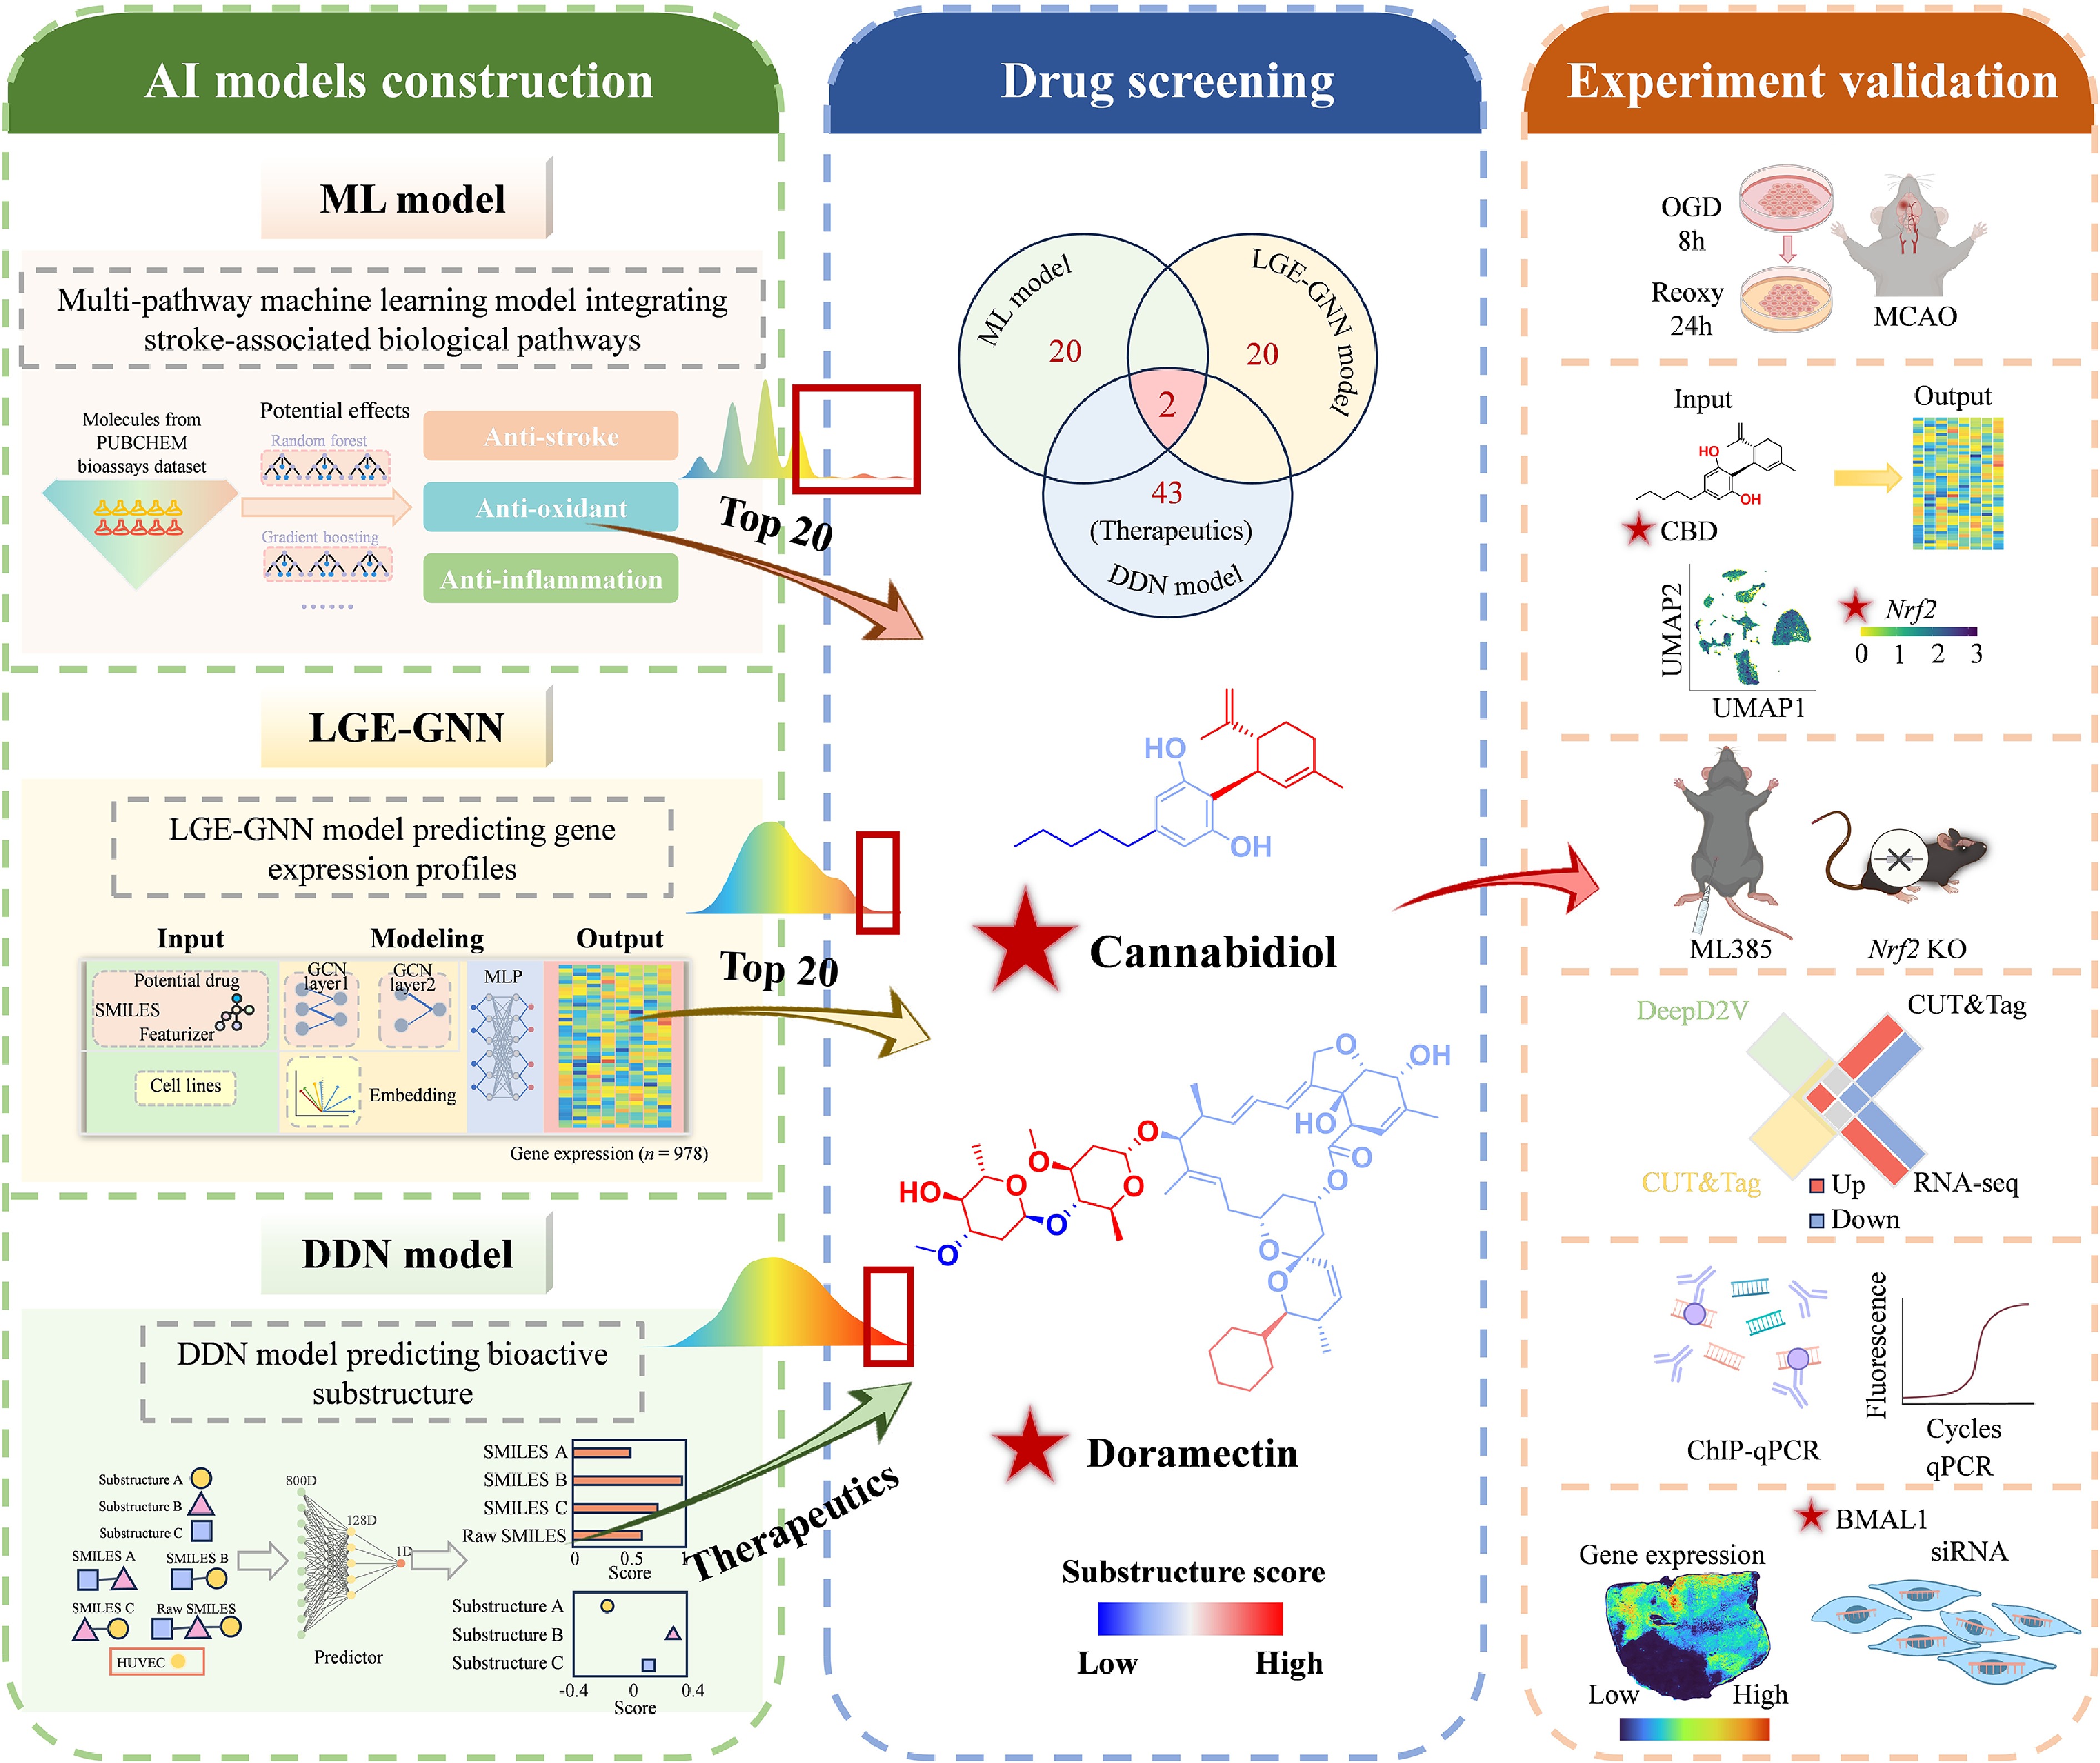
Figure 8.
An AI-driven framework accelerates drug discovery and elucidates therapeutic mechanisms, offering a scalable approach for treating ischemic stroke and other complex diseases.
This study was supported by the Fundamental Research Funds for the Central Universities (No. 2632025ZD10, China); the Targeted Commissioned Project – In Vivo Fate and Intelligent Delivery of Multi-target Natural Drugs (No. SKLNMZZ202403, China); the Young Elite Scientists Sponsorship Program by CAST (No. 2024-2026QNRC001, China); the Sanming Project of Medicine in Shenzhen (No. SZSM202301035, China); the Haihe Laboratory of Cell Ecosystem Innovation Fund (No. 22HHXBSS00005, China); and the General Program of the National Natural Science Foundation of China (No. 82371365, China).
-
All experiments involving animals were conducted according to the ethical policies and procedures approved by the Ethics Committee of China Pharmaceutical University (2024-09-126). The research followed the 'Replacement, Reduction, and Refinement' principles to minimize harm to animals. This article provides details on the housing conditions, care, and pain management for the animals, ensuring that the impact on the animals is minimized during the experiment.
-
The authors confirm their contribution to the study as follows: equal contributors: Li J, Zhou Z, Zhao Y, Liu S; conception and design of the study: Li X, Zhu Z, Wang G; experimentation and analysis: Li J, Zhou Z, Zhao Y, Liu S, Chen L, Shi Y, Li H, Sun Y, Yao T, Jiang W, Xue Q, Zhu Z, Li X; AI model construction and data visualization: Zhou Z, Liu S; validation: Yao T, Shi Y; draft manuscript preparation and revision: Li X, Li J, Zhu Z. All authors reviewed the results and approved the final version of the manuscript.
-
All analysis scripts have been uploaded to https://github.com/liusai118/CBD for public access and reproducibility. All sequencing data has been uploaded to https://db.cngb.org/data_resources/project/CNP0009604/ for public access and verification.
-
The authors declare that there are no conflicts of interest.
-
accompanies this paper online at: https://doi.org/10.48130/targetome-0026-0034.
-
#Authors contributed equally: Jinran Li, Zheng Zhou, Yongjun Zhao, Sai Liu
- Supplementary Table S1 Primer sequences for genotyping of the Nfe2l2-Eko2 mice.
- Supplementary Table S2 The result of Mendelian randomization analysis.
- Supplementary Table S3 Primer sequences for the targeted genes in Real-Time PCR.
- Supplementary Table S4 The drug-pathway data of the 255 drugs predicted by the first model.
- Supplementary Table S5 The drug-transcriptome data of the 255 drugs predicted by the LGE-GNN model.
- Supplementary Table S6 Therapeutic potential scoring of molecular fragments for stroke.
- Supplementary Table S7 Therapeutic potential prediction of Compounds via Fragment-Based Assembly.
- Supplementary Table S8 Predicted differential genes after CBD administration.
- Supplementary Table S9 Differential genes after CBD administration detected by RNA-seq.
- Supplementary Table S10 The result of differential peaks in MCAO mice following CBD administration detected by the CUT&Tag analysis.
- Supplementary Fig. S1 Histogram of Tanimoto similarities to CBD for compounds across all training sets (ML, LGE-GNN, and DDN).
- Supplementary Fig. S2 Flowchart for instrument selection in two-sample MR.
- Supplementary Fig. S3 Mendelian Randomization reveals causal link between anxiety and ischemic stroke risk.
- Supplementary Fig. S4 Single-cell sequencing analysis highlighted the pivotal role of endothelial cells in IS.
- Supplementary Fig. S5 Performance of DDN surpasses multiple QSAR models.
- Supplementary Fig. S6 CBD alleviated the damage caused by OGD/R in vitro.
- Supplementary Fig. S7 LGE-GNN-Guided Identification of the NRF2 Pathway as a Key Mediator of CBD's Neuroprotective Effects.
- Supplementary Fig. S8 Single-cell transcriptomics revealed NRF2 as a potential therapeutic target for stroke.
- Supplementary Fig. S9 CBD played a protective role in I/R injury by resisting oxidative stress through the NRF2 pathway.
- Supplementary Fig. S10 Deep learning combined with CUT&Tag and RNA-seq was used to screen the downstream target genes of NRF2 activated by CBD.
- Supplementary Fig. S11 CBD exerts angiogenic effects through NRF2.
- Supplementary Fig. S12 Spatial transcriptomics highlights BMAL1 as a central NRF2-regulated target driving CBD induced angiogenesis.
- Supplementary Fig. S13 Proposed mechanism of CBD-mediated neuroprotection in IS.
- Copyright: © 2026 by the author(s). Published by Maximum Academic Press on behalf of China Pharmaceutical University. This article is an open access article distributed under Creative Commons Attribution License (CC BY 4.0), visit https://creativecommons.org/licenses/by/4.0/.
-
About this article
Cite this article
Li J, Zhou Z, Zhao Y, Liu S, Chen L, et al. 2026. An AI-integrated pharmacophore and transcriptomic framework for rapid discovery of therapeutic leads for ischemic stroke. Targetome 2(4): e035 doi: 10.48130/targetome-0026-0034 

An AI-integrated pharmacophore and transcriptomic framework for rapid discovery of therapeutic leads for ischemic stroke
- Received: 15 April 2026
- Revised: 04 June 2026
- Accepted: 02 July 2026
- Published online: 12 August 2026
Abstract: Ischemic stroke (IS) is one of the main reasons causing death and disability worldwide, but there are no effective pharmacological treatments available. There is an urgent need to rapidly discover translatable therapeutic candidates. Artificial intelligence (AI) can be applied to accelerate therapeutic lead identification and mechanistic characterization. In this paper, we present a multi-layered AI-based discovery approach that combines a multi-pathway machine learning (ML) model, a Latent Gene Expression Graph Neural Network (LGE-GNN) model, and the Drug Decompose Net (DDN) model to perform structural pharmacophore-level analysis. Using this framework, we identified cannabidiol (CBD) as a proof-of-concept repurposed lead and further validated its therapeutic relevance in IS. Mechanism studies involving LGE-GNN prediction, DeepD2V modeling, and CUT&Tag sequencing indicated that the compound restores antioxidant status and induces angiogenesis through the NRF2/BMAL1 signaling axis. Moreover, DDN-directed structure–activity relationship (SAR) analysis prioritized several putative favorable substructures, including the (+)-dipentene-containing region of CBD, thereby providing a hypothesis-generating framework for future rational chemical optimization. It is presented in the form of an innovative screening system that can be highly integrated with artificial intelligence, medicinal chemistry, and state-of-the-art biological techniques. As indicated by the proposed framework, it can be an efficient strategy for rapid drug repurposing in ischemic stroke. By enabling the efficient identification of repurposable therapeutic leads, the framework can substantially reduce the time, cost, and labor required for early-stage drug development and may be further extended to support future drug discovery efforts.