-
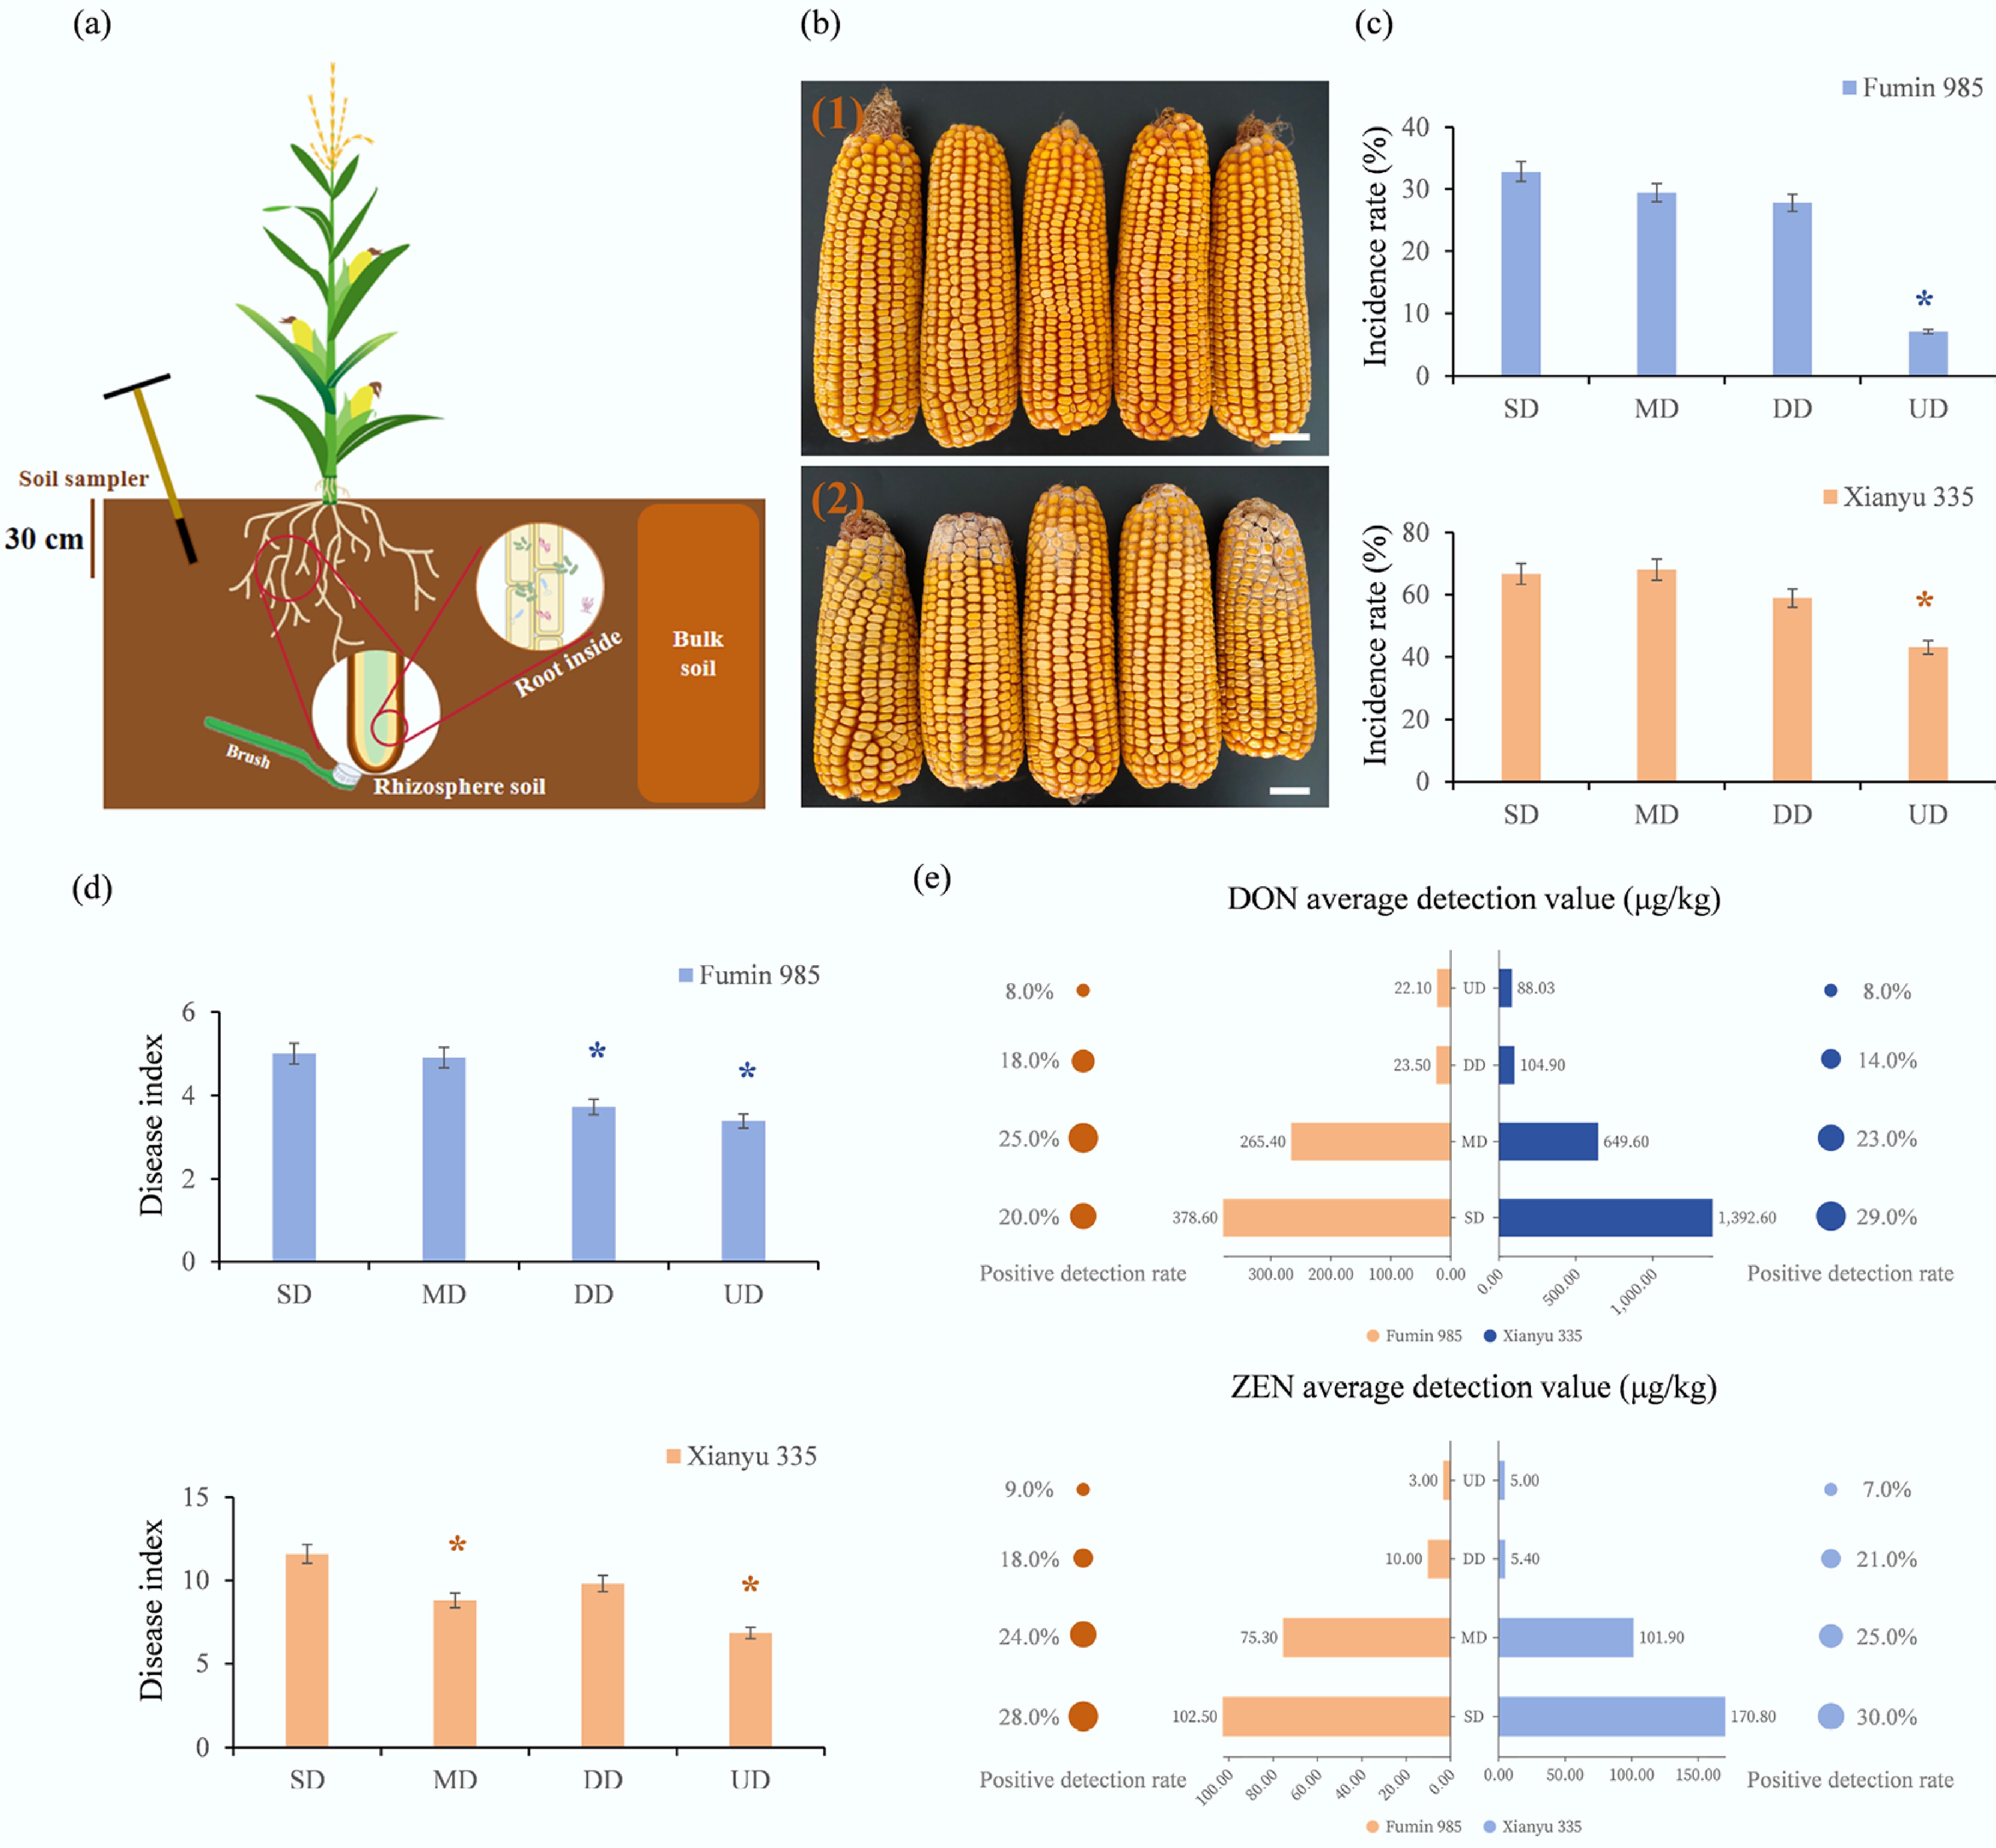
Figure 1.
Analysis of maize disease and mycotoxin contamination. (a) Sampling methods for different parts. (b) Healthy maize ears and those infected with rot disease. (c) Disease incidence rate of maize ear rot in plots under different treatments. (d) Disease index of maize ear rot in plots under different treatments. (e) Mycotoxin concentrations in maize kernels. DON: deoxynivalenol, ZEN: zearalenone. The circular areas on both sides of the bar chart are used to represent the positive detection rate of mycotoxins in maize samples (n = 100). Data are expressed as means ± SD (from at least three independent replicates) and were compared with the SD treatment by Student's t-test (* p < 0.05).
-
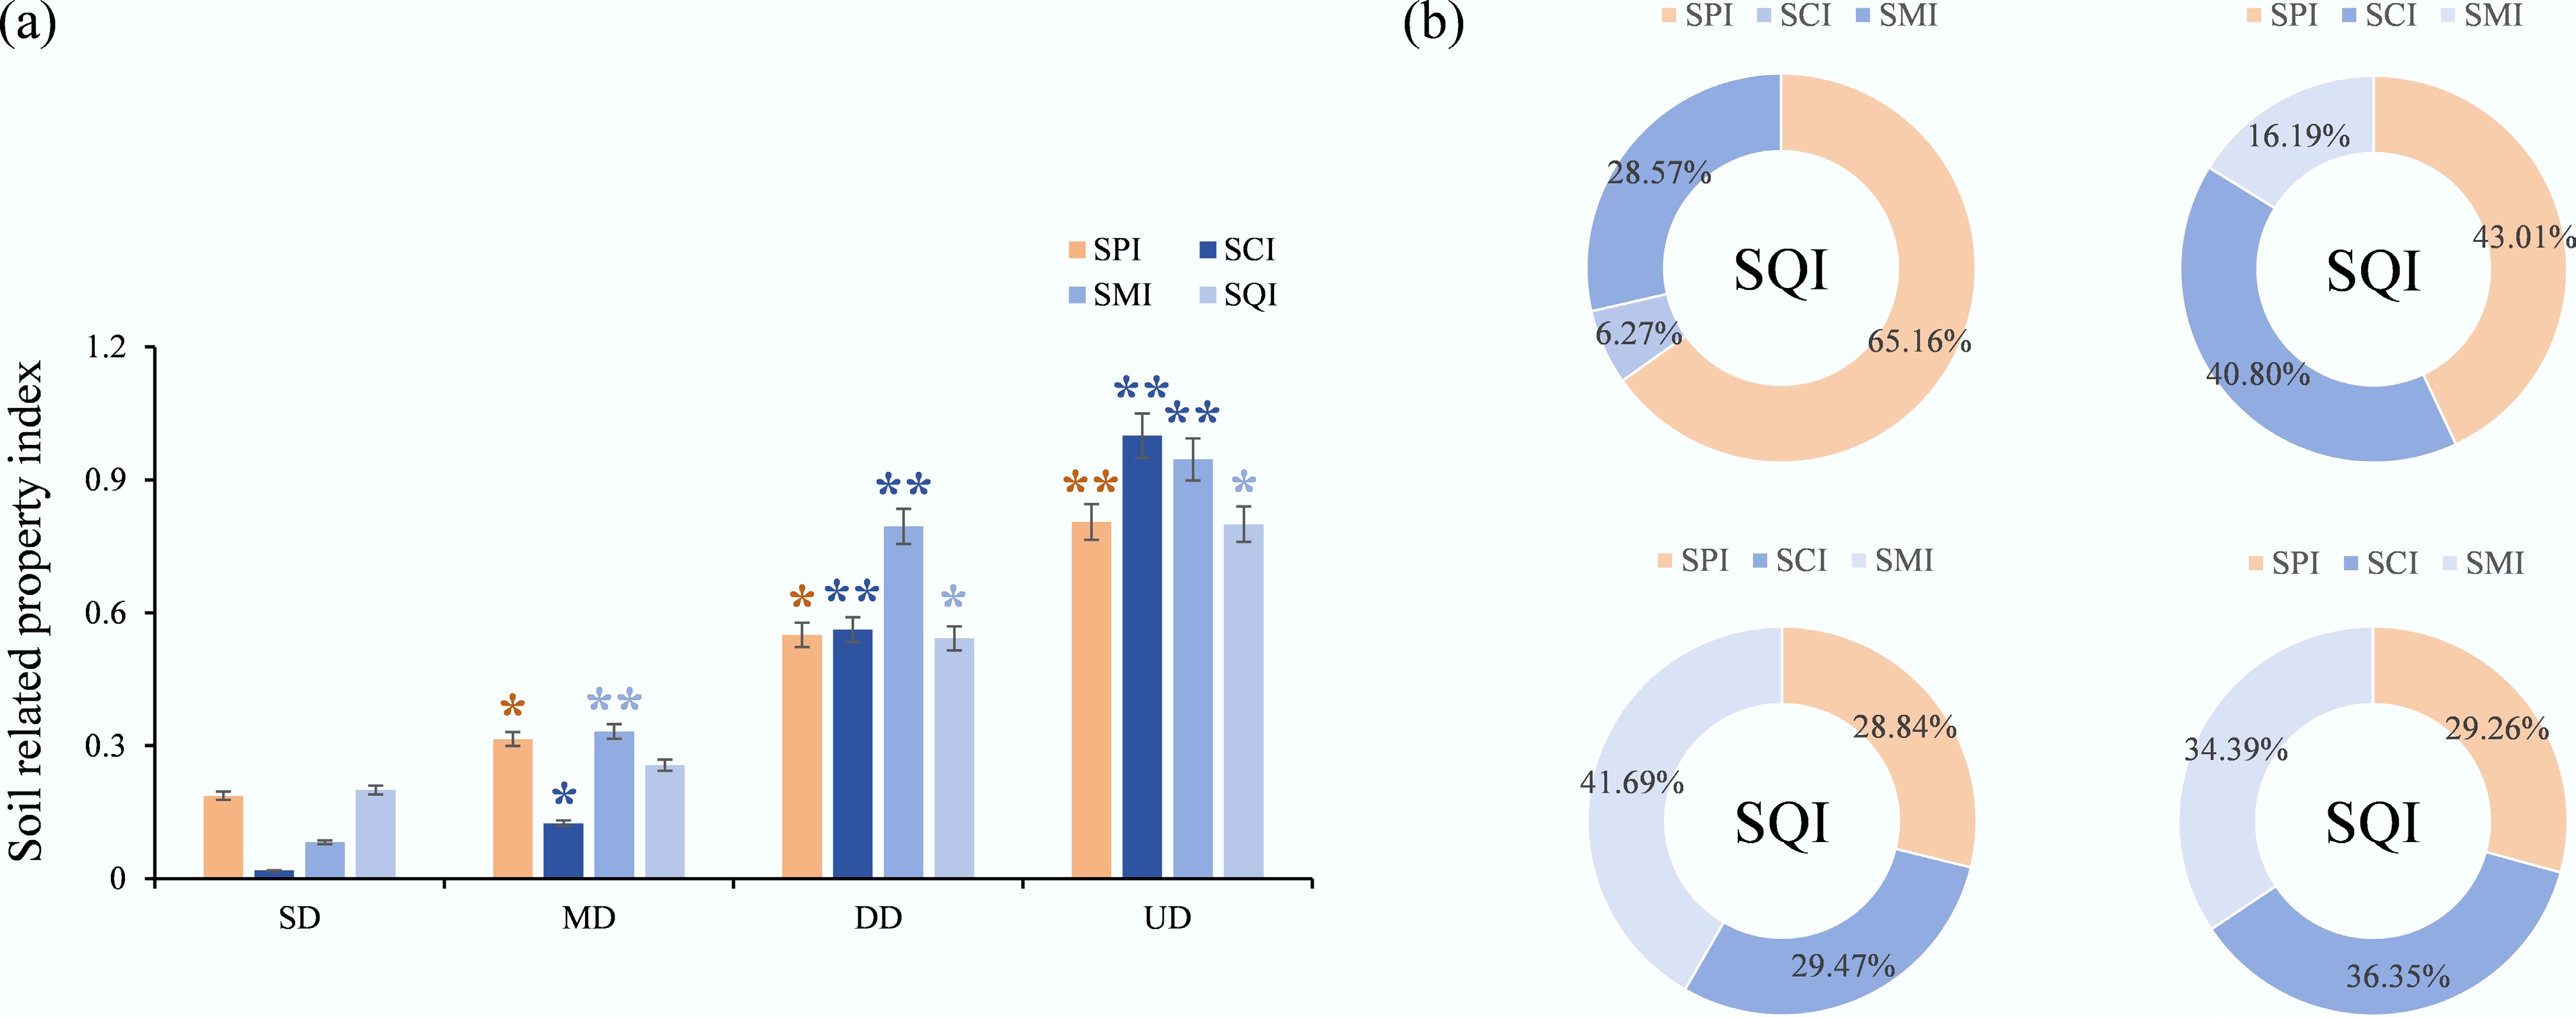
Figure 2.
Soil quality assessment. (a) Effects of straw incorporation depth on soil quality and the indices of soil physical properties, soil chemical properties, and soil microbial properties under different treatments. (b) Contributions of SPI, SCI, and SMI to SQI under different treatments. SPI, soil physical property index; SCI, soil chemical property index; SMI, soil microbial property index. Asterisks indicate significant differences (* p < 0.05, ** p < 0.01).
-
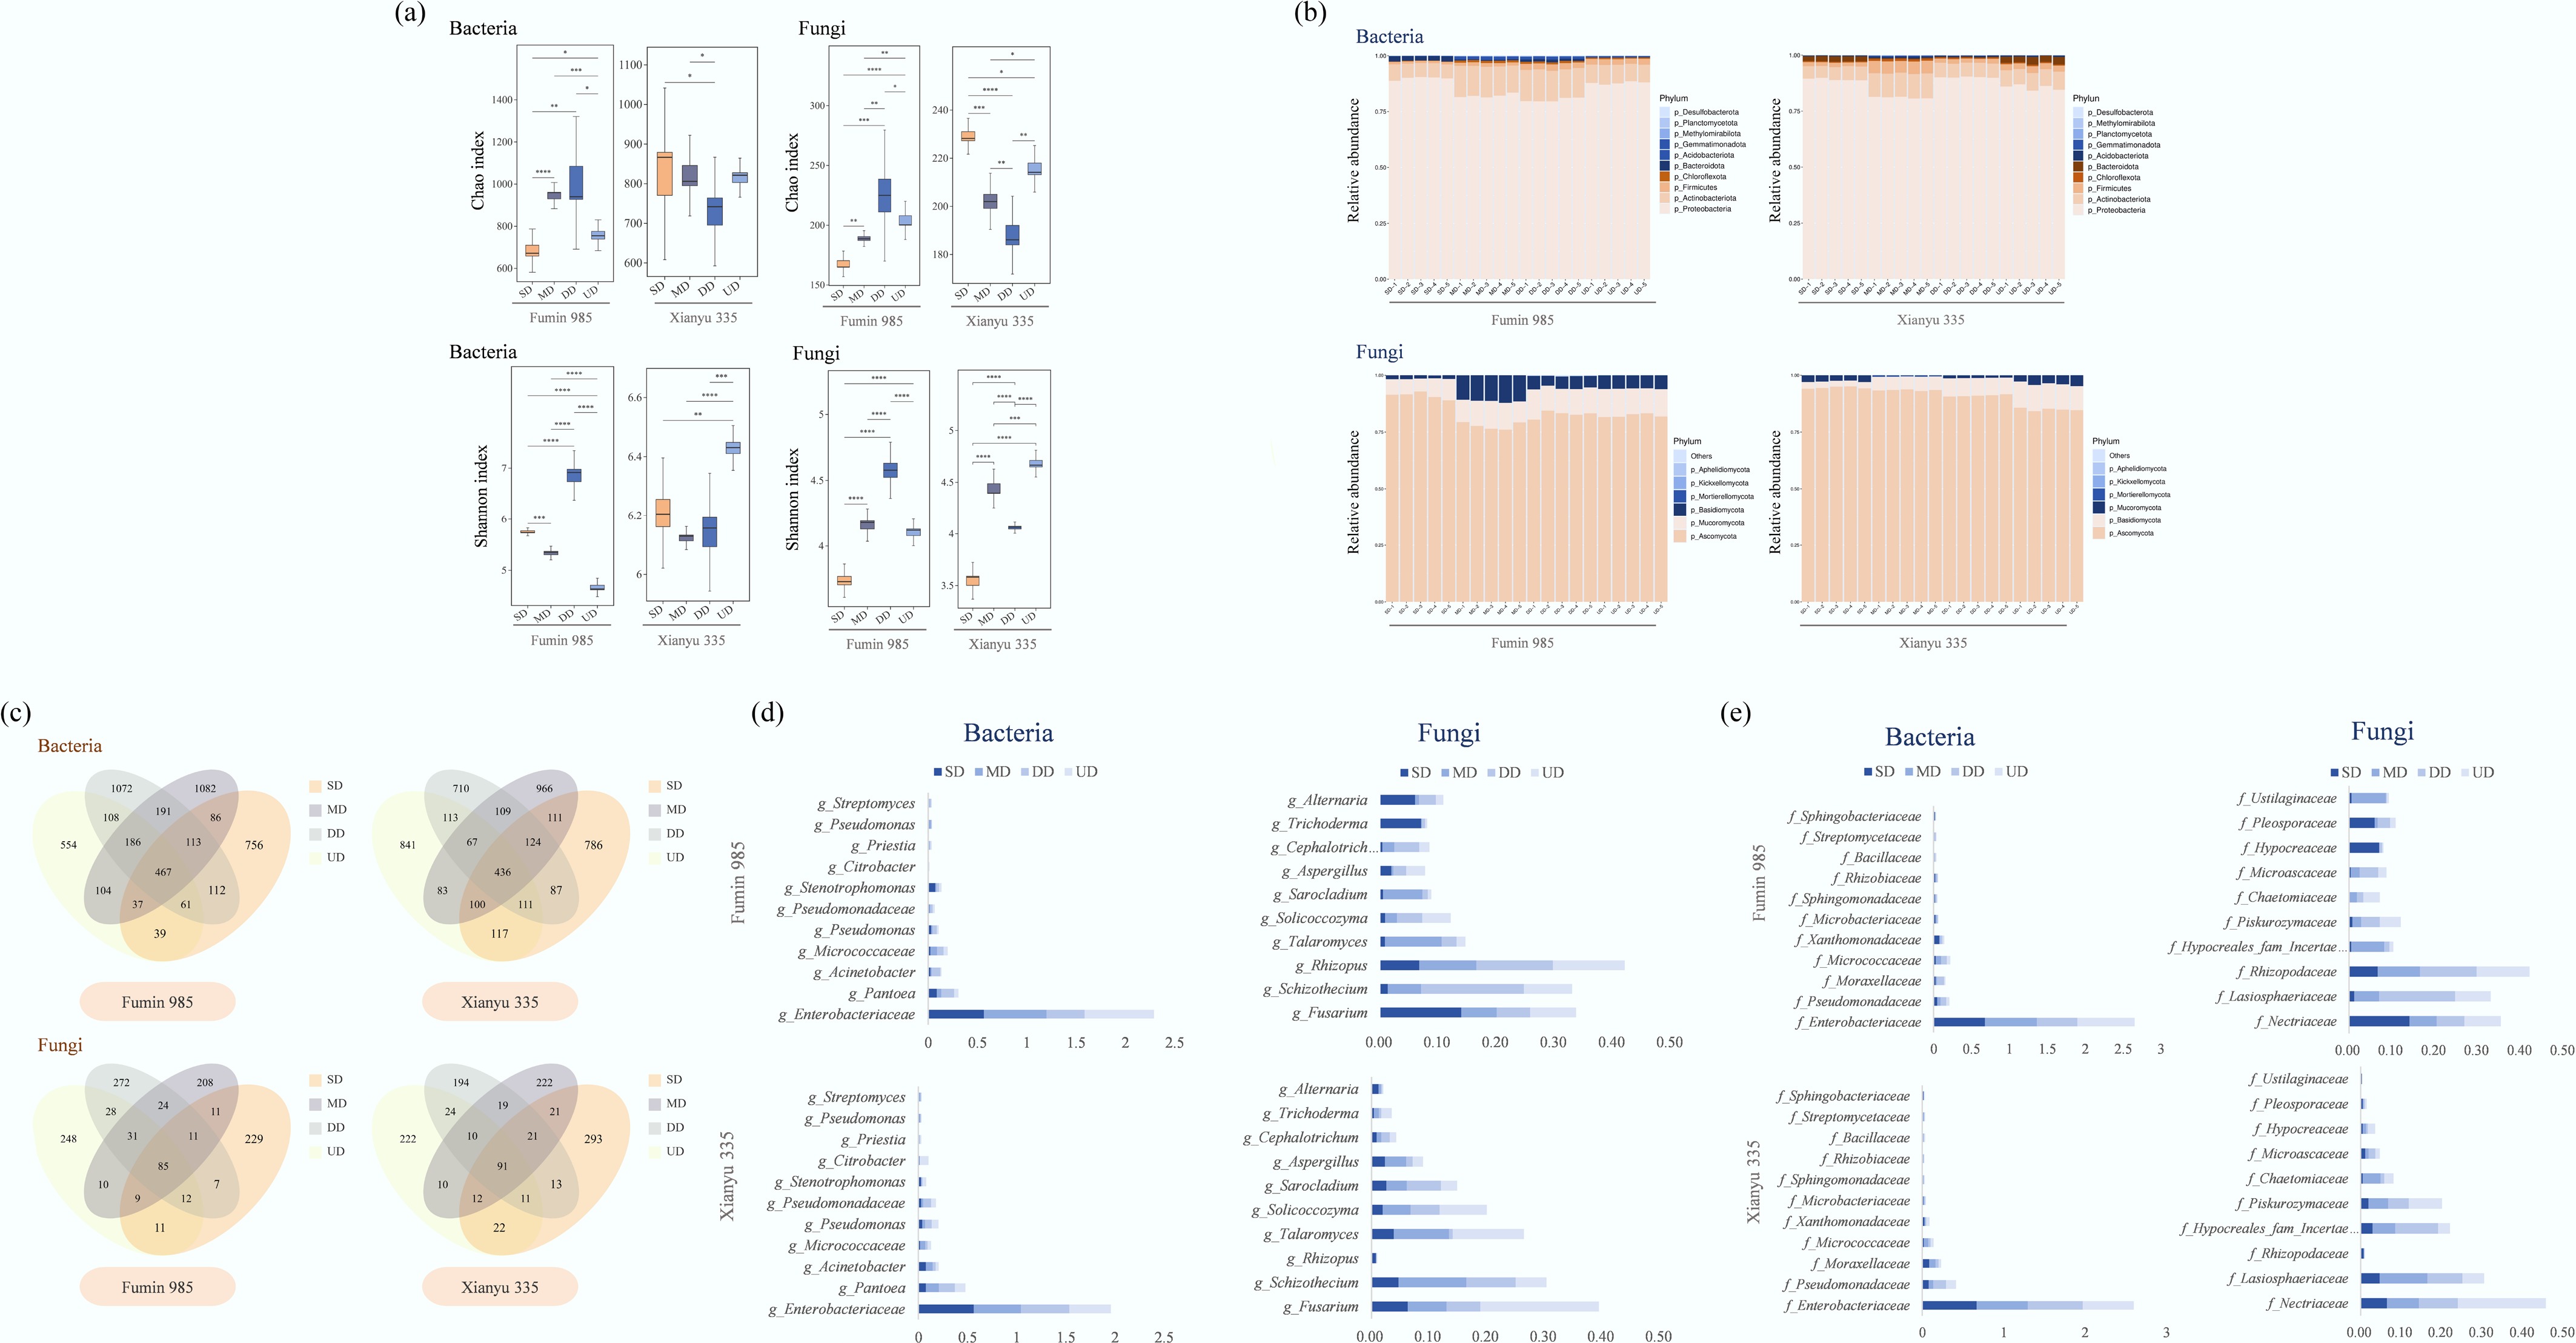
Figure 3.
Effects of straw incorporation depth on bacterial and fungal communities in the maize rhizosphere soil. (a) The Shannon and Chao1 indices of bacterial and fungal communities in all rhizosphere soil samples. Asterisks indicate significant differences (* p < 0.05, ** p < 0.01, *** p < 0.001, ****p < 0.0001). (b) Relative abundances of dominant phyla under different treatments in different maize cultivars. (c) Shared operational taxonomic units (OTUs) in different treatments for the Fumin 985 and Xianyu 335 cultivars. (d) Relative abundances of SD, MD, DD, and UD treatment OTUs in bacteria and fungi at the genus level. (e) Relative abundances of SD, MD, DD, and UD treatment OTUs in bacteria and fungi at the family level.
-
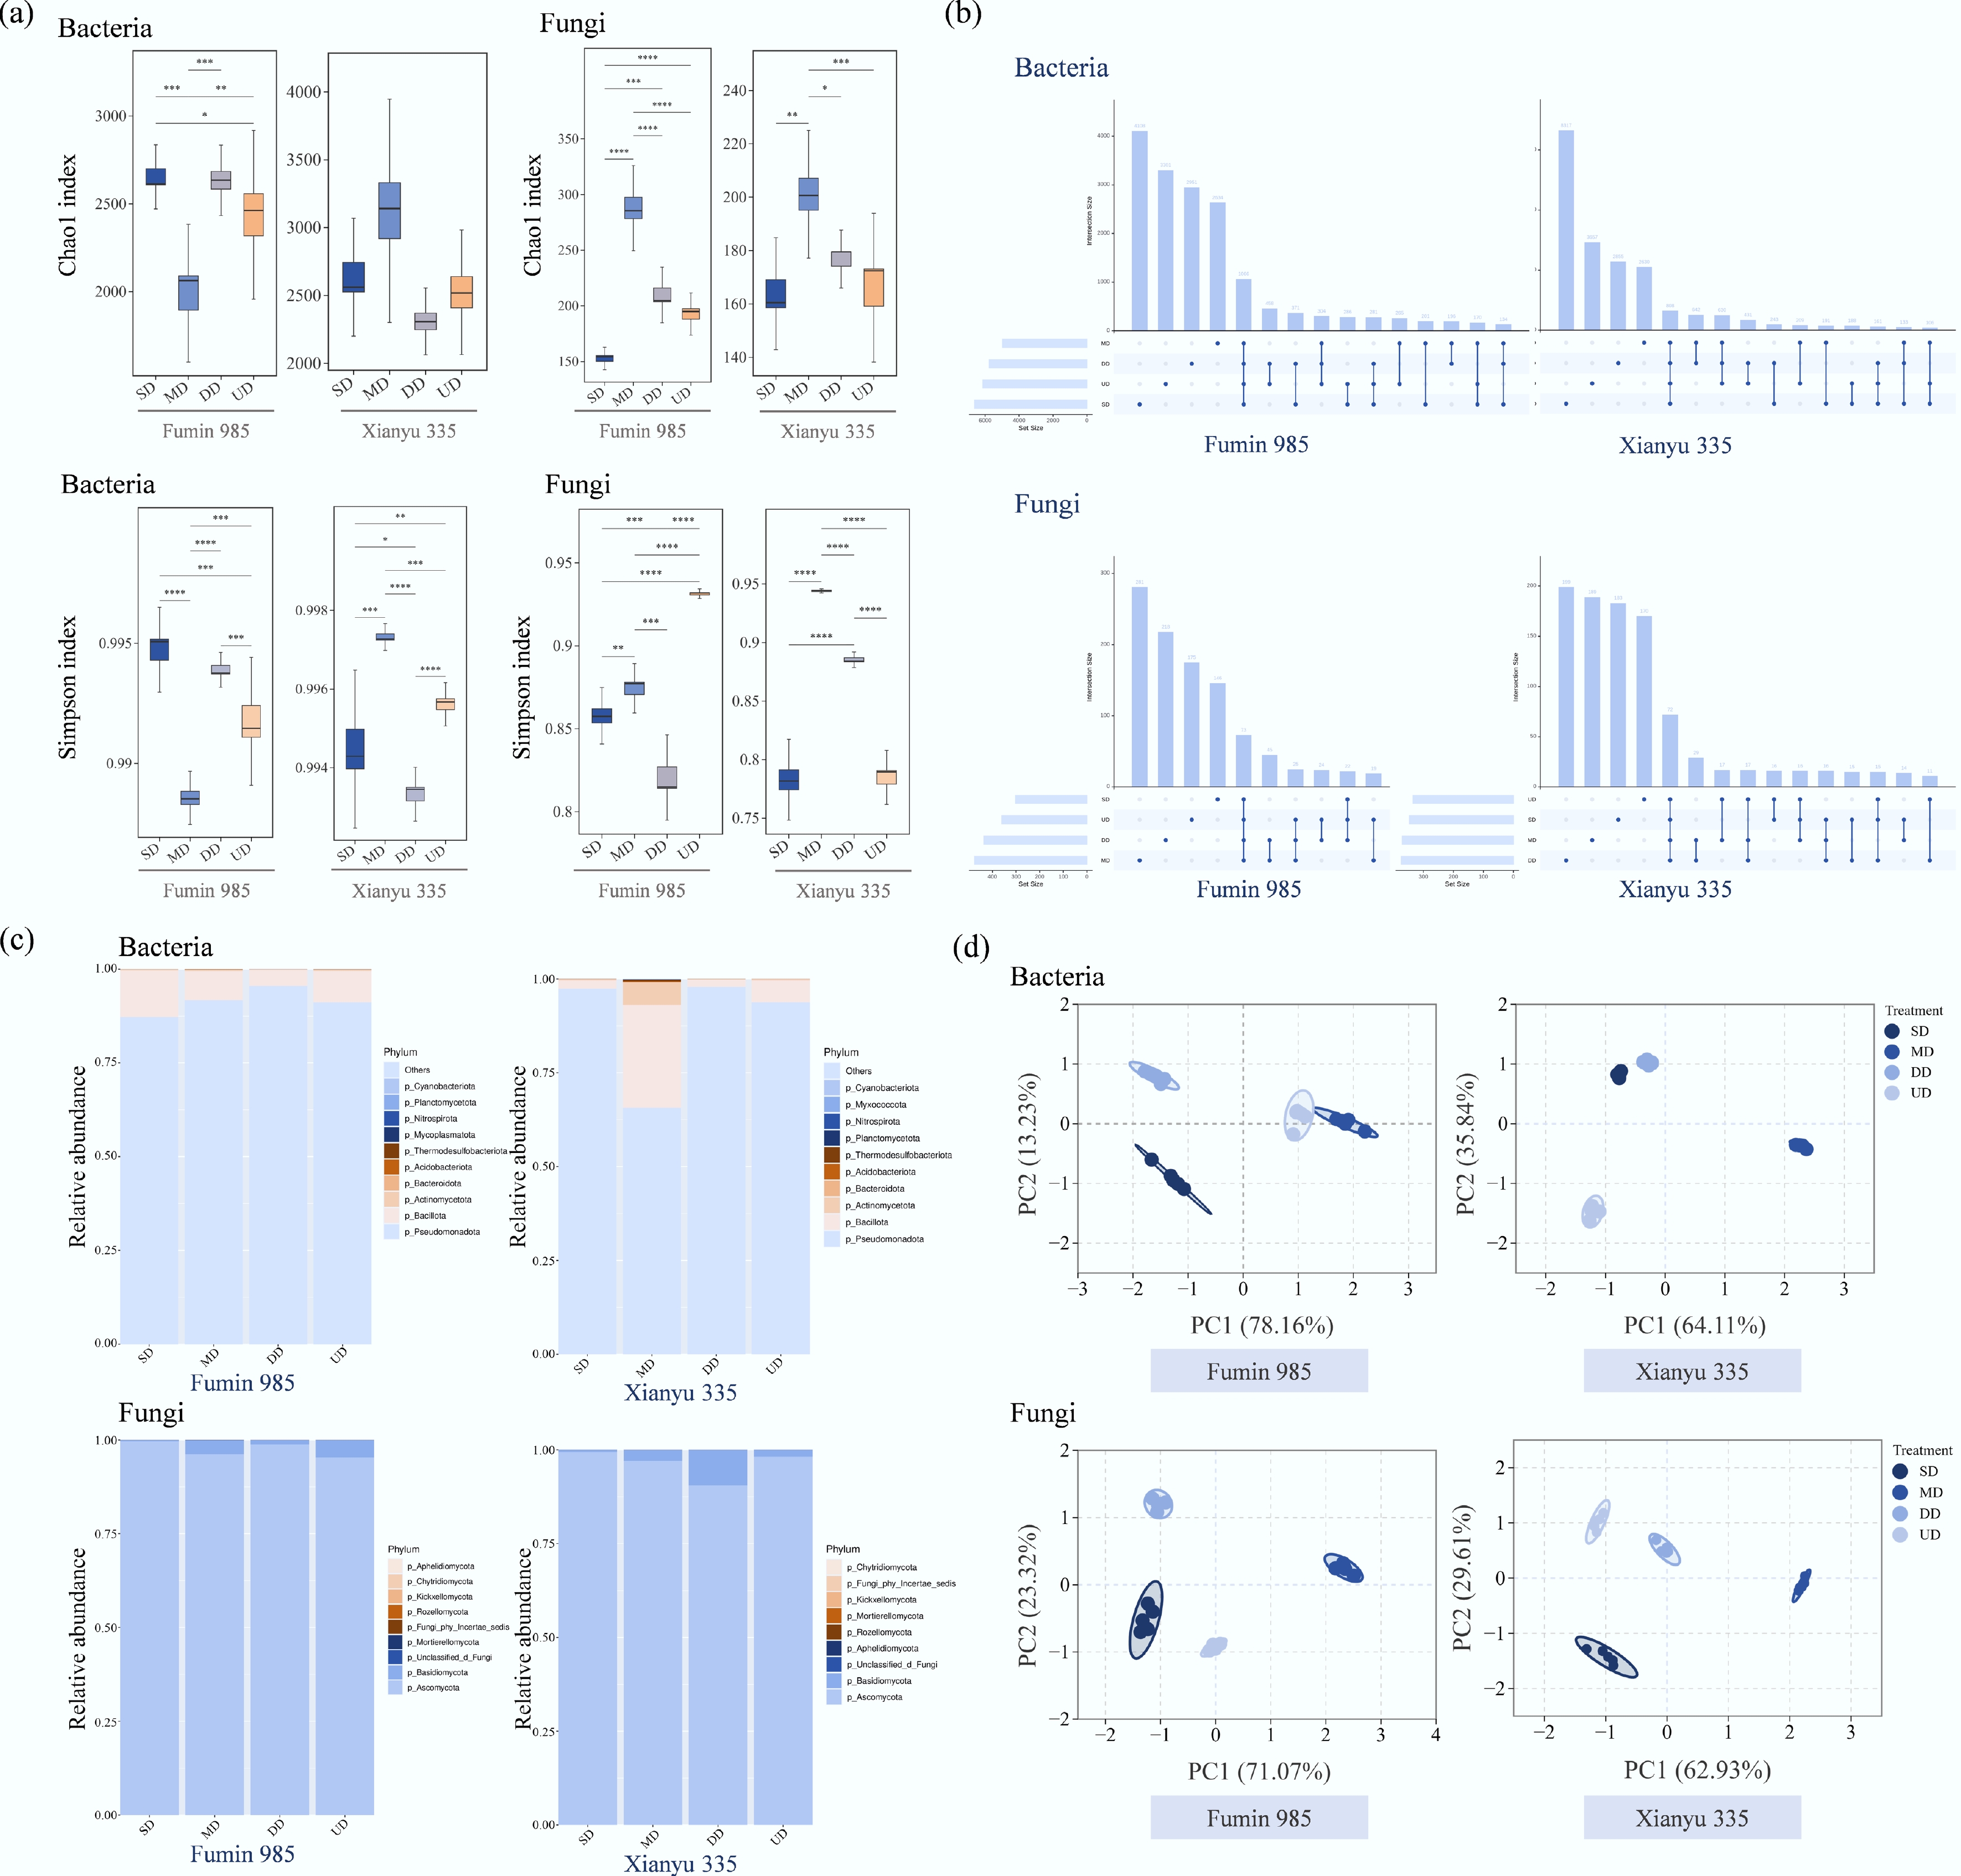
Figure 4.
Effects of straw incorporation depth on bacterial and fungal communities in maize roots. (a) The Chao1 and Simpson indices of bacterial and fungal communities in all samples. Asterisks indicate significant differences (* p < 0.05, ** p < 0.01, *** p < 0.001, **** p < 0.0001). (b) Shared OTUs in different treatments for the Fumin 985 and Xianyu 335 cultivars. (c) Relative abundances of dominant phyla in different maize cultivars under the four treatments. (d) Principal component analysis (PCA) ordination plots of roots, with different treatment samples colored by tillage depth. The percentages of variance explained by the first principal component (PC1) and the second principal component (PC2) are labeled on the corresponding coordinate axis.
-
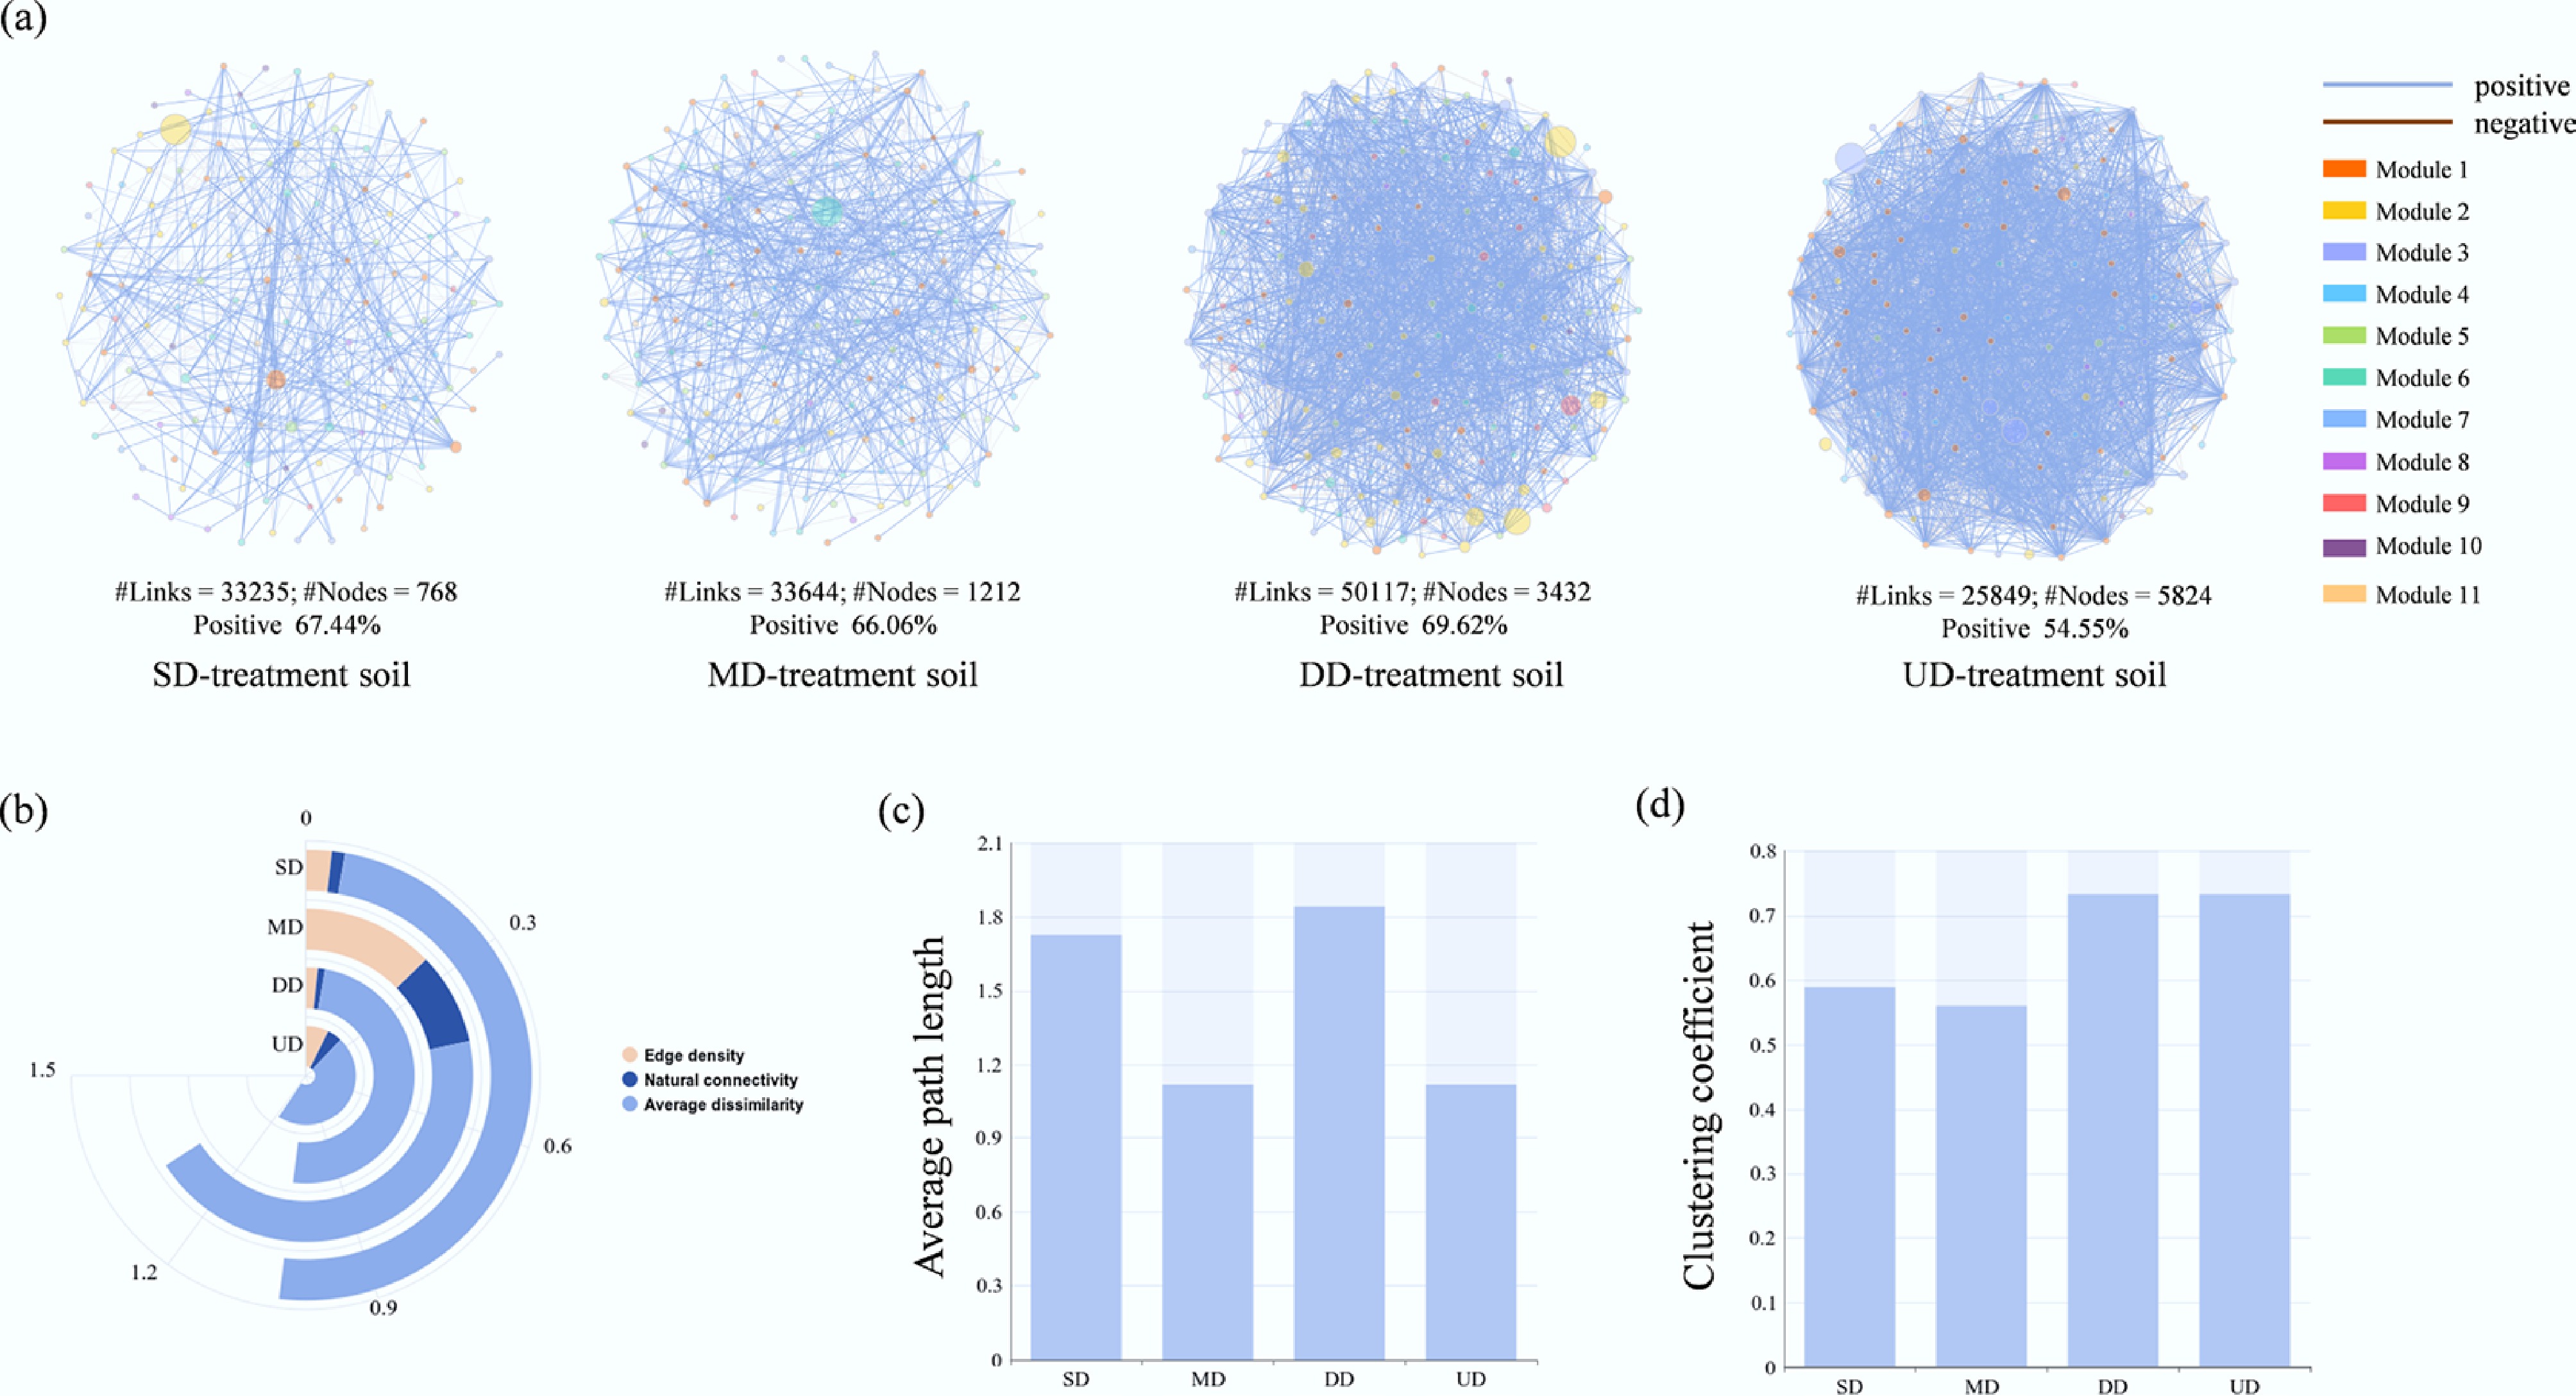
Figure 5.
Co-occurrence networks of the community model of bacterial and fungal communities. (a) Microbial co-occurrence networks of communities in bulk soil under four treatments. Blue edges represent positive associations, and orange edges represent negative associations. Node size indicates degree, and node color indicates modularity class. (b) Average path length of the networks. (c) Clustering coefficient of the networks. (d) Three network topological characteristics of the networks.
-
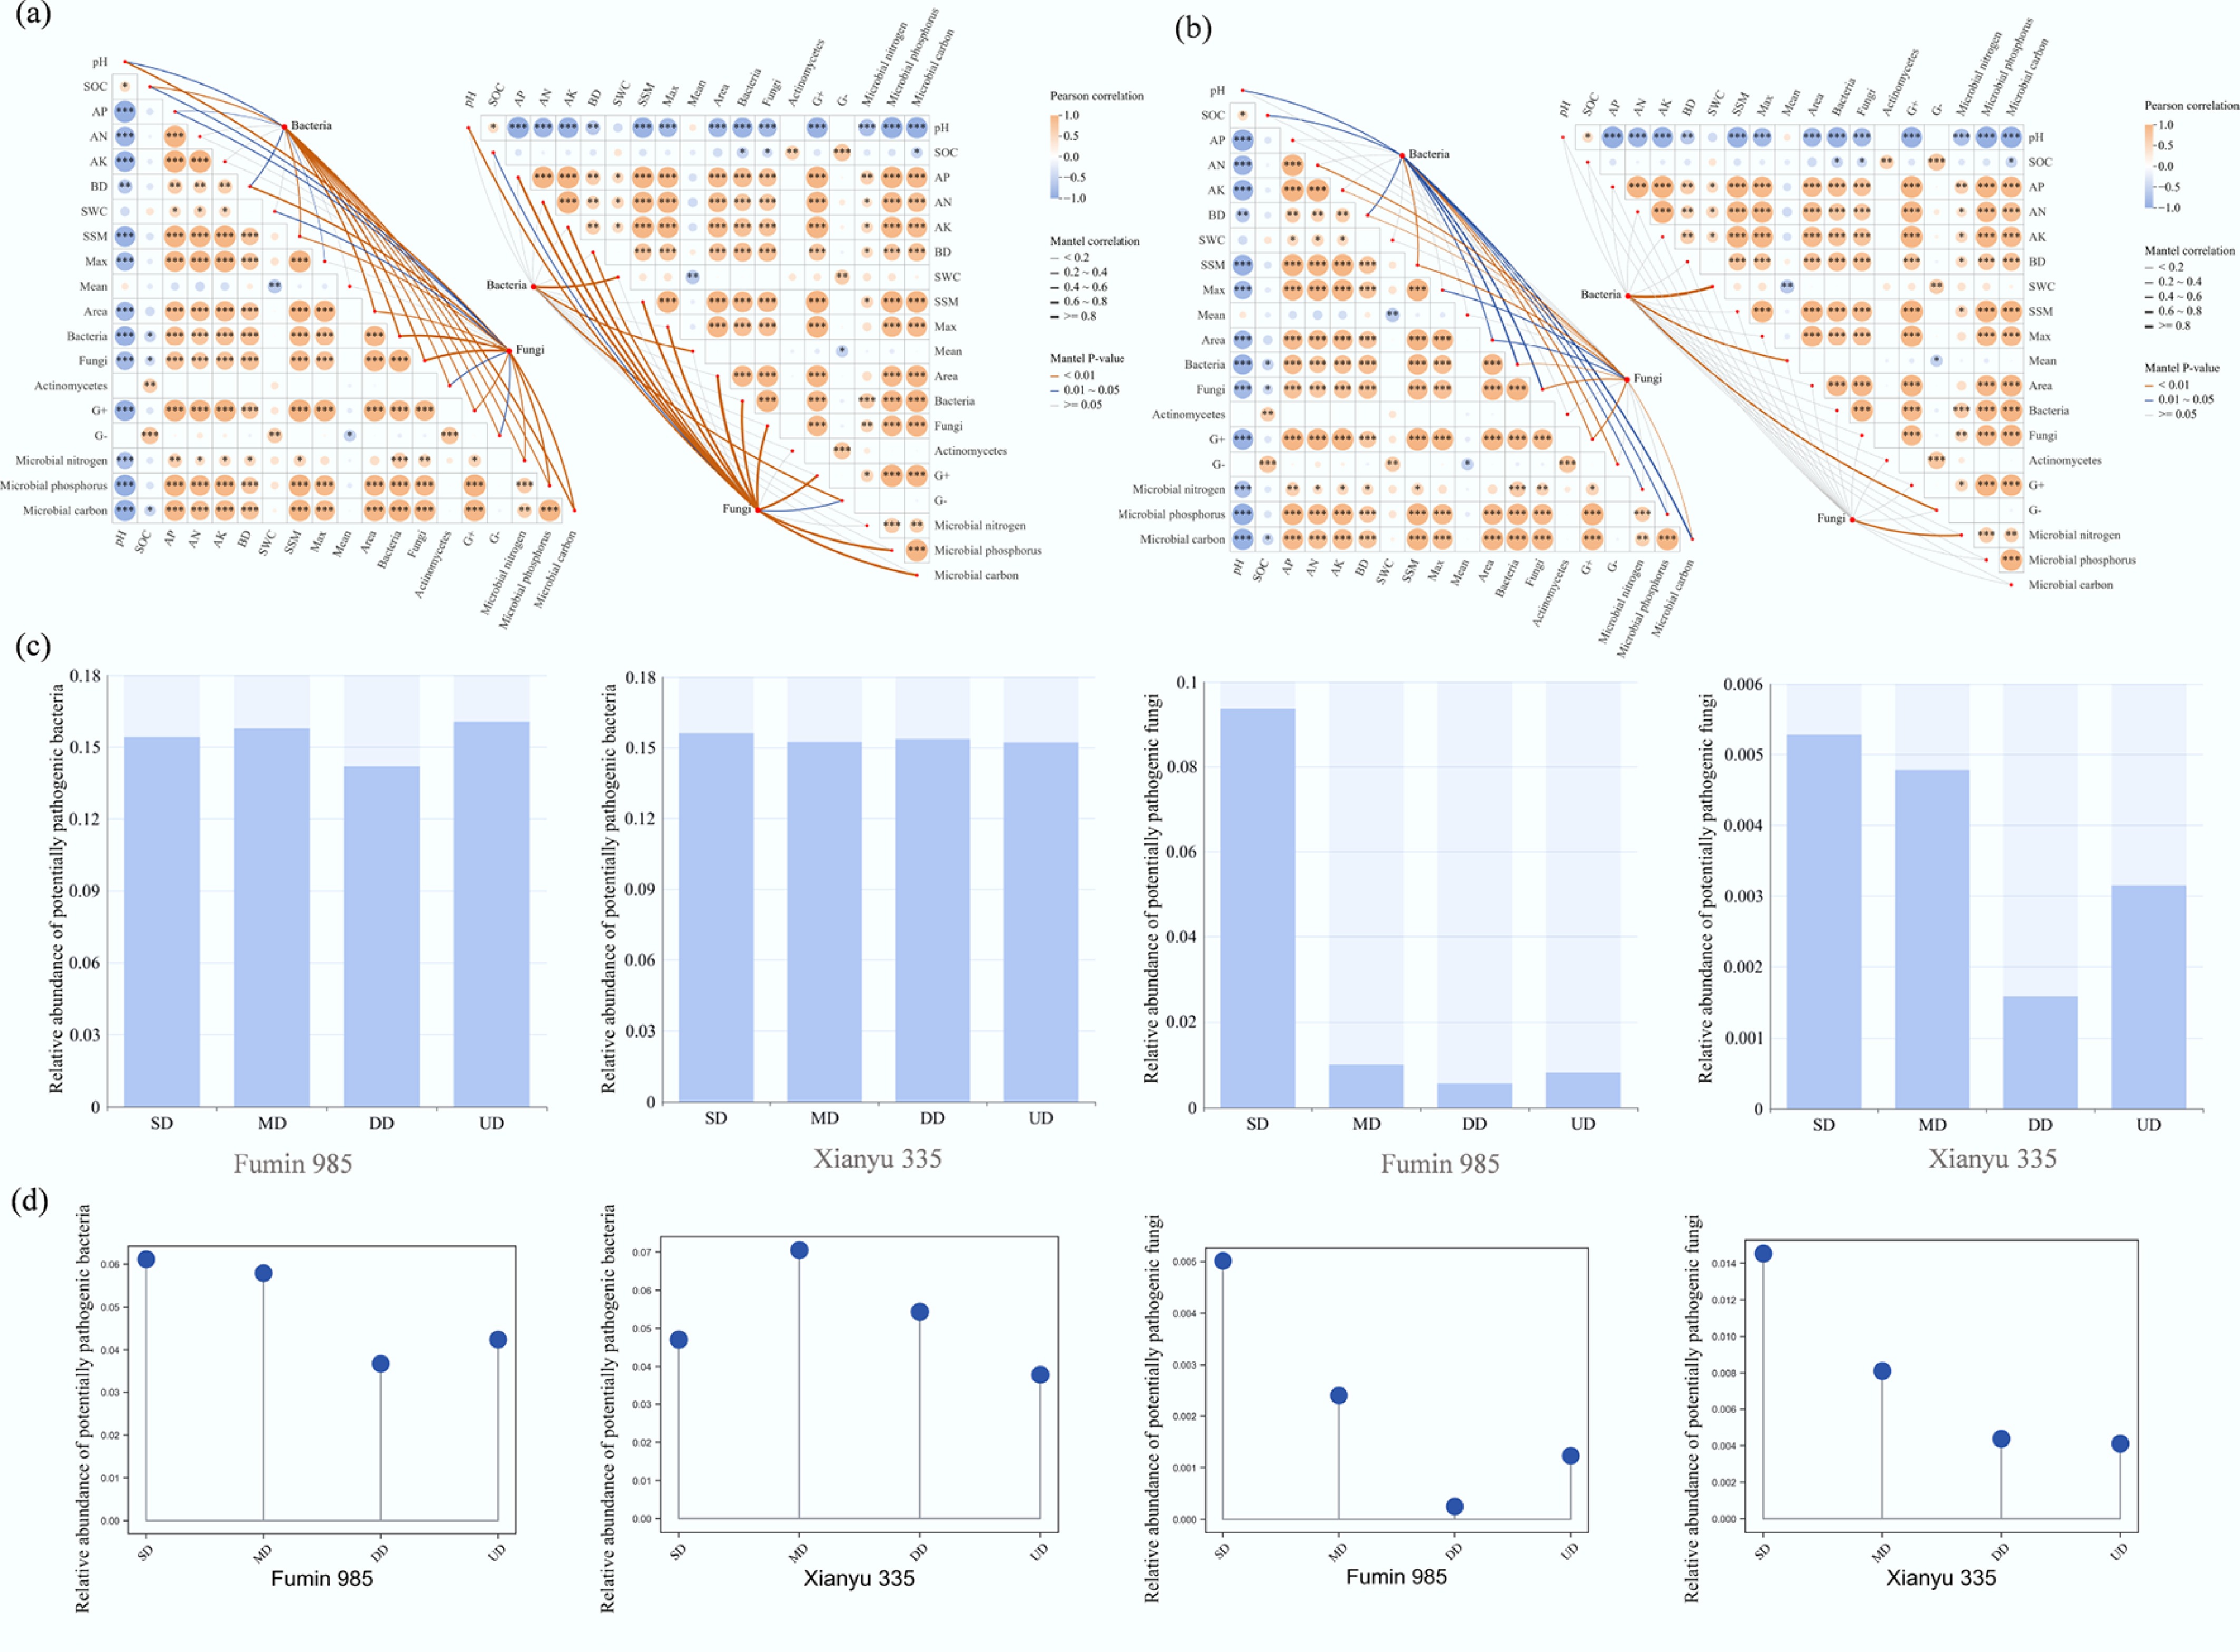
Figure 6.
Relationship of soil properties and microbial communities with maize varieties (Fumin 985 and Xianyu 335) of (a) rhizosphere soil microbial communities, and (b) root-endophytic communities by Pearson tests. (c) Relative abundance of potentially pathogenic microbes in rhizosphere soils under four treatments in Fumin 985 and Xianyu 335 varieties. (d) Relative abundance of potentially pathogenic microbes in roots under four treatments in Fumin 985 and Xianyu 335 varieties. Asterisks indicate significant differences (* p < 0.05).
-
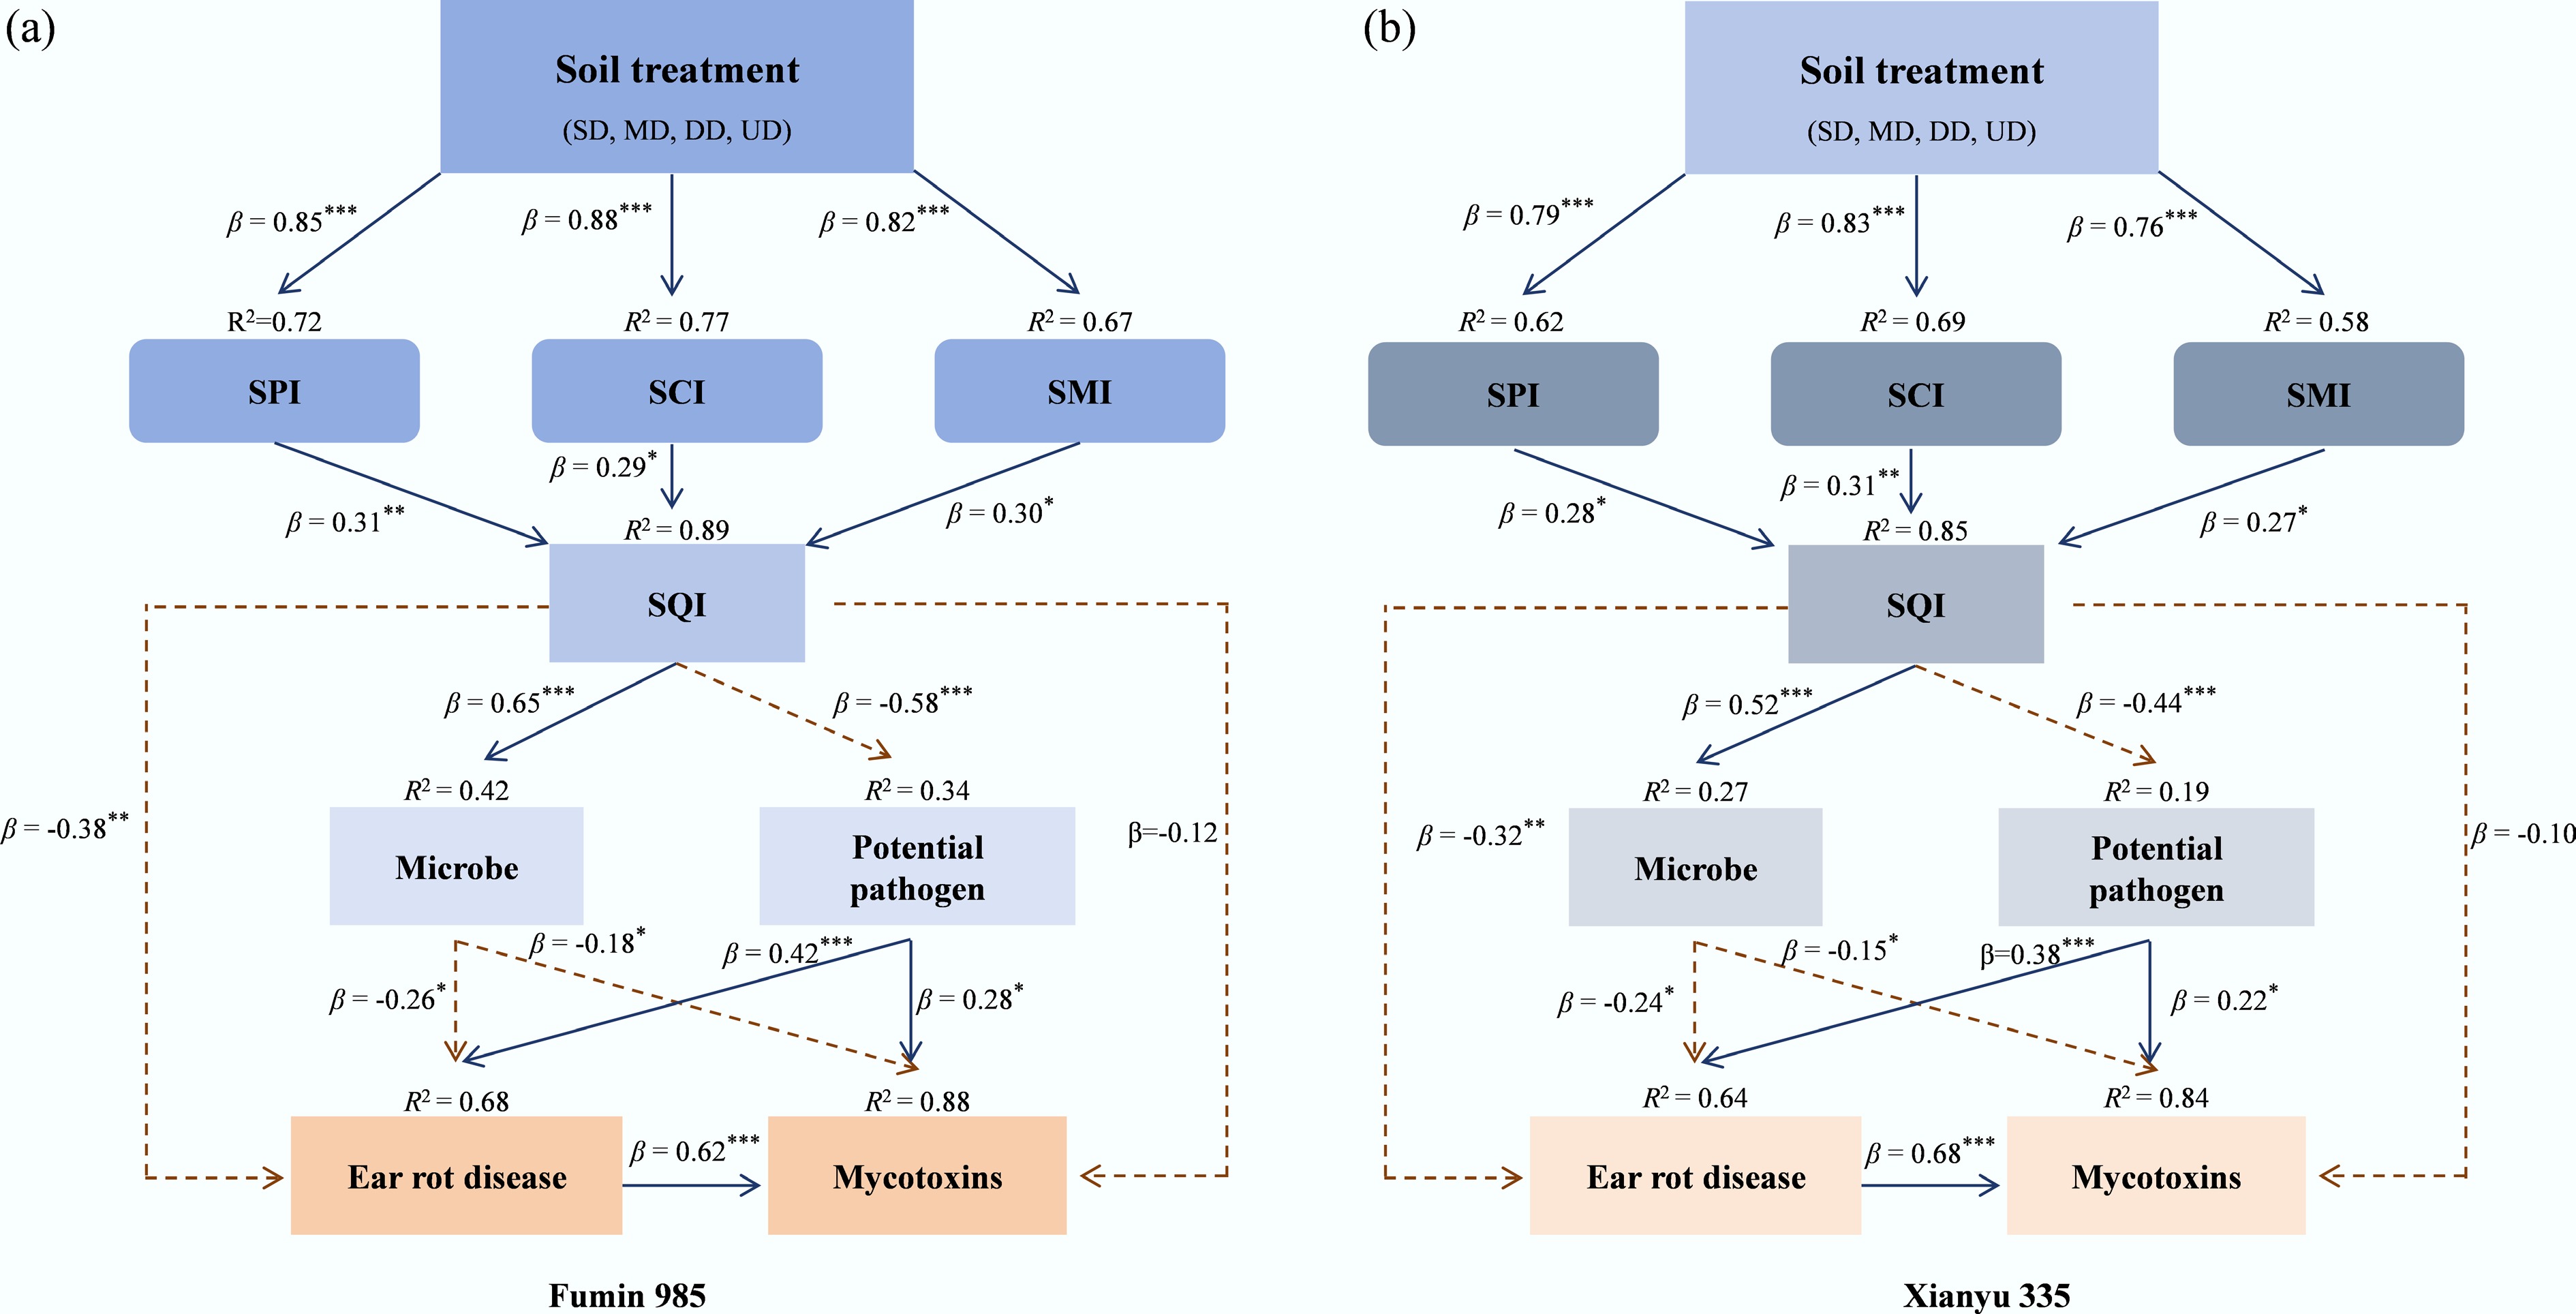
Figure 7.
Partial least squares path analysis for the effects of straw incorporation on ear rot disease and mycotoxin contamination with (a) Fumin 985 and (b) Xianyu 335 varieties. * p < 0.05, ** p < 0.01, and *** p < 0.001. Continuous and dashed lines indicate positive and negative relationships, respectively. β denotes the direct effect intensity, and R2 denotes the proportion of variance explained.
-
Treatment SD MD DD UD BD (g/cm3) 1.08 ± 0.01a 1.12 ± 0.01b 1.12 ± 0.01b 1.14 ± 0.01c SWC (%) 41.0 ± 0.5a 40.0 ± 0.6a 41.2 ± 0.4a 41.0 ± 0.6a SSW (%) 59.1 ± 0.4a 60.1 ± 0.5a 61.5 ± 0.4b 63.5 ± 0.5c Max (mm) 0.16 ± 0.01a 0.18 ± 0.01a 0.20 ± 0.01a 0.28 ± 0.01b Mean (mm) 0.045 ± 0.002a 0.044 ± 0.003a 0.055 ± 0.002b 0.062 ± 0.001bc Area (mm2) 128 ± 3a 210 ± 2b 228 ± 2b 336 ± 3c Note: BD, soil bulk density; SWC, soil water content; SSM, soil saturated water content; Max, maximum pore radius; Mean, mean pore radius; Area, total pore area. Values are presented as mean ± standard deviation (n = 5). Different lowercase letters (a, b, c) within the same row indicate significant differences among treatments at p < 0.05 (Tukey’s HSD post-hoc test). Table 1.
Soil physical properties
-
Treatment SD MD DD UD pH 7.45 ± 0.01a 7.34 ± 0.01a 7.04 ± 0.01b 7.02 ± 0.01b SOC (g/kg) 26.70 ± 0.05a 28.32 ± 0.08a 28.70 ± 0.03a 32.70 ± 0.05b AP (mg/kg) 26.1 ± 0.4a 29.1 ± 0.3a 54.0 ± 0.4b 65.8 ± 0.2c AN (mg/kg) 156.2 ± 0.1a 152.8 ± 0.1a 172.8 ± 0.2ab 191.9 ± 0.1c AK (mg/kg) 213.5 ± 0.1a 214.7 ± 0.4a 262.5 ± 0.2b 302.1 ± 0.1bc Note: SOC, soil organic carbon; AP, available phosphorus; AN, available nitrogen; AK, available potassium. Values are presented as mean ± standard deviation (n = 5). Different lowercase letters (a, b, c) within the same row indicate significant differences among treatments at p < 0.05 (Tukey’s HSD post-hoc test). Table 2.
Soil chemical properties
-
Treatment SD MD DD UD Bacteria (nmol/g) 50.44 ± 0.34a 56.12 ± 0.20a 57.95 ± 0.44ab 59.80 ± 0.73bc Fungi (nmol/g) 20.15 ± 0.65a 24.33 ± 0.37b 24.97 ± 0.44bc 26.80 ± 0.65bc Actinomycetes (nmol/g) 12.88 ± 0.35a 13.12 ± 0.25a 13.34 ± 0.20a 13.28 ± 0.24a G+ (nmol/g) 12.88 ± 0.24a 16.12 ± 0.55a 20.25 ± 0.20b 25.33 ± 0.60c G− (nmol/g) 25.54 ± 0.15a 24.59 ± 0.44a 25.32 ± 0.75a 25.76 ± 0.45a Microbial nitrogen (mg/kg) 22.42 ± 0.26a 23.87 ± 0.55a 25.62 ± 0.38b 24.45 ± 0.25a Microbial phosphorus (mg/kg) 23.42 ± 0.42a 25.76 ± 0.56a 28.97 ± 0.34ab 30.42 ± 0.95ab Microbial carbon (mg/kg) 425.7 ± 3.2a 463.2 ± 2.8b 487.4 ± 2.7b 509.6 ± 3.5c Note: G+, Gram-positive bacteria; G−, Gram-negative bacteria. Values are presented as mean ± standard deviation (n = 5). Different lowercase letters (a, b, c) within the same row indicate significant differences among treatments at p < 0.05 (Tukey’s HSD post-hoc test). Table 3.
Soil microbial properties
Figures
(7)
Tables
(3)