-
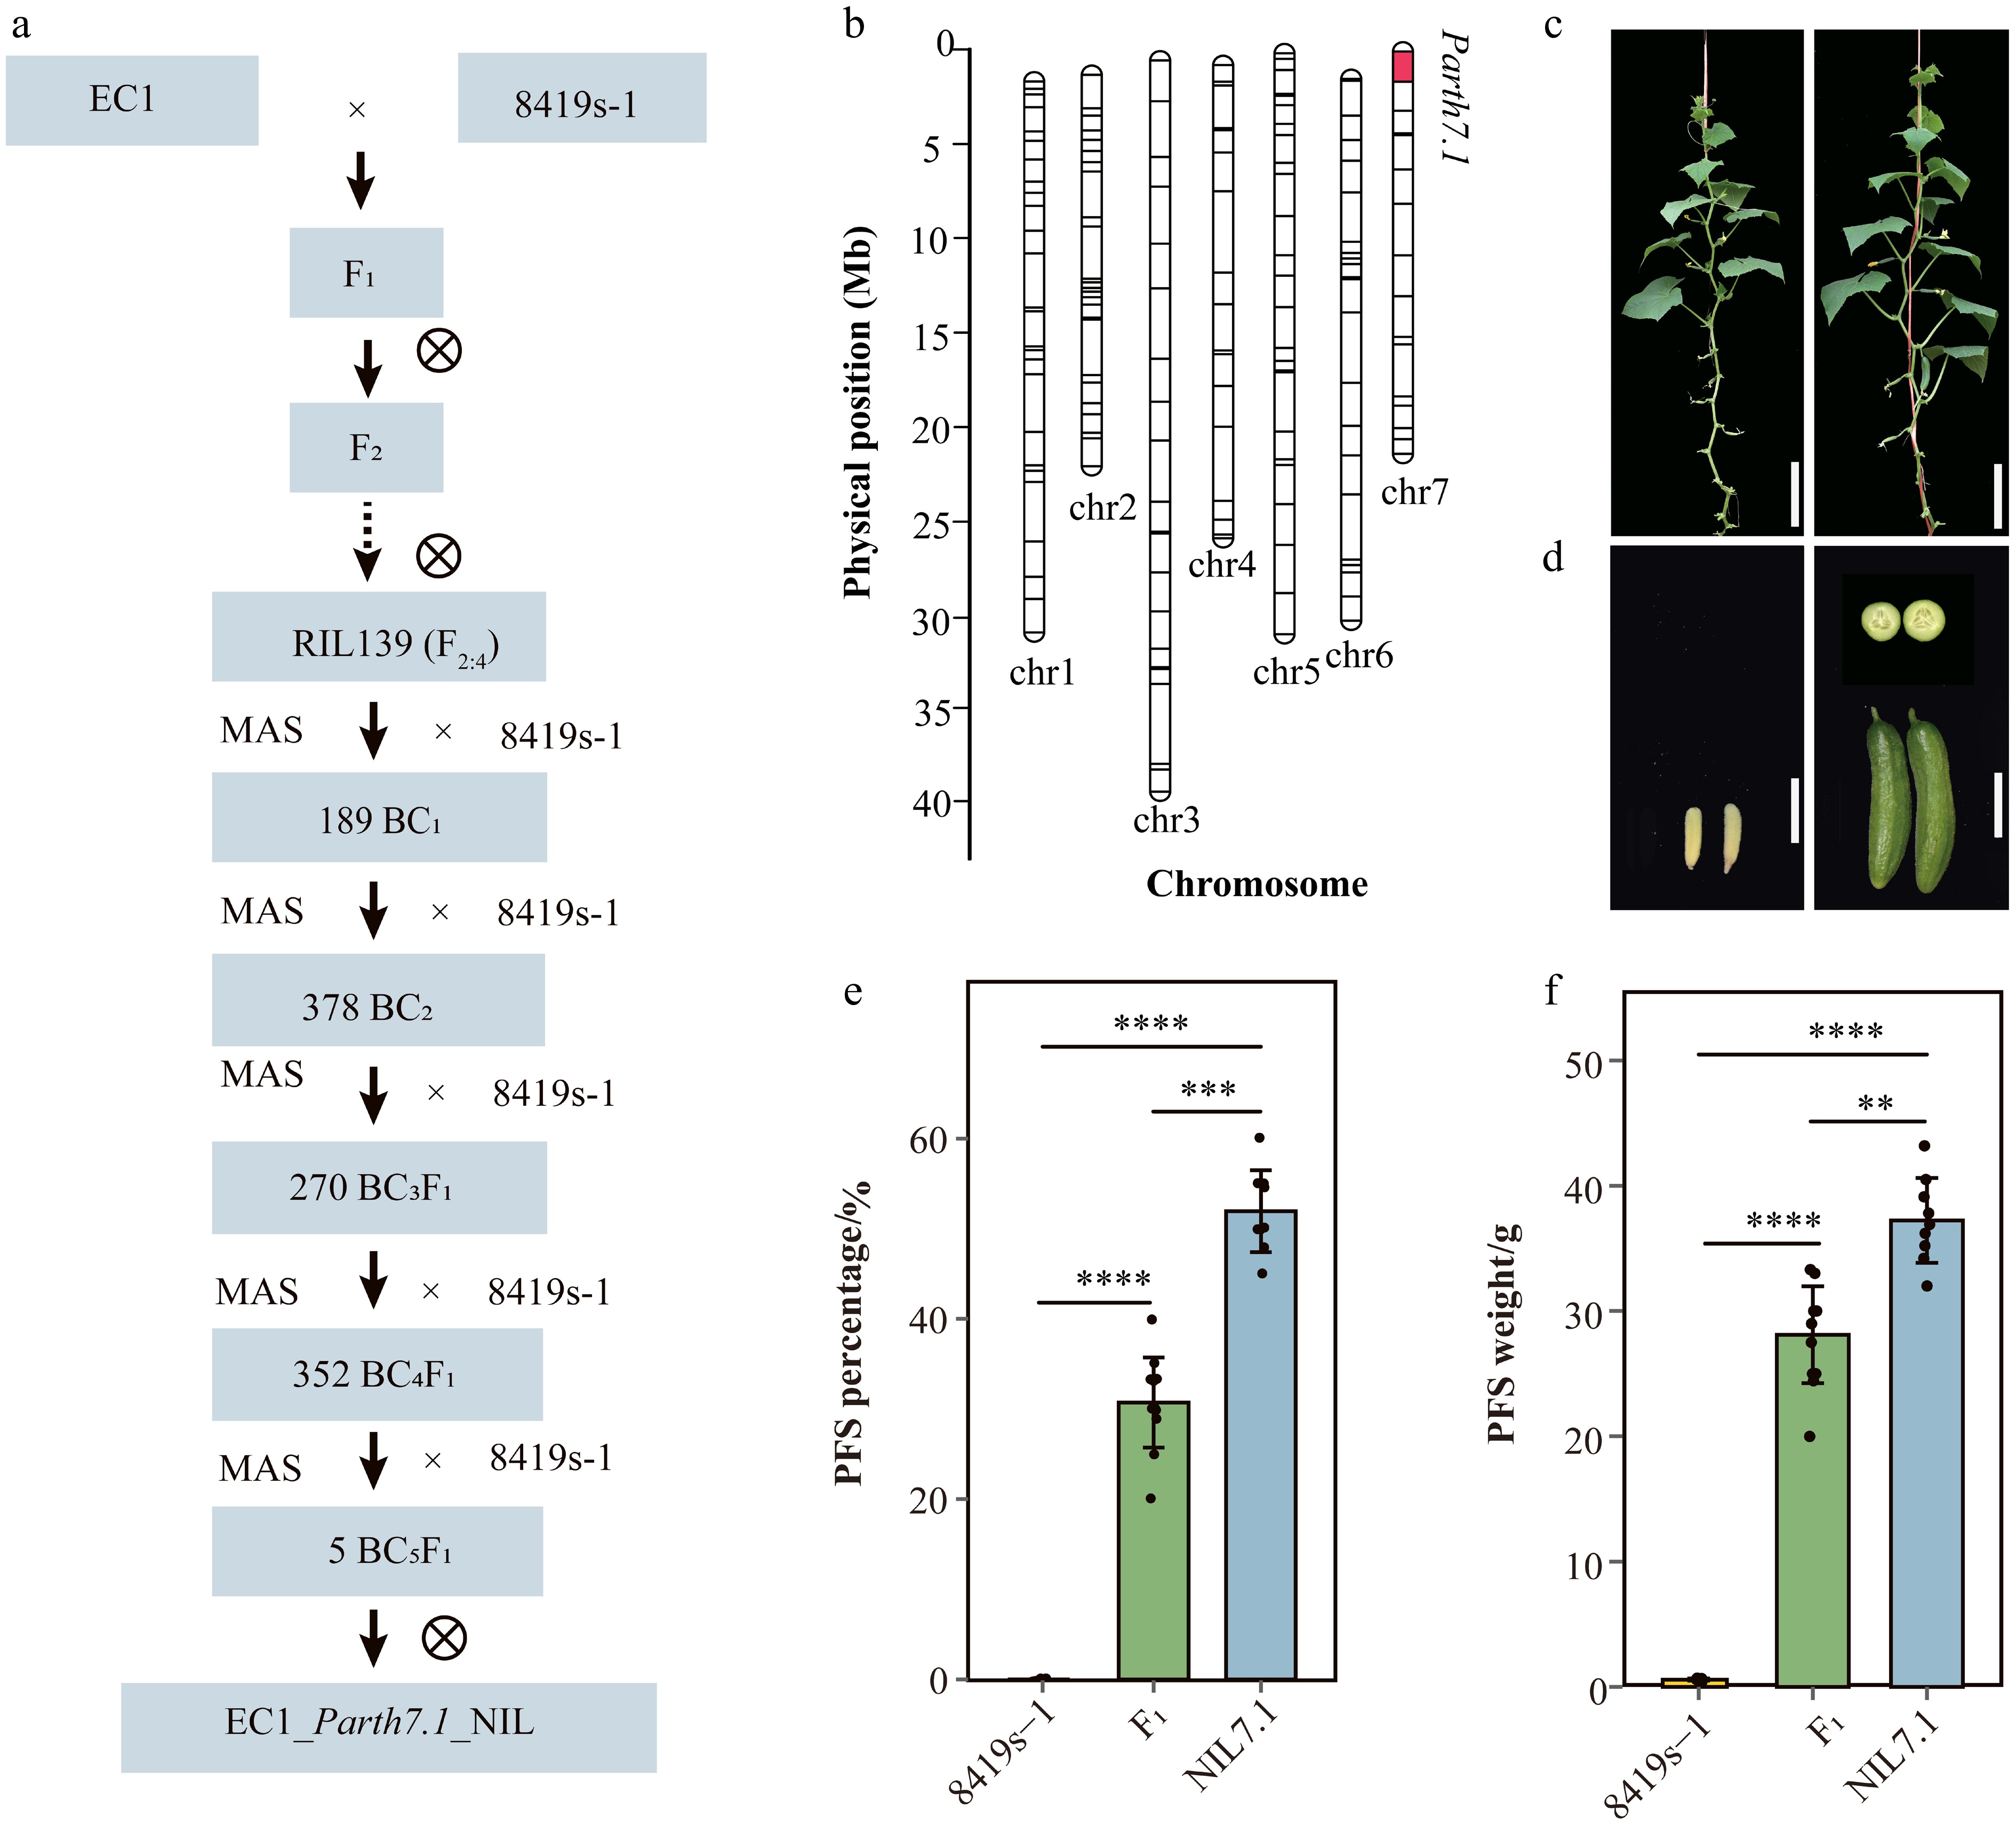
Figure 1.
The NIL7.1 associated with parthenocarpy in cucumber. (a) Schematic diagram of the generation of NIL7.1. (b) Genotyping of the NIL by 175 markers: the lines indicate the physical position of markers on the draft genome of 9930 V3.0. (c), (d) Plants and parthenocarpic fruit of NIL7.1 and 8419s-1 at 10 DPA. The white bars in (c) and (d) represent 20 and 2 cm, respectively. (e), (f) PFS percentage and weight of NIL7.1, F1 hybrid of NIL7.1 × 8419s-1, and 8419s-1 at 10 DPA. The **, ***, and **** indicate significant differences at p < 0.01, p < 0.001, and p < 0.0001, respectively.
-
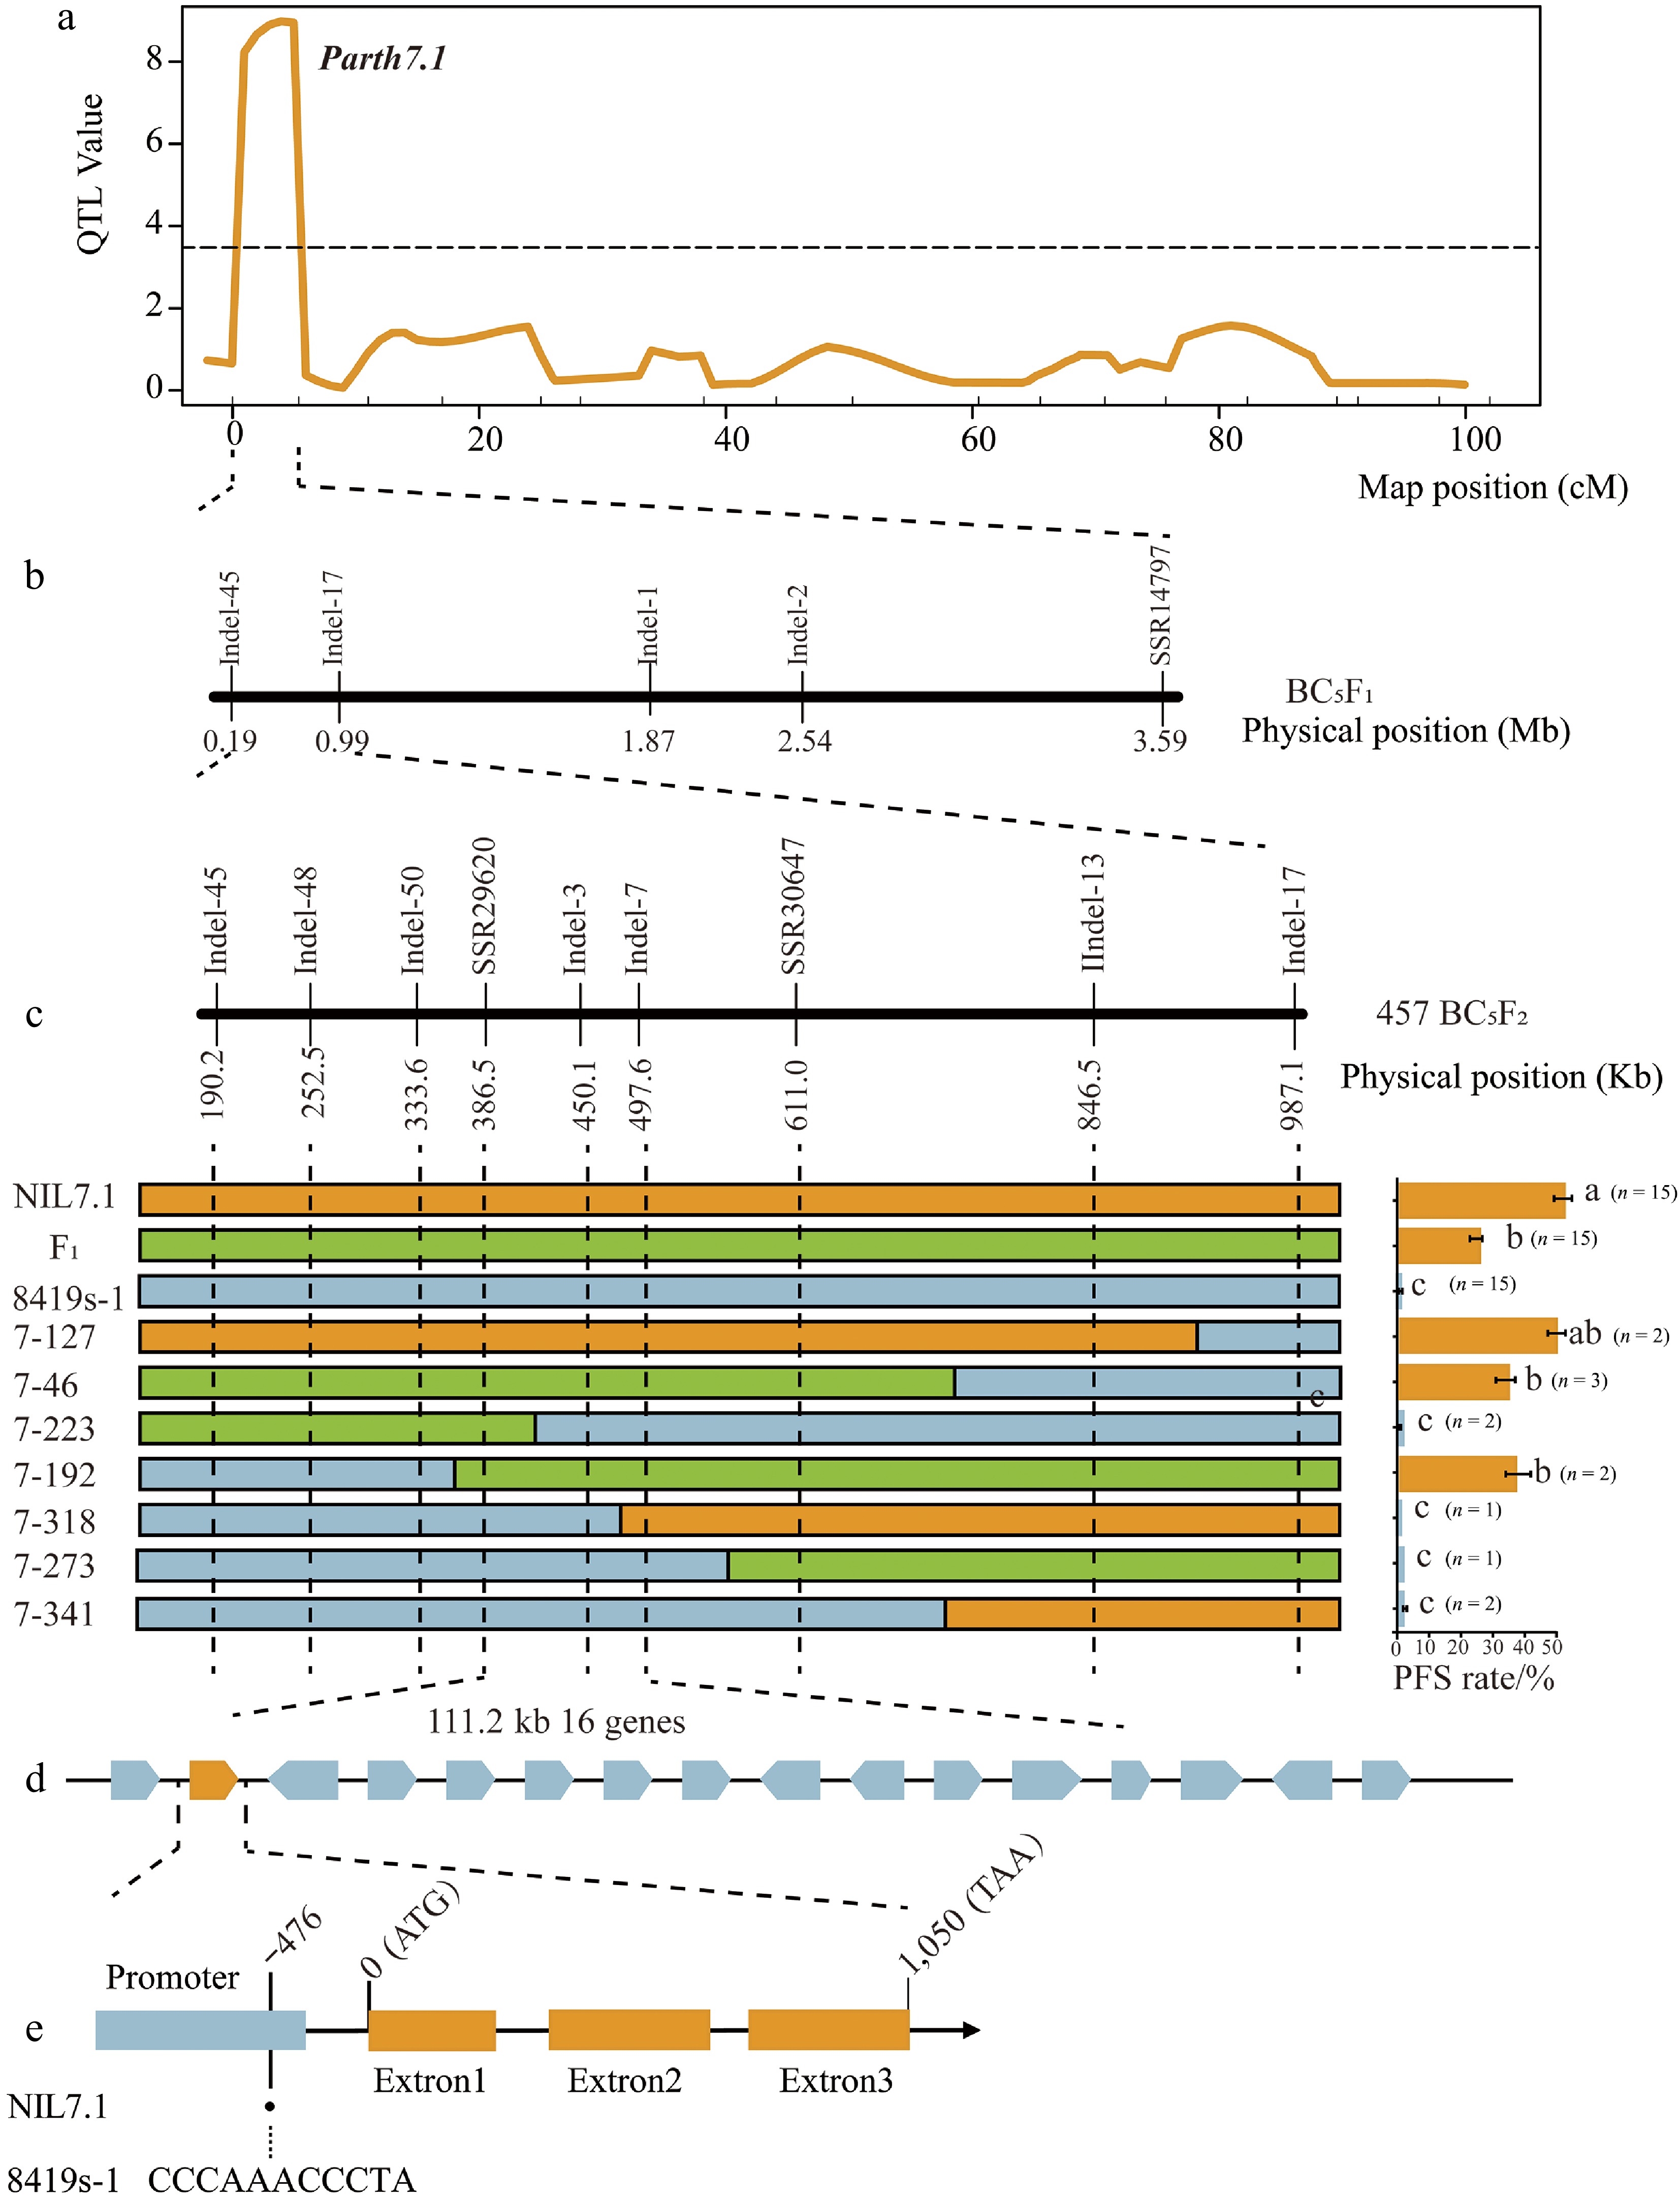
Figure 2.
Fine mapping and candidate gene analysis of the Parth7.1 locus. (a) QTL analysis of Parth7.1 using a BC3F1 population. (b) Linkage analysis with molecular markers on chromosome 7 placed Parth7.1 within a 3.7 cM interval flanked by Indel-45 and Indel-17 in the BC5F1 population. (c) Parth7.1 locus was narrowed down to a 111.2-kb region. N indicates the number of recombinant individuals. The significant differences at p < 0.05, as determined by the Wilcoxon test, are indicated by different letters. (d) Candidate genes within the 111.2-kb region of Parth7.1. (e) The key mutation site of candidate gene CsaV3_7G000270 (CsBZS1) identified by resequencing and RNA-seq data analysis of parent lines EC1 and 8419s-1.
-
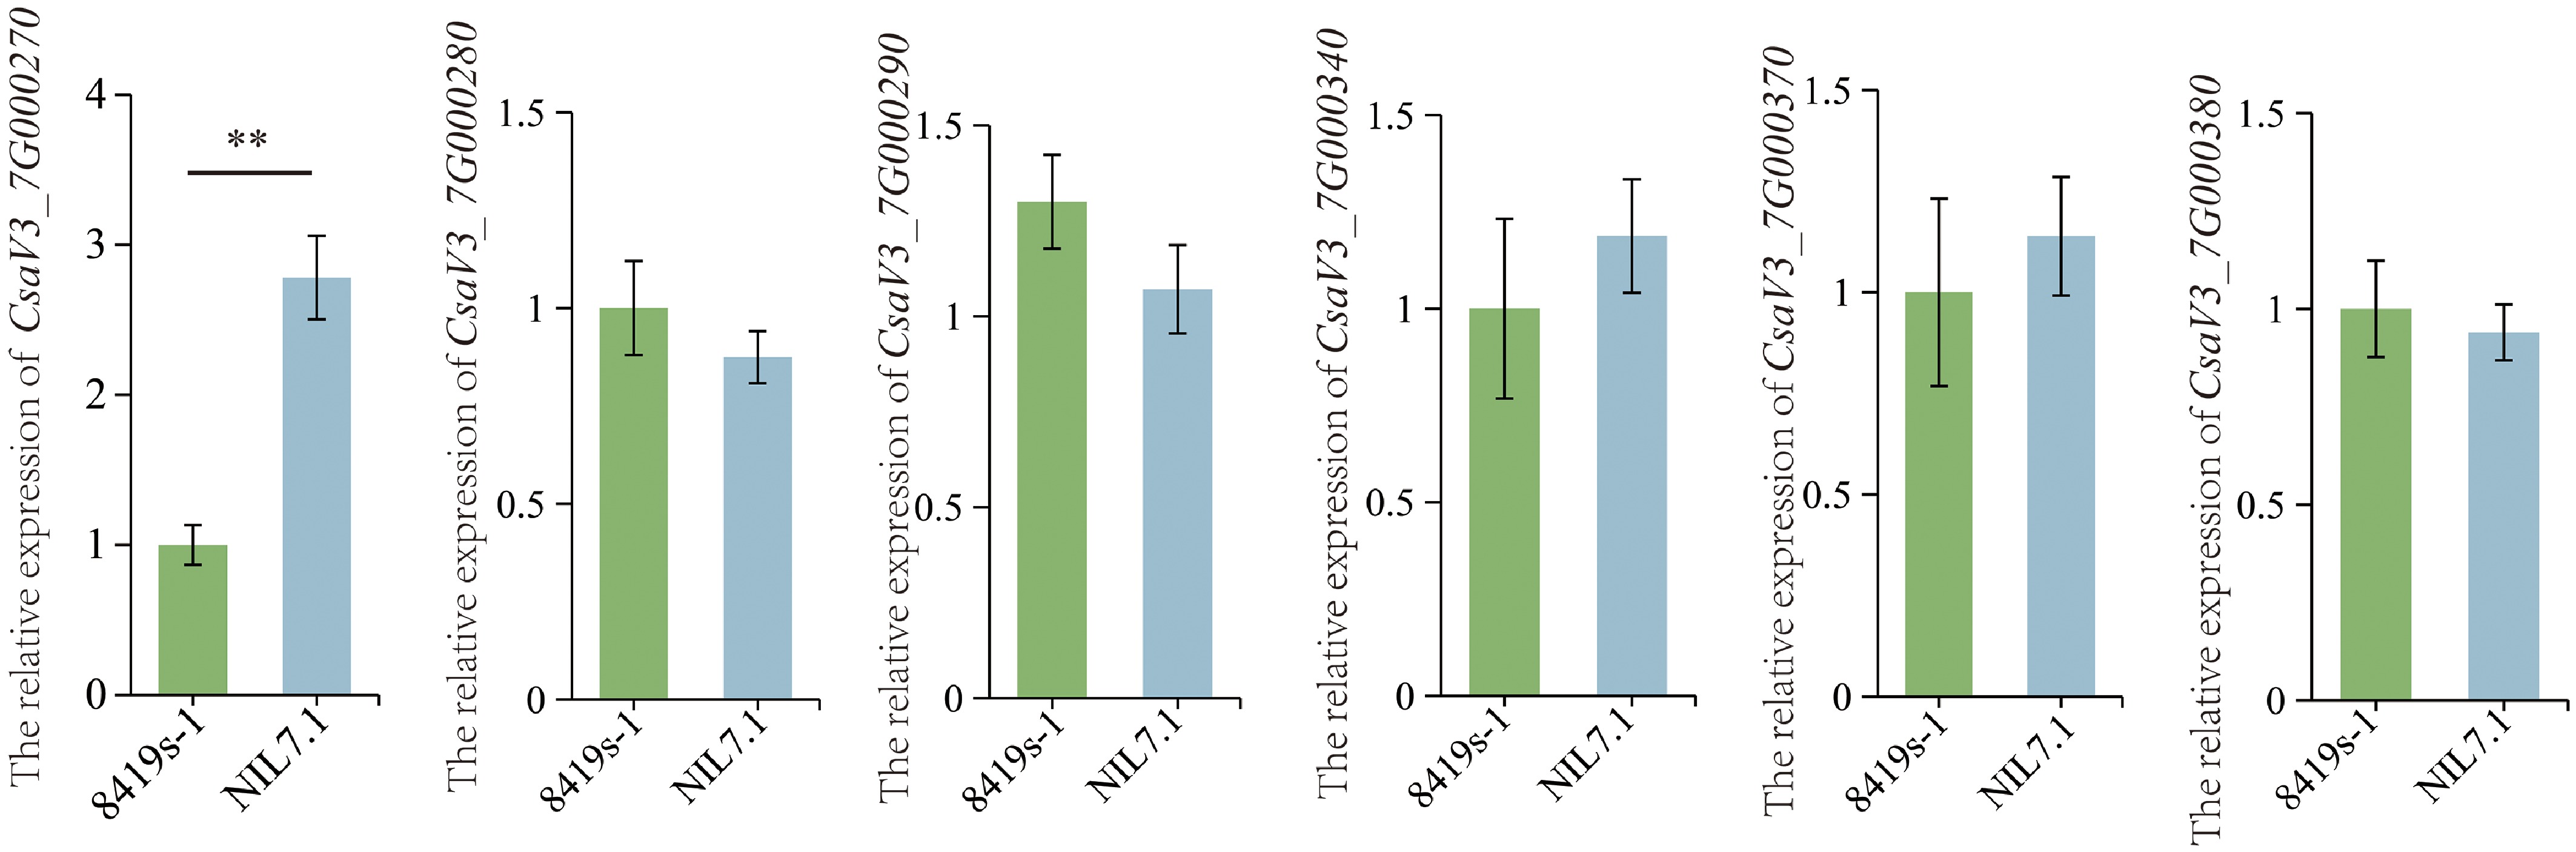
Figure 3.
The expression levels of five candidate genes for Parth7.1. The expression was examined in parthenocarpic fruit of NIL7.1 and 8419s-1 at 2 d after anthesis. Each experiment was repeated independently three times. The *** indicates a significant difference at p < 0.001.
-
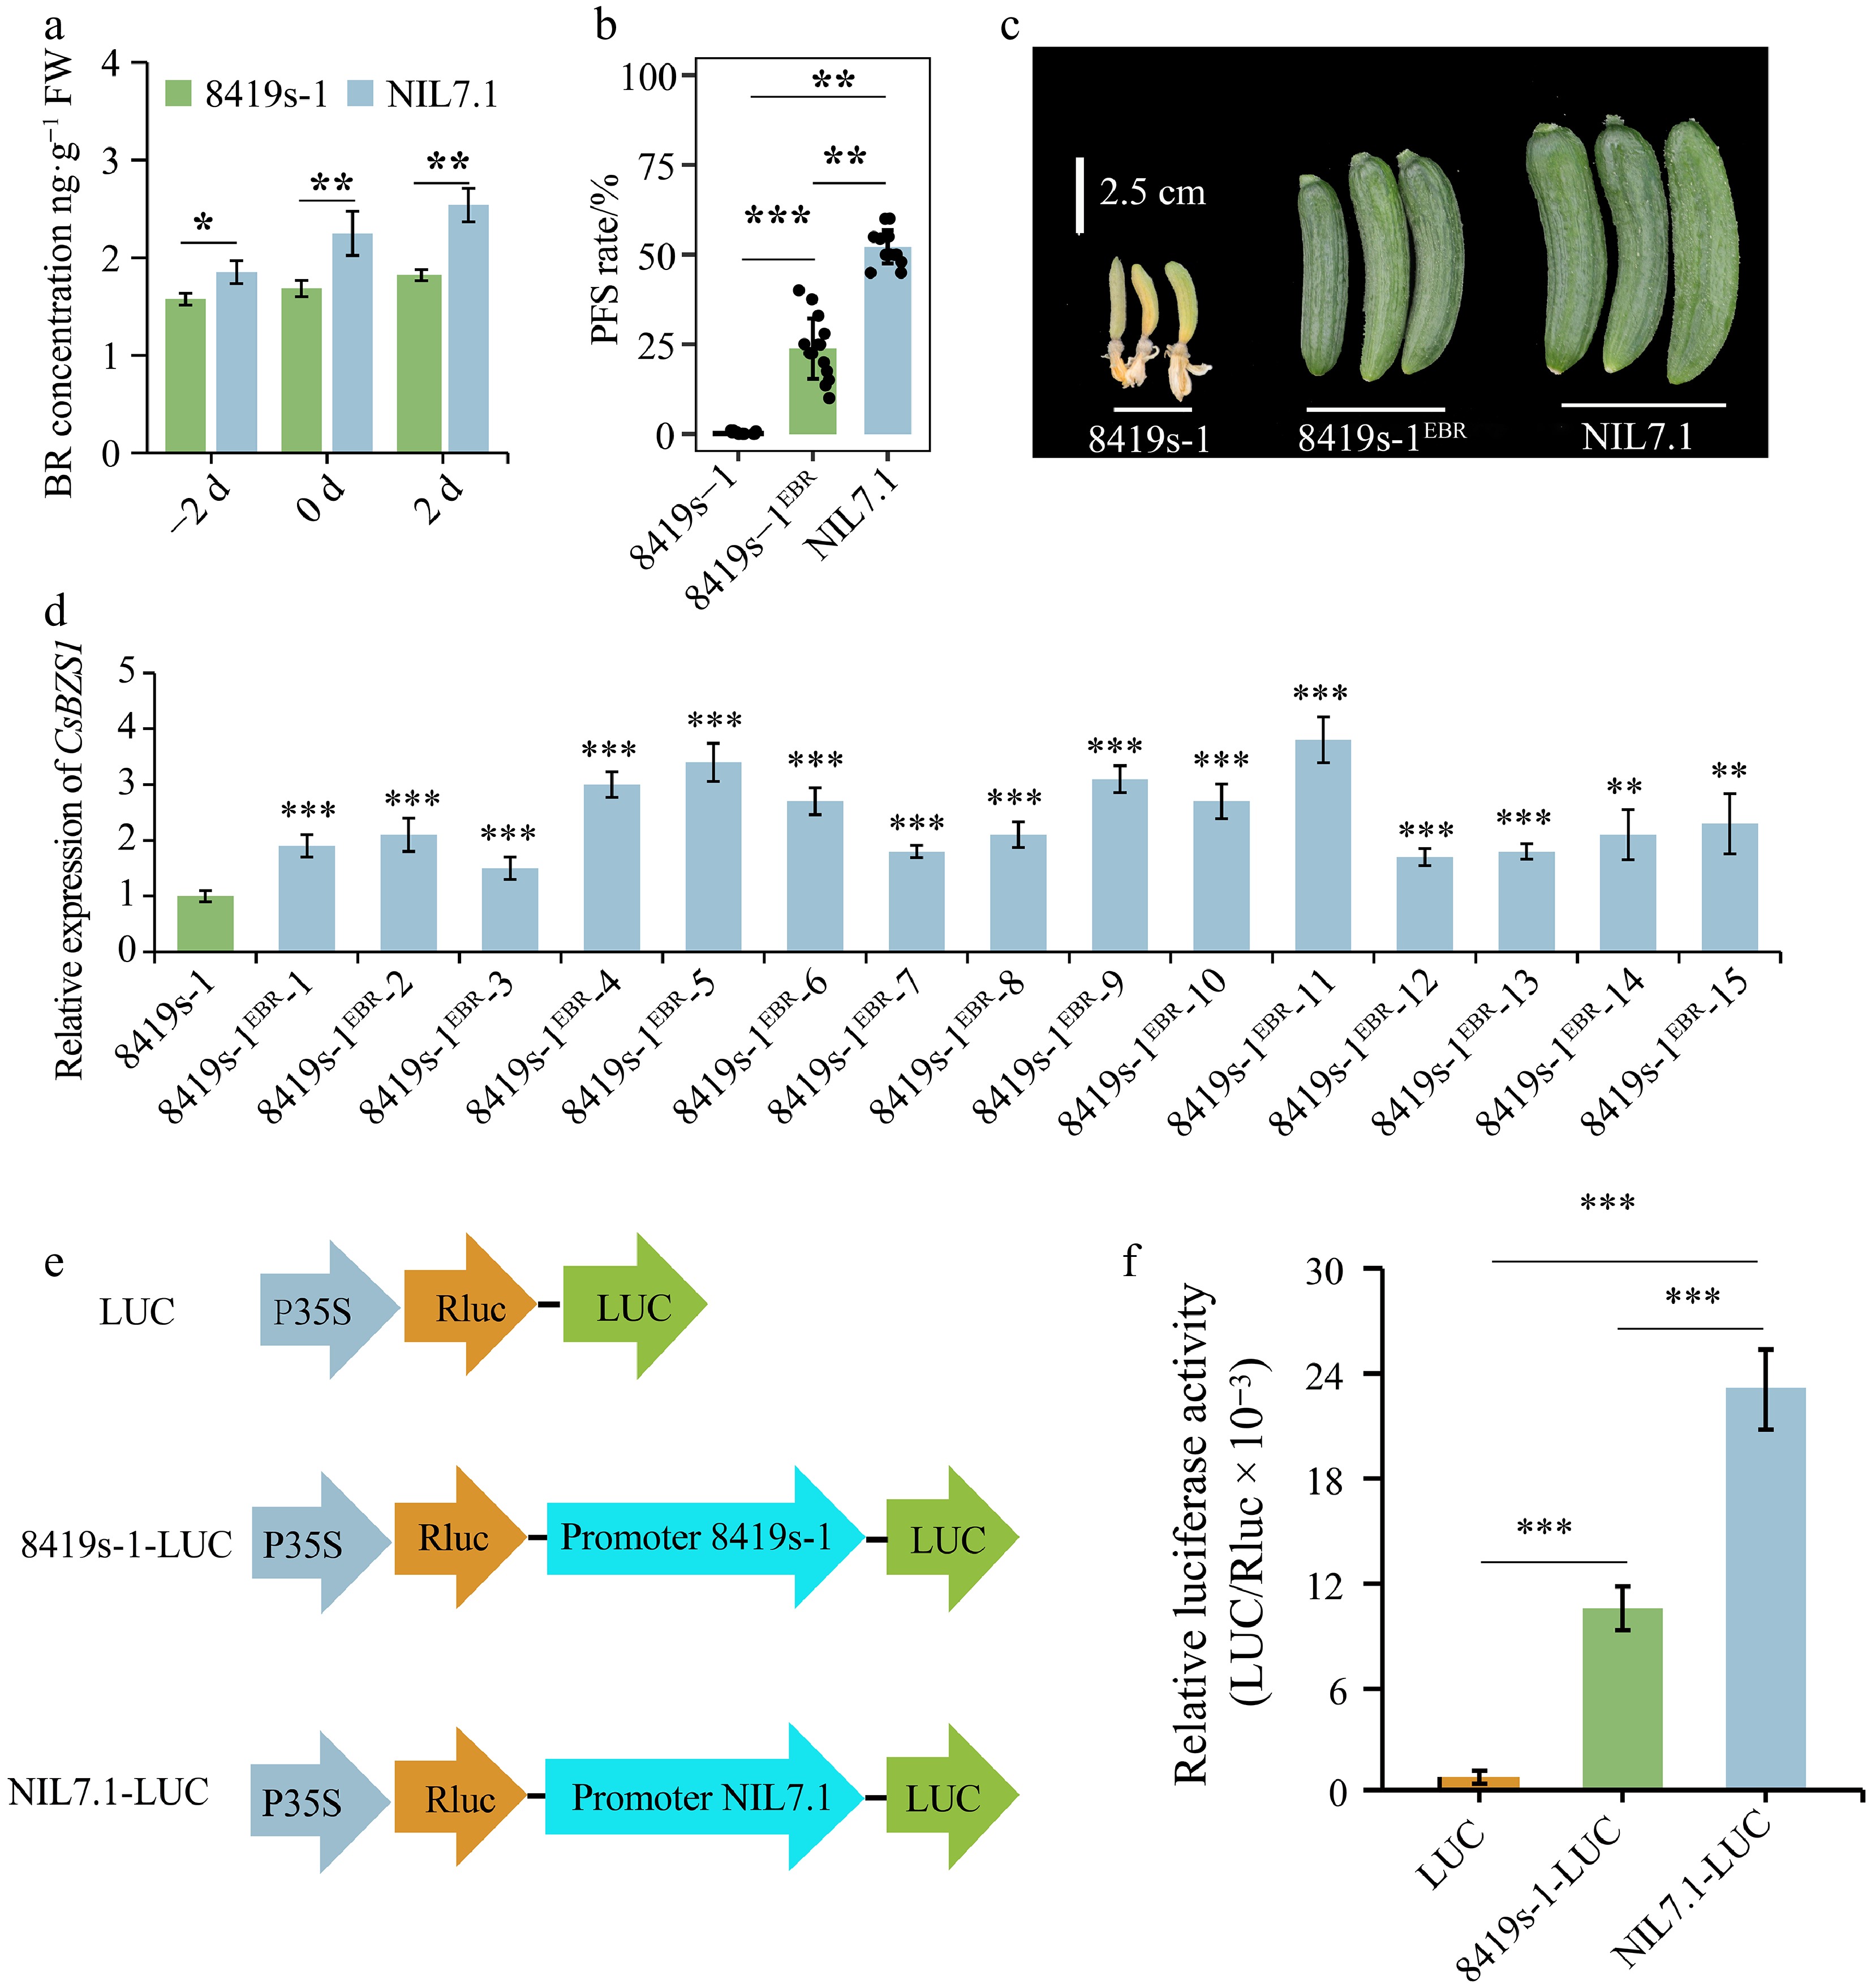
Figure 4.
CsBZS1 is proposed as a promising candidate gene for Parth7.1. (a) The EBR concentration of 8419s-1 and NIL7.1. Each experiment was repeated independently three times. (b) The PFS rate of EBR-treated 8419s-1 (8419s-1EBR). The 8419s-1 and NIL7.1 were control groups with water treatment. Each experiment was repeated independently with 15 plants. (c) The typical parthenocarpic fruit among the 8419s-1, 8419s-1EBR, and NIL7.1 groups. (d) The relative expression levels of CsBZS1 in parthenocarpic fruits between the 8419s-1 and 8419s-1EBR groups. Each experiment was repeated independently three times. The **, and *** indicate significant differences at p < 0.01 and p < 0.001, respectively. (e) Schematic diagram of the promoter activity assay. (f) LUC relative activities driven by promoters of CsBZS1 from NIL7.1 and 8419s-1. Each experiment was repeated independently three times. The *** indicates significant differences at p < 0.001.
-
Population Total Parthenocarpic lines Non-parthenocarpic lines Expected ratio χ2 p value NIL7.1 15 15 0 − − − 8419s-1 15 0 15 − − − F1 15 15 0 − − − BC5F2 457 349 108 3:1 0.455 0.529 Table 1.
The segregation of parthenocarpy in NIL7.1, 8419s-1, F1, and BC5F2 populations derived from the cross between NIL7.1 and 8419s-1.
-
Gene ID Position Region Whole re-sequence data analysis RNA-seq data analysis Annotation DNA mutant
(REF→ALT)Protein mutant
(REF→ALT)Mutant type log10
(EC1/8419s-1)CsaV3_7G000270 395282 Promoter CCCAAACCCTA→. − InDel 3.1* B-box zinc finger family protein CsaV3_7G000280 403189 Exon T→C Thr→Ala Nonsynonymous 0.124 Kinesin-related protein 11 CsaV3_7G000290 419734 Exon T→C Ser→Pro Nonsynonymous 1.54* RNA-binding CRM domain protein CsaV3_7G000340 447415 Exon C→T Asp→Asn Nonsynonymous 0.241 Zinc finger CCCH domain-containing
protein 19CsaV3_7G000370 472624 Exon G→C Arg→Pro Nonsynonymous 0.054 Laminin subunit alpha-1 CsaV3_7G000380 484364 Exon T→A Phe→Ile Nonsynonymous 0.078 Unknown protein * indicates a significant difference at p < 0.05 in RNA-seq data analysis. Table 2.
Candidate gene analysis of Parth7.1 based on deep whole resequencing and RNA-seq data of parent lines.
Figures
(4)
Tables
(2)