-
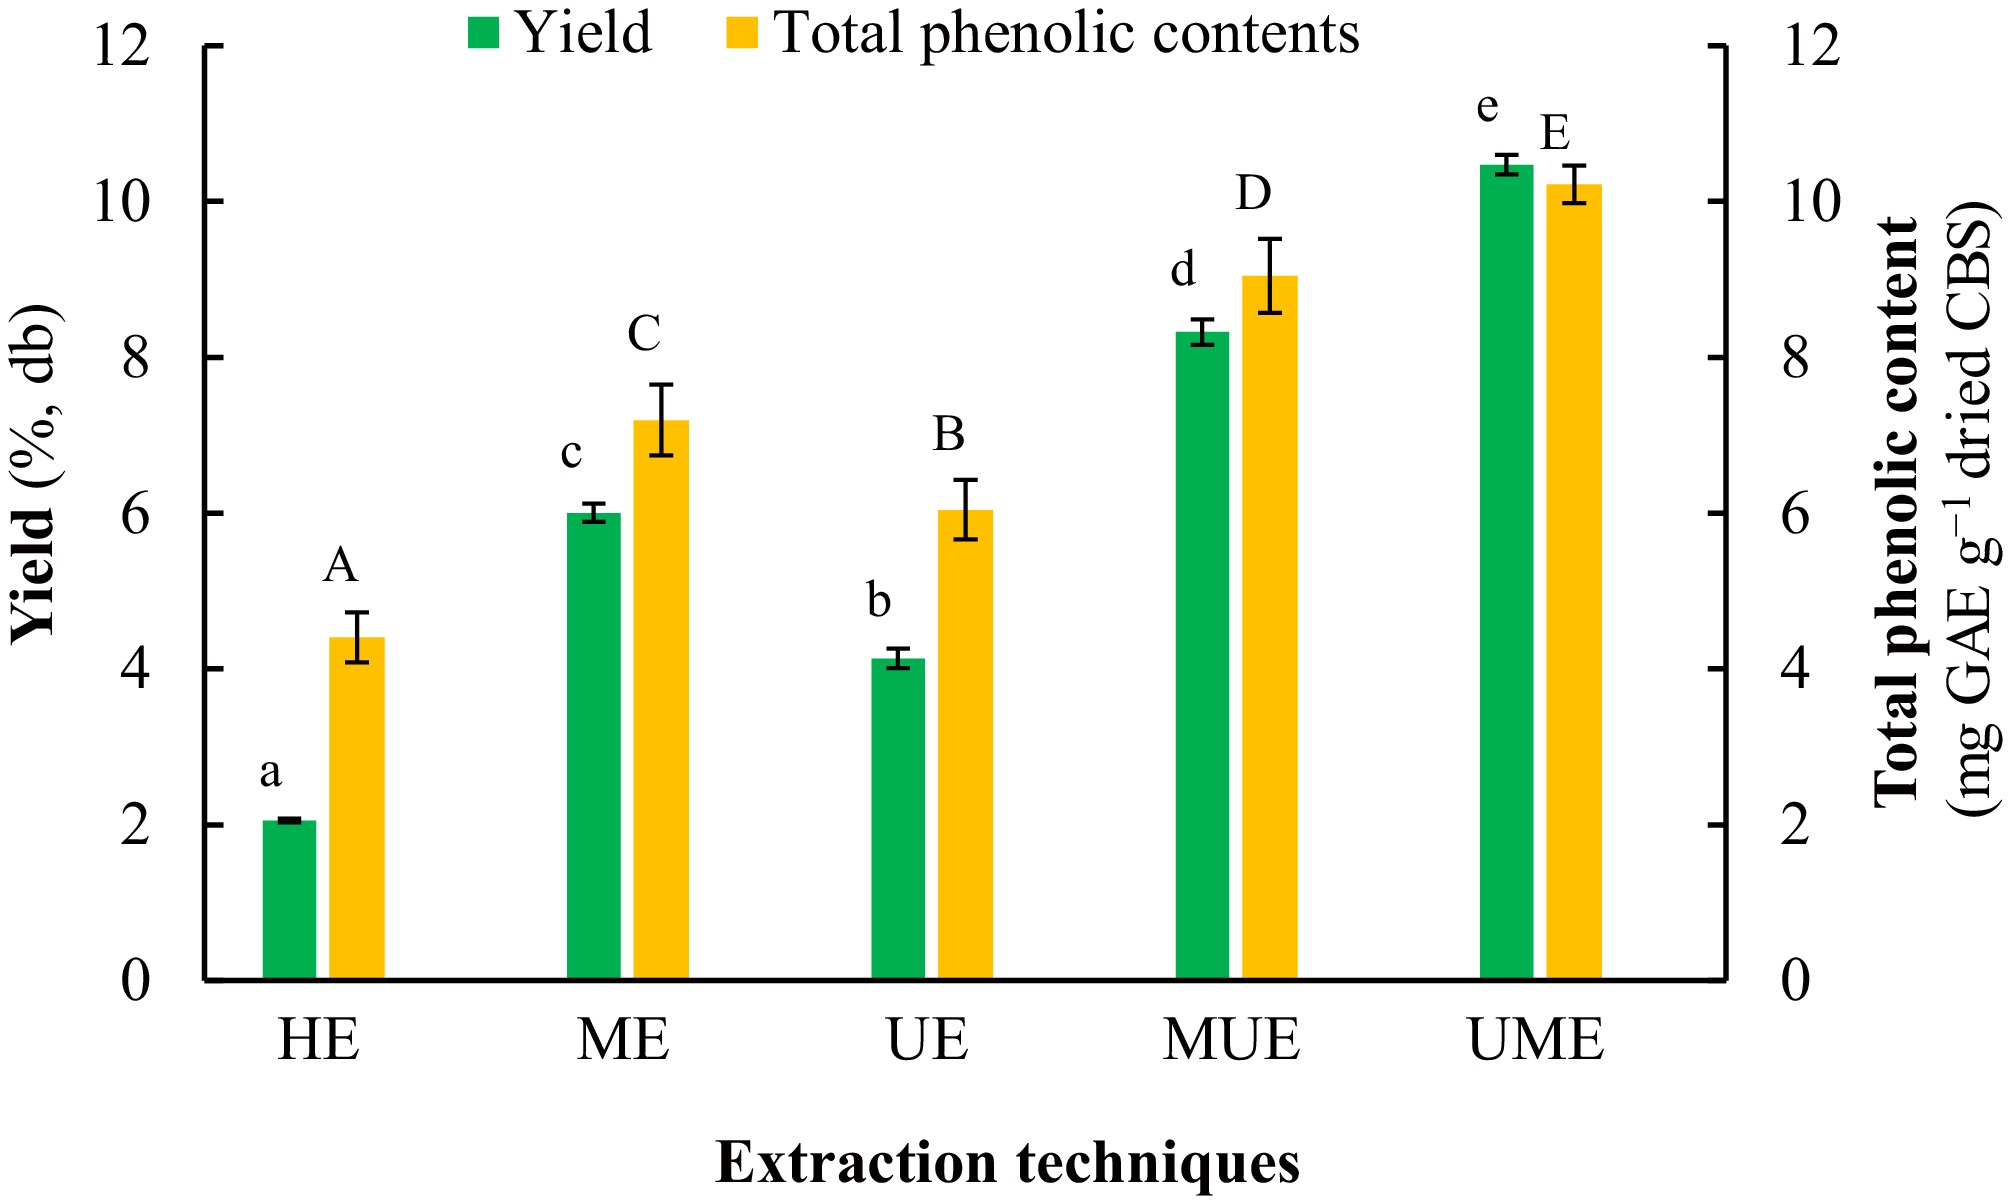
Figure 1.
Comparison of yield and total phenolic content of the extracts from cocoa bean shells using different extraction techniques using water as a solvent. CBS, cocoa bean shells; db, dry basis; GAE, gallic acid equivalent; HE, heating-aided extraction; ME, microwave-aided extraction; MUE, ordered microwave-ultrasound-aided extraction; UE, ultrasound-aided extraction; UME, ordered ultrasound-microwave-aided extraction. Data followed by the same lowercase letter (for yield) or uppercase letter (for total phenolic content) are not significantly different (p > 0.05).
-
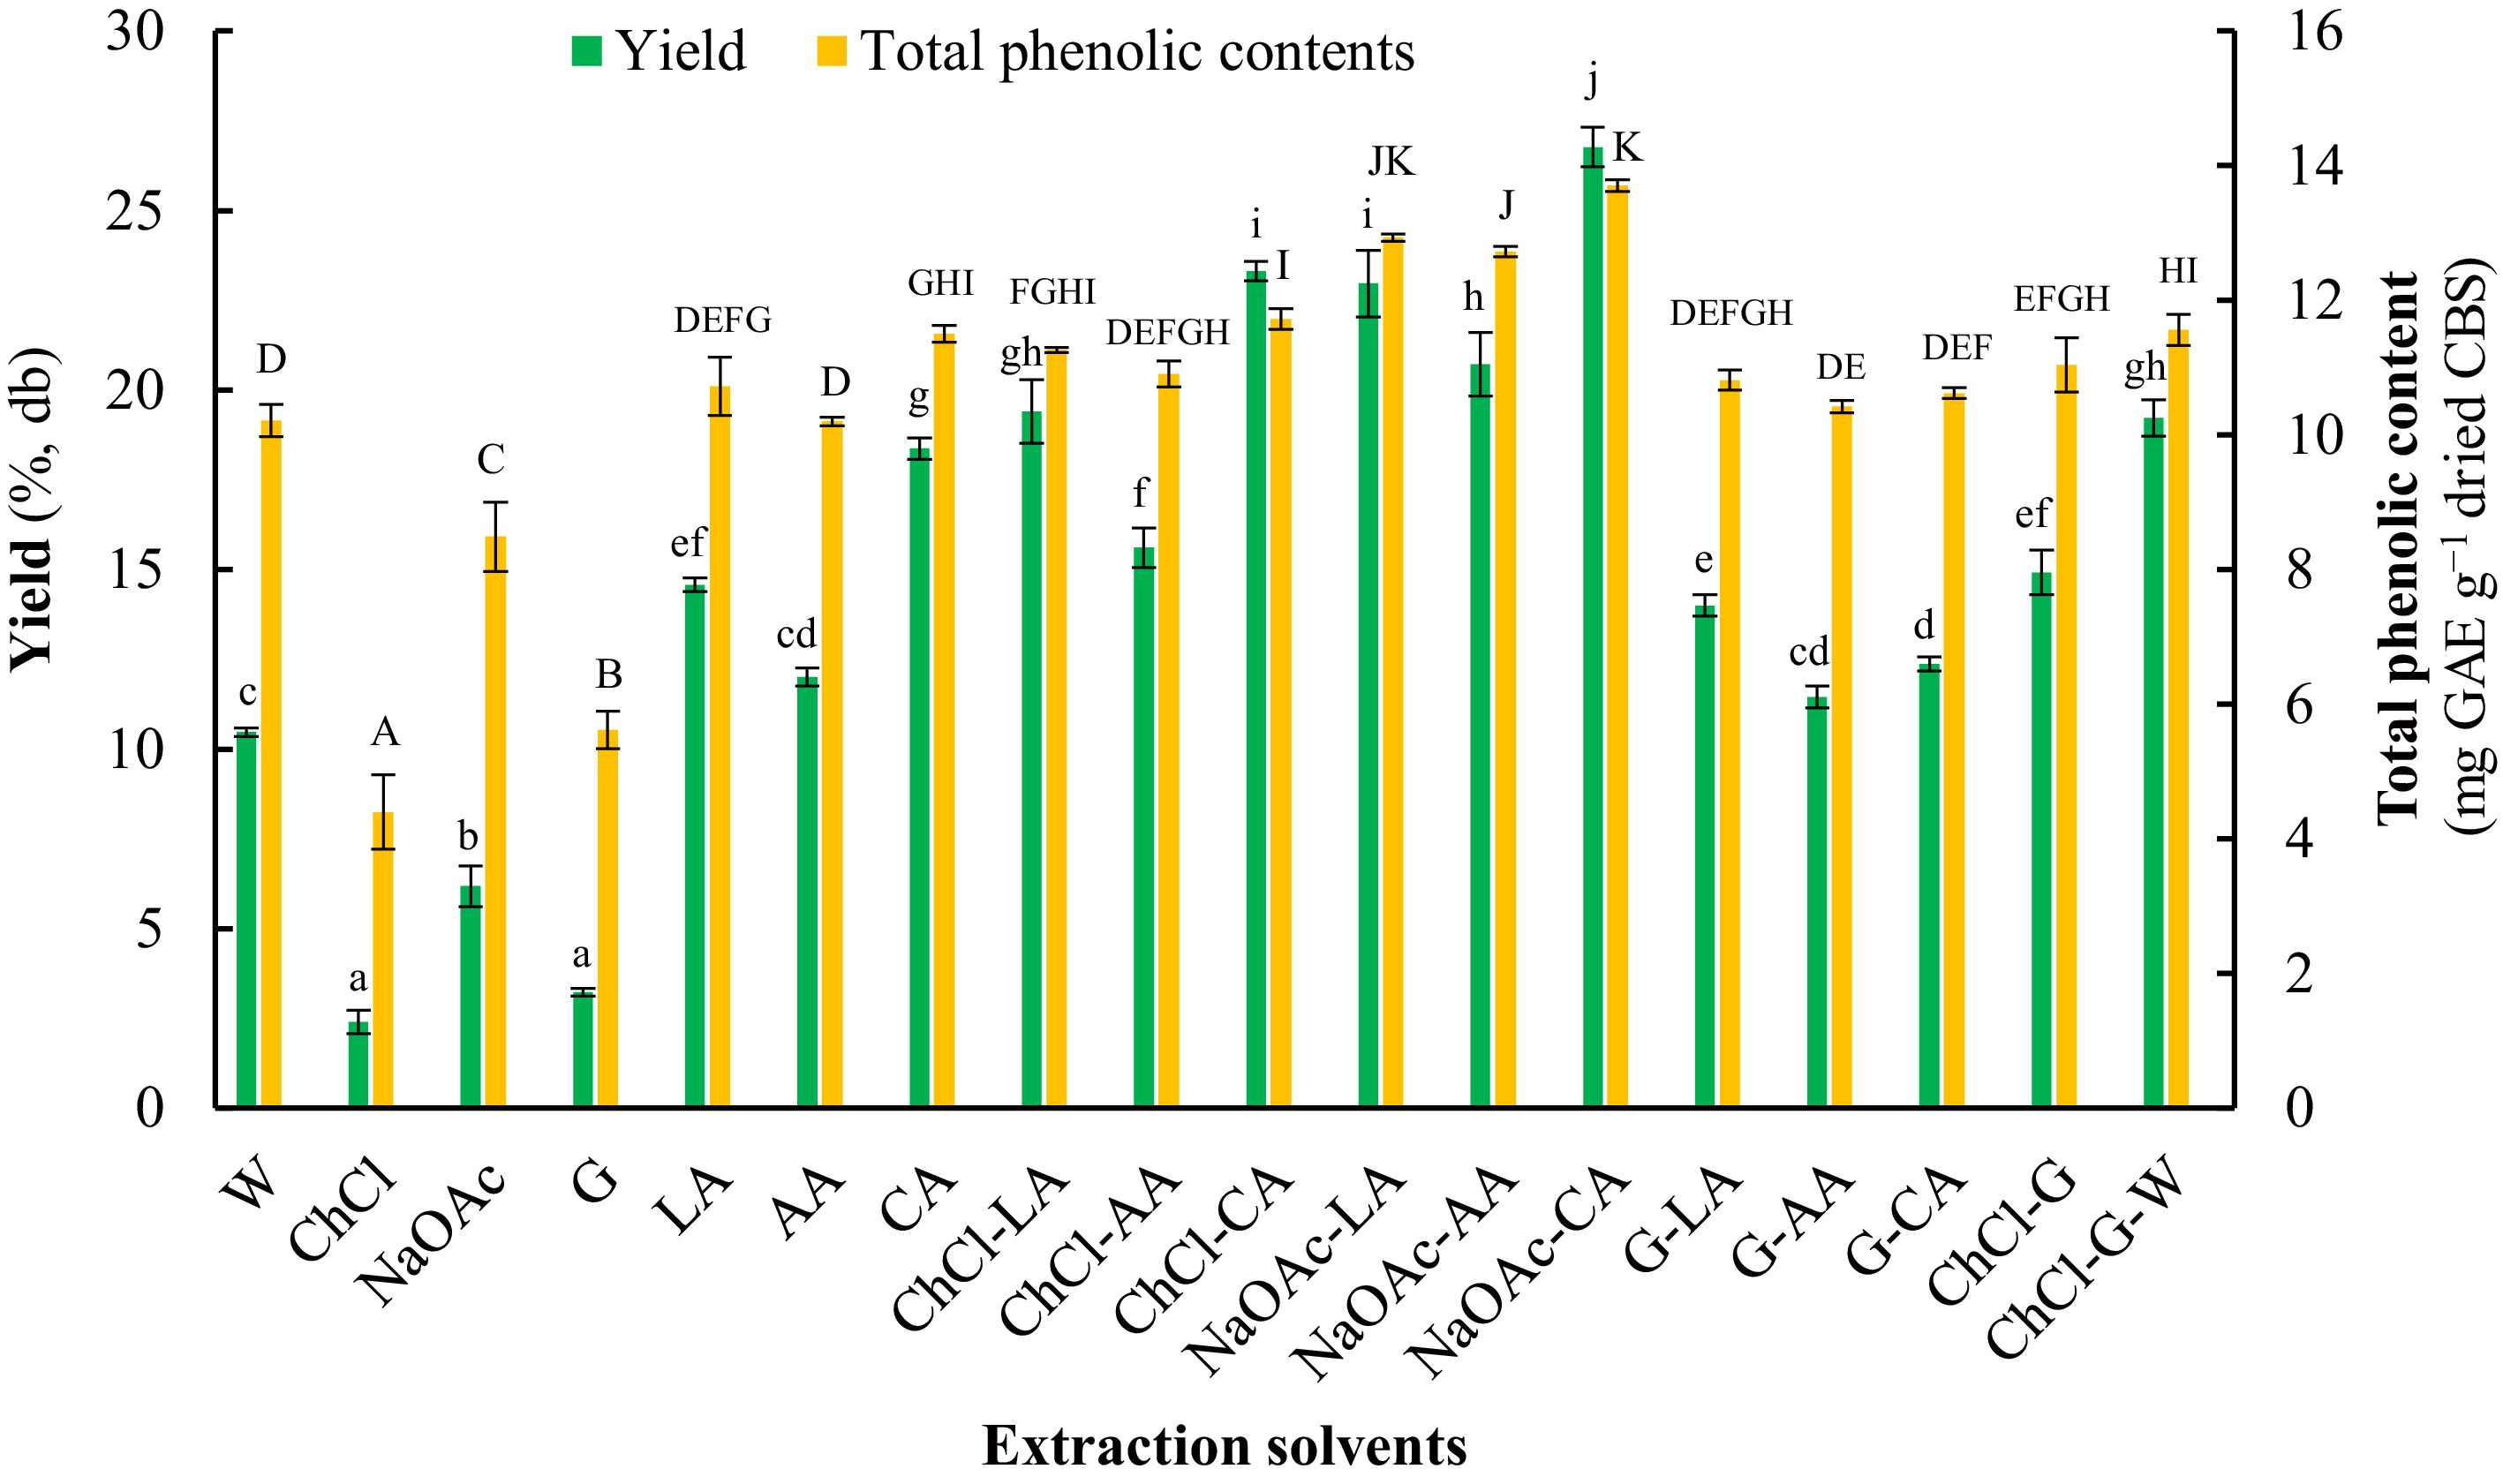
Figure 2.
Comparison of yield and total phenolic content of the extracts from cocoa bean shells using different extraction solvents using UME as an extraction technique. AA, acetic acid (0.3 mL in 100 mL water); CA, citric acid (1 g in 40 mL water); CBS, cocoa bean shell; ChCl, choline chloride solution (1 g in 40 mL water); ChCl–AA, the mixture of ChCl and AA (ratio of 1:2, v/v); ChCl-CA, the mixture of ChCl and CA (ratio of 2:1, v/v); ChCl–G, the mixture of ChCl and G (ratio of 5:2, v/v); ChCl–G–W, the mixture of ChCl, G, and water (ratio of 5:2:5, v/v/v); ChCl-LA, the mixture of ChCl and LA (ratio of 1:3, v/v); db, dry basis; G, glucose solution (1 g/40 mL water); G–AA, the mixture of G, AA, and water (ratio of 1:5:3, v/v/v); GAE, gallic acid equivalent; G–CA, the mixture of G, CA, and water (ratio of 1:5:3, v/v/v); G–LA, the mixture of G, LA, and water (ratio of 1:5:3, v/v/v); LA, lactic acid (1 mL in 40 mL water); NaOAc–AA, the mixture of NaOAc, AA, and water (ratio of 1:3:4, v/v/v); NaOAc–CA, the mixture of NaOAc, CA, and water (ratio of 1:3:4, v/v/v); NaOAc, sodium acetate solution (1 g in 40 mL water); NaOAc–LA, the mixture of NaOAc, LA, and water (ratio of 1:3:4, v/v/v); UME, ordered ultrasound-microwave-aided extraction; W, water. Data followed by the same lowercase letter (for yield) or uppercase letter (for total phenolic content) are not significantly different (p > 0.05).
-
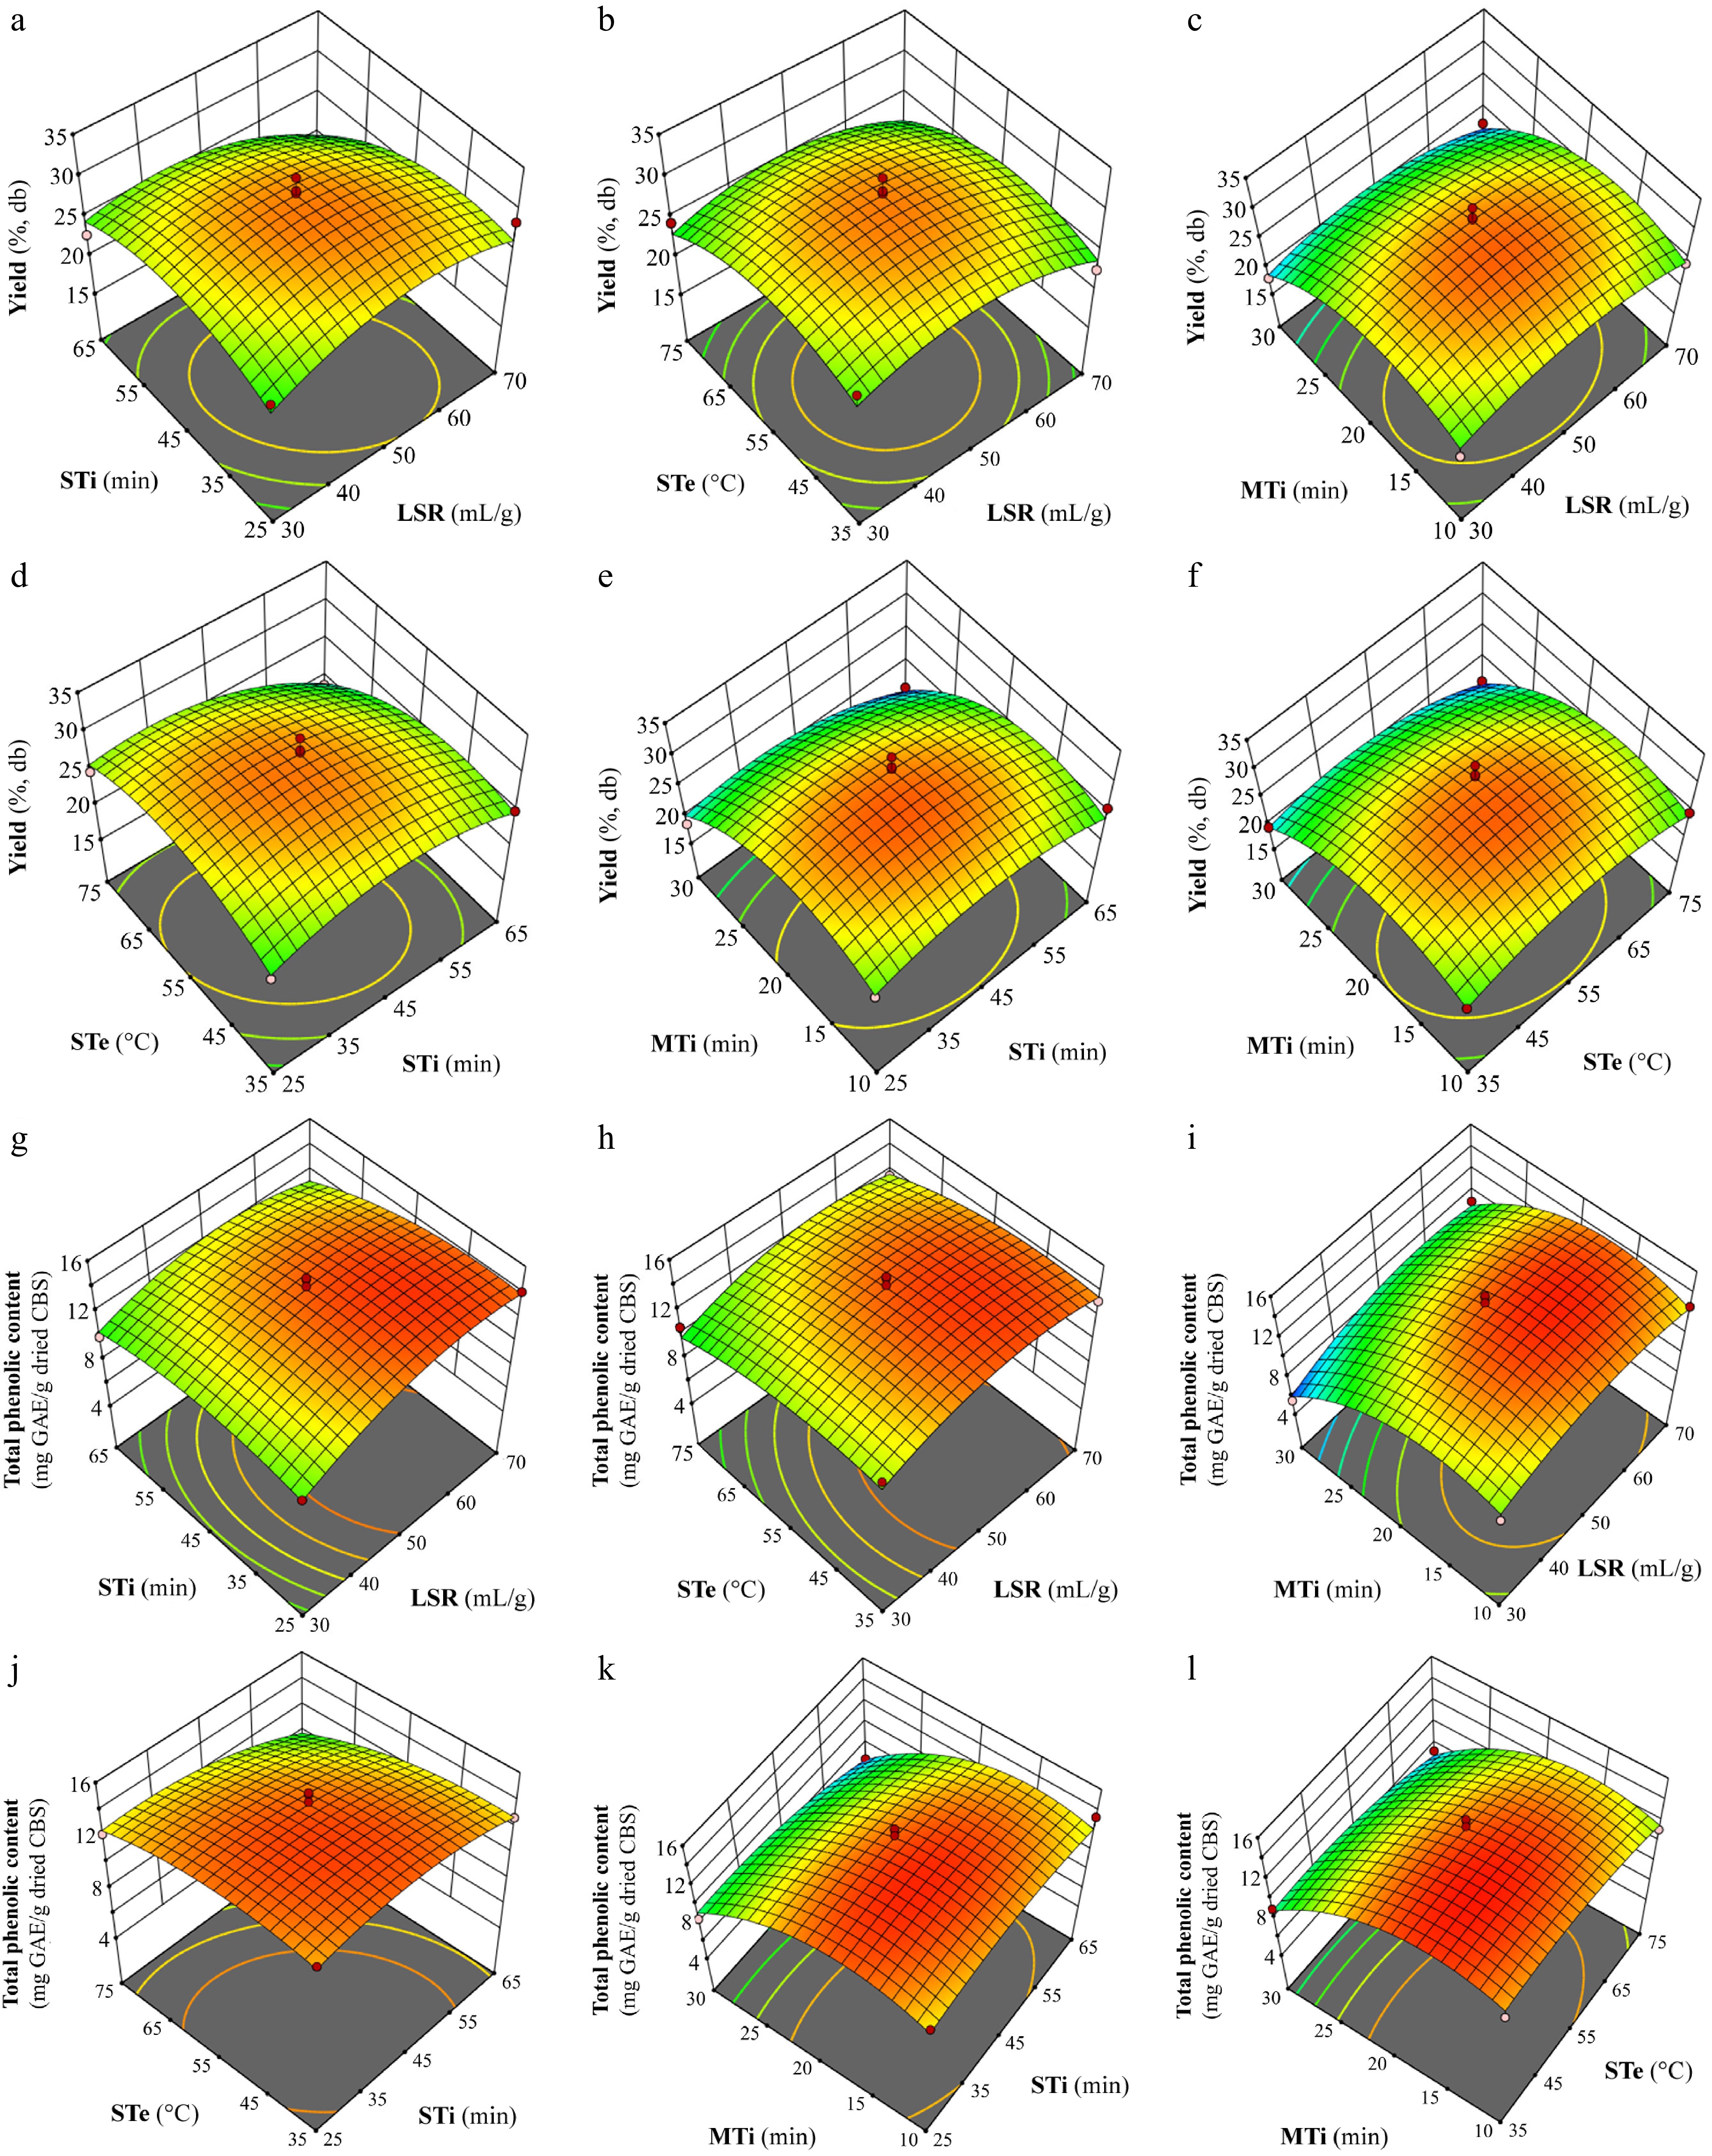
Figure 3.
Response surface plots showing the effects of process variables on extracting yield (a)−(f) and total phenolic content (g)−(l): (a) and (g) effects of LSR and STi at constant STe (55 °C) and MTi (20 min); (b) and (h) effects of LSR and STe at constant STi (45 min) and MTi (20 min); (c) and (i) effects of LSR and MTi at constant STi (45 min) and STe (55 °C); (d) and (j) effects of STi and STe at constant LSR (50 mL g−1) and MTi (20 min); (e) and (k) effects of STi and MTi at constant LSR (50 mL g−1) and STe (55 °C); (f) and (l) effects of STe and MTi at constant LSR (50 mL g−1) and STi (45 min). Abbreviations: LSR, liquid-solid ratio (mL g−1); STi, sonication time (min); STe, sonication temperature (°C); MTi, microwave time (min).
-
Independent variables Abbreviation Symbol Levels −1 0 1 Liquid-solid ratio (mL g−1) LSR X1 30 50 70 Sonication time (min) STi X2 25 45 65 Sonication temperature (°C) STe X3 35 55 75 Microwave time (min) MTi X4 10 20 30 Dependent variables Yield (%, dry basis) Y1 Total phenolic content (mg gallic
acid equivalent g−1 dried cocoa
bean shells)Y2 Table 1.
Independent and dependent variables in the Box–Behnken design for extracting phenolic compounds from cocoa bean shells.
-
# Independent variables Dependent variables Coded Actual Yield
(%, db)Total phenolic content
(mg GAE g−1 dried CBS)X1 X2 X3 X4 X1 X2 X3 X4 Observed2 Estimated Observed2 Estimated 1 0 0 0 0 50 45 55 20 28.5 ± 0.2 29.8 14.3 ± 0.4 14.1 2 1 1 0 0 70 65 55 20 19.0 ± 0.4 19.6 10.9 ± 0.4 11.2 3 1 0 0 1 70 45 55 30 17.4 ± 0.5 16.4 9.09 ± 0.10 8.67 4 0 0 0 0 50 45 55 20 30.3 ± 0.1 29.8 14.8 ± 0.6 14.1 5 0 0 −1 −1 50 45 35 10 24.4 ± 1.4 24.3 12.7 ± 0.4 13.3 6 −1 1 0 0 30 65 55 20 22.8 ± 0.8 24.5 10.0 ± 0.6 10.4 7 0 1 0 1 50 65 55 30 15.7 ± 0.2 15.1 6.48 ± 0.09 6.41 8 0 −1 0 1 50 25 55 30 18.5 ± 0.1 20.0 8.50 ± 0.69 9.16 9 1 0 0 −1 70 45 55 10 24.2 ± 0.3 24.4 12.8 ± 0.5 12.6 10 0 −1 1 0 50 25 75 20 24.7 ± 0.4 25.7 12.3 ± 0.4 12.5 11 1 0 −1 0 70 45 35 20 22.7 ± 0.4 23.9 13.2 ± 0.2 13.5 12 0 1 1 0 50 65 75 20 18.8 ± 0.2 19.0 9.40 ± 0.35 9.90 13 0 −1 0 −1 50 25 55 10 24.7 ± 0.6 25.0 13.1 ± 0.8 12.6 14 1 0 1 0 70 45 75 20 20.4 ± 0.5 21.6 11.6 ± 0.4 11.7 15 −1 0 −1 0 30 45 35 20 26.2 ± 0.9 24.8 12.2 ± 0.6 11.6 16 0 1 −1 0 50 65 35 20 25.0 ± 0.4 24.8 12.8 ± 0.6 12.8 17 0 0 −1 1 50 45 35 30 19.4 ± 0.2 19.3 9.02 ± 0.49 8.83 18 0 1 0 −1 50 65 55 10 25.8 ± 0.6 24.1 13.4 ± 0.2 12.2 19 −1 0 1 0 30 45 75 20 24.4 ± 0.1 23.0 10.7 ± 0.2 9.80 20 0 0 1 −1 50 45 75 10 24.7 ± 0.3 24.3 11.2 ± 0.3 11.7 21 0 0 1 1 50 45 75 30 15.7 ± 0.4 15.3 7.33 ± 0.20 6.89 22 −1 −1 0 0 30 25 55 20 24.8 ± 0.6 23.7 11.0 ± 0.6 10.8 23 −1 0 0 −1 30 45 55 10 22.9 ± 0.9 24.6 10.7 ± 0.1 11.4 24 −1 0 0 1 30 45 55 30 18.0 ± 0.4 18.5 5.52 ± 0.21 5.99 25 0 −1 −1 0 50 25 35 20 23.5 ± 1.1 24.0 13.5 ± 0.2 13.3 26 1 −1 0 0 70 25 55 20 28.6 ± 0.3 26.3 14.1 ± 0.3 13.9 27 0 0 0 0 50 45 55 20 31.9 ± 0.5 29.8 14.9 ± 0.3 14.1 28 0 0 0 0 50 45 55 20 30.1 ± 0.6 29.8 13.0 ± 0.5 14.1 29 0 0 0 0 50 45 55 20 28.3 ± 0.9 29.8 13.4 ± 0.6 14.1 1 X1, liquid-solid ratio (mL g−1); X2, sonication time (min); X3, sonication temperature (°C); X4, microwave time (min); CBS, cocoa bean shells. 2 Mean of triplicate determination. Table 2.
Design matrix and result of Box–Behnken design for extracting phenolic compounds from cocoa bean shells1.
-
Source Yield Total phenolic content Sum of squares df Mean square F-value p-value Sum of squares df Mean square F-value p-value Model 505 14 36.1 14.0 < 0.0001 160 14 11.4 18.4 < 0.0001 X1 3.93 1 3.93 1.52 0.238 11.3 1 11.3 18.1 0.0008 X2 25.8 1 25.8 10.0 0.007 7.38 1 7.38 11.9 0.004 X3 12.5 1 12.5 4.86 0.045 9.80 1 9.80 15.8 0.001 X4 147 1 147 57.1 < 0.0001 64.5 1 64.5 103.7 < 0.0001 X1X2 14.1 1 14.1 5.45 0.035 1.27 1 1.27 2.04 0.175 X1X3 0.066 1 0.066 0.026 0.875 0.0004 1 0.0004 0.0006 0.981 X1X4 0.900 1 0.900 0.349 0.564 0.549 1 0.549 0.883 0.363 X2X3 13.8 1 13.8 5.35 0.036 1.12 1 1.12 1.81 0.200 X2X4 3.97 1 3.97 1.54 0.235 1.40 1 1.40 2.25 0.156 X3X4 3.93 1 3.93 1.52 0.238 0.019 1 0.019 0.031 0.863 X12 64.9 1 64.9 25.2 0.0002 13.9 1 13.9 22.4 0.0003 X22 62.7 1 62.7 24.3 0.0002 6.59 1 6.59 10.6 0.006 X32 73.0 1 73.0 28.3 0.0001 5.65 1 5.65 9.08 0.009 X42 208 1 208 80.9 < 0.0001 56.4 1 56.4 90.7 < 0.0001 Residual 36.1 14 2.58 8.70 14 0.622 Lack-of-Fit 27.6 10 2.76 1.29 0.435 5.75 10 0.575 0.778 0.661 Pure Error 8.56 4 2.14 2.96 4 0.739 Cor Total 541 28 168 28 R² 0.933 0.948 Adjusted R² 0.867 0.897 1 X1, liquid-solid ratio (mL g−1); X2, sonication time (min); X3, sonication temperature (°C); X4, microwave time (min). Table 3.
Analysis of variance for regression model of extracting bioactive compounds from cocoa bean shells1.
-
HE UME-S UME-W Yield 6.36 ± 0.11a 31.7 ± 1.8c 19.9 ±1.2b TPC 4.52 ± 0.26a 14.7 ± 0.3c 10.7 ±0.6b TFC 4.14 ± 0.20a 9.90 ± 0.44c 7.73 ± 0.27b DPPH 14.3 ± 1.0a 23.4 ± 1.2c 18.8 ± 0.8b ABTS 19.8 ± 1.7a 31.7 ± 2.1c 26.2 ± 1.3b Caffeic acid3 0.090 ± 0.009a 0.197 ± 0.043b 0.184 ± 0.016b Hydroxybenzoic acid3 7.73 ± 0.80a 8.59 ± 0.40a 7.81 ± 0.57a Protocatechuic acid3 1.96 ± 0.02a 4.05 ± 0.25c 3.28 ± 0.07b Catechin3 3.12 ± 0.62a 4.61 ± 0.24b 4.32 ± 0.37b Inhibition zone against S. aureus4 1.22 ± 0.03a 1.85 ± 0.05b 1.30 ± 0.05a Inhibition zone against E. coli nd nd nd 1 HE, heating-aided extraction; UME-S, ordered ultrasound-microwave-aided extraction under optimized conditions using the mixture of sodium acetate, citric acid, and water (ratio of 1:3:4, v/v/v) as extraction solvent; UME-W, ordered ultrasound-microwave-aided extraction under optimized conditions using water as extraction solvent. 2 ABTS, ABTS radical scavenging assay (mg Trolox equivalent g−1 dried CBS); DPPH, DPPH radical scavenging assay (mg Trolox equivalent g−1 dried CBS); TFC, total flavonoid content (mg rutin equivalent g−1 dried CBS); TPC, total phenolic content (mg gallic acid equivalent g−1 dried CBS); Yield, yield (%, dry basis). 3 The unit of these compounds is µg component g−1 dried CBS. 4 The unit of inhibition zone is cm; the inhibition zone of the positive control (30 g C6H7KO2 in 50 mL water) against S. aureus is 1.28 ± 0.03 cm. 5 Data followed by the same superscript in the same row are not significantly different (p > 0.05). Table 4.
Yield, total phenolic content, total flavonoid content, antioxidant activity, chemical components qualified by UPLC–MS/MS, and inhibition zone of phenolic extract from cocoa bean shells1,2,5.
-
# Name of putative compounds MW (g mol−1) MF HE UME-S UME-W RT (min) PA (%) RT (min) PA (%) RT (min) PA (%) 1 2,2-dimethoxybutane 118 C6H14O2 3.70 80.8 3.69 30.9 3.70 13.0 2 Undecane 156 C11H24 15.0 19.2 15.0 5.06 15.0 1.45 3 2H-cyclohepta[b]furan-2-one, 6-[1-(acetyloxy)-3-oxobutyl]-3,
3a,4,7,8,8a-hexahydro-7-methyl-3-methylene-306 C17H22O5 nd 30.8 0.700 nd 4 Cyclo(L-prolyl-L-valine) 196 C10H16N2O2 nd 33.2 1.54 33.2 1.15 5 Caffeine 194 C8H10N4O2 nd 33.8 61.8 33.8 84.4 1 HE, heating-aided extraction; UME-S, ordered ultrasound-microwave-aided extraction under optimized conditions using the mixture of sodium acetate, citric acid, and water (ratio of 1:3:4, v/v/v) as extraction solvent; UME-W, ordered ultrasound-microwave-aided extraction under optimized conditions using water as extraction solvent. 2 MW, molecular weight; MF, molecular formula; nd, not detected; RT, retention time; PA, peak area. Table 5.
Components detected in phenolic extracts from cocoa bean shells by GC–MS/MS1,2.
Figures
(3)
Tables
(5)