












-
Cocoa beans from Theobroma cacao L. have attained commercial dominance in international trade, renowned for their delectable flavor and widespread consumer appeal. With the increasing global demand for cocoa and chocolate products, cocoa production has continued to expand, generating large amounts of cocoa processing residues. Previous reports indicated that cocoa production in 2021−2022 was estimated at 4.82 million tons, and the commercial volume of chocolate confectionery products worldwide advanced by 1%, from 7.54 to 7.61 million tons in 2023[1]. Beyond the primary role in chocolate manufacturing, cocoa fruit can be processed into cocoa butter, cocoa powder, soft drinks, alcoholic beverages, and jams. Despite these economic prominences, only a small fraction of the fruit is utilized for cocoa powder production, representing roughly one-tenth of its total weight. The vast majority of the biomass, including the external pod and mucilaginous pulp during on-farm processing, and cocoa bean shells (CBS) generated during roasting, is frequently treated as waste[2,3]. CBS, which typically accounts for approximately 10%–17% of the bean mass[4], has traditionally been contemplated as a low-value byproduct, frequently discarded or utilized as animal feed. More recently, CBS has gained considerable interest as a promising resource for applications in the food, cosmetic, pharmaceutical, and biofuel industries. This growing interest reflects the broader adoption of circular economy principles aimed at promoting the sustainable utilization of cocoa processing byproducts[5]. In this context, green extraction technologies offer an effective strategy for CBS valorization by enabling the recovery of valuable phenolic compounds with reduced solvent consumption, lower energy demand, and minimized environmental impact compared with conventional extraction methods.
CBS is not only valued for its macronutrient composition, comprising approximately 20.9% protein, along with 55.1% dietary fiber, as well as 7.85% carbohydrates and 2.30% fat on a dry weight basis, but also acknowledged as an abundant source of bioactive compounds[2,6]. Among these, methylxanthines and polyphenols are particularly important due to their antioxidant and antimicrobial activities, which support the potential application of CBS in functional food development[7]. Regarding phytochemical composition, theobromine is considered the predominant methylxanthine found in CBS across various cocoa genotypes, while catechin and epicatechin are the major polyphenols[8]. Catechin and epicatechin, as major flavan-3-ols, are recognized for their free radical scavenging capacity and their ability to reduce oxidative stress, while also contributing to antimicrobial effects against certain microorganisms[9]. Additionally, CBS from different regions of Venezuela contained total flavonoid content (TFC) ranging from 1.89 to 3.65 mg catechin equivalent g−1 and total phenolic content (TPC) falling within 5.87−9.12 mg gallic acid equivalent (GAE) g−1[10]. Furthermore, the efficiency of recovering bioactive compounds from CBS largely depends on the extraction method employed, further impacting its potential applications.
Conventional solvent extraction is commonly applied to obtain phenolic compounds from CBS. Previous studies have shown that solvent selection strongly influences extraction efficiency due to differences in solvent polarity and the solubility of phenolic compounds. Acetone was reported to provide the highest total phenolic content (41.8 mg GAE g−1), while methanol and ethanol resulted in moderate yields (25.1 and 23.3 mg GAE g−1, respectively), and water showed the lowest extraction efficiency (17.2 mg GAE g−1)[11]. This suggests that solvents with intermediate polarity are generally more effective for recovering phenolic compounds from CBS than highly polar solvents such as water alone. Similarly, acidified methanol and ethanol–acetone mixtures improved phenolic recovery, yielding approximately 11 and 13 mg GAE g−1, respectively[8], indicating that solvent modification can further enhance extraction performance by improving compound solubility and matrix disruption. These findings highlight the importance of optimizing both solvent composition and extraction conditions and support the use of alternative green solvent systems to achieve efficient phenolic recovery while reducing environmental impact. Despite its simplicity and affordability, this traditional technique has limitations, as prolonged extraction times and overheating temperatures may lead to the degradation of bioactive compounds[12]. The application of organic solvents or their aqueous mixtures also raised safety concerns due to their toxicity, flammability, and environmental impact[13], restricting their application in food production. Consequently, sustainable extraction strategies have attracted increasing attention, including natural deep eutectic solvents and eco-friendly extraction techniques.
Natural deep eutectic solvents (NADES) offer several superiorities for deriving bioactive constituents from botanical byproducts, including stability at ambient temperatures, water compatibility, low toxicity, and cost-saving measures[14]. Compared with ionic liquids, NADES are generally considered more biodegradable and less toxic, making them more suitable for food and nutraceutical applications[15]. In contrast to aqueous extraction systems, NADES can provide stronger hydrogen-bond interactions and improved solubility for phenolic compounds, resulting in higher extraction efficiency[16]. These characteristics make NADES a promising green alternative for the sustainable recovery of valuable phytochemicals from agro-industrial residues. Previous studies have also demonstrated that NADES show superior performance over traditional solvents in recovering bioactive compounds from olive pomace under comparable conditions[17]. In addition to solvent selection, extraction efficiency can be enhanced through sonication and/or irradiation conjunction. Ultrasound-aided extraction (UE) is preferably exploited owing to its simplicity, affordability, and improved extraction efficiency[18]. Its mechanism is mainly related to acoustic cavitation generated by alternating compression and expansion cycles of ultrasonic waves. The collapse of cavitation bubbles near plant cell walls causes cell disruption, enhances solvent penetration, and improves mass transfer between the solvent and plant matrix, thereby increasing the release of phenolic compounds[19]. However, prolonged sonication or excessive ultrasonic intensity may cause the degradation of sensitive bioactive compounds[20]. Microwave-aided extraction (ME), on the other hand, offers advantages such as reduced processing time, lower solvent usage, and improved energy utilization[18]. Microwave irradiation causes rapid internal heating through electromagnetic interactions with polar molecules, leading to cell structure disruption, improved solvent infiltration, and faster dissolution of target compounds, which enhance extraction efficiency[21]. However, excessive microwave exposure or high temperatures may also degrade heat-sensitive compounds, requiring careful optimization of extraction conditions. A preceding study on combining irradiation with sonication statistically boosted TPC from walnut flour[22]. Thus, the hybridization of these approaches could be a viable strategy for deriving a phenolic compound. However, research on optimizing coupled UE and ME using a green aqueous extraction system for recovering bioactive compounds from CBS remains limited. This project aimed to evaluate different extraction techniques and solvent systems for CBS and to refine process conditions employing Box–Behnken Design (BBD). The variables examined comprised solvent loading, duration and temperature of sonication, as well as microwave exposure time. Additionally, the antioxidant and antibacterial properties of the extracted compounds are assessed.
-
Kimmy's Chocolate Ltd. (Long Dinh Commune, Dong Thap Province, Vietnam) provided cocoa bean shells derived from Theobroma cacao L. These byproducts were dehydrated at 50 °C for 24 h using a SOF-W155 ventilated oven (DaiHan Scientific, Seoul, Korea) to reduce moisture content while minimizing thermal degradation of heat-sensitive phenolic compounds. Following drying, CBS underwent grinding and sieving (0.50 mm), resulting in particles smaller than 0.50 mm, after which it was preserved at −20 °C in sealed containers until further analysis. All chemicals were of analytical grade and were purchased from Sigma-Aldrich (St. Louis, MO, USA). UPLC-grade solvents used for chromatographic analysis were obtained from the same supplier.
Recovery of phenolic constituents from CBS
-
An eco-friendly procedure based on the method of Rebollo-Hernanz et al.[23], with modifications described below, was applied to obtain phenolic constituents from CBS. The combination of dried CBS and different green solvents in the ratio of 1:50 (g mL−1) was exposed to various extraction techniques. Following centrifugation at 4,000 × g for 15 min at 4 °C, the recovered liquid phase was collected and subsequently freeze-dried at −50 °C under a pressure of 0.1 mbar for 72 h using a laboratory freeze dryer until constant weight was achieved. The freeze-dried powder was weighed to estimate the recovery yield of phenolic compounds (% dry basis) before being liquefied by distilled water. Thereafter, the aqueous resultant was utilized to determine total phenolic content (TPC) or was kept at −20 °C prior to analysis.
Screening of extraction techniques for phenolic recovery from CBS
-
Five aided approaches were evaluated to designate an appropriate one for optimization, comprising heating-aided extraction (HE), microwave-aided extraction (ME), ultrasound-aided extraction (UE), ordered microwave-ultrasound-aided extraction (MUE), and ordered ultrasound-microwave-aided extraction (UME). All extraction methods were performed using the same liquid-to-solid ratio of 50 mL g−1 and the same solvent system of distilled water. HE was conducted using a shaking water bath (WSB-45, Witeg, Germany) at 90 °C for 90 min at 100 rpm[23]. ME was performed using a microwave oven (R-21A1SVN, Sharp, Japan) at 240 W for 20 min under continuous irradiation at 2,450 MHz[24]. UE was carried out using an ultrasonic bath (WUC-A22H, Daihan Scientific, Seoul, Korea) operating at 40 kHz with a peak output power of 379 W at 55 °C for 45 min[25]. For MUE, microwave treatment was applied first, followed by ultrasound treatment under the same respective conditions. In contrast, UME was performed by applying ultrasound treatment prior to microwave irradiation using the same operational parameters. The method which recovered the highest yield and TPC were opted for follow-up assessments.
Screening of solvent systems for phenolic recovery from CBS
-
The aided technique chosen from experiment "Screening of extraction techniques" of was employed to appraise 17 solvents for their capacities in deriving bioactive constituents from the CBS. Choline chloride (ChCl), sodium acetate (NaOAc), and glucose (G) were selected as hydrogen bond acceptors, while lactic acid (LA), acetic acid (AA), and citric acid (CA) functioned as hydrogen bond donors. AA and LA were prepared at concentrations of 0.3% and 2.5% (v/v), respectively, while the remaining components were dissolved in water at 2.5% (w/v)[26−28]. Natural deep eutectic solvents were formulated from complementary components capable of intermolecular interactions with or without the existence of water at certain ratios. These solvents were the ChCl-based solution added with different components such as AA (ChCl–AA; 1:2, v/v), CA (ChCl–CA; 2:1, v/v), LA (ChCl–LA; 1:3, v/v), G (ChCl–G; 5:2, v/v), and G with water (ChCl–G–W; 5:2:5, v/v/v)[26,28,29]; the G-based solution added with similar chemicals like AA with water (G–AA; 1:5:3, v/v/v), CA with water (G–CA; 1:5:3, v/v/v), and LA with water (G–LA; 1:5:3, v/v/v)[29]; and the NaOAc-based solutions added with comparable reagents including AA with water (NaOAc–AA; 1:3:4, v/v/v), CA with water (NaOAc–CA; 1:3:4, v/v/v), and LA with water (NaOAc–LA; 1:3:4, v/v/v)[30]. After being incorporated into a homogeneous liquid, the prepared solvent systems were mixed with water (1:3, v/v) and subsequently used for recovering phenolic constituents from CBS[28]. The solvent that recovered the highest yield and TPC was selected for further optimization.
Determination of optimized conditions for phenolic recovery from CBS
-
An optimized condition for obtaining the maximized yield and TPC was identified using a Box–Behnken design (29 experiments, 5 central points). The dependent variables were yield (Y1) and TPC (Y2), while the independent variables were liquid-solid ratio (X1), sonication time (X2), sonication temperature (X3), and microwave time (X4). The levels of each variable, expressed in both actual and coded forms, are listed in Table 1. These 29 runs were designated by v11 of Design Expert software (Stat-Ease, MN, USA) and carried out randomly to minimize the potential systematic inaccuracy. The experimental data were fitted to a quadratic regression equation commonly used in response surface methodology[31]. The adequacy of the developed models was evaluated using analysis of variance, including the coefficient of determination (R2), adjusted R2, predicted R2, and lack-of-fit test. A non-significant lack of fit (p > 0.05) together with high R2 values indicated that the models were suitable for predicting extraction yield and TPC within the studied range. The relationships between the independent variables and the responses were evaluated using a second-order polynomial regression model, as presented in Eq. 1:
Table 1. Independent and dependent variables in the Box–Behnken design for extracting phenolic compounds from cocoa bean shells.
Independent variables Abbreviation Symbol Levels −1 0 1 Liquid-solid ratio (mL g−1) LSR X1 30 50 70 Sonication time (min) STi X2 25 45 65 Sonication temperature (°C) STe X3 35 55 75 Microwave time (min) MTi X4 10 20 30 Dependent variables Yield (%, dry basis) Y1 Total phenolic content (mg gallic
acid equivalent g−1 dried cocoa
bean shells)Y2 $ Y={\beta }_{0}+\sum\limits_{i=1}^{k}{\beta }_{i}{X}_{i}+\sum\limits_{i=1}^{k}{\beta }_{ii}X_{i}^{2}+{\sum}_{i}\sum\limits_{j\neq i}^{k}{\beta }_{ij}{X}_{i}{X}_{j} $ (1) where, Y represents the predicted response, k is the factor number, Xi and Xj are the factors, and β0, βi, βii, and βij are the intercept, linear, quadratic, and interaction regression coefficients, respectively.
Characterization of phenolic constituents derived from CBS
Determination of bioactive properties of extracts derived from CBS
-
The extraction yield of phenolic constituents was calculated as the ratio of freeze-dried extract obtained to the starting amount of dried CBS, according to Eq. 2:
$ \text{Extraction yield} \;(\text{%})=\dfrac{\text{Weight of freeze-dried extract (g)}}{\text{Weight of dried CBS used for extraction (g)}}\times 100 $ (2) Quantification of phenolic amount (TPC), flavonoid level (TFC), and antioxidant capacity (using DPPH and ABTS assays) in the extract was conducted according to the techniques described by Tien et al.[31]. Results were expressed as mg gallic acid equivalents g−1 dried sample (mg GAE g−1 CBS), mg rutin equivalents g−1 dried sample (mg RE g−1 CBS), and mg Trolox equivalents g−1 dried sample (mg TE g−1 CBS), respectively.
Antibacterial activity of phenolic extracts derived from CBS
-
The antimicrobial potential of the extract was investigated against two bacterial strains, Escherichia coli (ATCC 25922) and Staphylococcus aureus (ATCC 25923), following a disc-based diffusion assay adapted from Razmavar et al.[32]. The bacterial inoculum was uniformly distributed across the surface of Mueller–Hinton agar plates. Four sterile paper discs (7 mm in diameter) were positioned at the four corners of each plate and subsequently impregnated with 20 µL of the positive control (30 g C6H7KO2 in 50 mL water), the negative control (sterile water), and the reconstituted extract from freeze-dried powder and water. The inoculated plates were maintained at 37 °C for 24 h to allow bacterial growth. Antimicrobial effectiveness was subsequently examined by recording the diameter of the clear zones formed around the discs, expressed in cm.
Qualitative and quantitative determination of phenolic extracts derived from CBS using UPLC–MS/MS and GC–MS/MS
-
Chromatographic separation and mass spectrometric detection were performed following the conditions reported by Tien et al.[31]. The freeze-dried extract was reconstituted in methanol, filtered (0.2 μm), and subjected to UPLC–MS/MS analysis using a Waters system equipped with a C18 column. The instrumentation and column specifications used were identical to those reported in the previous study[31]. Gradient elution was carried out using a formic acid-modified water-acetonitrile system at 0.4 mL min−1, with the column temperature set at 40 °C. The initial composition of the mobile phase was 95% A and 5% B, which gradually shifted to 90% A at 3 min, 85% A at 5 min, and 80% A at 7 min. From 8 to 9.2 min, solvent B increased to 100% and was maintained until 9.8 min, before returning to the starting conditions at 10.5 min. A sample volume of 10 μL was introduced into the system. Desolvation and cone gas flows were supplied by nitrogen at 1,000 and 150 L h−1, respectively. Data acquisition was conducted under negative electrospray ionization, applying a capillary voltage of 0.50 kV, a cone voltage of 25 V, and a desolvation temperature of 600 °C. Quantitative analysis was achieved in multiple reaction monitoring mode based on characteristic precursor–product ion transitions, and the dwell time for each transition was automatically assigned by the acquisition software. The limits of detection and limits of quantification were determined based on signal-to-noise ratios of 3 and 10, respectively.
The CBS extract was further characterized by GC–MS/MS using a Shimadzu system equipped with a capillary column, with instrumentation and analytical conditions consistent with those reported by Tien et al.[31]. The measurement utilized an electron ionization system maintaining the ion source and interface temperatures at 200 °C. Chromatographic analysis employed helium as the carrier gas (1 mL min−1), while sample injection was conducted in split mode using a 1 μL volume. The oven temperature program began at 50 °C with a 5 min hold, followed by a ramp of 5 °C min−1 to 200 °C. The temperature was subsequently increased to 280 °C at a rate of 10 °C min−1 and maintained for 15 min. Mass spectral data obtained from GC–MS/MS analysis were interpreted with reference to the National Institute of Standards and Technology library. Compound identification was achieved through spectral matching with entries available in the database.
Statistical analysis
-
Triplicate experiments were carried out, and results were expressed as mean values. Differences among treatments were assessed using analysis of variance followed by Tukey's test (p < 0.05) in SPSS (v20, IBM Corp., Armonk, NY, USA). Modeling and response surface analysis were performed using Design-Expert (v11, Stat-Ease Inc., Minneapolis, MN, USA).
-
Figure 1 compares the amount of extract obtained and the total phenolic content (TPC) of the extracts from the cocoa bean shells (CBS) using diverse approaches. Overall, both outcomes followed a similar pattern across the different extraction methods. The heating-aided extraction (HE) exhibited the lowest extraction yield and TPC as compared to the microwave-aided extraction (ME) and ultrasound-aided extraction (UE). Notably, the integration of sonication and irradiation substantially improved both extraction yield and TPC. Among the extraction techniques used, the ultrasound-microwave-aided extraction (UME) resulted in the highest yield of 10.5% and TPC of 10.2 mg GAE g−1 dried CBS, representing approximately 5.1-fold, 1.7-fold, and 2.5-fold increases in extraction yield compared with HE, ME, and UE, respectively. Similarly, TPC increased by about 2.3-fold, 1.4-fold, and 1.7-fold compared with HE, ME, and UE, respectively. These observations agreed with earlier reports. The study by Yusof et al.[25] demonstrated the suitability of UE for recovering bioactive constituents from CBS; while Mashuni et al.[24] and Mellinas et al.[33] proved that ME was an appropriate procedure for achieving the same objective. Nevertheless, Luo et al.[22] confirmed that a notable improvement in phenolic recovery from walnut flour when ultrasound was integrated with ME. The cell wall was commonly broken down due to the disintegration of cavitation bubbles under the operation of ultrasound, facilitating an extension of mass transfer between plant tissues and their surroundings, ultimately resulting in the advancement in the separation efficiency[34]. An instantaneous proliferation in temperature caused by irradiation also manifested a similar capacity to disrupt plant tissues, eventually better extraction yield[35]. In this study, the coupled sonication and irradiation approach provided superior productivity compared to either technique alone, notably in sequence with a combination of ultrasound and microwave. This sequential order is likely more effective than microwave treatment followed by ultrasound because the pre-treatment by ultrasound facilitates better solvent accessibility and weakens the plant matrix structure before thermal effects occur[20]. As a result, subsequent microwave irradiation can penetrate more efficiently, promoting rapid internal heating and enhancing the release of bound phenolic compounds. In contrast, applying microwave treatment first may cause uneven heating that can degrade thermally sensitive bioactive compounds and thereby reduce the effectiveness of the following ultrasound treatment[36]. As a result, the UME was selected as the most appropriate method for subsequent assessments.
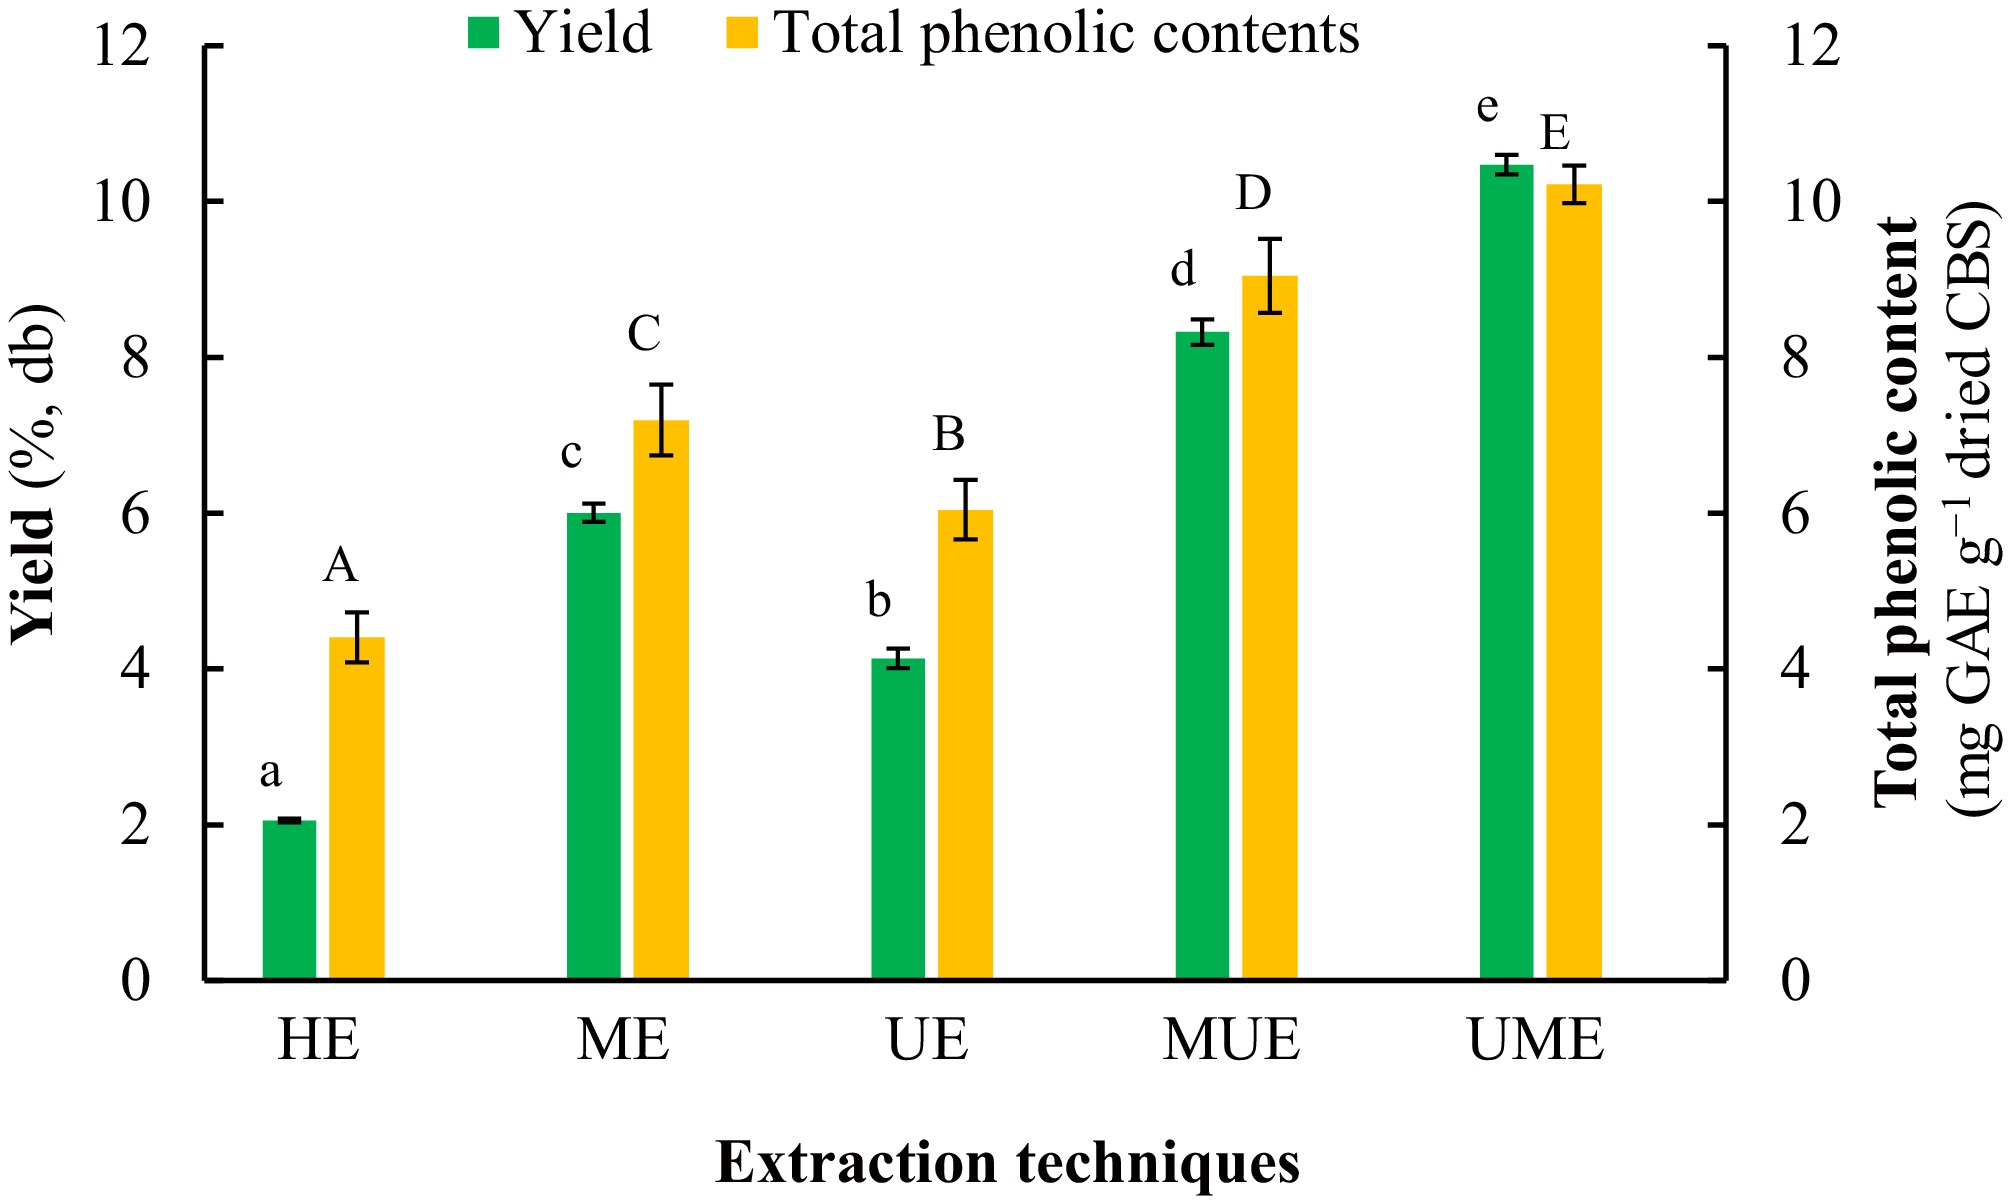
Figure 1.
Comparison of yield and total phenolic content of the extracts from cocoa bean shells using different extraction techniques using water as a solvent. CBS, cocoa bean shells; db, dry basis; GAE, gallic acid equivalent; HE, heating-aided extraction; ME, microwave-aided extraction; MUE, ordered microwave-ultrasound-aided extraction; UE, ultrasound-aided extraction; UME, ordered ultrasound-microwave-aided extraction. Data followed by the same lowercase letter (for yield) or uppercase letter (for total phenolic content) are not significantly different (p > 0.05).
Effect of solvent systems on phenolic recovery from CBS
-
Figure 2 highlights the variability in yield and TPC of the extracts from the CBS depending on the extraction solvents employed. A differentiation among diverse single components clarified that the solvents containing a sole hydrogen bond donor (ChCl, G, and NaOAc) provided the lowest yield and TPC, followed by water, and finally those consisting of sole hydrogen bond acceptors (LA, AA, and CA). Notwithstanding, two- or three-component systems formed from combinations of hydrogen bond donors and acceptors, with or without the existence of water, significantly enhanced the recovery efficiency. Among all evaluated solvent systems, superior extraction efficiency was obtained with the NaOAc–CA solvent system (NaOAc, CA, and water at 1:3:4, v/v/v), yielding 26.8% extract with a TPC of 13.7 mg GAE g−1 dried CBS. Comparable outcomes have been reported by Pal & Jadeja[30], who confirmed that the combination of NaOAc and organic acids was appropriate for the derivation of bioactive constituents from botanical sources. Kalompatsios et al.[27] also affirmed that citric acid manifested better efficiency than lactic acid when they were applied for recovering these chemicals. In this system, NaOAc functioned as the hydrogen-bond acceptor, while CA acted as the donor, leading to the formation of a natural deep eutectic solvent. The superior performance of this system might be attributed to its suitable polarity and acidic environment, which improve the solubility of phenolic compounds and facilitate their release from the plant matrix. Citric acid can help weaken interactions between phenolics and cell wall components through pH reduction, while sodium acetate stabilizes the solvent network and enhances hydrogen-bond formation. In addition, hydroxyl and carboxyl groups present in phenolic acids can form strong hydrogen-bond interactions with the NaOAc–CA system, promoting better dissolution and extraction efficiency[37]. Overall, the NaOAc–CA system (NaOAc, CA, and water at 1:3:4, v/v/v) showed the highest efficiency for recovering phenolic compounds from CBS and was therefore selected for subsequent assessments.
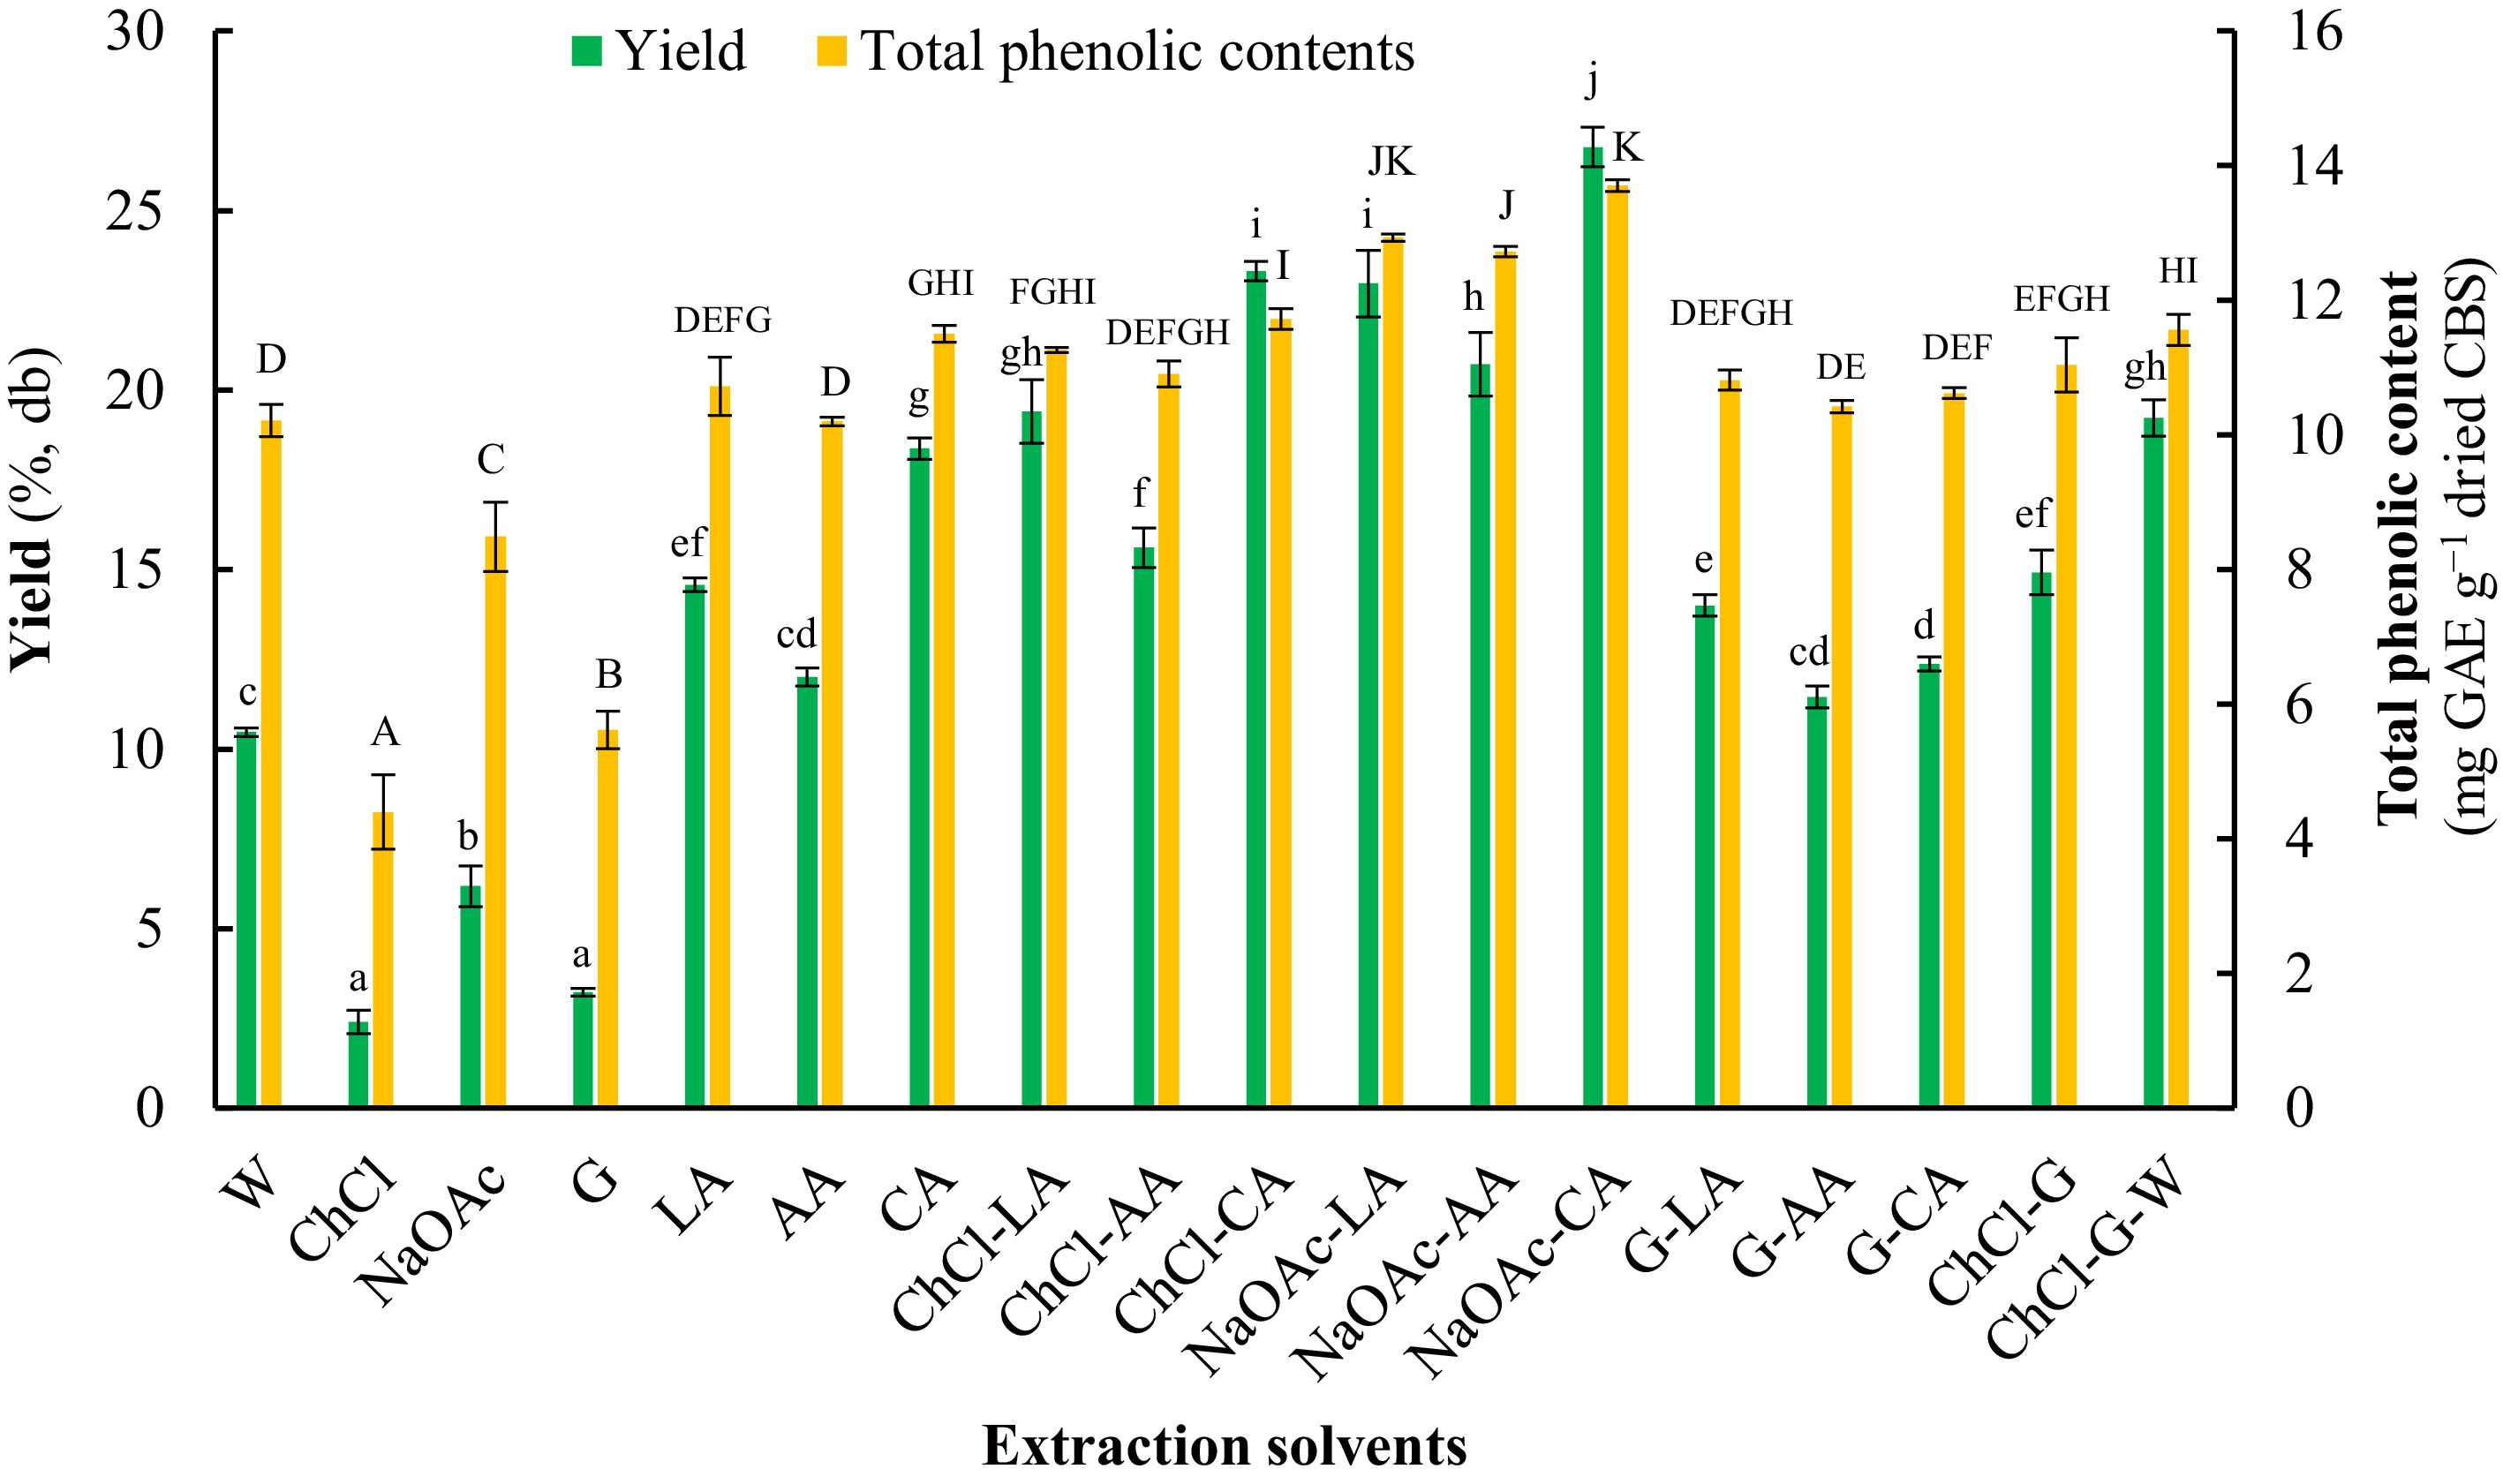
Figure 2.
Comparison of yield and total phenolic content of the extracts from cocoa bean shells using different extraction solvents using UME as an extraction technique. AA, acetic acid (0.3 mL in 100 mL water); CA, citric acid (1 g in 40 mL water); CBS, cocoa bean shell; ChCl, choline chloride solution (1 g in 40 mL water); ChCl–AA, the mixture of ChCl and AA (ratio of 1:2, v/v); ChCl-CA, the mixture of ChCl and CA (ratio of 2:1, v/v); ChCl–G, the mixture of ChCl and G (ratio of 5:2, v/v); ChCl–G–W, the mixture of ChCl, G, and water (ratio of 5:2:5, v/v/v); ChCl-LA, the mixture of ChCl and LA (ratio of 1:3, v/v); db, dry basis; G, glucose solution (1 g/40 mL water); G–AA, the mixture of G, AA, and water (ratio of 1:5:3, v/v/v); GAE, gallic acid equivalent; G–CA, the mixture of G, CA, and water (ratio of 1:5:3, v/v/v); G–LA, the mixture of G, LA, and water (ratio of 1:5:3, v/v/v); LA, lactic acid (1 mL in 40 mL water); NaOAc–AA, the mixture of NaOAc, AA, and water (ratio of 1:3:4, v/v/v); NaOAc–CA, the mixture of NaOAc, CA, and water (ratio of 1:3:4, v/v/v); NaOAc, sodium acetate solution (1 g in 40 mL water); NaOAc–LA, the mixture of NaOAc, LA, and water (ratio of 1:3:4, v/v/v); UME, ordered ultrasound-microwave-aided extraction; W, water. Data followed by the same lowercase letter (for yield) or uppercase letter (for total phenolic content) are not significantly different (p > 0.05).
Optimized conditions for phenolic recovery from CBS using Box–Behnken design
Model fitting and statistical analysis
-
Table 2 gives the details of the Box–Behnken design with a matrix of 29 runs, accompanied by their estimated and observed recovery yield and TPC of the extracts from the CBS. These results ranged from 15.6% to 31.9% for yield and from 5.52 to 14.9 mg GAE g−1 dried CBS for TPC, where the maximum response was observed in run 27, corresponding to X1 = 50 mL g−1, X2 = 45 min, X3 = 55 °C, and X4 = 20 min.
Table 2. Design matrix and result of Box–Behnken design for extracting phenolic compounds from cocoa bean shells1.
# Independent variables Dependent variables Coded Actual Yield
(%, db)Total phenolic content
(mg GAE g−1 dried CBS)X1 X2 X3 X4 X1 X2 X3 X4 Observed2 Estimated Observed2 Estimated 1 0 0 0 0 50 45 55 20 28.5 ± 0.2 29.8 14.3 ± 0.4 14.1 2 1 1 0 0 70 65 55 20 19.0 ± 0.4 19.6 10.9 ± 0.4 11.2 3 1 0 0 1 70 45 55 30 17.4 ± 0.5 16.4 9.09 ± 0.10 8.67 4 0 0 0 0 50 45 55 20 30.3 ± 0.1 29.8 14.8 ± 0.6 14.1 5 0 0 −1 −1 50 45 35 10 24.4 ± 1.4 24.3 12.7 ± 0.4 13.3 6 −1 1 0 0 30 65 55 20 22.8 ± 0.8 24.5 10.0 ± 0.6 10.4 7 0 1 0 1 50 65 55 30 15.7 ± 0.2 15.1 6.48 ± 0.09 6.41 8 0 −1 0 1 50 25 55 30 18.5 ± 0.1 20.0 8.50 ± 0.69 9.16 9 1 0 0 −1 70 45 55 10 24.2 ± 0.3 24.4 12.8 ± 0.5 12.6 10 0 −1 1 0 50 25 75 20 24.7 ± 0.4 25.7 12.3 ± 0.4 12.5 11 1 0 −1 0 70 45 35 20 22.7 ± 0.4 23.9 13.2 ± 0.2 13.5 12 0 1 1 0 50 65 75 20 18.8 ± 0.2 19.0 9.40 ± 0.35 9.90 13 0 −1 0 −1 50 25 55 10 24.7 ± 0.6 25.0 13.1 ± 0.8 12.6 14 1 0 1 0 70 45 75 20 20.4 ± 0.5 21.6 11.6 ± 0.4 11.7 15 −1 0 −1 0 30 45 35 20 26.2 ± 0.9 24.8 12.2 ± 0.6 11.6 16 0 1 −1 0 50 65 35 20 25.0 ± 0.4 24.8 12.8 ± 0.6 12.8 17 0 0 −1 1 50 45 35 30 19.4 ± 0.2 19.3 9.02 ± 0.49 8.83 18 0 1 0 −1 50 65 55 10 25.8 ± 0.6 24.1 13.4 ± 0.2 12.2 19 −1 0 1 0 30 45 75 20 24.4 ± 0.1 23.0 10.7 ± 0.2 9.80 20 0 0 1 −1 50 45 75 10 24.7 ± 0.3 24.3 11.2 ± 0.3 11.7 21 0 0 1 1 50 45 75 30 15.7 ± 0.4 15.3 7.33 ± 0.20 6.89 22 −1 −1 0 0 30 25 55 20 24.8 ± 0.6 23.7 11.0 ± 0.6 10.8 23 −1 0 0 −1 30 45 55 10 22.9 ± 0.9 24.6 10.7 ± 0.1 11.4 24 −1 0 0 1 30 45 55 30 18.0 ± 0.4 18.5 5.52 ± 0.21 5.99 25 0 −1 −1 0 50 25 35 20 23.5 ± 1.1 24.0 13.5 ± 0.2 13.3 26 1 −1 0 0 70 25 55 20 28.6 ± 0.3 26.3 14.1 ± 0.3 13.9 27 0 0 0 0 50 45 55 20 31.9 ± 0.5 29.8 14.9 ± 0.3 14.1 28 0 0 0 0 50 45 55 20 30.1 ± 0.6 29.8 13.0 ± 0.5 14.1 29 0 0 0 0 50 45 55 20 28.3 ± 0.9 29.8 13.4 ± 0.6 14.1 1 X1, liquid-solid ratio (mL g−1); X2, sonication time (min); X3, sonication temperature (°C); X4, microwave time (min); CBS, cocoa bean shells. 2 Mean of triplicate determination. The analysis of variance for the regression model describing phenolic extraction from CBS is presented in Table 3, highlighting the effects of individual variables on extraction yield and TPC at a 95% confidence level. The p-values for both responses were < 0.0001, inferring that the second-order polynomial models were highly significant and adequately described the experimental data. The appropriate suitability of the model for the data was further confirmed due to the non-significant lack-of-fit test, with p-values of 0.435 and 0.661 obtained for yield and TPC, respectively, when compared with the pure error. Moreover, a direct interaction between the process variables and the responses was notably highlighted owing to the high coefficient of determination (R2) and its adjustment (R2 and R2adjusted of yield were 0.933 and 0.867, respectively, and of TPC were 0.948 and 0.897, respectively).
Table 3. Analysis of variance for regression model of extracting bioactive compounds from cocoa bean shells1.
Source Yield Total phenolic content Sum of squares df Mean square F-value p-value Sum of squares df Mean square F-value p-value Model 505 14 36.1 14.0 < 0.0001 160 14 11.4 18.4 < 0.0001 X1 3.93 1 3.93 1.52 0.238 11.3 1 11.3 18.1 0.0008 X2 25.8 1 25.8 10.0 0.007 7.38 1 7.38 11.9 0.004 X3 12.5 1 12.5 4.86 0.045 9.80 1 9.80 15.8 0.001 X4 147 1 147 57.1 < 0.0001 64.5 1 64.5 103.7 < 0.0001 X1X2 14.1 1 14.1 5.45 0.035 1.27 1 1.27 2.04 0.175 X1X3 0.066 1 0.066 0.026 0.875 0.0004 1 0.0004 0.0006 0.981 X1X4 0.900 1 0.900 0.349 0.564 0.549 1 0.549 0.883 0.363 X2X3 13.8 1 13.8 5.35 0.036 1.12 1 1.12 1.81 0.200 X2X4 3.97 1 3.97 1.54 0.235 1.40 1 1.40 2.25 0.156 X3X4 3.93 1 3.93 1.52 0.238 0.019 1 0.019 0.031 0.863 X12 64.9 1 64.9 25.2 0.0002 13.9 1 13.9 22.4 0.0003 X22 62.7 1 62.7 24.3 0.0002 6.59 1 6.59 10.6 0.006 X32 73.0 1 73.0 28.3 0.0001 5.65 1 5.65 9.08 0.009 X42 208 1 208 80.9 < 0.0001 56.4 1 56.4 90.7 < 0.0001 Residual 36.1 14 2.58 8.70 14 0.622 Lack-of-Fit 27.6 10 2.76 1.29 0.435 5.75 10 0.575 0.778 0.661 Pure Error 8.56 4 2.14 2.96 4 0.739 Cor Total 541 28 168 28 R² 0.933 0.948 Adjusted R² 0.867 0.897 1 X1, liquid-solid ratio (mL g−1); X2, sonication time (min); X3, sonication temperature (°C); X4, microwave time (min). With respect to recovery yield, obvious effects (p < 0.05) were observed for the linear (X2, X3, and X4), interaction (X1X2 and X2X3), and quadratic (X12, X22, X32, and X42) levels, while the remaining coefficients were not statistically significant (p > 0.05). Similarly, all variables used had a notable influence on TPC at both the linear (X1, X2, X3, and X4) and quadratic (X12, X22, X32, and X42) coefficients, whereas the other interaction terms in the model did not show remarkable effects (p > 0.05). Subsequently, second-order polynomial models for both yield and TPC were configured utilizing the actual values of the variables and estimated coefficients (Supplementary Table S1), as represented in Eqs. (3) and (4), respectively:
$ \begin{split}\;&\text{Recovery yield}\;(\text{%} ,\;{\mathrm{db}})=-74.4+1.04 X _ 1 +1.22 X _ 2 +1.20 X _ 3 +2.53 X _ 4 \\ &\quad-0.0047 X _ 1 X _ 2 -0.0003 X _ 1 X _ 3 -0.0024 X _ 1 X _ 4 -0.0046 X _ 2 X _ 3 \\ &\quad-0.0050 X _ 2 X _ 4 -0.0050 X _ 3 X _ 4 -0.0079( X _ 1 )^ 2 -0.0078( X _ 2 )^ 2 \\ &\quad-0.0084( X _ 3 )^ 2 -0.0567( X _ 4 )^ 2 \end{split}$ (3) $\begin{split}\;&{\mathrm{TPC}}\;({\mathrm{mg\;GAE\;g}}^{ -1} {\mathrm{dried\;CBS}})=-20.3+0.44 X _ 1 +0.39 X _ 2 +0.28 X _ 3 \\ &\quad+1.01 X _ 4 -0.0014 X _ 1 X _ 2 -0.00002 X _ 1 X _ 3 +0.0019 X _ 1 X _ 4 -0.0013 X _ 2 X _ 3 \\ &\quad-0.0030 X _ 2 X _ 4 -0.0003 X _ 3 X _ 4 -0.0037( X _ 1 )^ 2 \\ &\quad-0.0025( X _ 2 )^ 2 -0.0023( X _ 3 )^ 2 -0.0295( X _ 4 )^ 2\\[-1pt]\end{split} $ (4) Effects of process variables on phenolic recovery from CBS
-
Three-dimensional response surfaces were constructed to highlight the sole and combined influences of two factors, with the other variables fixed at their central values. All figures featured a distinct peak enclosing the target region, indicated by yellow to red colors, implying that the selected operational range for each variable was optimal. This alignment allowed the models to accurately estimate the highest achievable data of the expected outcome, specifically recovery yield and TPC.
Figure 3a–c, g–i demonstrates the impact of LSR and its interaction with STi, STe, and MTi on both outcomes. The recovery yield and TPC boosted as LSR rose in comparison with STi, STe, and MTi, reaching peak efficiency at roughly 50 mL g−1. These results aligned with those of Rebollo-Hernanz et al.[23] and Yusof et al.[25], who also identified 50 mL g−1 as the optimal LSR for extracting phenolic compounds from the CBS. This finding might result from improved interaction between the solvent and plant matrix, leading to more efficient solubilization. At lower LSR, limited solvent availability might lead to rapid solvent saturation, reducing the concentration gradient and slowing mass transfer. In contrast, increasing LSR improves the driving force for diffusion by maintaining a higher concentration gradient and providing sufficient solvent volume for compound solubilization[38]. While a higher LSR expanded the contact area, facilitating the recovery of bioactive compounds[39,40], an excessive LSR might reduce the distribution of irradiated and sonicated energy, thereby hindering dissolution and ultimately lowering yield[41].
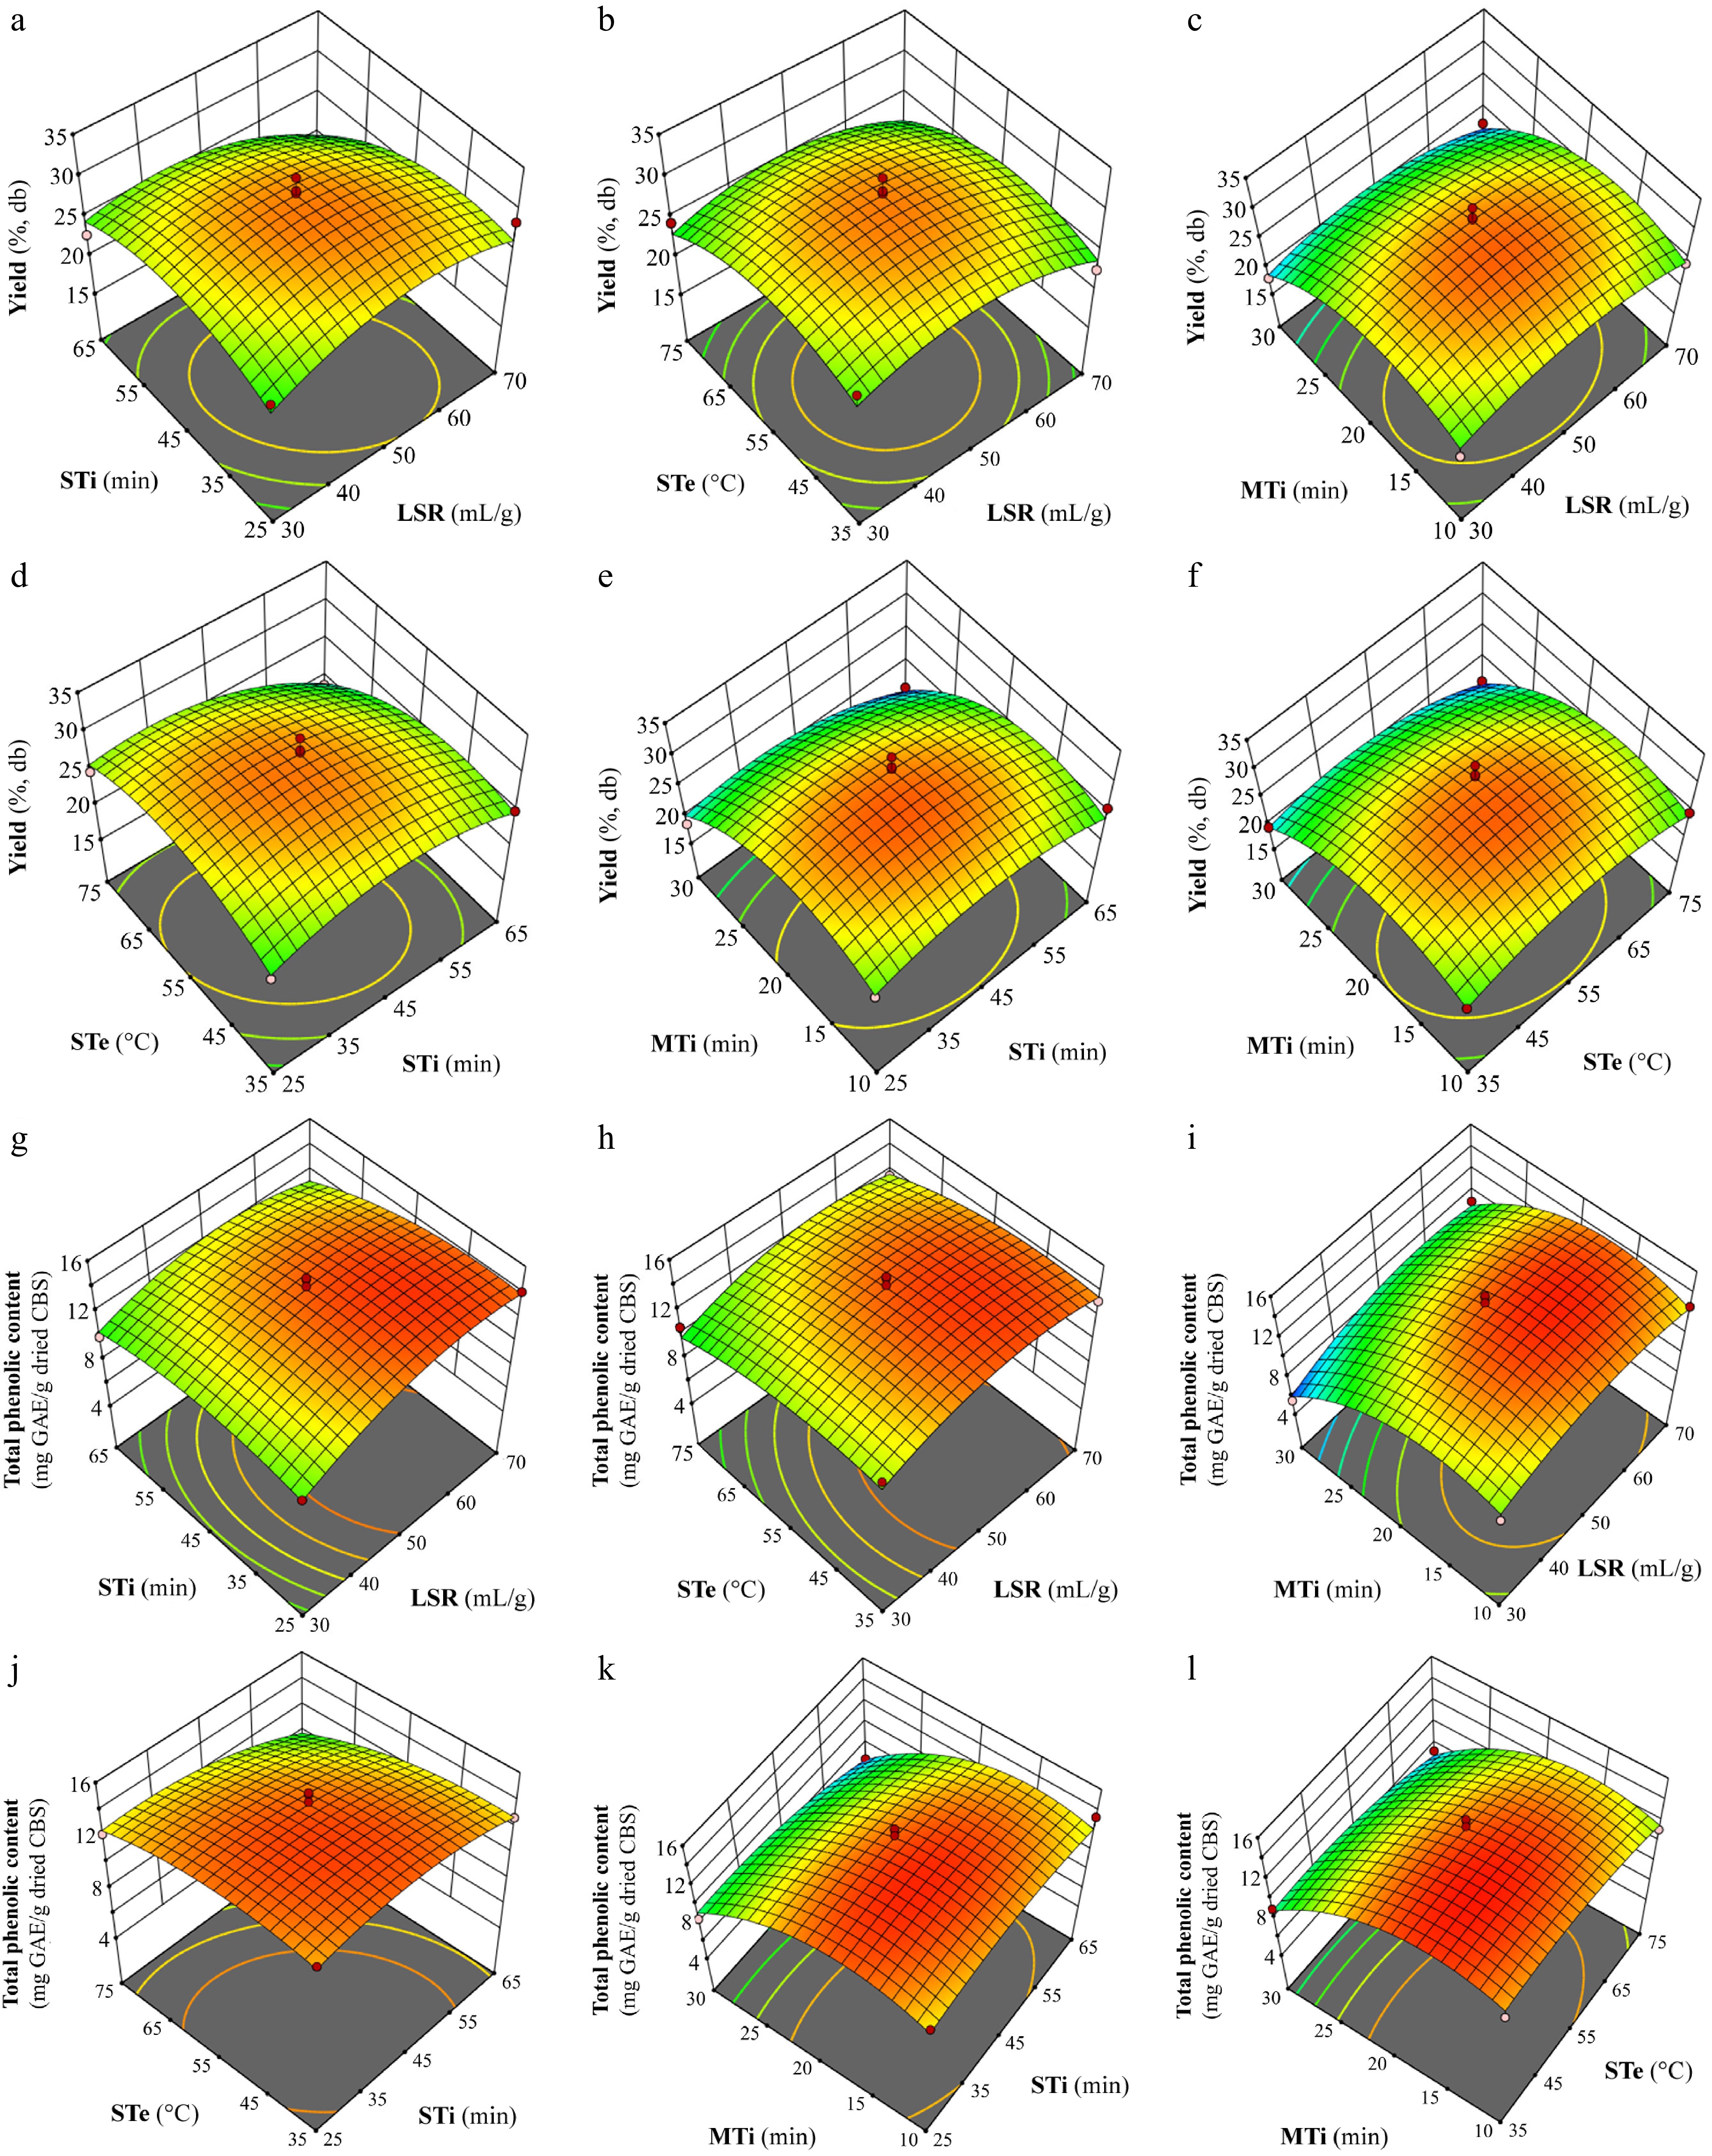
Figure 3.
Response surface plots showing the effects of process variables on extracting yield (a)−(f) and total phenolic content (g)−(l): (a) and (g) effects of LSR and STi at constant STe (55 °C) and MTi (20 min); (b) and (h) effects of LSR and STe at constant STi (45 min) and MTi (20 min); (c) and (i) effects of LSR and MTi at constant STi (45 min) and STe (55 °C); (d) and (j) effects of STi and STe at constant LSR (50 mL g−1) and MTi (20 min); (e) and (k) effects of STi and MTi at constant LSR (50 mL g−1) and STe (55 °C); (f) and (l) effects of STe and MTi at constant LSR (50 mL g−1) and STi (45 min). Abbreviations: LSR, liquid-solid ratio (mL g−1); STi, sonication time (min); STe, sonication temperature (°C); MTi, microwave time (min).
Figure 3a, d, e, g, j, and k highlight the influences of STi and its interaction with LSR, MTi, and STe on both responses, whereas Fig. 3b, d, f, h, j, and l exhibit the impacts of STe and its interaction with other independent variables. Additionally, Fig. 3c, e, f, i, k, and l manifest the effects of MTi and its interaction with LSR, STi, and STe. Both recovery yield and TPC were maximized under conditions of about 45 min for STi, 55 °C for STe, and 20 min for MTi. Inadequate irradiation or sonication times and temperatures might not contribute enough thermal energy for the structural deterioration of botanical matter, and then the movement of phenolic compounds from plant tissue to extracted solvents. However, when the extraction temperature exceeds approximately 60 °C or when microwave exposure is prolonged, certain phenolic compounds such as catechin and phenolic acids may undergo oxidation, polymerization, or structural degradation, resulting in reduced extractability and antioxidant activity[25,42]. Previous studies have reported that prolonged thermal treatment can accelerate the degradation of heat-sensitive phenolics and reduce total phenolic recovery[43,44].
Determination of optimal conditions and validation of the predictive model
-
The model identified optimal extraction conditions for the highest recovery yield of 30.4% and the greatest TPC of 14.8 mg GAE g−1 dried CBS, while attaining a desirability value of 0.945 (Supplementary Table S2). These conditions included the LSR of 52.9 mL g−1, STi of 40.6 min, STe of 51.8 °C, and MTi of 16.8 min. Thereafter, the reliability of the model was justified by the yield of 31.7% ± 1.8% and TPC of 14.7 ± 0.3 mg GAE g−1 dried CBS, extracted from the CBS under the formulated optimal condition. As no significant difference was observed between the experimental and predicted values (p > 0.05), the model was revealed to be well-fitted for improving recovery efficiency from the CBS.
Bioactive properties of extracts derived from CBS
-
Table 4 illustrates the total phenolic content (TPC), total flavonoid content (TFC), and antioxidant activity of the CBS extract. The use of UME-S, an ordered ultrasound-microwave-aided extraction under optimized conditions employing a solvent mixture of NaOAc, CA, and water in a 1:3:4 ratio (v/v/v), resulted in the best antioxidant activity. This was reflected in a TPC of 14.7 mg GAE g−1 dried CBS, TFC of 9.90 mg RE g−1 dried CBS, DPPH assay value of 23.4 mg TE g−1 dried CBS, and an ABTS assay value of 31.7 mg TE g−1 dried CBS, outperforming the results of UME-W, an ordered ultrasound-microwave-aided extraction using water as the solvent under optimized conditions, and HE, a heating-aided extraction. Compared with HE, UME-S increased TPC, TFC, DPPH, and ABTS values by approximately 3.2-fold, 2.4-fold, 1.6-fold, and 1.6-fold, respectively. In comparison with UME-W, the corresponding increases were about 1.4-fold for TPC, 1.3-fold for TFC, 1.2-fold for DPPH, and 1.2-fold for ABTS. The higher antioxidant activity was closely associated with the elevated TPC and TFC, as phenolic acids and flavonoids are major contributors to free radical scavenging capacity[9,45]. Compounds such as caffeic acid, hydroxybenzoic acid, protocatechuic acid, and catechin (Table 4) could donate hydrogen atoms or electrons to neutralize DPPH and ABTS radicals, while their multiple hydroxyl groups help stabilize free radicals and interrupt oxidative chain reactions. Therefore, the improved recovery of these compounds in UME-S likely explains its superior antioxidant performance. Previous studies have also observed boosted levels of these phytochemicals and enhanced antioxidant activity when using irradiation, sonication, or a combination of both for extraction from botanical sources[22,24,25,33]. These findings also aligned with the work of Pal & Jadeja[30], who demonstrated that combining NaOAc with organic acids effectively facilitates the recovery of bioactive compounds from botanical sources. This improvement in recovery efficiency might be attributed to the rupture of plant cell matrices caused by cavitation bubble collapse during ultrasound treatment or the rapid temperature rise during microwave irradiation. These processes enhance mass transfer between plant tissues and the surrounding solvent[34,35]. Additionally, natural deep eutectic solvents have been demonstrated to improve solubility through hydrogen-bonding interactions, further supporting the enhanced extraction yields[37]. Compared with previous studies that mainly focused on conventional solvent extraction or single extraction techniques, the present work provided a more comprehensive strategy by combining a green NaOAc–CA solvent system with sequential ultrasound–microwave-assisted extraction. In addition to optimizing phenolic recovery, this study further linked the chemical profile of the extracts with both antioxidant and selective antibacterial activities against Gram-positive bacteria. This integrated approach strengthens the potential application of CBS as a sustainable source of functional ingredients for food systems.
Table 4. Yield, total phenolic content, total flavonoid content, antioxidant activity, chemical components qualified by UPLC–MS/MS, and inhibition zone of phenolic extract from cocoa bean shells1,2,5.
HE UME-S UME-W Yield 6.36 ± 0.11a 31.7 ± 1.8c 19.9 ±1.2b TPC 4.52 ± 0.26a 14.7 ± 0.3c 10.7 ±0.6b TFC 4.14 ± 0.20a 9.90 ± 0.44c 7.73 ± 0.27b DPPH 14.3 ± 1.0a 23.4 ± 1.2c 18.8 ± 0.8b ABTS 19.8 ± 1.7a 31.7 ± 2.1c 26.2 ± 1.3b Caffeic acid3 0.090 ± 0.009a 0.197 ± 0.043b 0.184 ± 0.016b Hydroxybenzoic acid3 7.73 ± 0.80a 8.59 ± 0.40a 7.81 ± 0.57a Protocatechuic acid3 1.96 ± 0.02a 4.05 ± 0.25c 3.28 ± 0.07b Catechin3 3.12 ± 0.62a 4.61 ± 0.24b 4.32 ± 0.37b Inhibition zone against S. aureus4 1.22 ± 0.03a 1.85 ± 0.05b 1.30 ± 0.05a Inhibition zone against E. coli nd nd nd 1 HE, heating-aided extraction; UME-S, ordered ultrasound-microwave-aided extraction under optimized conditions using the mixture of sodium acetate, citric acid, and water (ratio of 1:3:4, v/v/v) as extraction solvent; UME-W, ordered ultrasound-microwave-aided extraction under optimized conditions using water as extraction solvent. 2 ABTS, ABTS radical scavenging assay (mg Trolox equivalent g−1 dried CBS); DPPH, DPPH radical scavenging assay (mg Trolox equivalent g−1 dried CBS); TFC, total flavonoid content (mg rutin equivalent g−1 dried CBS); TPC, total phenolic content (mg gallic acid equivalent g−1 dried CBS); Yield, yield (%, dry basis). 3 The unit of these compounds is µg component g−1 dried CBS. 4 The unit of inhibition zone is cm; the inhibition zone of the positive control (30 g C6H7KO2 in 50 mL water) against S. aureus is 1.28 ± 0.03 cm. 5 Data followed by the same superscript in the same row are not significantly different (p > 0.05). Chemical profile of the cocoa bean shell extract characterized by UPLC–MS/MS and GC–MS/MS
-
Table 4 details the concentrations of major bioactive constituents profiled through UPLC–MS/MS. Caffeic acid, hydroxybenzoic acid, and protocatechuic acid were identified as phenolic acids in all CBS extracts, while catechin was detected as a flavan-3-ol. Comparable observations have been reported in earlier projects, which have also reported the occurrence of these phenolic acids and flavan-3-ols in CBS[3,23,46]. In the extract obtained from CBS using UME-S, the concentrations of caffeic acid, hydroxybenzoic acid, protocatechuic acid, and catechin were 0.197, 8.59, 4.05, and 4.61 µg g−1 dried CBS, respectively. These data exceeded those obtained from extracts prepared using UME-W and HE. The higher concentrations observed in UME-S might be attributed to the sequential application of ultrasound followed by microwave irradiation, together with the NaOAc–CA solvent system. Ultrasound pre-treatment improves cell wall disruption and solvent penetration through cavitation effects, allowing better access to intracellular phenolic compounds[34]. Subsequent microwave heating promotes rapid internal heating and accelerates solute diffusion, enhancing the release of bound phenolics[35]. In addition, the NaOAc–CA solvent system provides favorable polarity and strong hydrogen-bond interactions with hydroxyl and carboxyl groups of phenolic compounds, improving their solubility and stability during extraction[30]. Similar to the trends observed for TPC and TFC, the increased concentrations of these bioactive compounds likely arose from the synergistic effects of sonication and irradiation along with natural deep eutectic solvents[34,35,37]. The stronger antioxidant activity observed in the UME-S extract was likely associated with the higher levels of phenolic compounds presented in Table 4. Caffeic acid, hydroxybenzoic acid, and protocatechuic acid are recognized for their ability to donate hydrogen atoms or electrons, thereby neutralizing free radicals and contributing to DPPH and ABTS scavenging activity. In addition, catechin, as a major flavan-3-ol, may enhance antioxidant capacity through its multiple hydroxyl groups, which help stabilize reactive oxygen species and inhibit oxidative chain reactions[45]. The higher concentrations of these compounds in UME-S, therefore, could explain its superior antioxidant performance compared with UME-W and HE extracts.
The volatile constituents of CBS extracts, analyzed using GC–MS/MS, are presented in Table 5. The analysis detected five, four, and two volatile compounds in UME-S, UME-W, and HE, respectively, with notable variations in their peak areas. The occurrence of these compounds in plant extracts has been extensively described in earlier studies. Among them, 2,2-dimethoxybutane (13.0%−80.8%) and undecane (1.45%−19.2%) were identified across all three extracts. Undecane, known for its anti-inflammatory and anti-allergic properties[47], has also been detected in the seed oil of Salvia verbenaca seed oil and the fruit oil of Dialium guineense fruit oil[47,48]. Similarly, 2,2-dimethoxybutane has been associated with antibacterial activity and was reported in Piper longum[49]. Moreover, both UME-S and UME-W contained cyclo(L-prolyl-L-valine) (1.54% and 1.15%, respectively) and caffeine (61.8% and 84.4%, respectively). Cyclo(L-prolyl-L-valine) has been noted for its antiproliferative activity against certain microorganisms and was present in Lantana camara leaf extract[50]. Caffeine, on the other hand, was extensively found in Theobroma cacao[51,52]. Additionally, GC–MS/MS analysis of UME-S detected 2H-Cyclohepta[b]furan-2-one, 6-[1-(acetyloxy)-3-oxobutyl]-3,3a,4,7,8,8a-hexahydro-7-methyl-3-methylene- (0.700%), a chemical previously identified in the rhizomes of Curcuma aeruginosa Roxb[53].
Table 5. Components detected in phenolic extracts from cocoa bean shells by GC–MS/MS1,2.
# Name of putative compounds MW (g mol−1) MF HE UME-S UME-W RT (min) PA (%) RT (min) PA (%) RT (min) PA (%) 1 2,2-dimethoxybutane 118 C6H14O2 3.70 80.8 3.69 30.9 3.70 13.0 2 Undecane 156 C11H24 15.0 19.2 15.0 5.06 15.0 1.45 3 2H-cyclohepta[b]furan-2-one, 6-[1-(acetyloxy)-3-oxobutyl]-3,
3a,4,7,8,8a-hexahydro-7-methyl-3-methylene-306 C17H22O5 nd 30.8 0.700 nd 4 Cyclo(L-prolyl-L-valine) 196 C10H16N2O2 nd 33.2 1.54 33.2 1.15 5 Caffeine 194 C8H10N4O2 nd 33.8 61.8 33.8 84.4 1 HE, heating-aided extraction; UME-S, ordered ultrasound-microwave-aided extraction under optimized conditions using the mixture of sodium acetate, citric acid, and water (ratio of 1:3:4, v/v/v) as extraction solvent; UME-W, ordered ultrasound-microwave-aided extraction under optimized conditions using water as extraction solvent. 2 MW, molecular weight; MF, molecular formula; nd, not detected; RT, retention time; PA, peak area. Antibacterial activity of the extract from CBS
-
The antibacterial activity of the phenolic extract from CBS against Staphylococcus aureus and Escherichia coli is demonstrated in Table 4. S. aureus, a gram-positive bacterium, exhibited sensitivity to all three extracts, with the extract using UME-S displaying the highest inhibition zone of 1.85 cm, significantly larger (p < 0.05) than that of the positive control (1.28 cm). This finding was agreeable with preceding studies, which affirmed the antibacterial potential of CBS against S. aureus[11,54]. Conversely, E. coli, a gram-negative bacterium, was not inhibited by the extracts. Previous research has also indicated that CBS extracts lacked pharmacologically relevant activity against E. coli[55]. The different responses observed between S. aureus and E. coli could be explained by differences in their cell envelope structures. Gram-positive bacteria such as S. aureus possess a thick peptidoglycan layer but lack an outer membrane, allowing phenolic compounds to interact more easily with the cell membrane and intracellular targets. In contrast, Gram-negative bacteria such as E. coli contain an additional outer membrane rich in lipopolysaccharides, which acts as a selective barrier and limits the penetration of many hydrophobic and phenolic compounds[56]. This structural difference might explain the lower susceptibility of E. coli to CBS extracts. The stronger antibacterial activity of UME-S against S. aureus could be associated with its higher contents of phenolic acids and catechin. These compounds might contribute to antibacterial effects by affecting membrane integrity, increasing permeability, and interfering with essential cellular functions[57,58]. In addition, volatile constituents identified by GC–MS/MS, including 2,2-dimethoxybutane, undecane and cyclo(L-prolyl-L-valine), might also support the observed activity. However, since the present study did not isolate individual compounds or investigate their specific antibacterial mechanisms, these effects should be interpreted as possible synergistic contributions rather than direct evidence of causation. Therefore, the inhibition of S. aureus was likely related to the combined action of multiple bioactive constituents present in the optimized CBS extract.
-
Phenolic compounds were effectively recovered from cocoa bean shells (CBS) by employing UME-S, an ordered ultrasound–microwave-aided extraction combined with a sodium acetate–citric acid–water solvent system (1:3:4, v/v/v) under optimized conditions. The optimized extract showed high total phenolic and flavonoid contents, strong antioxidant capacity, and selective antibacterial activity against the gram-positive bacterium Staphylococcus aureus, while no inhibition was observed against Escherichia coli. Major phenolic compounds, including caffeic acid, hydroxybenzoic acid, protocatechuic acid, and catechin, were identified and were likely associated with the observed bioactivities. In addition, several volatile constituents may have contributed synergistically to the antibacterial effect. These findings demonstrate the potential of combining ultrasound–microwave-assisted extraction with a green solvent system for the valorization of CBS and other plant-based byproducts in functional food applications. The recovered phenolic-rich extract could serve as a natural antioxidant and antimicrobial ingredient for food preservation, shelf-life extension, and the development of nutraceutical formulations or health-promoting functional foods. In addition, this approach supports the sustainable utilization of agro-industrial residues and offers potential for broader applications in food, pharmaceutical, and cosmetic industries. Although this study was conducted at a laboratory scale, the approach provides a promising basis for future scale-up and industrial application.
-
The authors confirm their contributions to the paper as follows: conceptualization, writing − review and editing, project administration, funding acquisition: Tien NNT, Hung PV; methodology, investigation: Tien NNT, Khuong BH, Hoang HT, Thuan CM, Anh MNT; writing − original draft, visualization: Tien NNT; formal analysis: Tien NNT, Khuong BH, Hoang HT; data curation: Khuong BH; validation: Thuan CM, Anh MNT, Hung PV; resources, supervision: Hung PV. All authors reviewed the results and approved the final version of the manuscript.
-
The authors declare that they have no conflict of interest.
-
accompanies this paper online at: https://doi.org/10.48130/fmr-0026-0013.
- Supplementary Table S1 Analysis variance for the experimental results of response surface quadratic model.
- Supplementary Table S2 The optimal condition for extraction of phenolic compounds using Box-Behnken design.
- Copyright: © 2026 by the author(s). Published by Maximum Academic Press on behalf of Nanjing Agricultural University. This article is an open access article distributed under Creative Commons Attribution License (CC BY 4.0), visit https://creativecommons.org/licenses/by/4.0/.
-
About this article
Cite this article
Tien NNT, Khuong BH, Hoang HT, Thuan CM, Anh MNT, et al. 2026. Optimization of extraction conditions and characterization of phenolic compounds from cocoa bean shells using ordered ultrasound-microwave-aided extraction technique with different eco-friendly solvents. Food Materials Research 6: e012 doi: 10.48130/fmr-0026-0013 

Optimization of extraction conditions and characterization of phenolic compounds from cocoa bean shells using ordered ultrasound-microwave-aided extraction technique with different eco-friendly solvents
- Received: 24 March 2026
- Revised: 08 May 2026
- Accepted: 05 June 2026
- Published online: 20 August 2026
Abstract: Cocoa bean shell, an abundant agro-industrial residue generated during the manufacturing of Theobroma cacao, is a significant source of phenolic and antibacterial agents. Recently, there has been a growing interest in the use of agro-industrial residues for food development, particularly in the context of sustainability and the valorization of plant-based industrial byproducts. In this study, sustainable extraction conditions for the phenolic recovery from cocoa bean shells were optimized through a Box–Behnken experimental design, followed by evaluation of the free radical scavenging activity and inhibitory potential against microorganisms of the obtained fraction. Among the appraised techniques and solvent systems, the highest yield was achieved using ultrasound-microwave-aided extraction with a solvent mixture of sodium acetate, citric acid, and water (1:3:4, v/v/v). Under optimal conditions (52.9 mL g−1 solvent loading, sonication for 40.6 min at 51.8 °C, and subsequent irradiation for 16.8 min), the extraction achieved a yield of 30.4%, with phenolic compounds reaching 14.8 mg gallic acid equivalents g−1 dried cocoa bean shells. The resulting fraction also exhibited strong antioxidant and antibacterial activities. UPLC–MS/MS enabled the characterization of key bioactive compounds, such as caffeic acid, hydroxybenzoic acid, protocatechuic acid, and catechin. Meanwhile, GC–MS/MS was employed to profile volatile constituents including 2,2-dimethoxybutane, undecane, cyclo(L-prolyl-L-valine), caffeine, and 2H-cyclohepta[b]furan-2-one derivatives, as well as 6-(1-[acetyl-oxy]-3-oxobutyl)-3,3a,4,7,8,8a-hexahydro-7-methyl-3-methylene. Overall, this project highlighted the potential green extraction technique to obtain phenolic compounds of cocoa bean shells for application in functional food development.