-
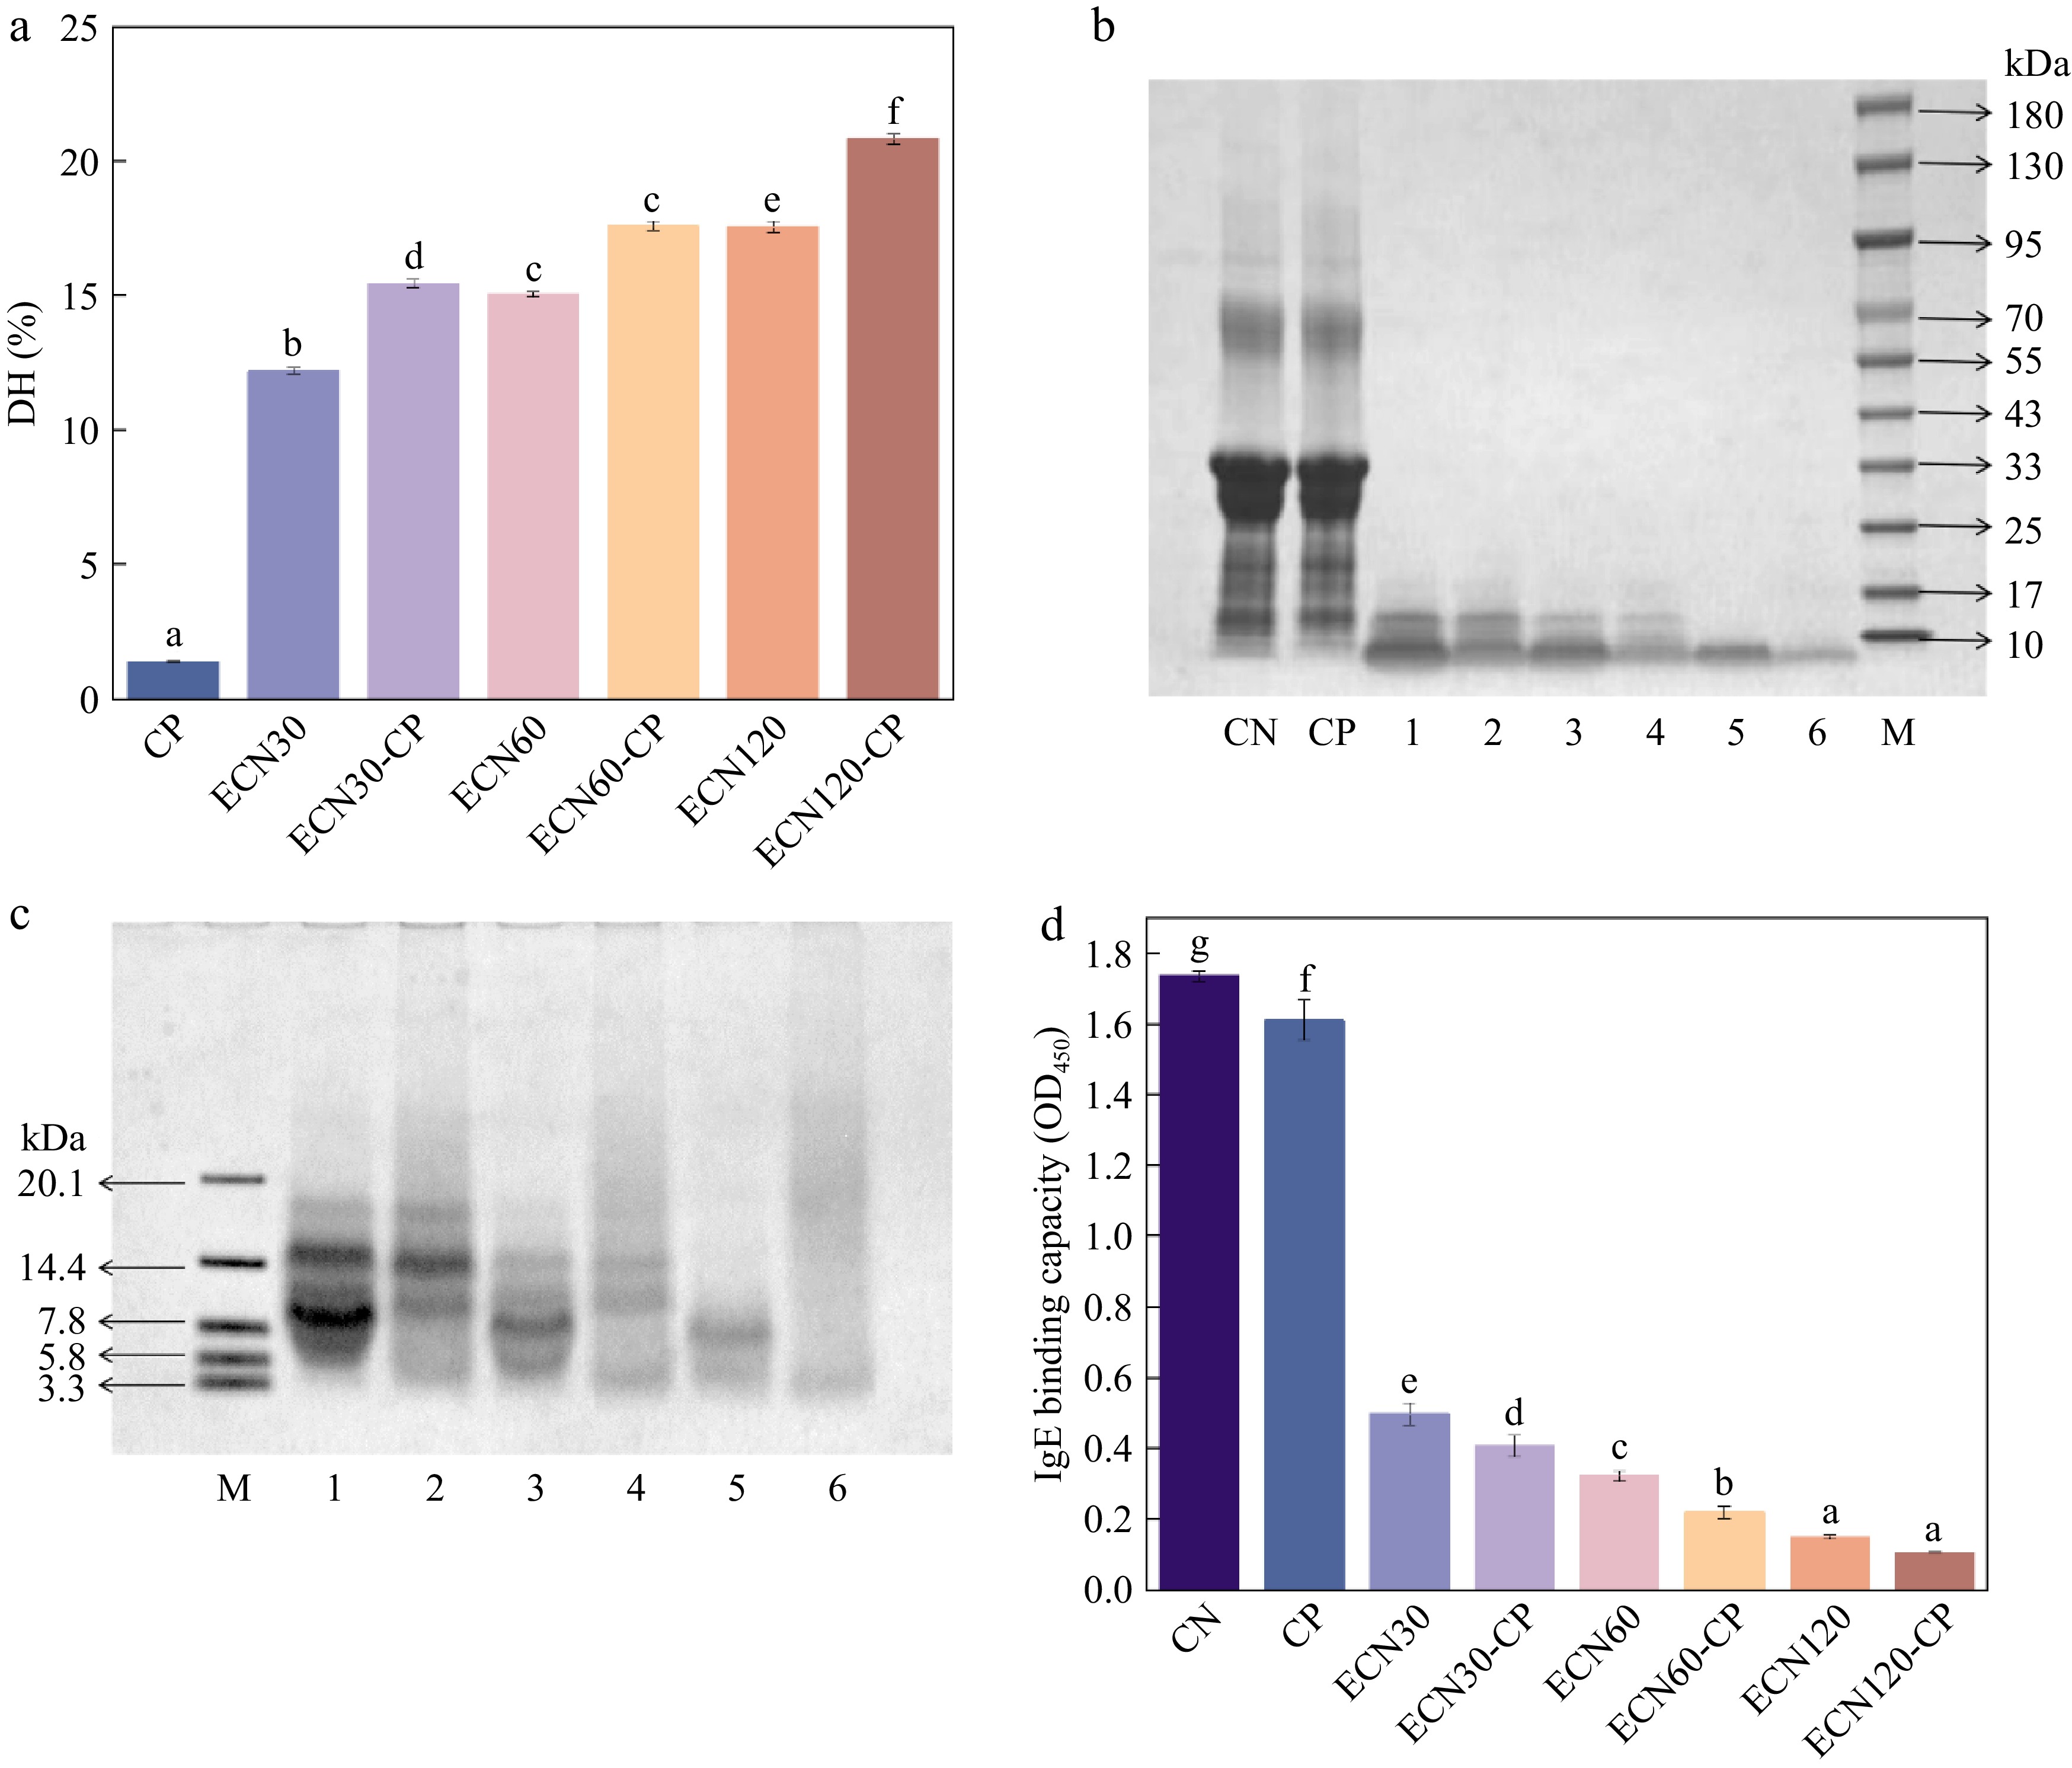
Figure 1.
Effects of different treatments on (a) hydrolysis degree, (b) SDS-PAGE, (c) Tricine-SDS-PAGE, and (d) IgE binding capacity of CN. Lane M: molecular weight marker (10−180 kDa, 3.3−20.1 kDa); Lanes 1–6: ECN30, ECN30-CP, ECN60, ECN60-CP, ECN120, and ECN120-CP.
-
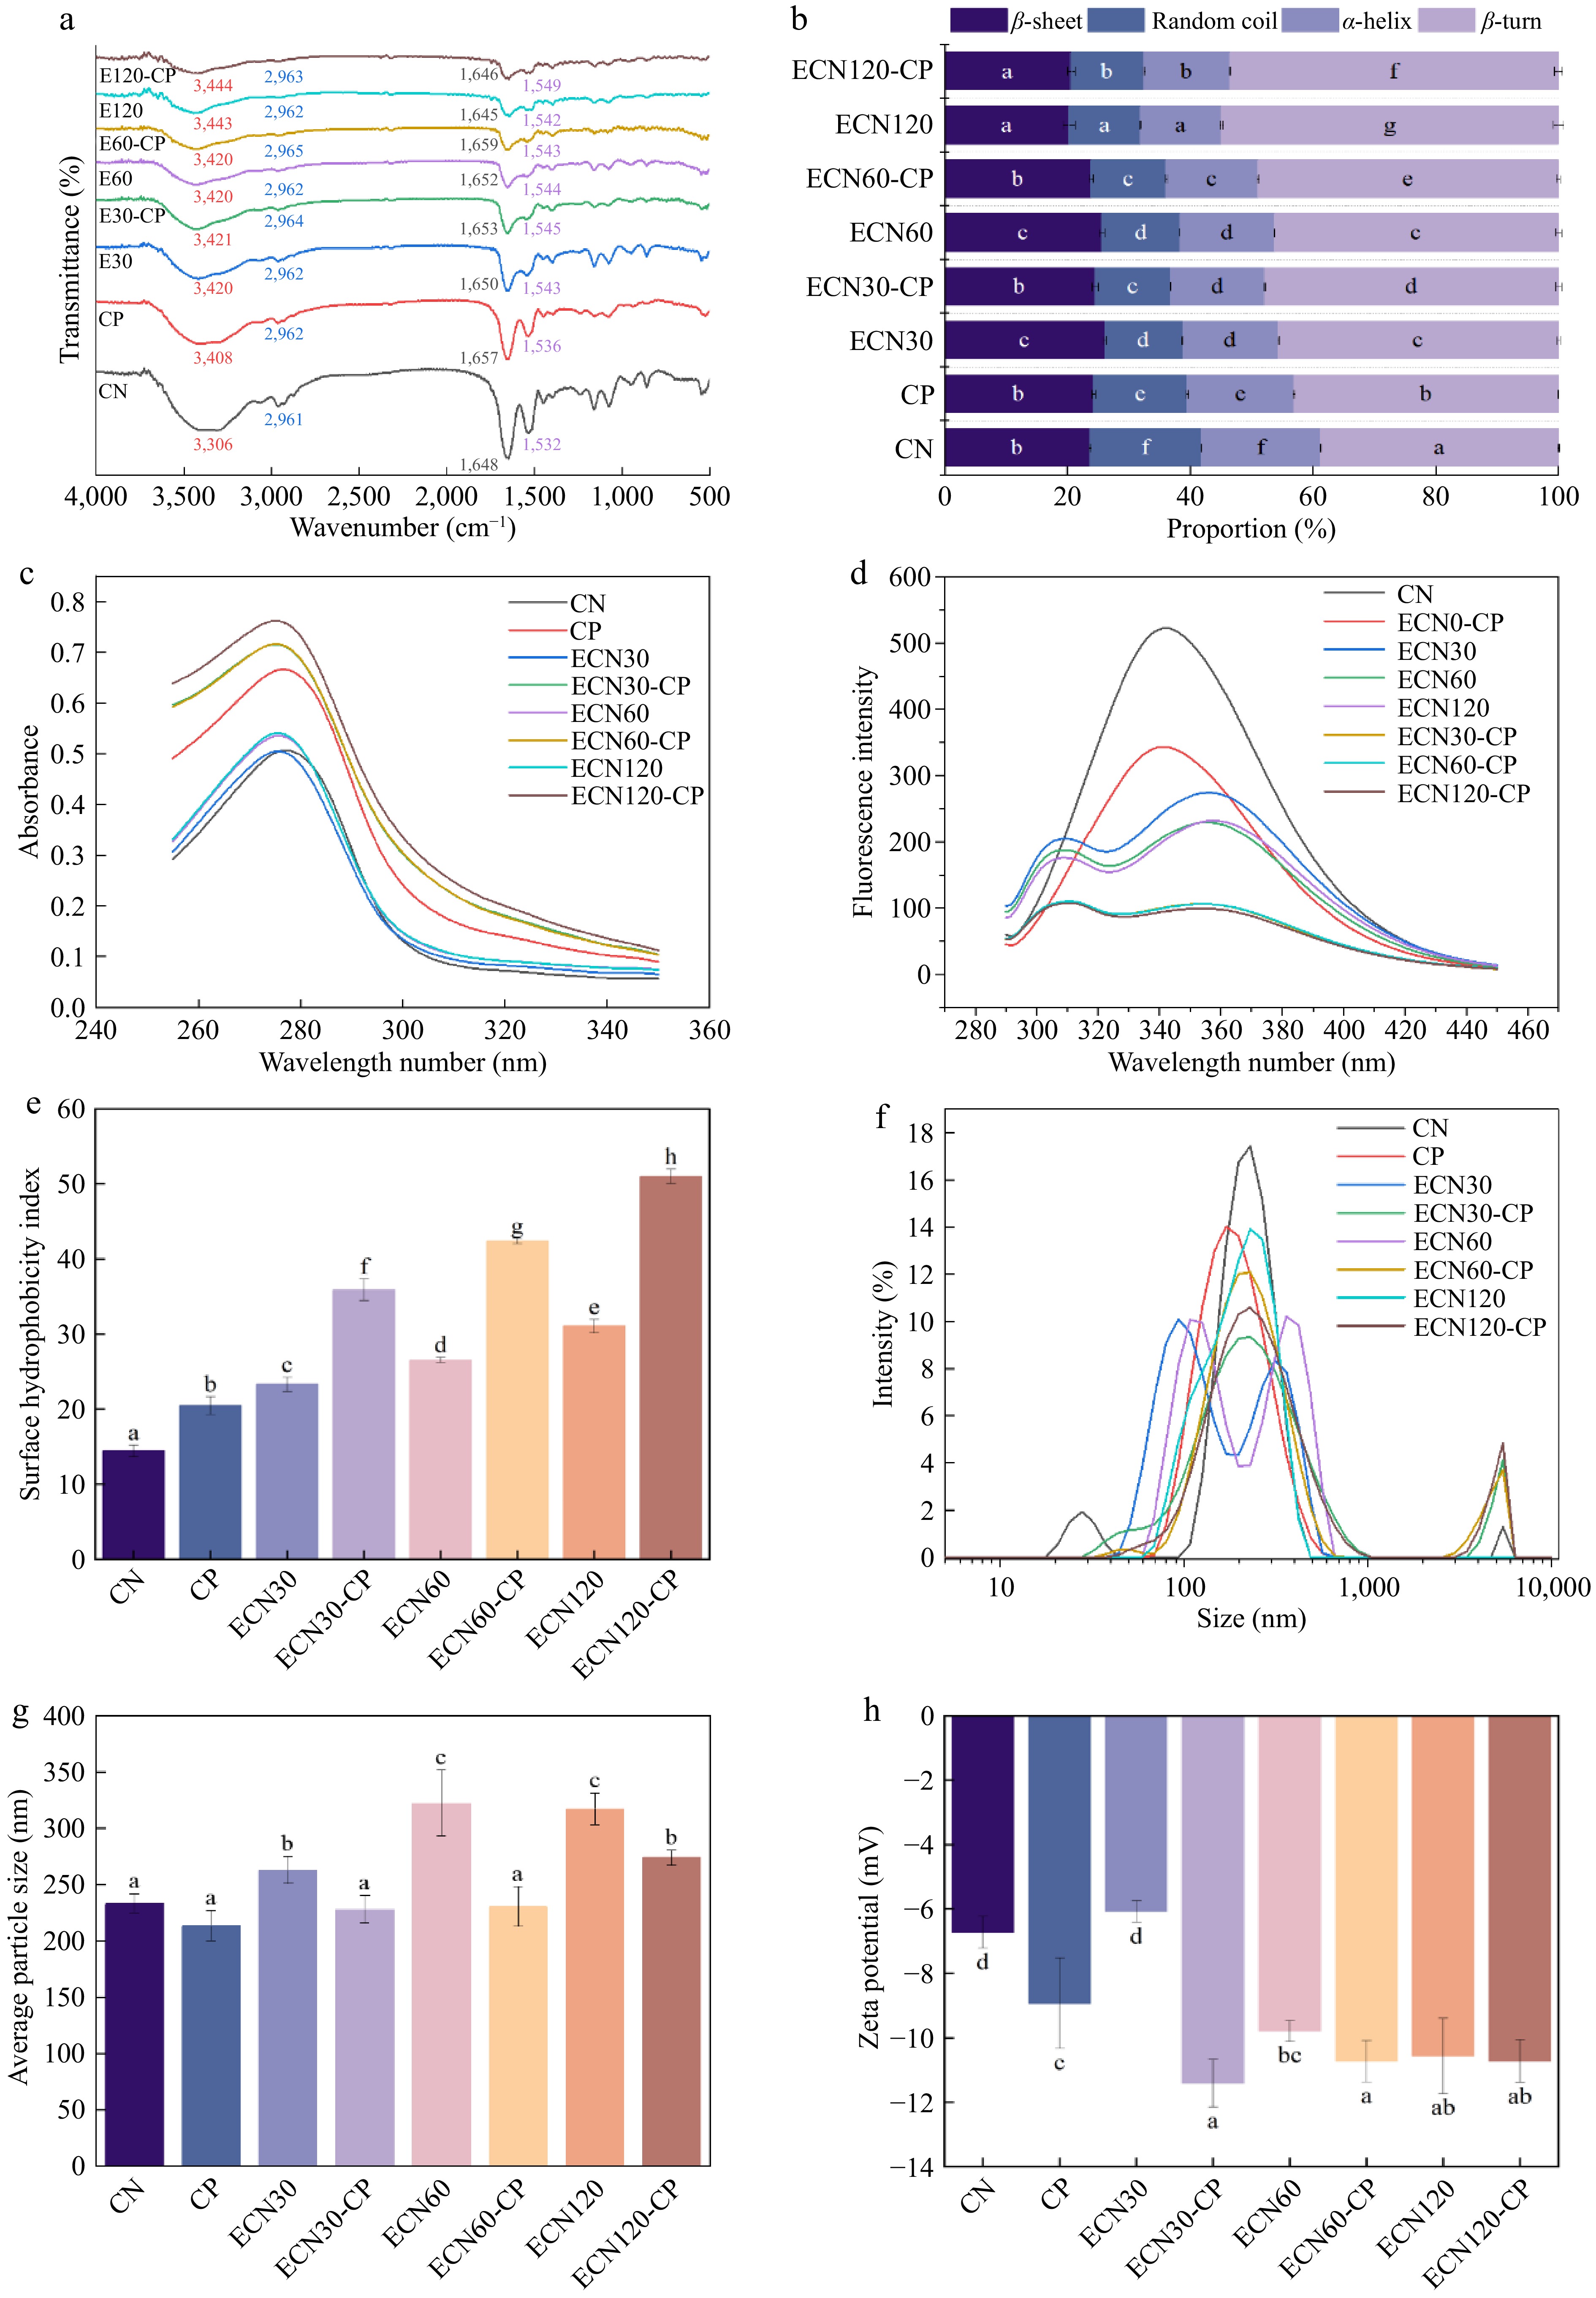
Figure 2.
Impact of various treatments on the structural characteristics of CN: (a) infrared spectroscopy; (b) secondary structure; (c) UV spectra; (d) fluorescence spectra; (e) surface hydrophobicity; (f) particle size distribution; (g) average particle size; and (h) potentials. Different letters indicate significant differences between groups (p < 0.05).
-
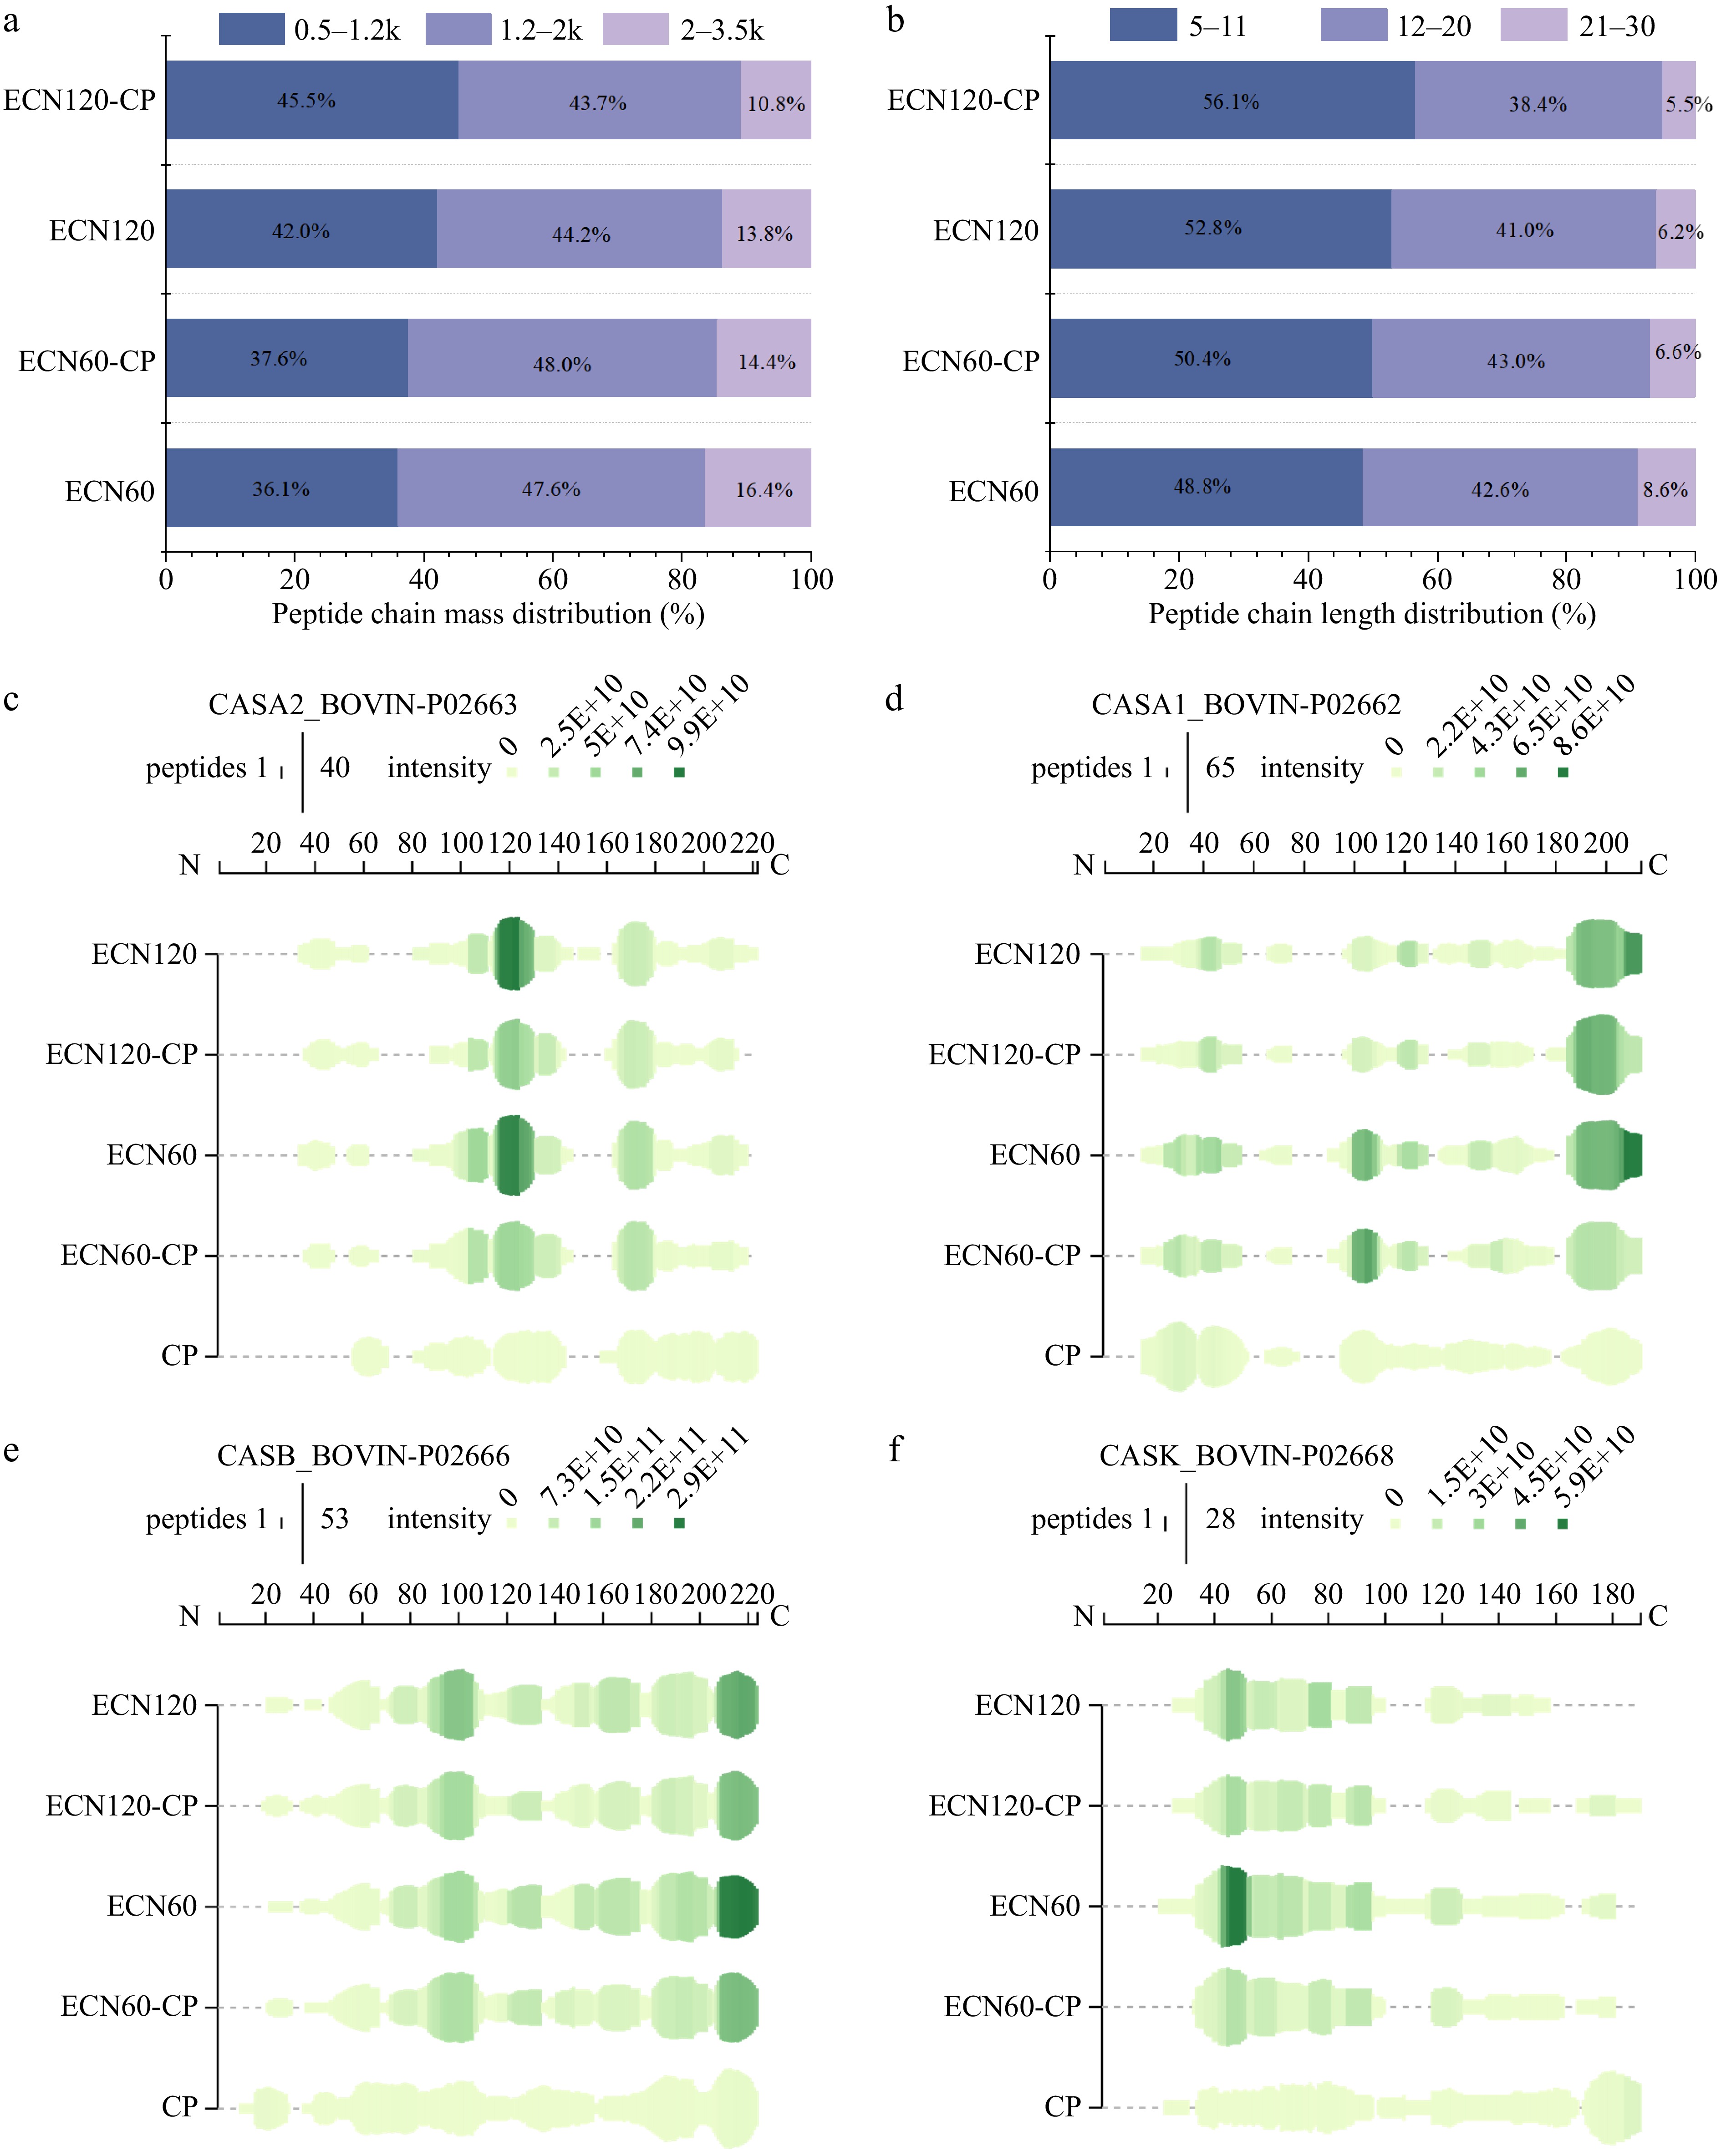
Figure 3.
Mass spectrometry analysis of hydrolysates of CNHs: (a) peptide chain mass distribution; (b) peptide chain length distribution; (c) bovine αS2-casein (P02663); (d) bovine αS1-casein (P02662); (e) bovine β-casein (P02666); (f) bovine κ-casein (P02668). The green bar height indicates the number of peptides, while the color intensity reflects the summed intensities of peptides overlapping this position.
-
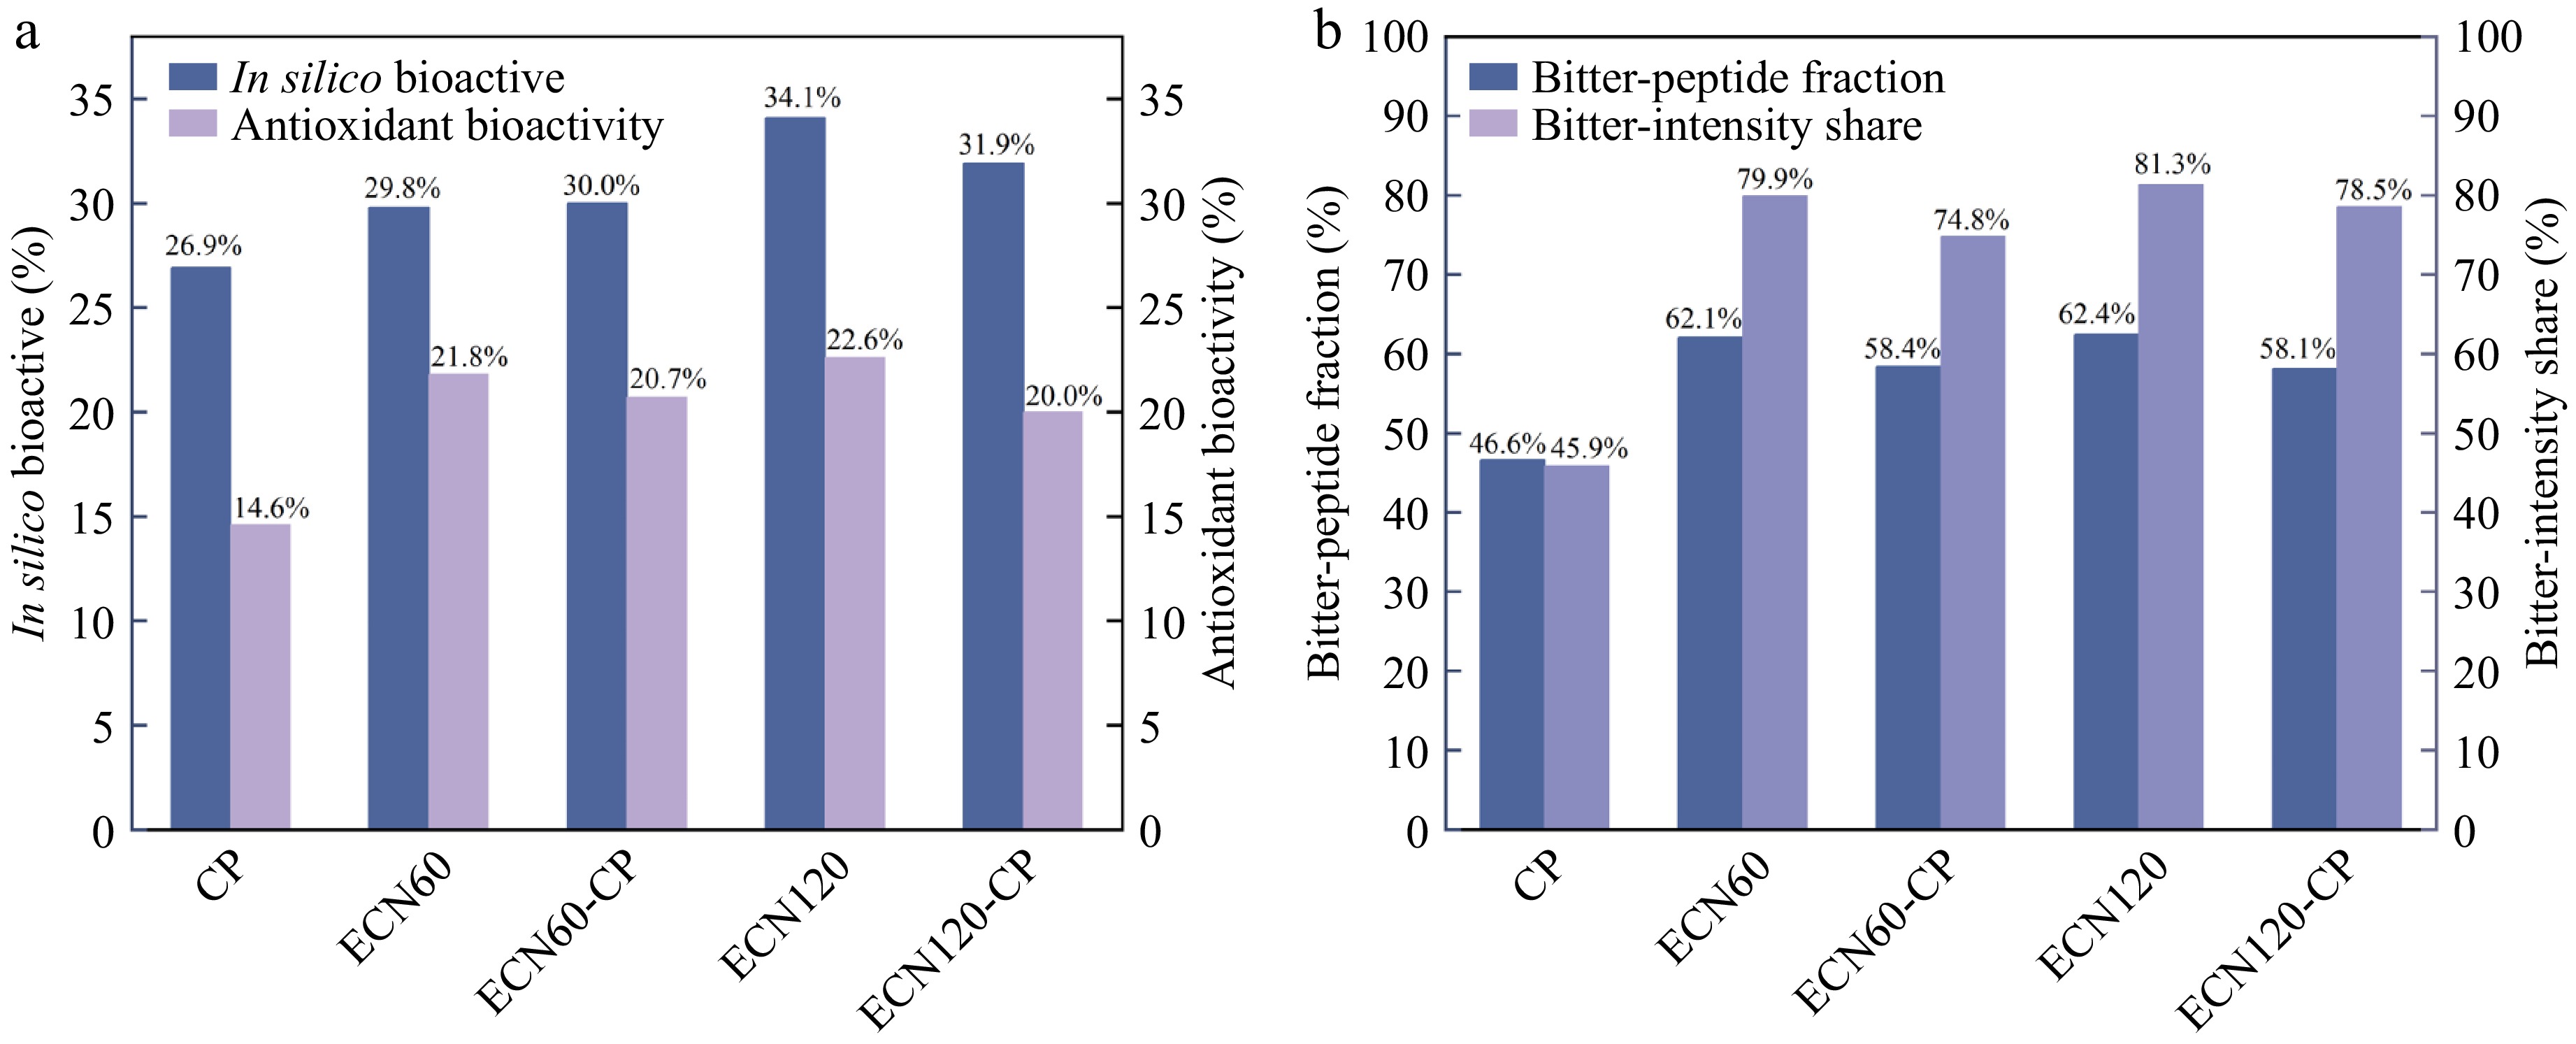
Figure 4.
Results of in silico prediction on CN: (a) bioactive analysis of peptide sequences; (b) bitter peptide analysis.
-
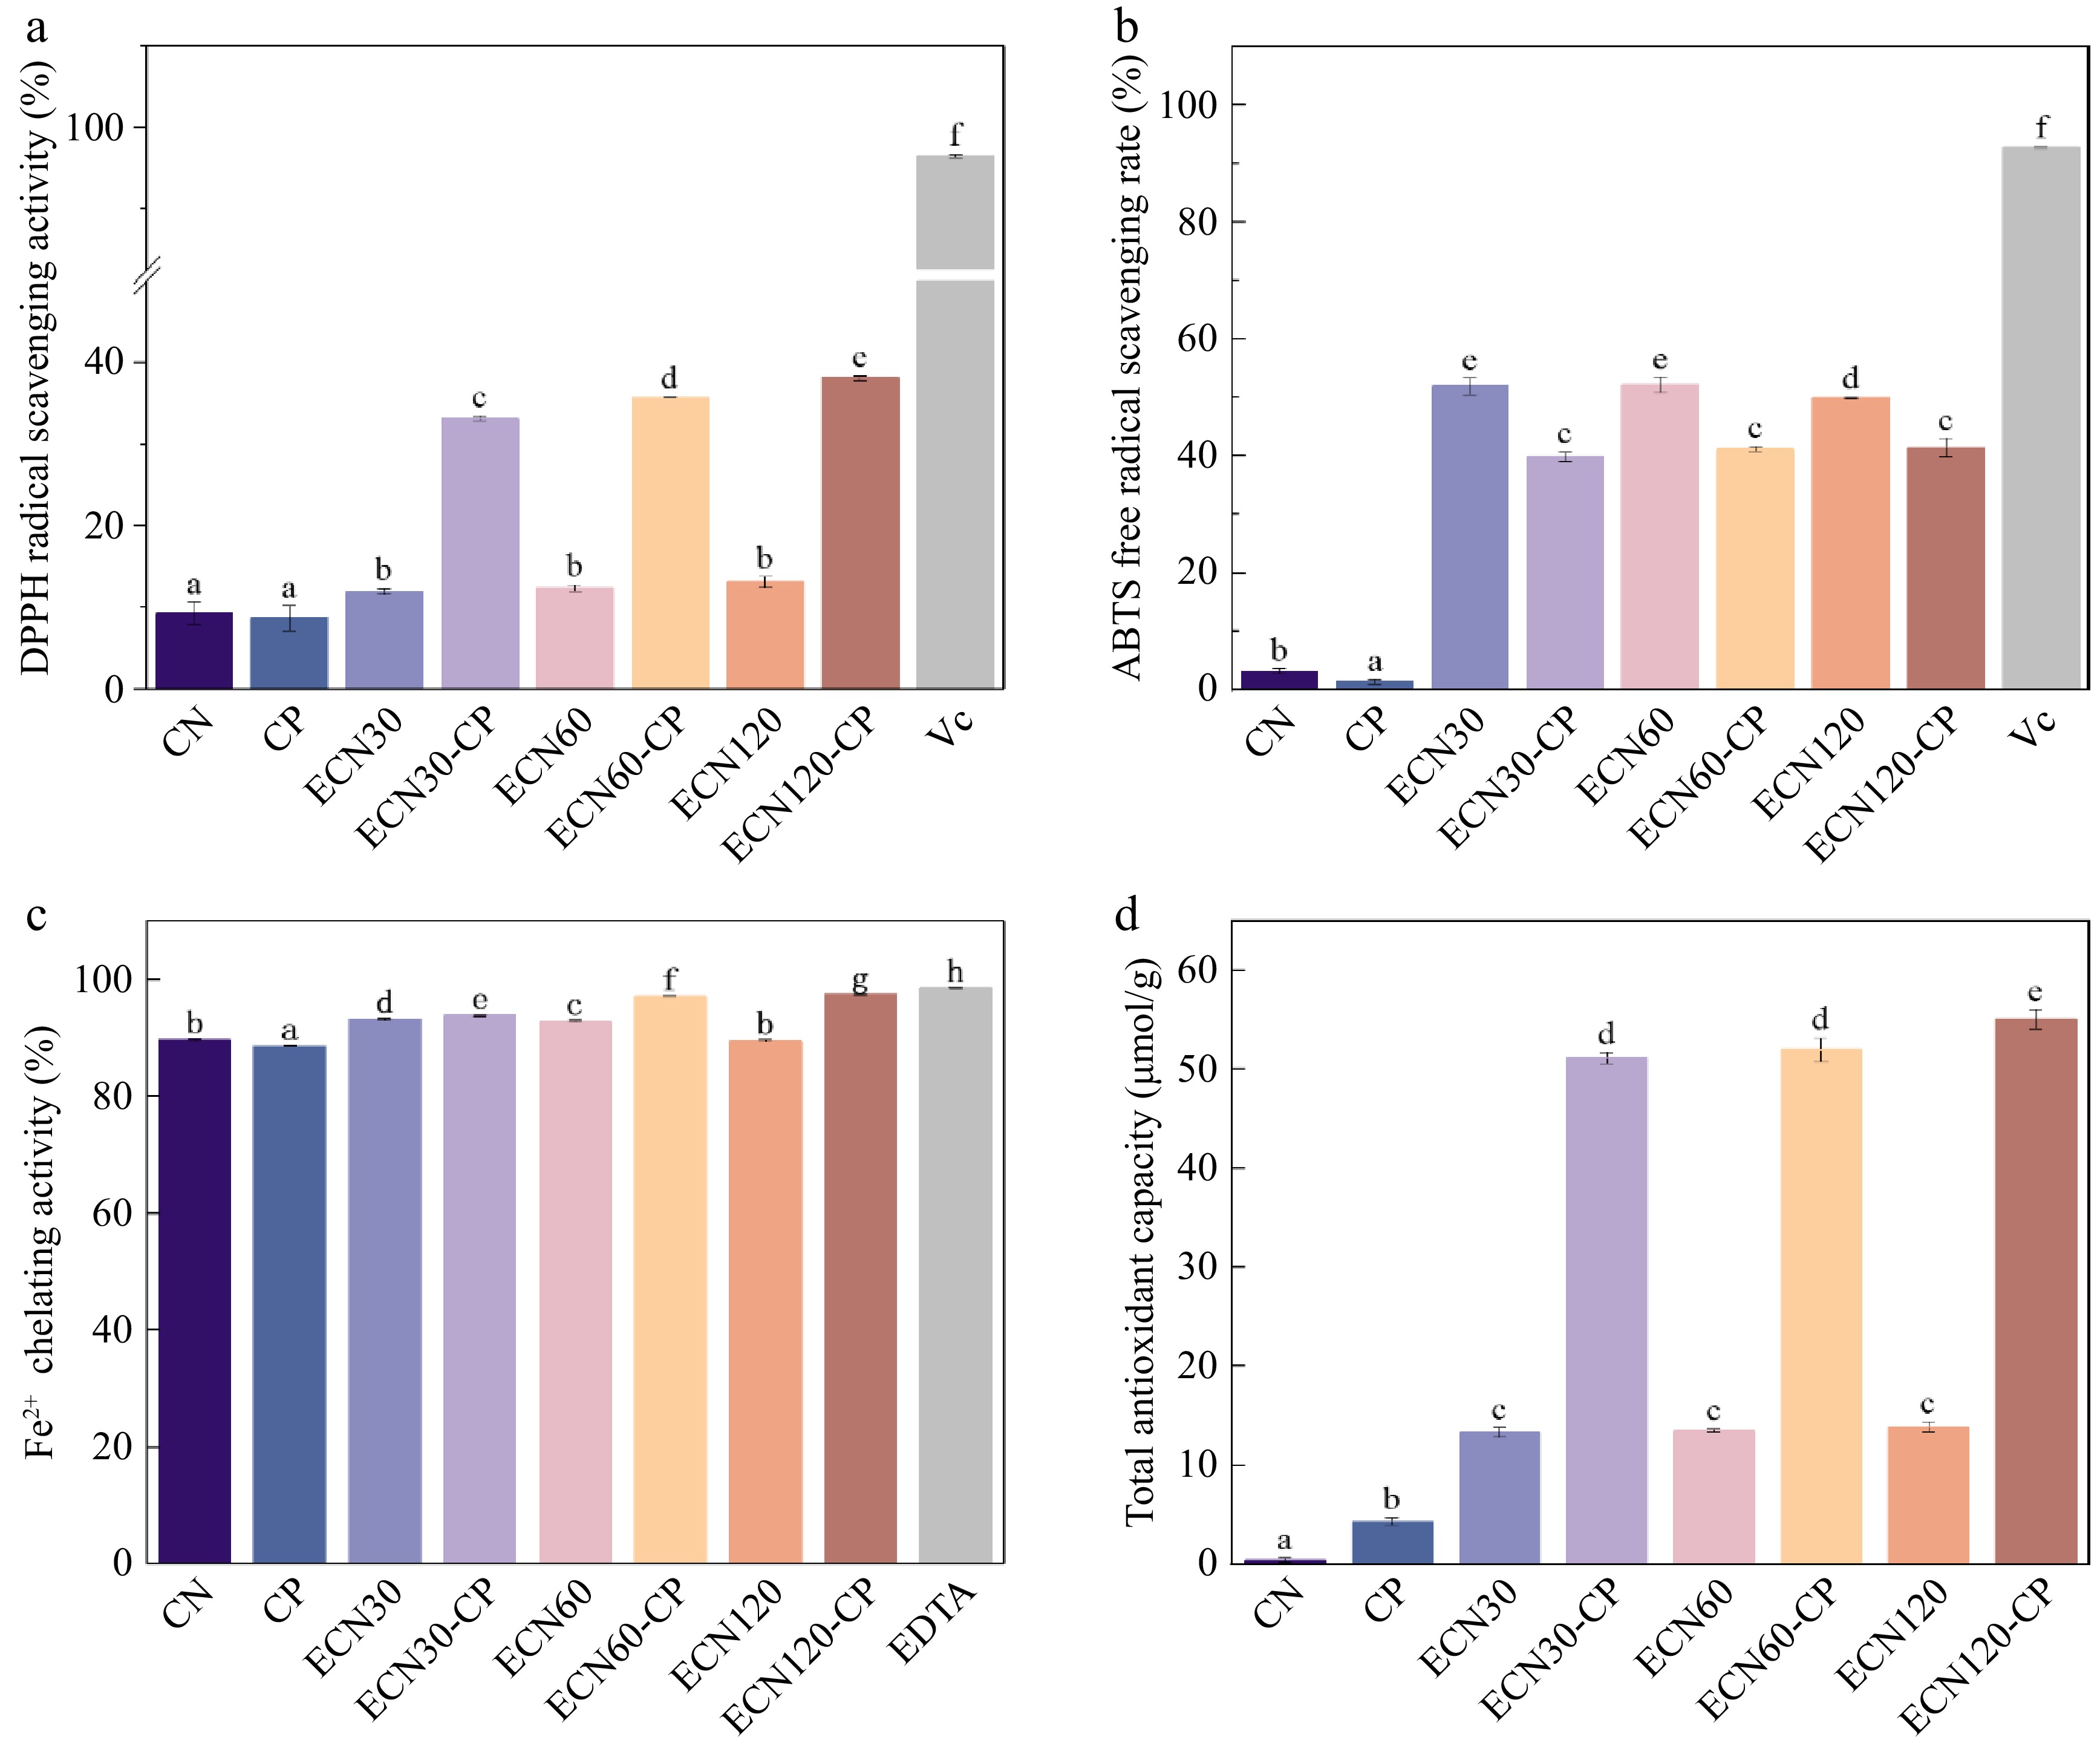
Figure 5.
Effects of different treatments on the antioxidant activity of CN: (a) DPPH radical scavenging activity; (b) ABTS radical scavenging activity; (c) ferrous ion chelation activity; (d) total antioxidant capacity. Different letters indicate significant differences between groups (p < 0.05).
-
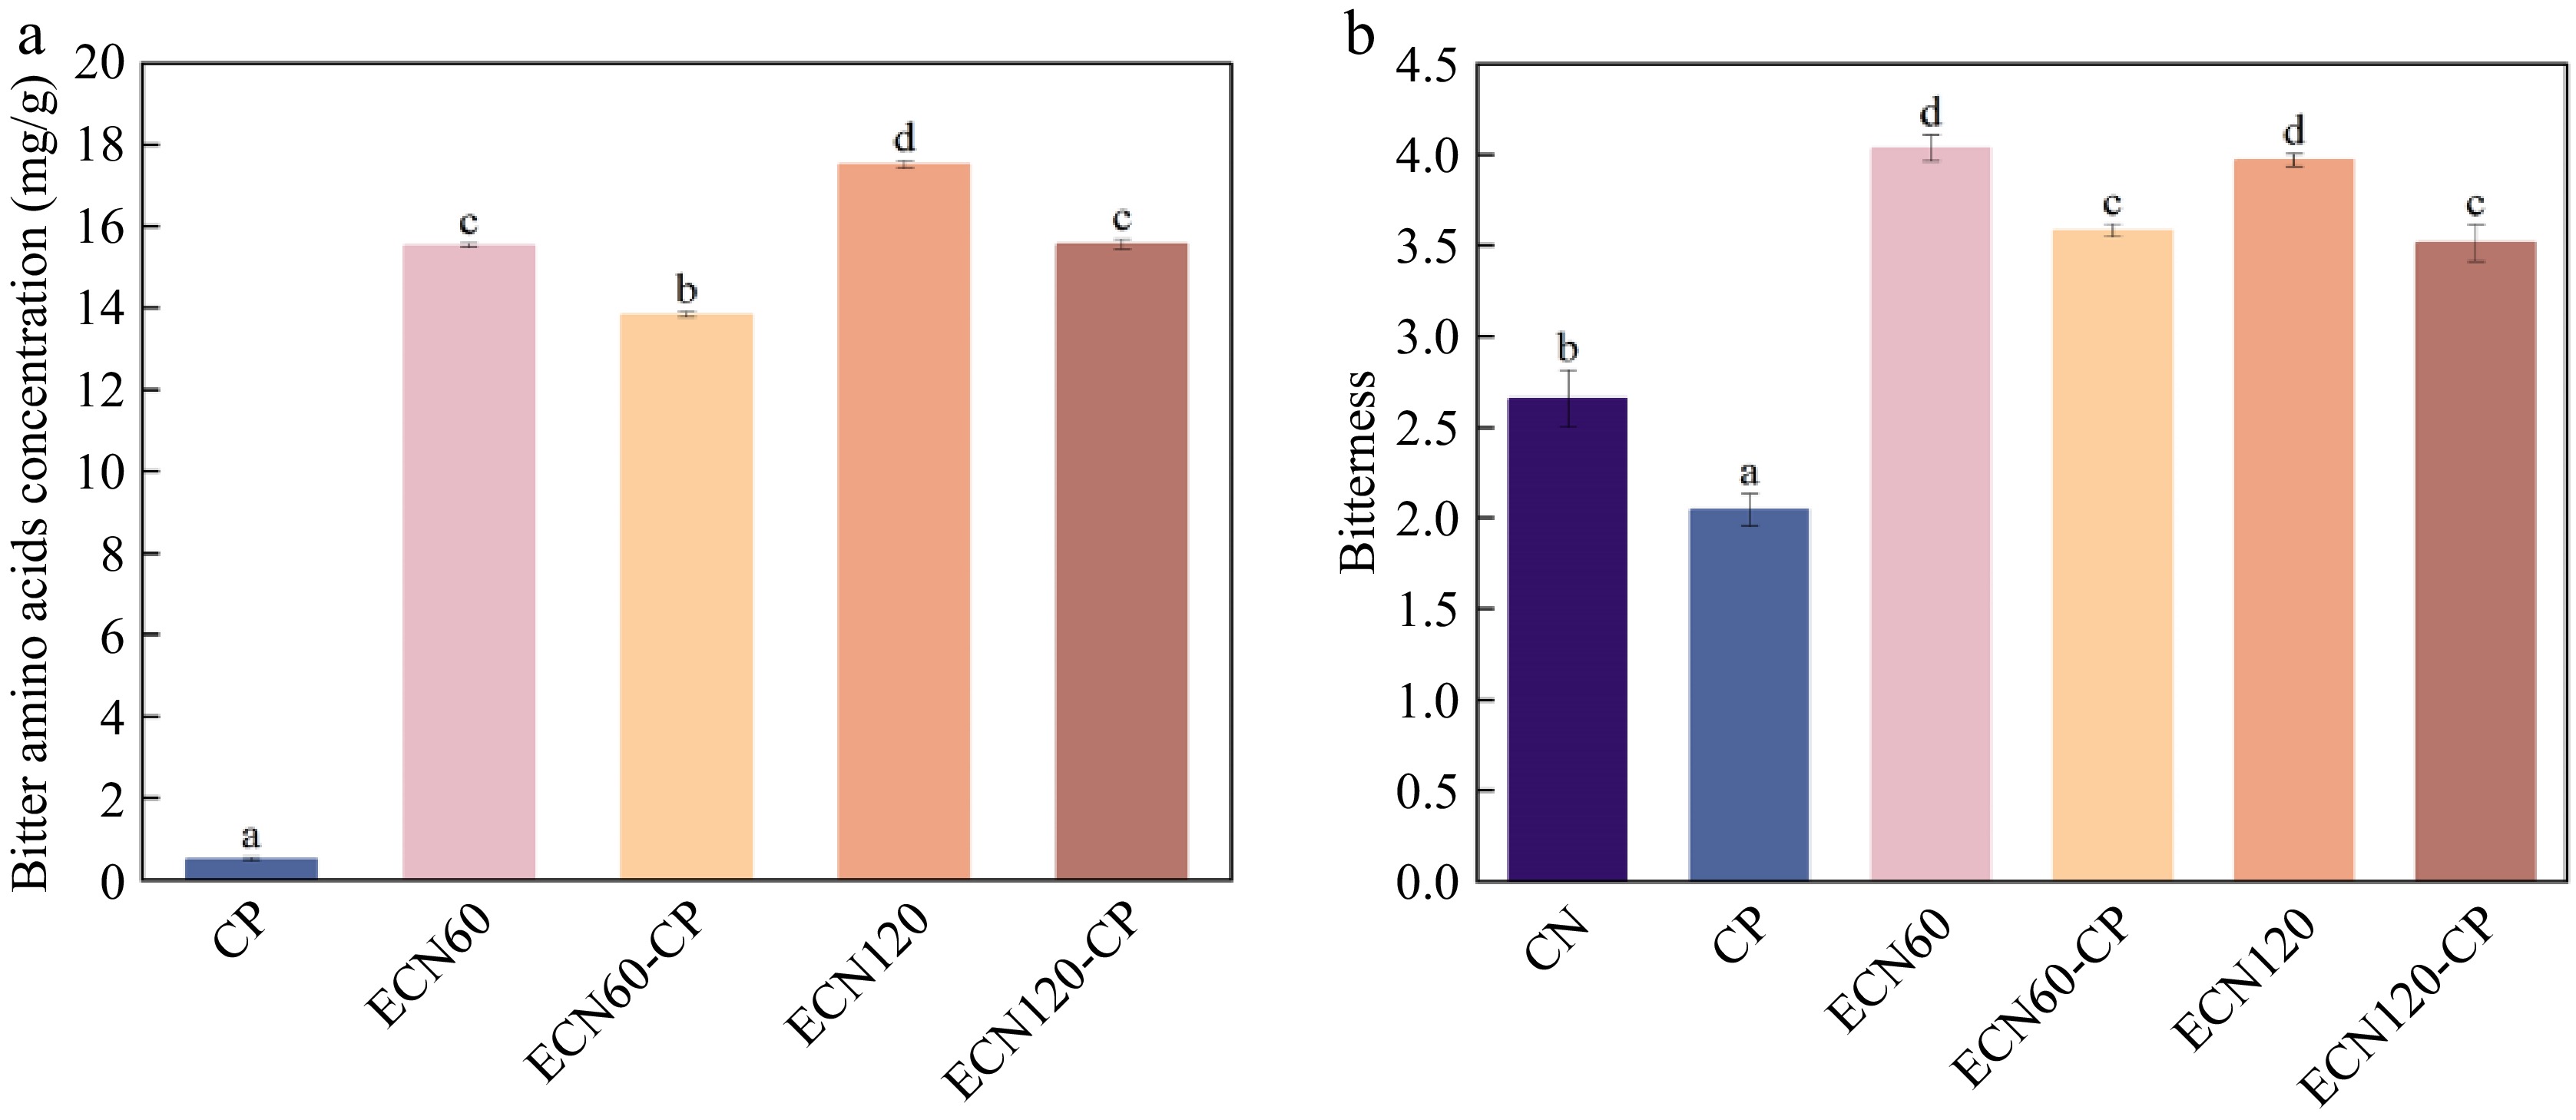
Figure 6.
Bitterness change of CN under different treatments: (a) total content of bitter free amino acids; (b) bitter taste value measured by electronic tongue. Different letters indicate significant differences between groups (p < 0.05).
-
Protein Start End Intensity ECN60 ECN60-CP ECN120 ECN120-CP αs1-CN 101 113 2.24 × 10⁸ 1.45 × 10⁸ 3.96 × 10⁷ 0 αs2-CN 132 143 2.24 × 10⁸ 3.14 × 10⁸ 1.48 × 10⁷ 1.97 × 10⁷ 180 187 3.90 × 10⁸ 3.39 × 10⁸ 2.99 × 10⁷ 0 206 215 1.86 × 10⁹ 9.20 × 10⁷ 2.53 × 10⁷ 0 β-CN 21 30 0 0 5.24 × 10⁷ 4.35 × 10⁶ 60 66 1.00 × 10¹⁰ 1.01 × 10¹⁰ 1.39 × 10¹⁰ 1.28 × 10¹⁰ 72 83 2.48 × 10¹⁰ 2.00 × 10¹⁰ 2.08 × 10¹⁰ 1.51 × 10¹⁰ 124 133 1.03 × 10¹¹ 7.84 × 10¹⁰ 7.42 × 10¹⁰ 5.96 × 10¹⁰ κ-CN 39 48 2.48 × 10⁹ 1.24 × 10⁹ 5.65 × 10⁸ 2.19 × 10⁷ 81 99 0 4.33 × 10⁶ 0 0 118 122 1.18 × 10¹⁰ 7.09 × 10⁹ 3.27 × 10⁹ 1.43 × 10⁹ 131 137 2.61 × 10⁸ 3.59 × 10⁸ 3.23 × 10⁹ 6.71 × 10⁸ Table 1.
Changes in epitope intensity of CNHs.
-
Amino acid CP ECN60 ECN60-CP ECN120 ECN120-CP Asp 0.016 ± 0.004ab 0.019 ± 0.003ab 0.027 ± 0.005b 0.007 ± 0.003a 0.020 ± 0.013b Glu 0.037 ± 0.006a 0.198 ± 0.006b 0.240 ± 0.016c 0.226 ± 0.039bc 0.257 ± 0.017c Thr 0.020 ± 0.003a 1.364 ± 0.034bc 1.325 ± 0.010b 1.435 ± 0.005c 1.421 ± 0.082c Ser 0.026 ± 0.003a 0.031 ± 0.002a 0.023 ± 0.009a 0.036 ± 0.009a 0.036 ± 0.010a Gly 0.056 ± 0.007a 0.128 ± 0.01b 0.170 ± 0.019c 0.132 ± 0.019b 0.193 ± 0.024c Ala 0.012 ± 0.001a 0.162 ± 0.019c 0.145 ± 0.003bc 0.114 ± 0.029b 0.112 ± 0.031b Pro 0.080 ± 0.013a 0.138 ± 0.013b 0.141 ± 0.023b 0.106 ± 0.002a 0.135 ± 0.013b Lys 0.031 ± 0.011a 0.071 ± 0.006b 0.095 ± 0.004c 0.096 ± 0.002c 0.120 ± 0.007d Cys 0.422 ± 0.015a 0.653 ± 0.016b 0.775 ± 0.012d 0.706 ± 0.023c 0.865 ± 0.025e Val 0.091 ± 0.015a 0.376 ± 0.017b 0.445 ± 0.020c 0.456 ± 0.009c 0.536 ± 0.021d Met 0.060 ± 0.017a 0.421 ± 0.032d 0.354 ± 0.006c 0.408 ± 0.009d 0.315 ± 0.011b Ile 0.088 ± 0.013b 0.042 ± 0.009a 0.036 ± 0.006a 0.073 ± 0.009b 0.043 ± 0.006a Leu 0.053 ± 0.007a 0.318 ± 0.032c 0.266 ± 0.016b 0.337 ± 0.011c 0.323 ± 0.014c Tyr 0.075 ± 0.013a 5.074 ± 0.060c 4.744 ± 0.082b 5.728 ± 0.088d 5.072 ± 0.118c Phe 0.048 ± 0.015a 7.135 ± 0.028c 6.275 ± 0.006b 7.944 ± 0.002d 7.153 ± 0.021c His 0.021 ± 0.008a 1.611 ± 0.024c 1.228 ± 0.030b 2.105 ± 0.028d 1.635 ± 0.020c Arg 0.071 ± 0.012a 0.557 ± 0.014d 0.490 ± 0.014c 0.456 ± 0.007b 0.481 ± 0.005c Total 1.208 ± 0.027a 18.300 ± 0.025c 16.776 ± 0.036b 20.365 ± 0.032e 18.717 ± 0.023d Different letters indicate significant differences between groups (p < 0.05). Table 2.
Effect of different treatments on the free amino acid composition of CN (mg/g); the last eight amino acids in the table belong to the category of bitter amino acids[58].
Figures
(6)
Tables
(2)