-
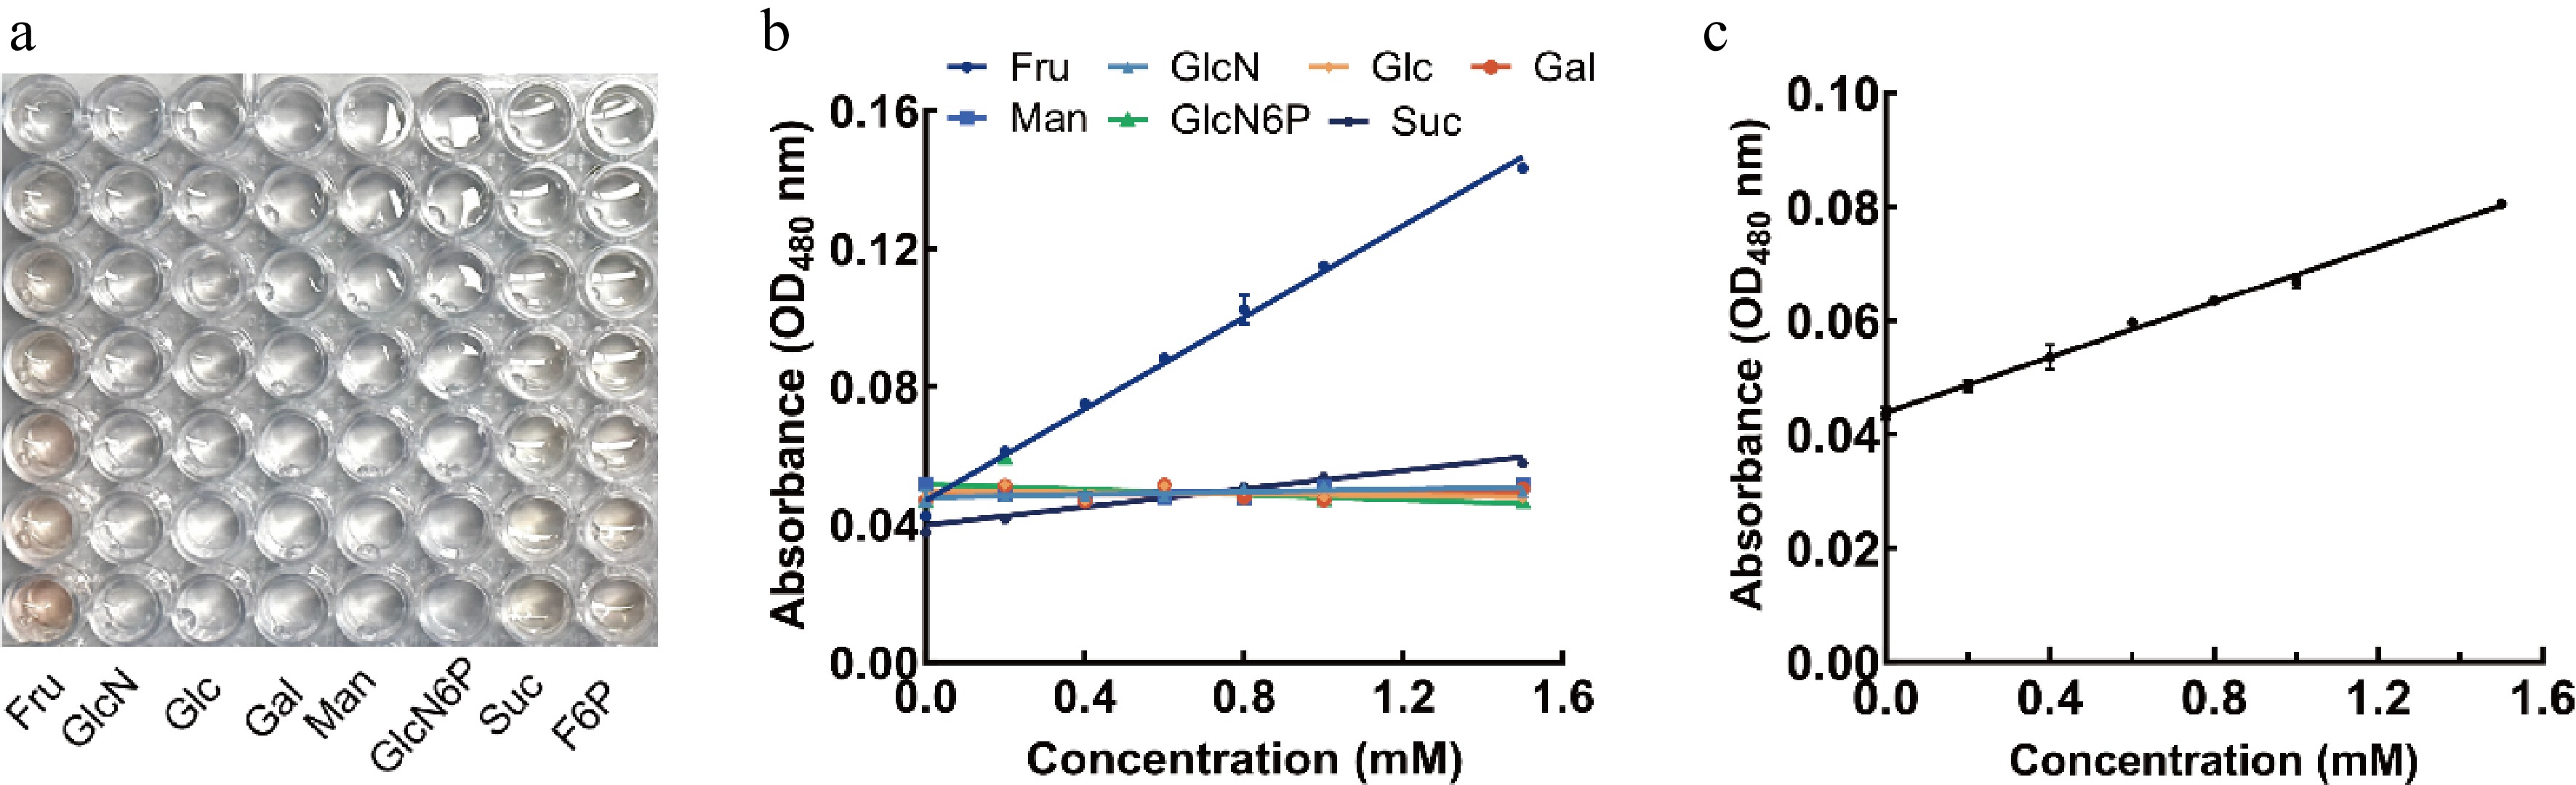
Figure 1.
Color changes and calibration curves of the Seliwanoff colorimetric assay for detecting sugar. (a) Color changes of seven sugars in a 96-well plate system (0−1.5 mM). (b) Calibration curve of fructose. (c) Calibration curve of fructose-6-phosphate (F6P).
-
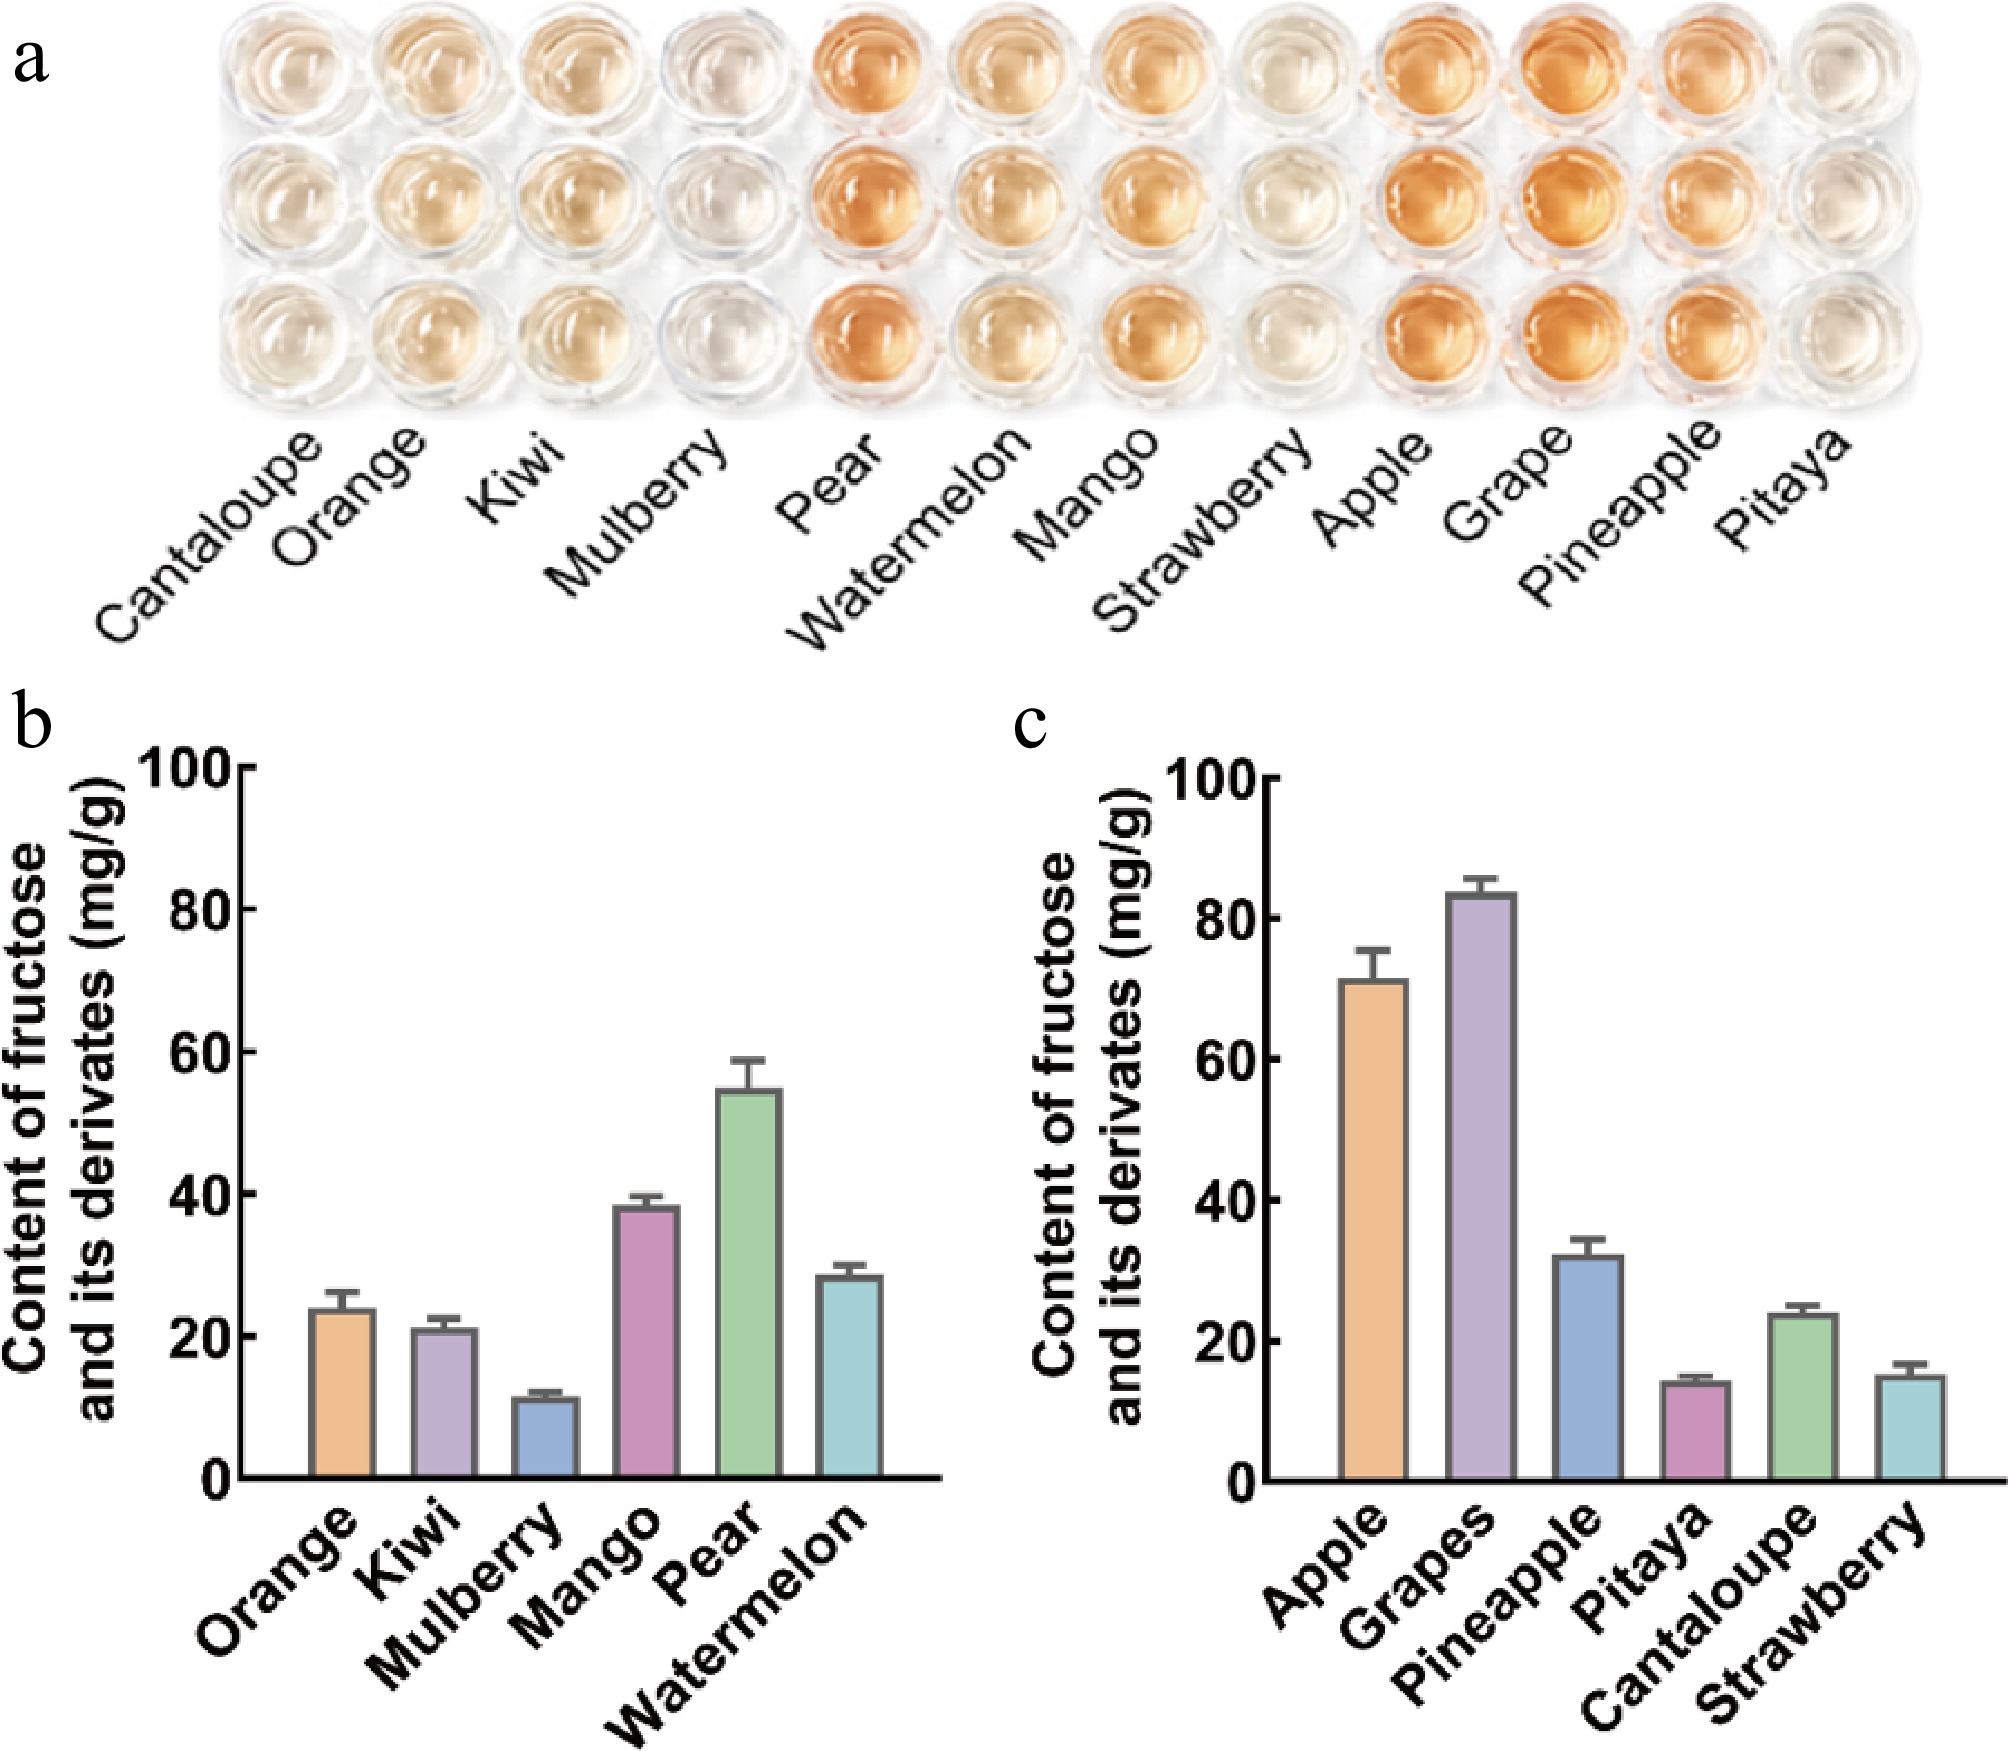
Figure 2.
Fructose determination in fruit samples using the optimized Seliwanoff assay. (a) Colorimetric responses of different fruit extracts in the 96-well microplate assay; (b) calibration-based quantification of fructose content; (c) distribution of fructose content among 12 fruit samples.
-
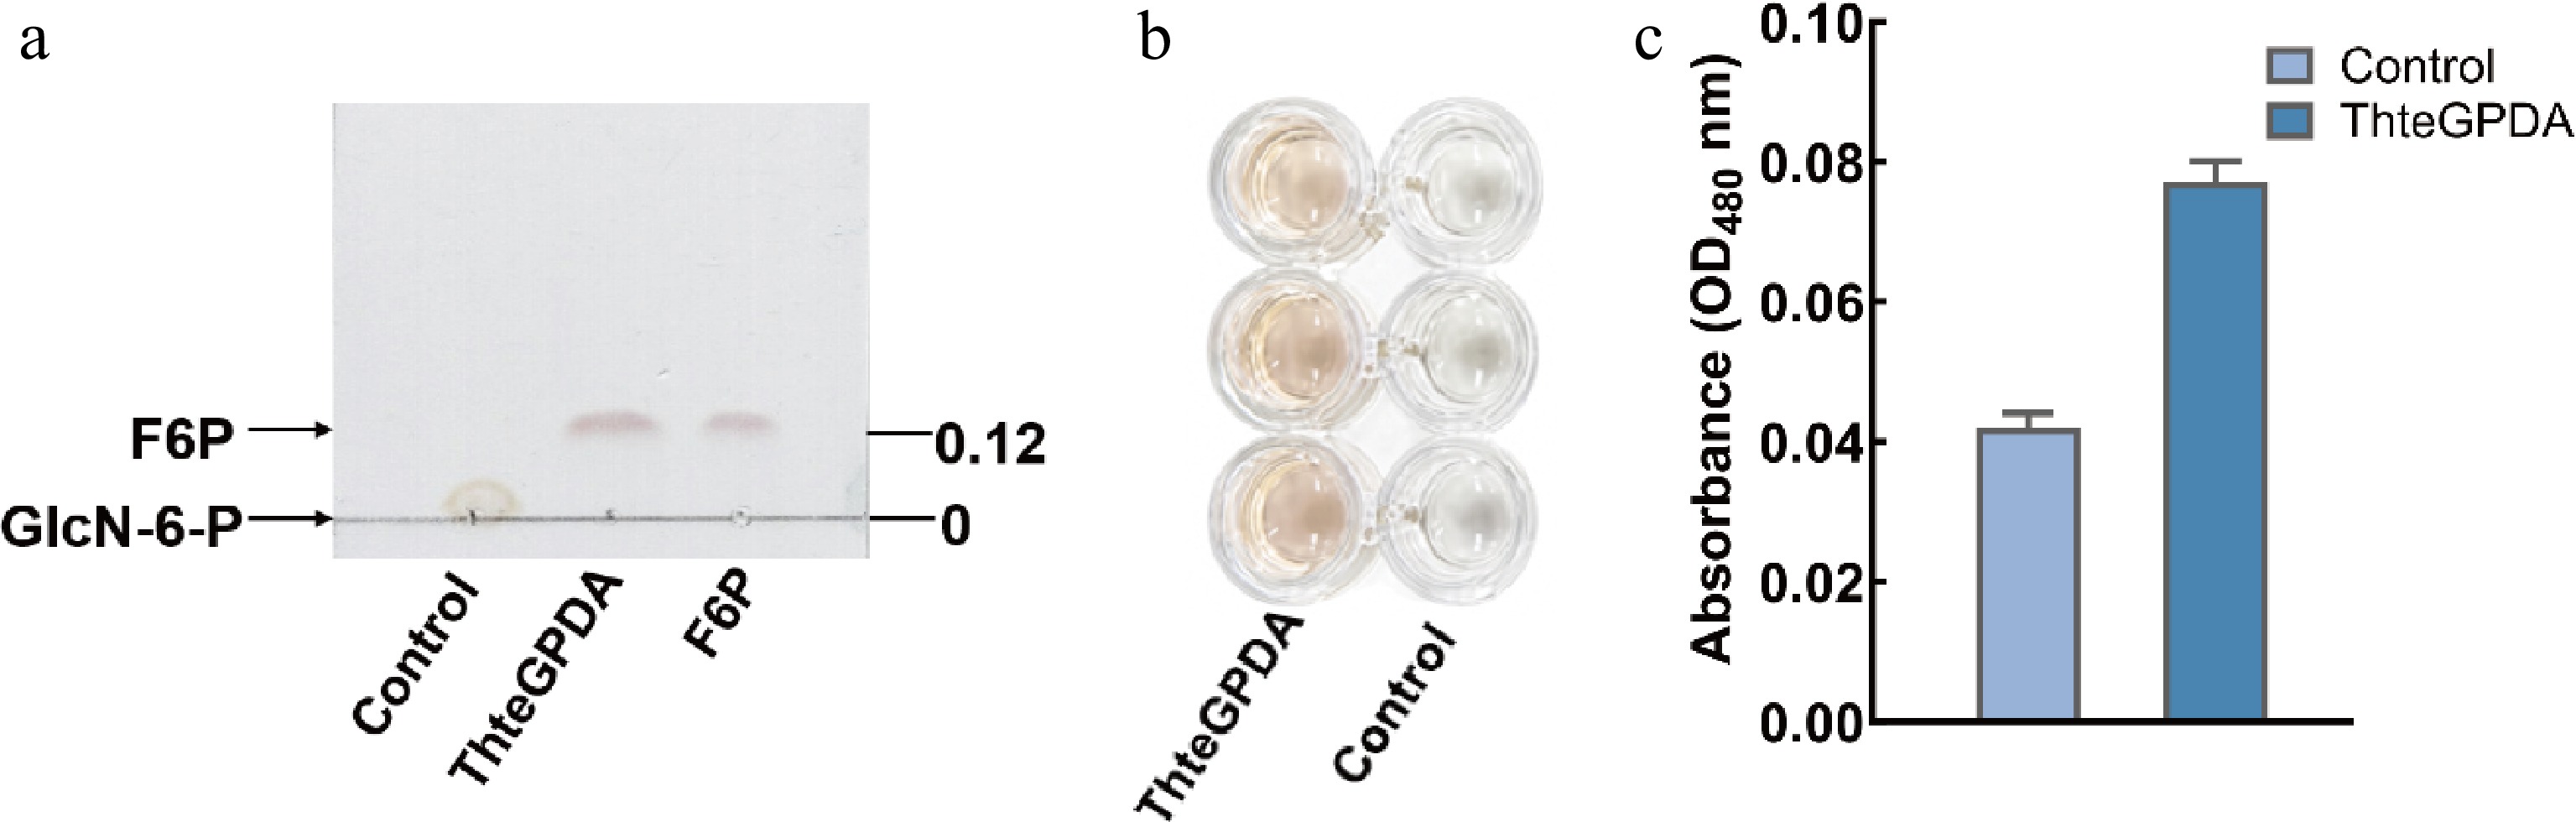
Figure 3.
Catalytic conversion of GlcN6P to F6P by ThteGPDA. (a) TLC analysis of the reaction mixture. Lanes correspond to the negative control (GlcN6P without the enzyme), the enzymatic reaction system, and the F6P standard. (b) Representative visual color change in the Seliwanoff assay. (c) Absorbance response at 480 nm of the reaction system compared with the control.
-
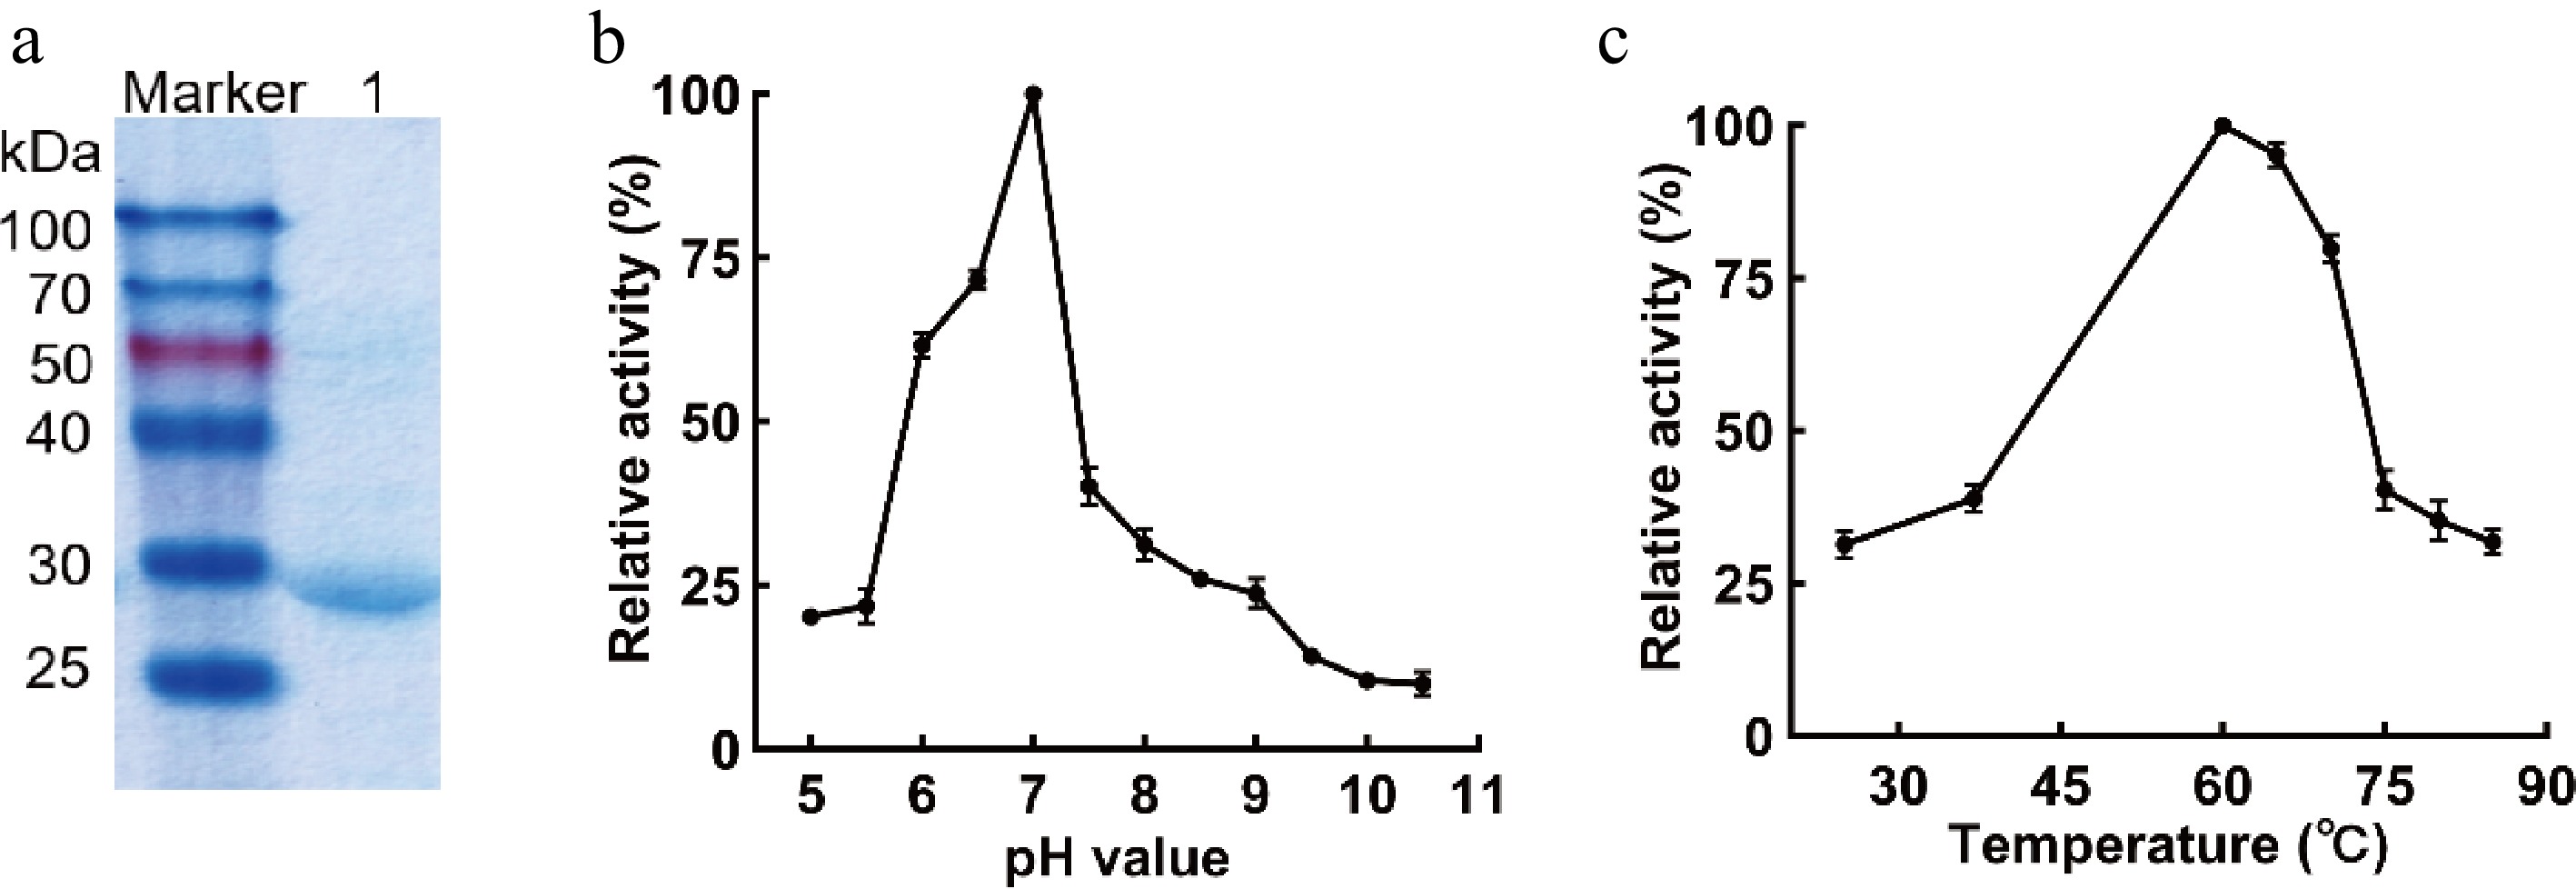
Figure 4.
Biochemical properties of ThteGPDA. (a) SDS-PAGE analysis of recombinant ThteGPDA purification. Lane marker, protein molecular weight marker; Lane 1, purified ThteGPDA obtained by Ni2+-NTA affinity chromatography; (b) pH-dependent activity profile of ThteGPDA; (c) temperature-dependent activity profile of ThteGPDA.
Figures
(4)
Tables
(0)