-
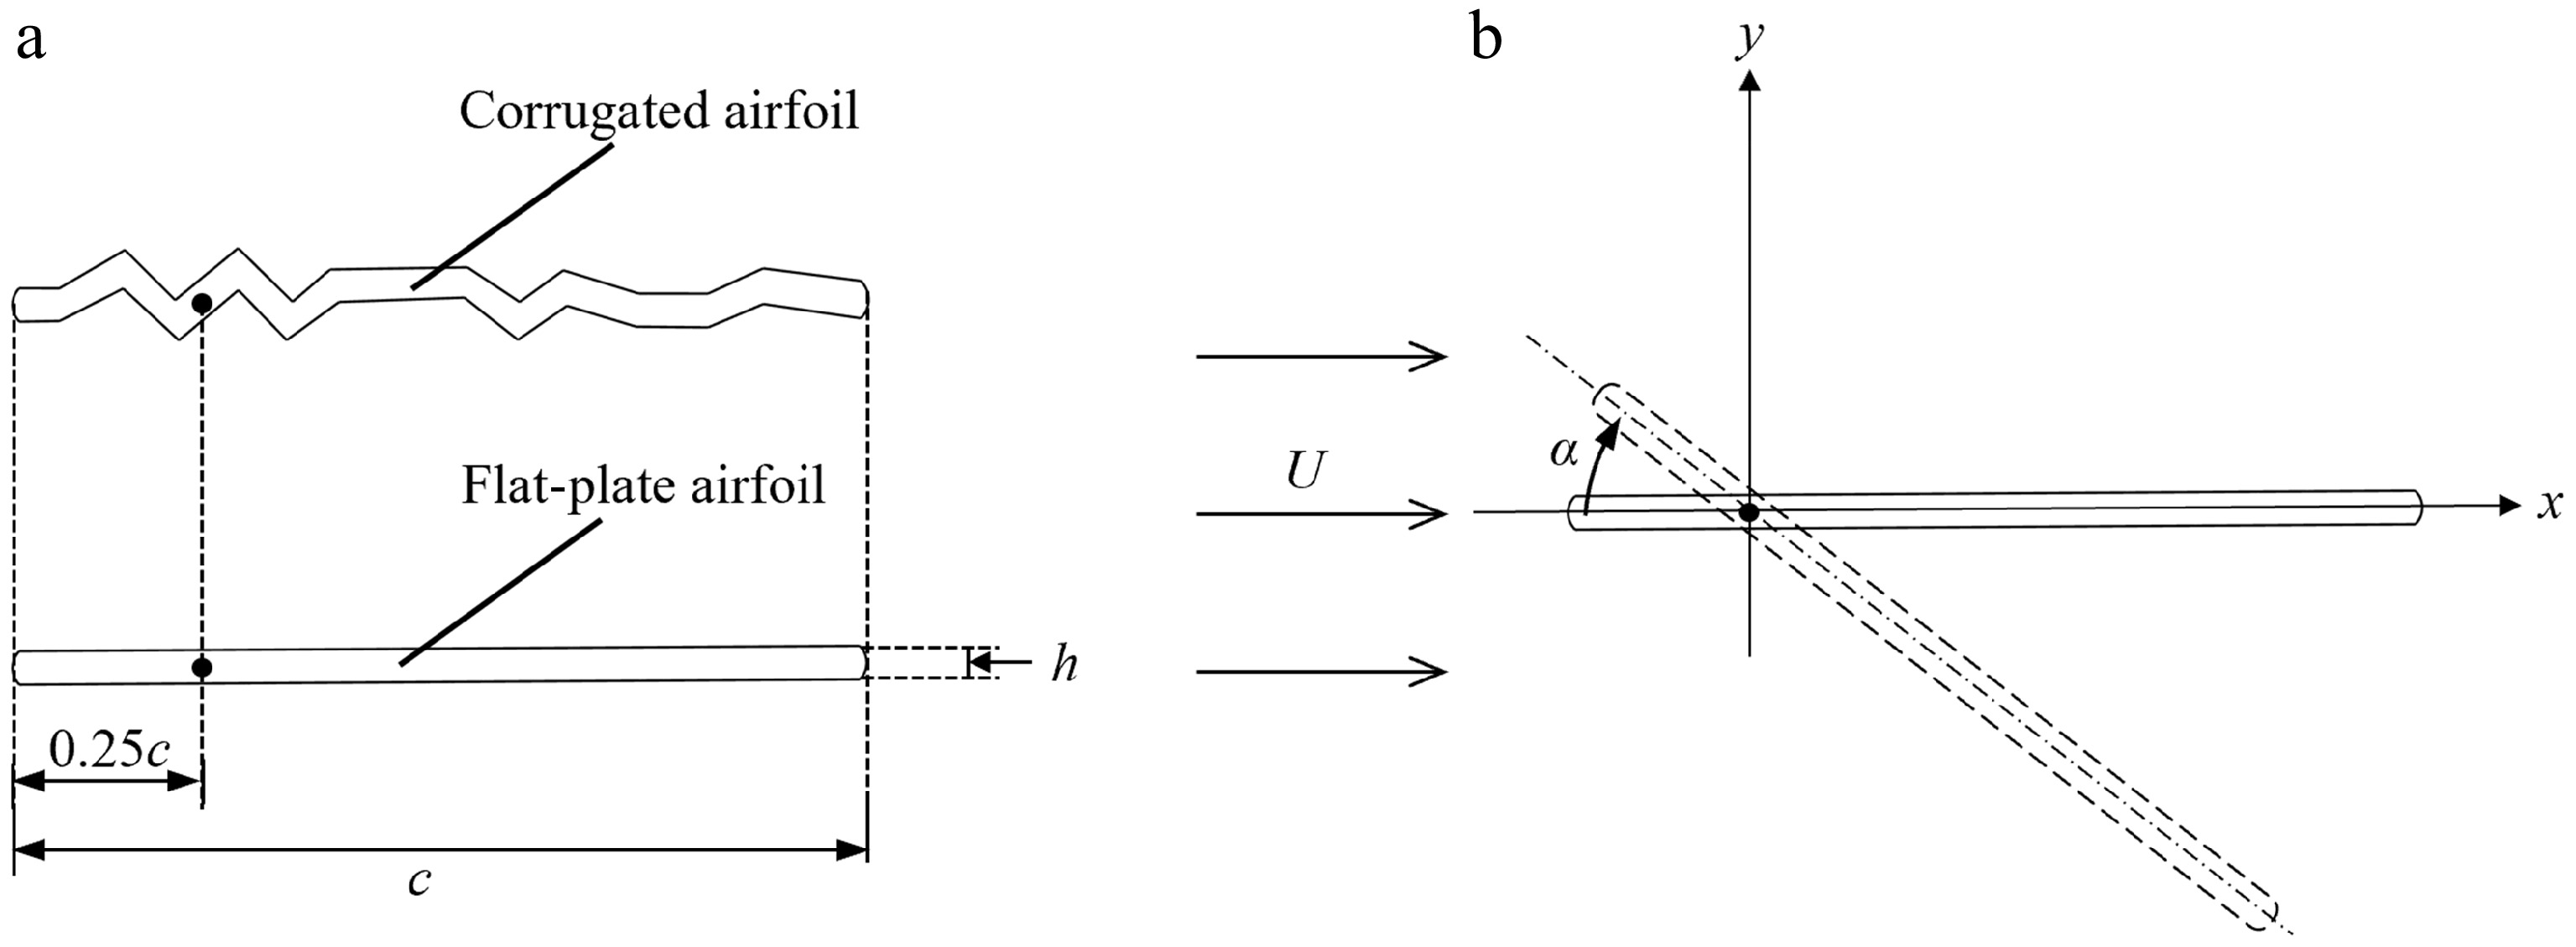
Figure 1.
Schematic of (a) corrugated[17] and flat-plate geometry, and (b) pitching motion.
-
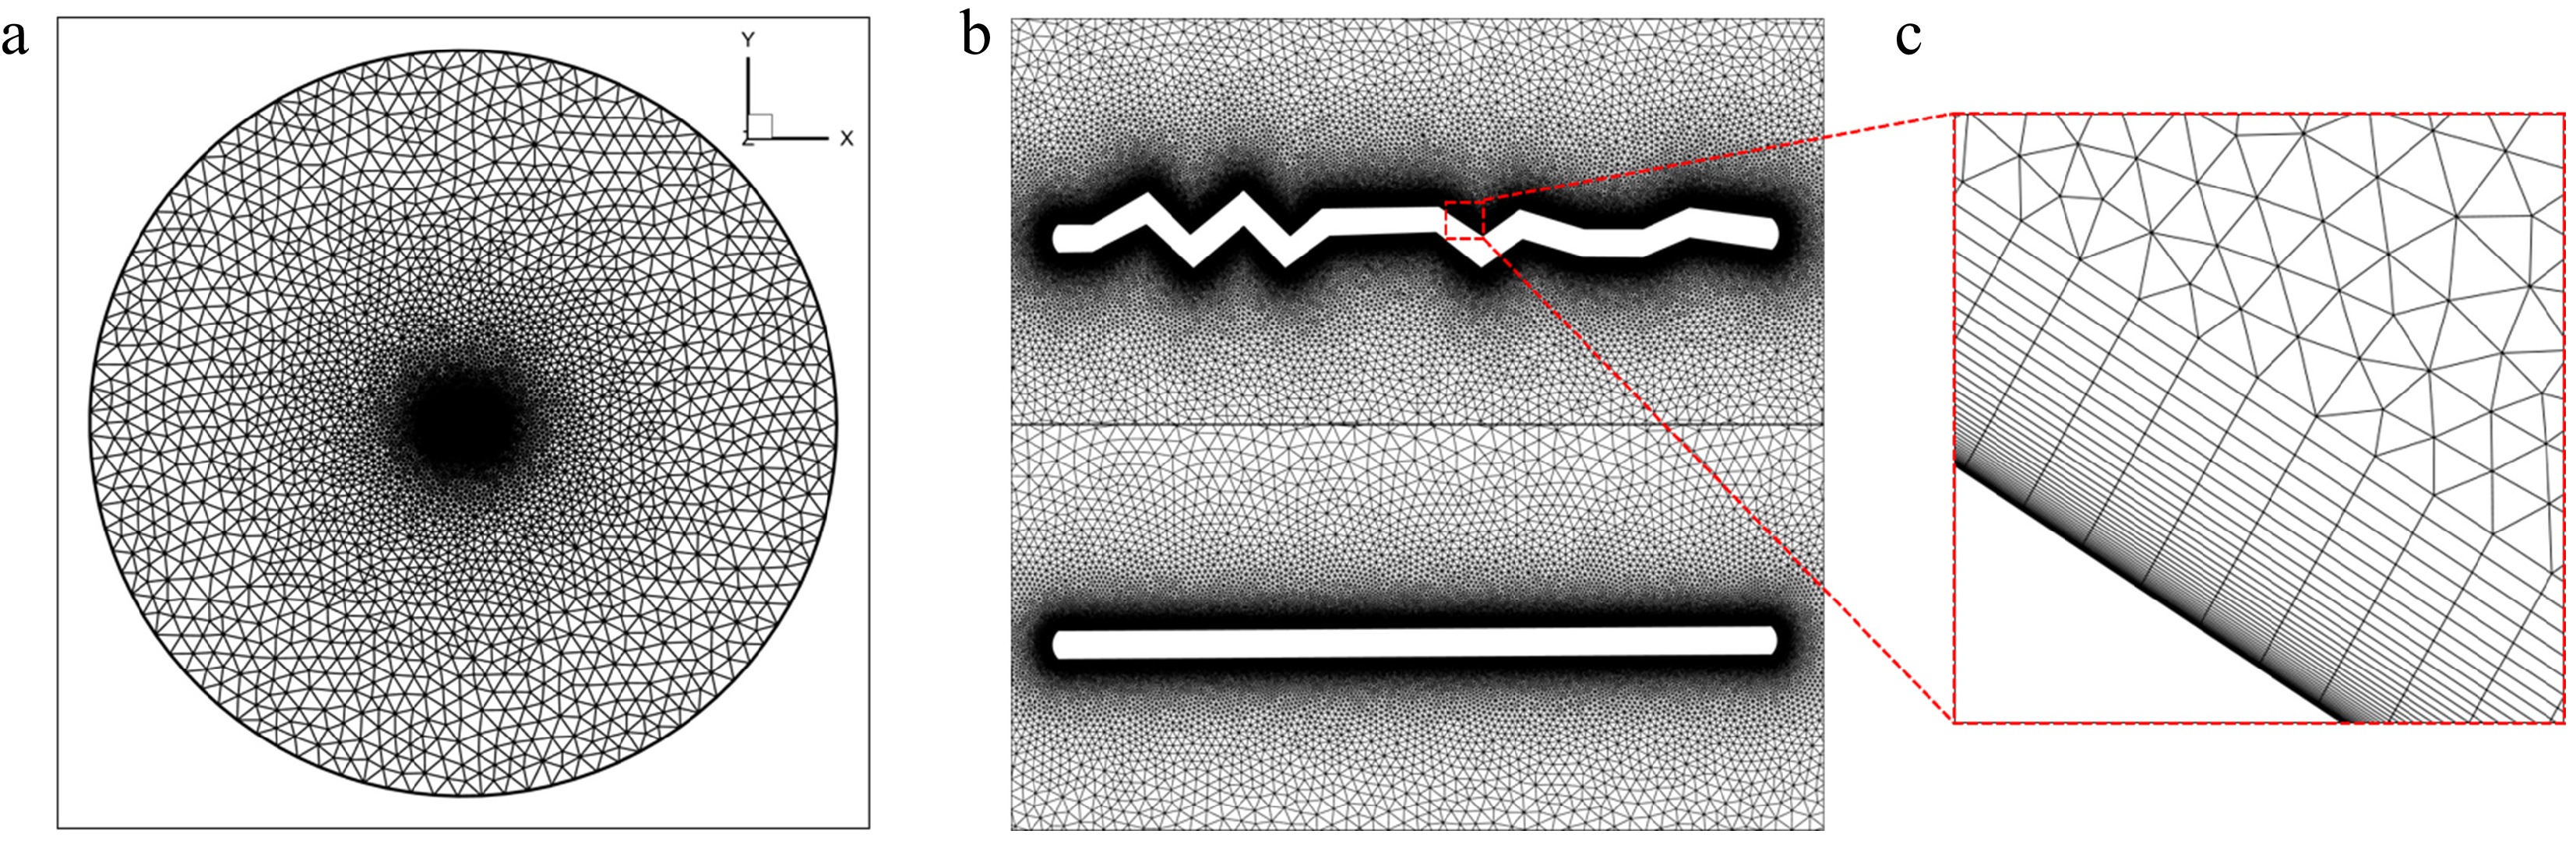
Figure 2.
Portions of the O-type unstructured computational mesh: (a) in the computational domain, (b) around the two airfoils, and (c) in the locally refined region near the corrugated airfoil.
-
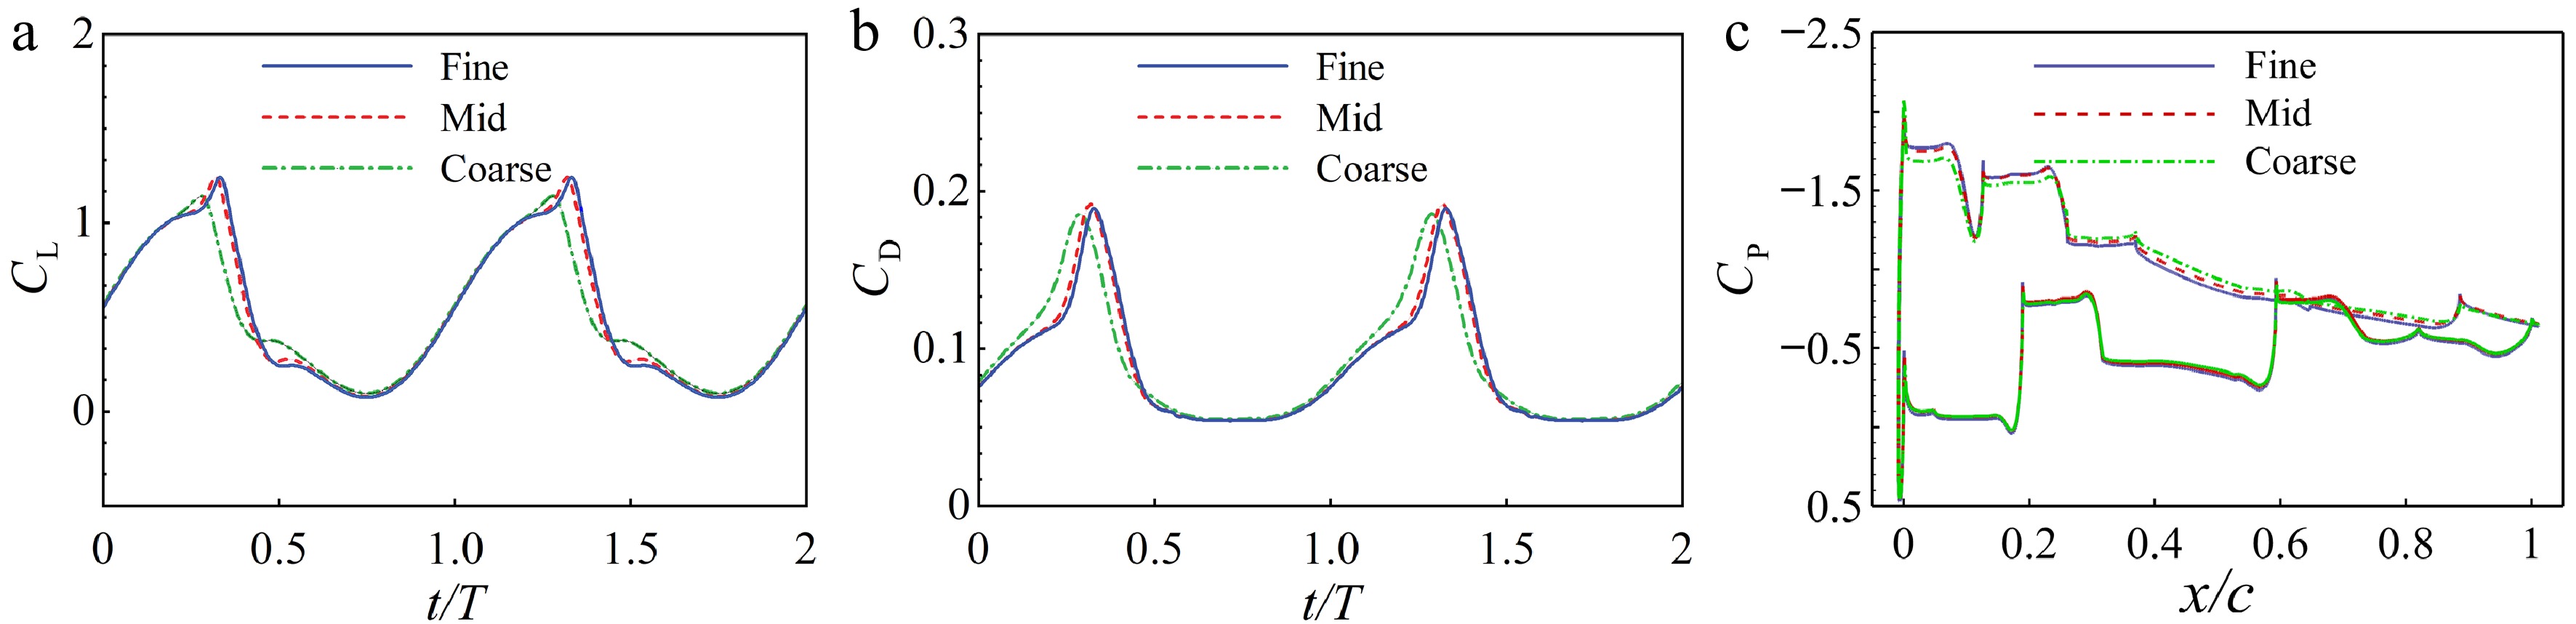
Figure 3.
(a) Variation of CL, (b) variation of CD, and (c) variation of surface CP with different densities of meshes at t/T = 0.5.
-
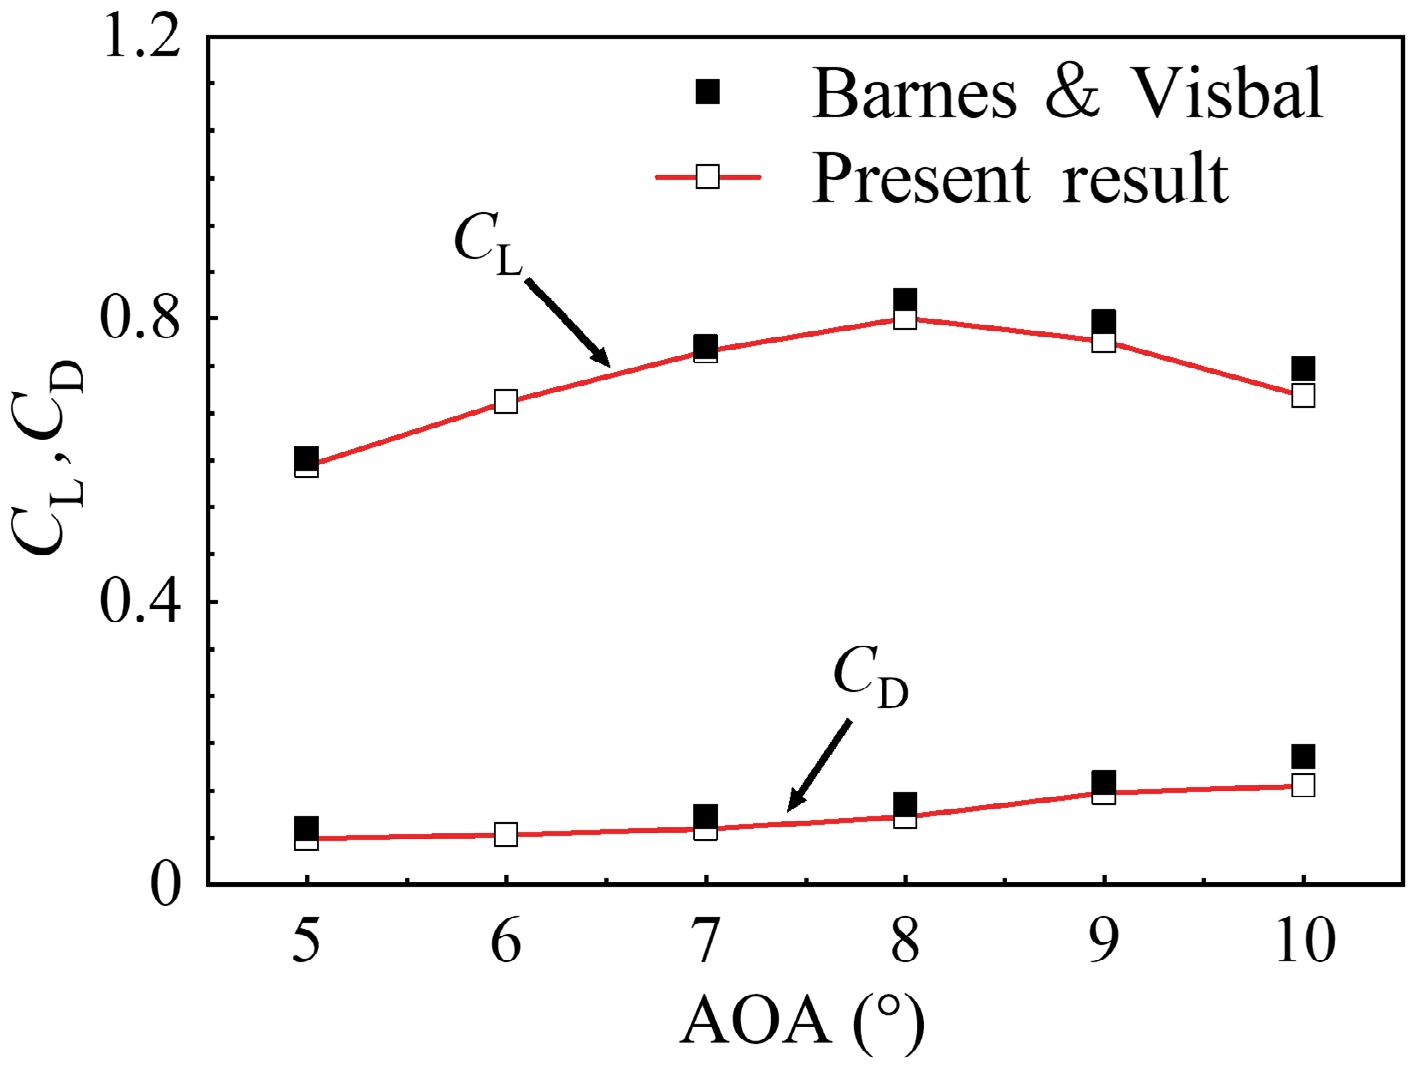
Figure 4.
Steady lift and drag coefficients at angles of attack from 5° to 10°.
-
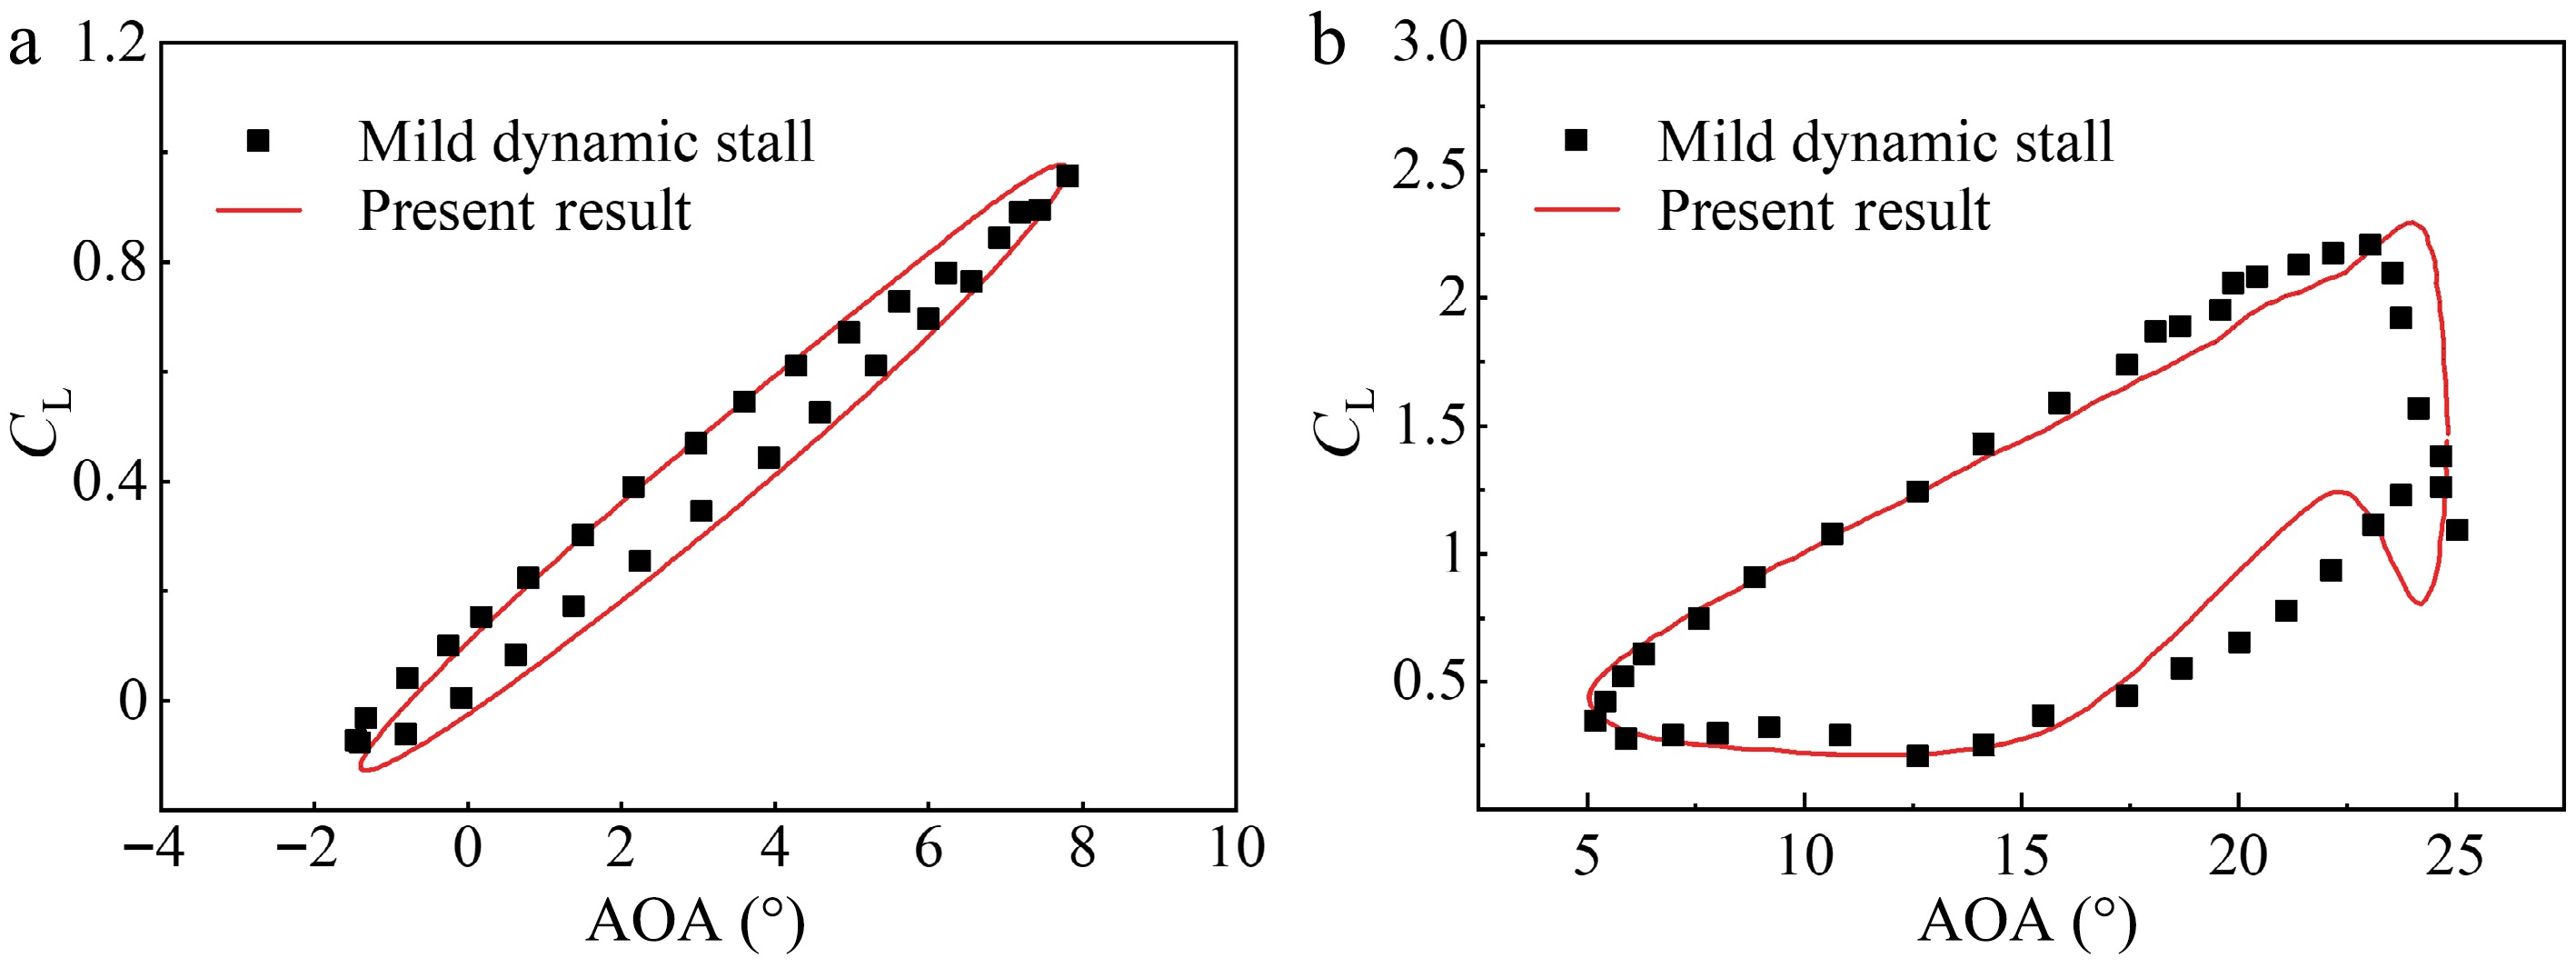
Figure 5.
Validation of lift coefficient against experimental data for (a) mild dynamic stall and (b) deep dynamic stall.
-
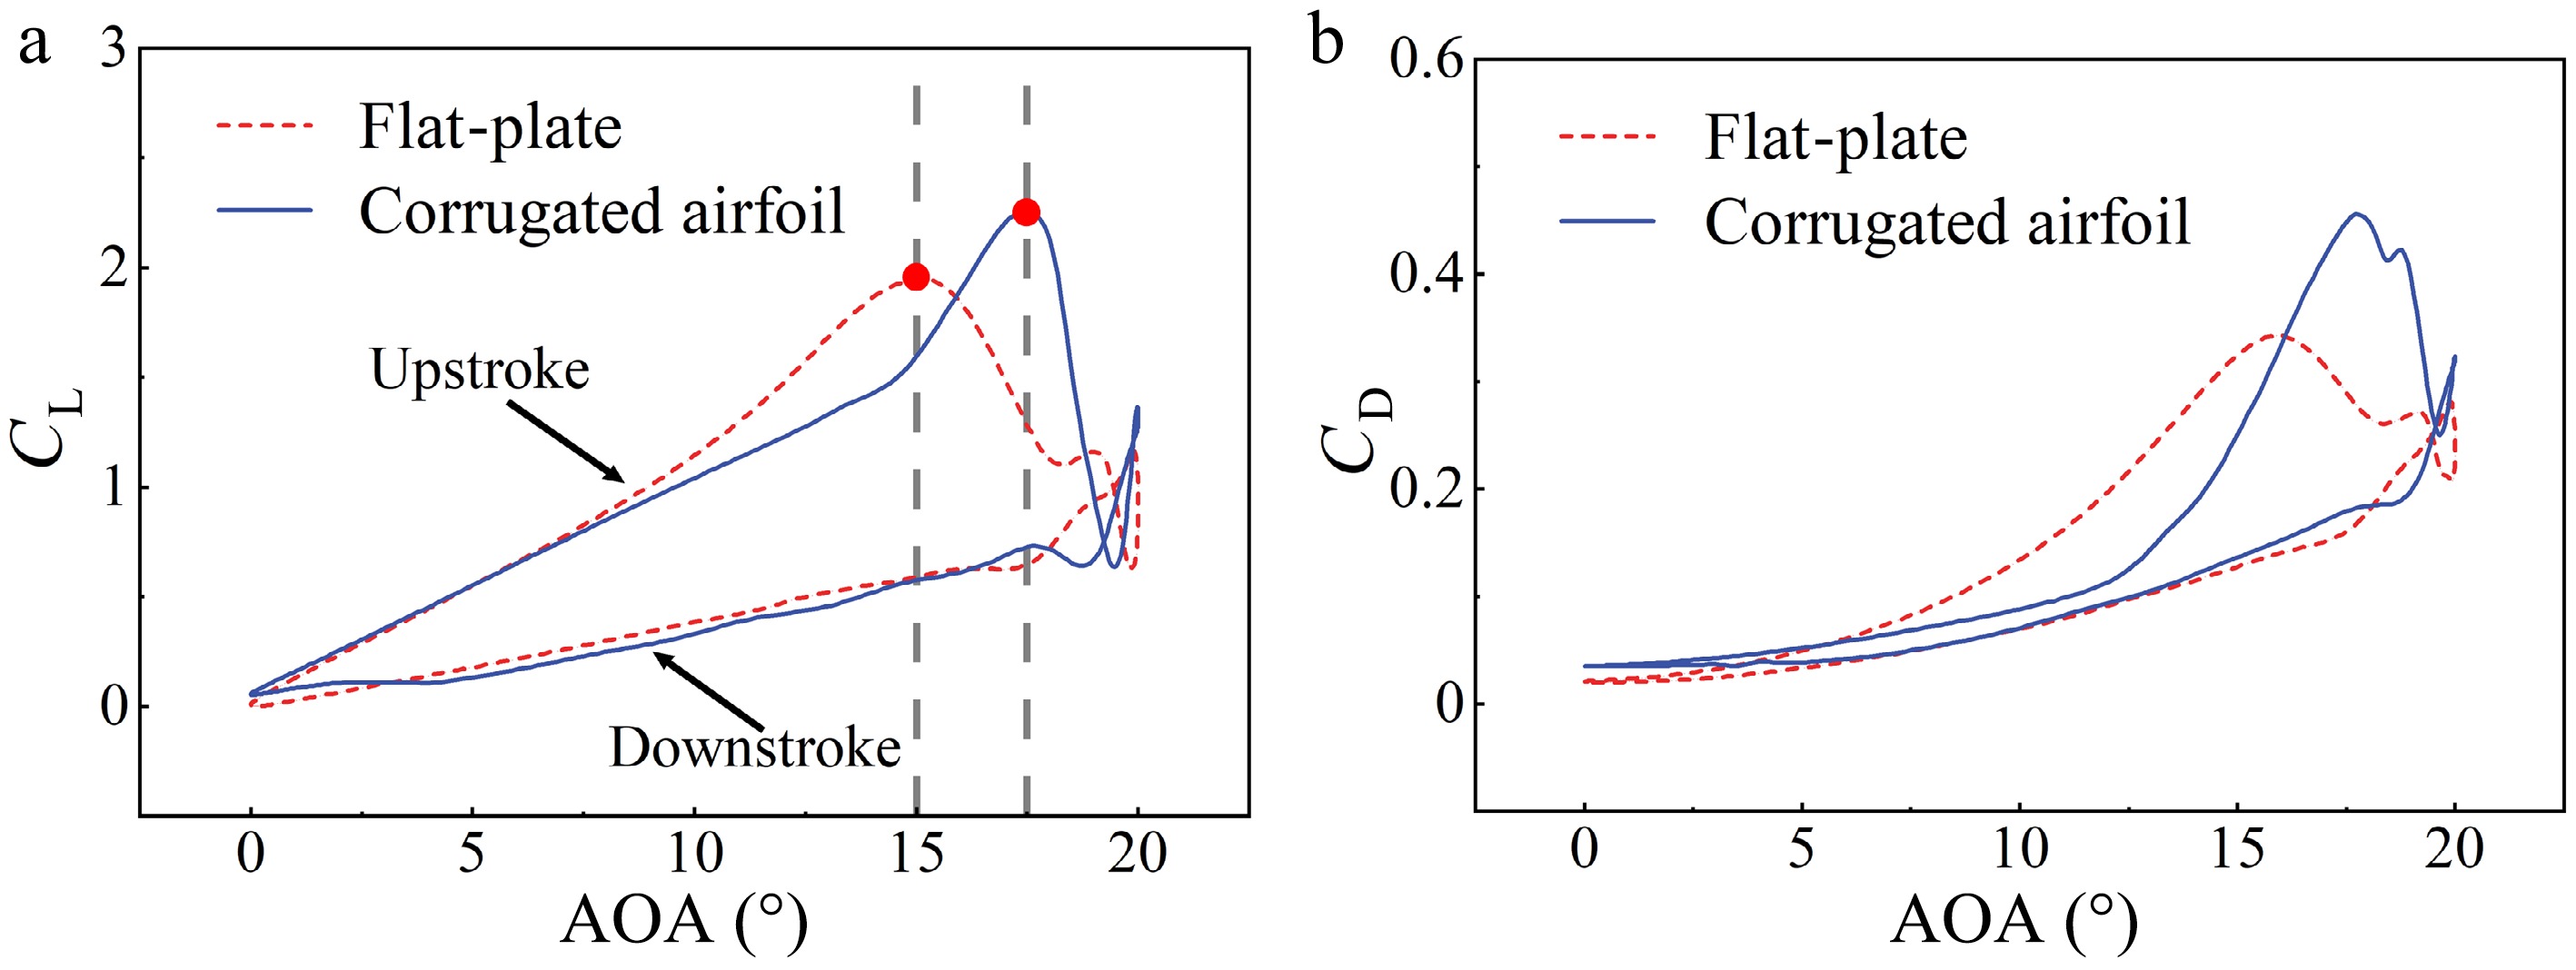
Figure 6.
Variations of (a) lift coefficient and (b) drag coefficient with the pitching angle for corrugated and flat-plate airfoils.
-
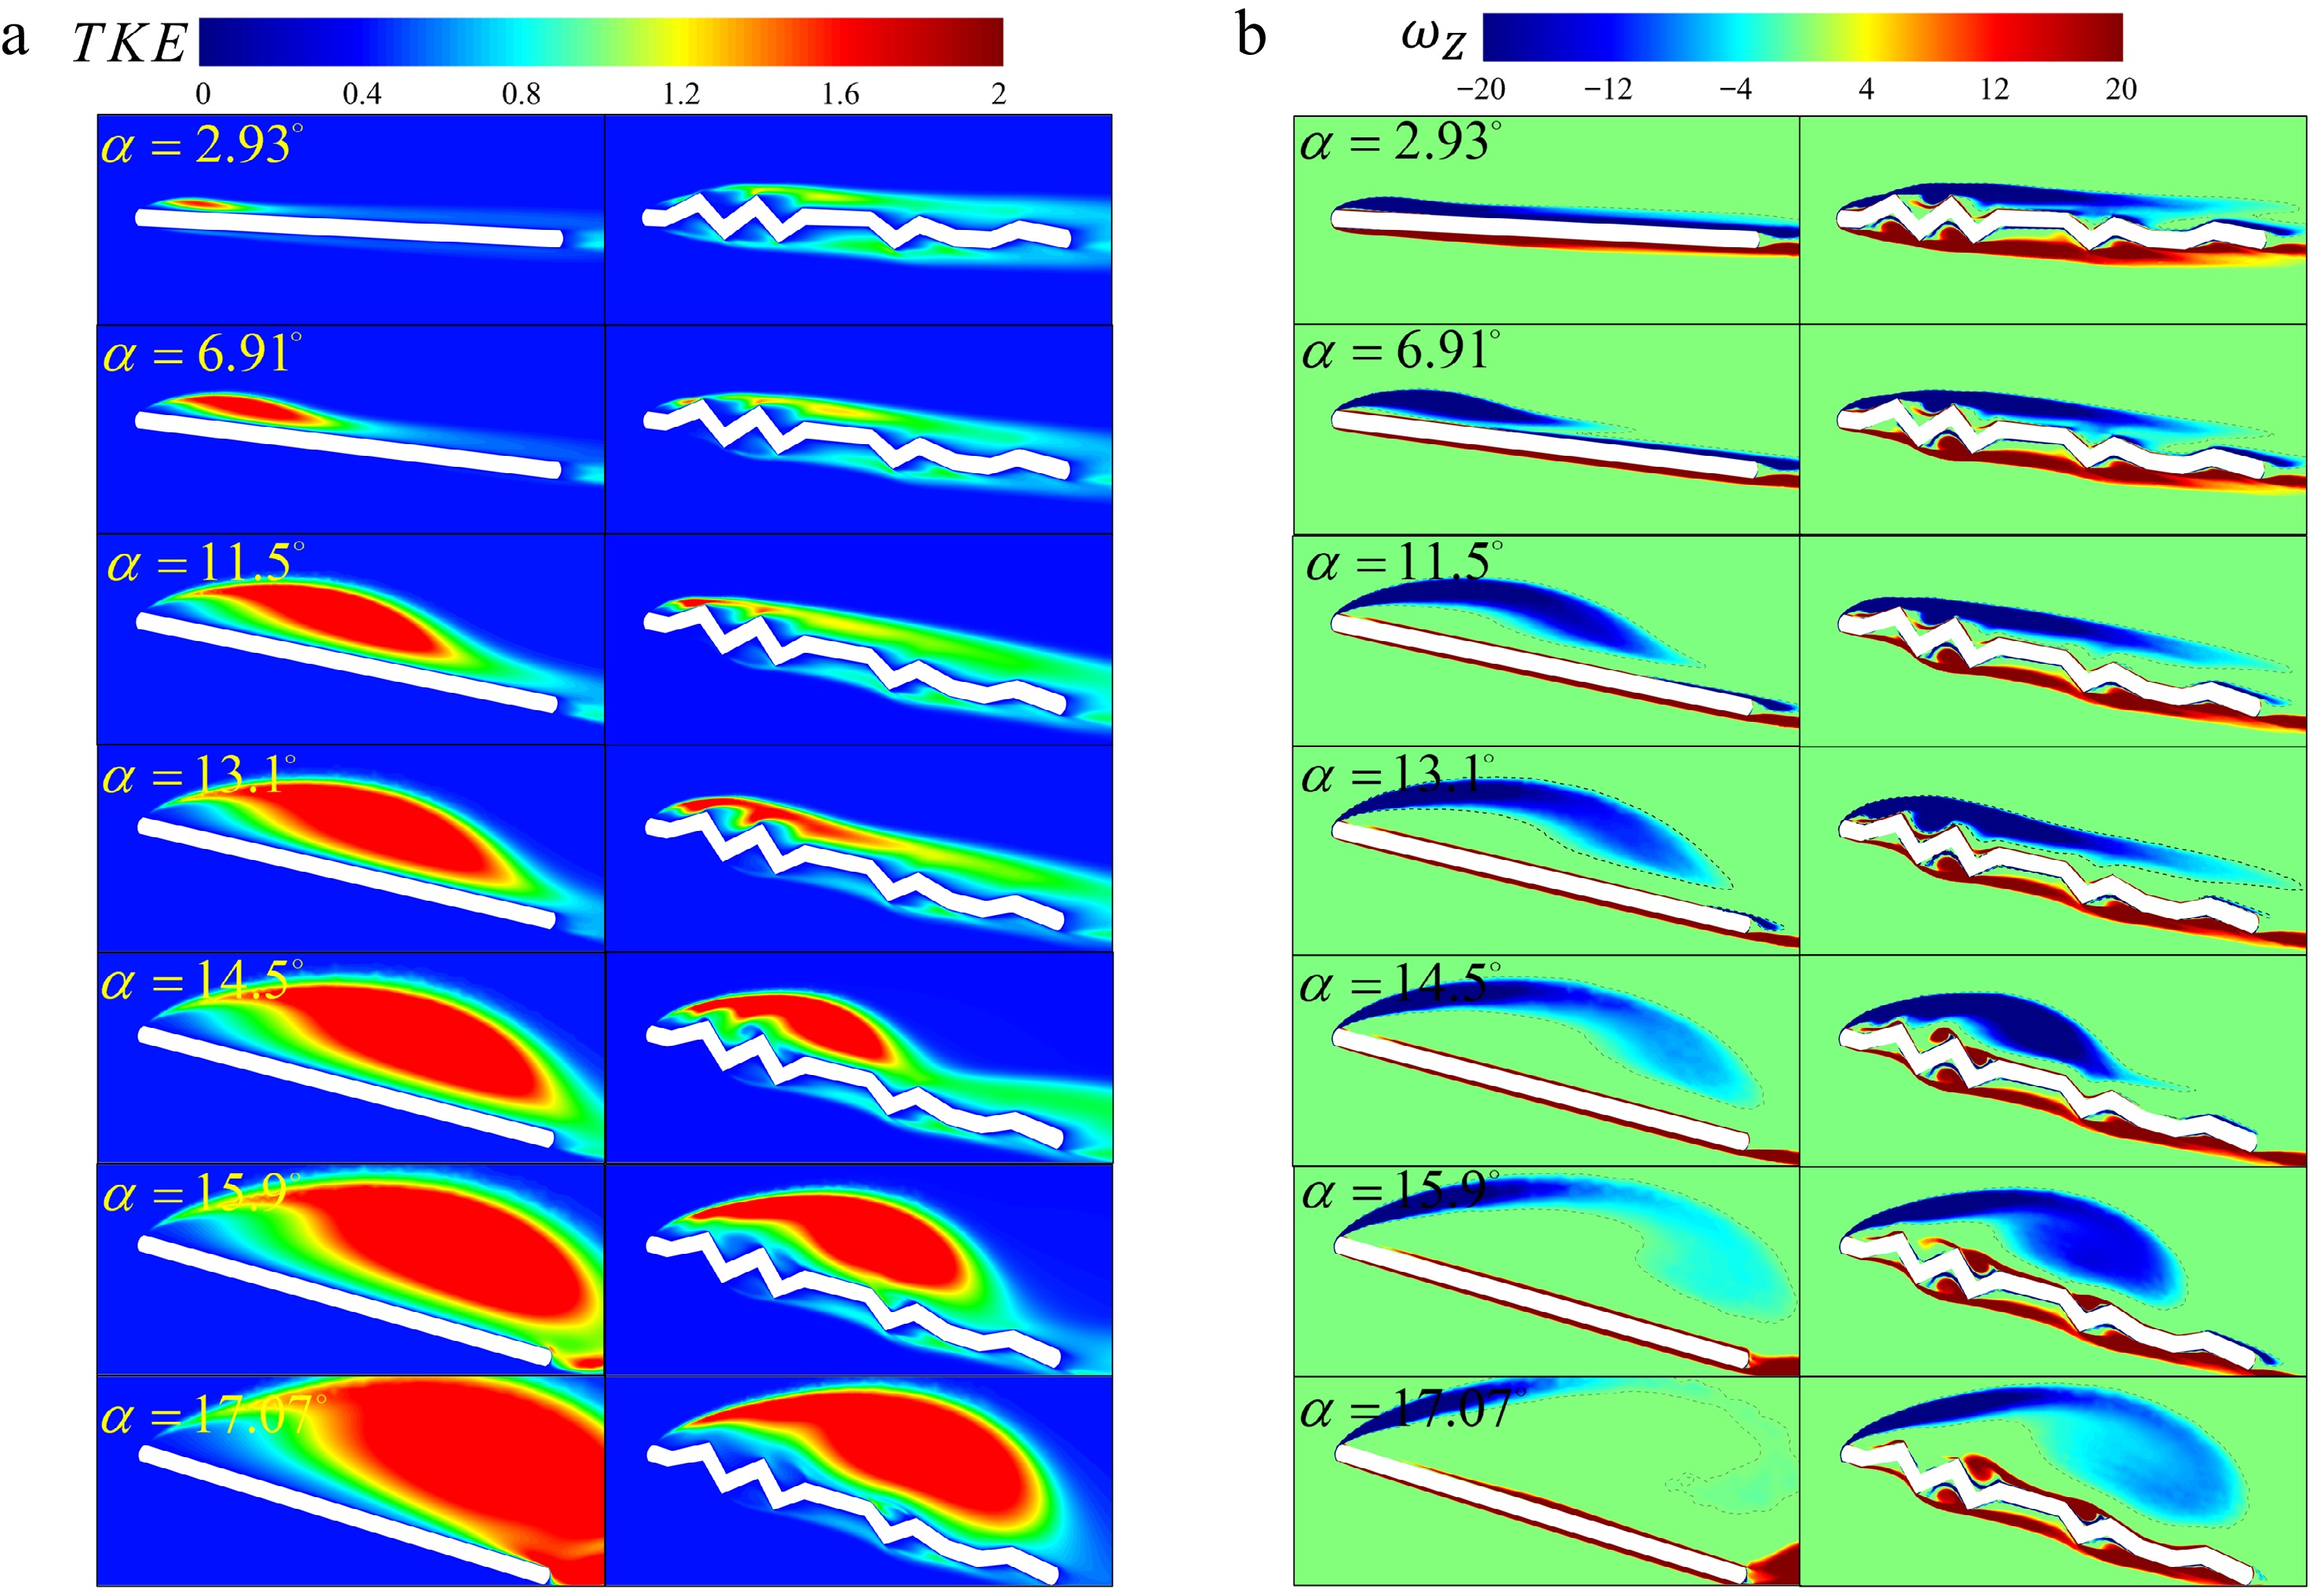
Figure 7.
Dimensionless (a) turbulent kinetic energy (TKE) and (b) spanwise vorticity (
$ {\omega }_{Z} $ -
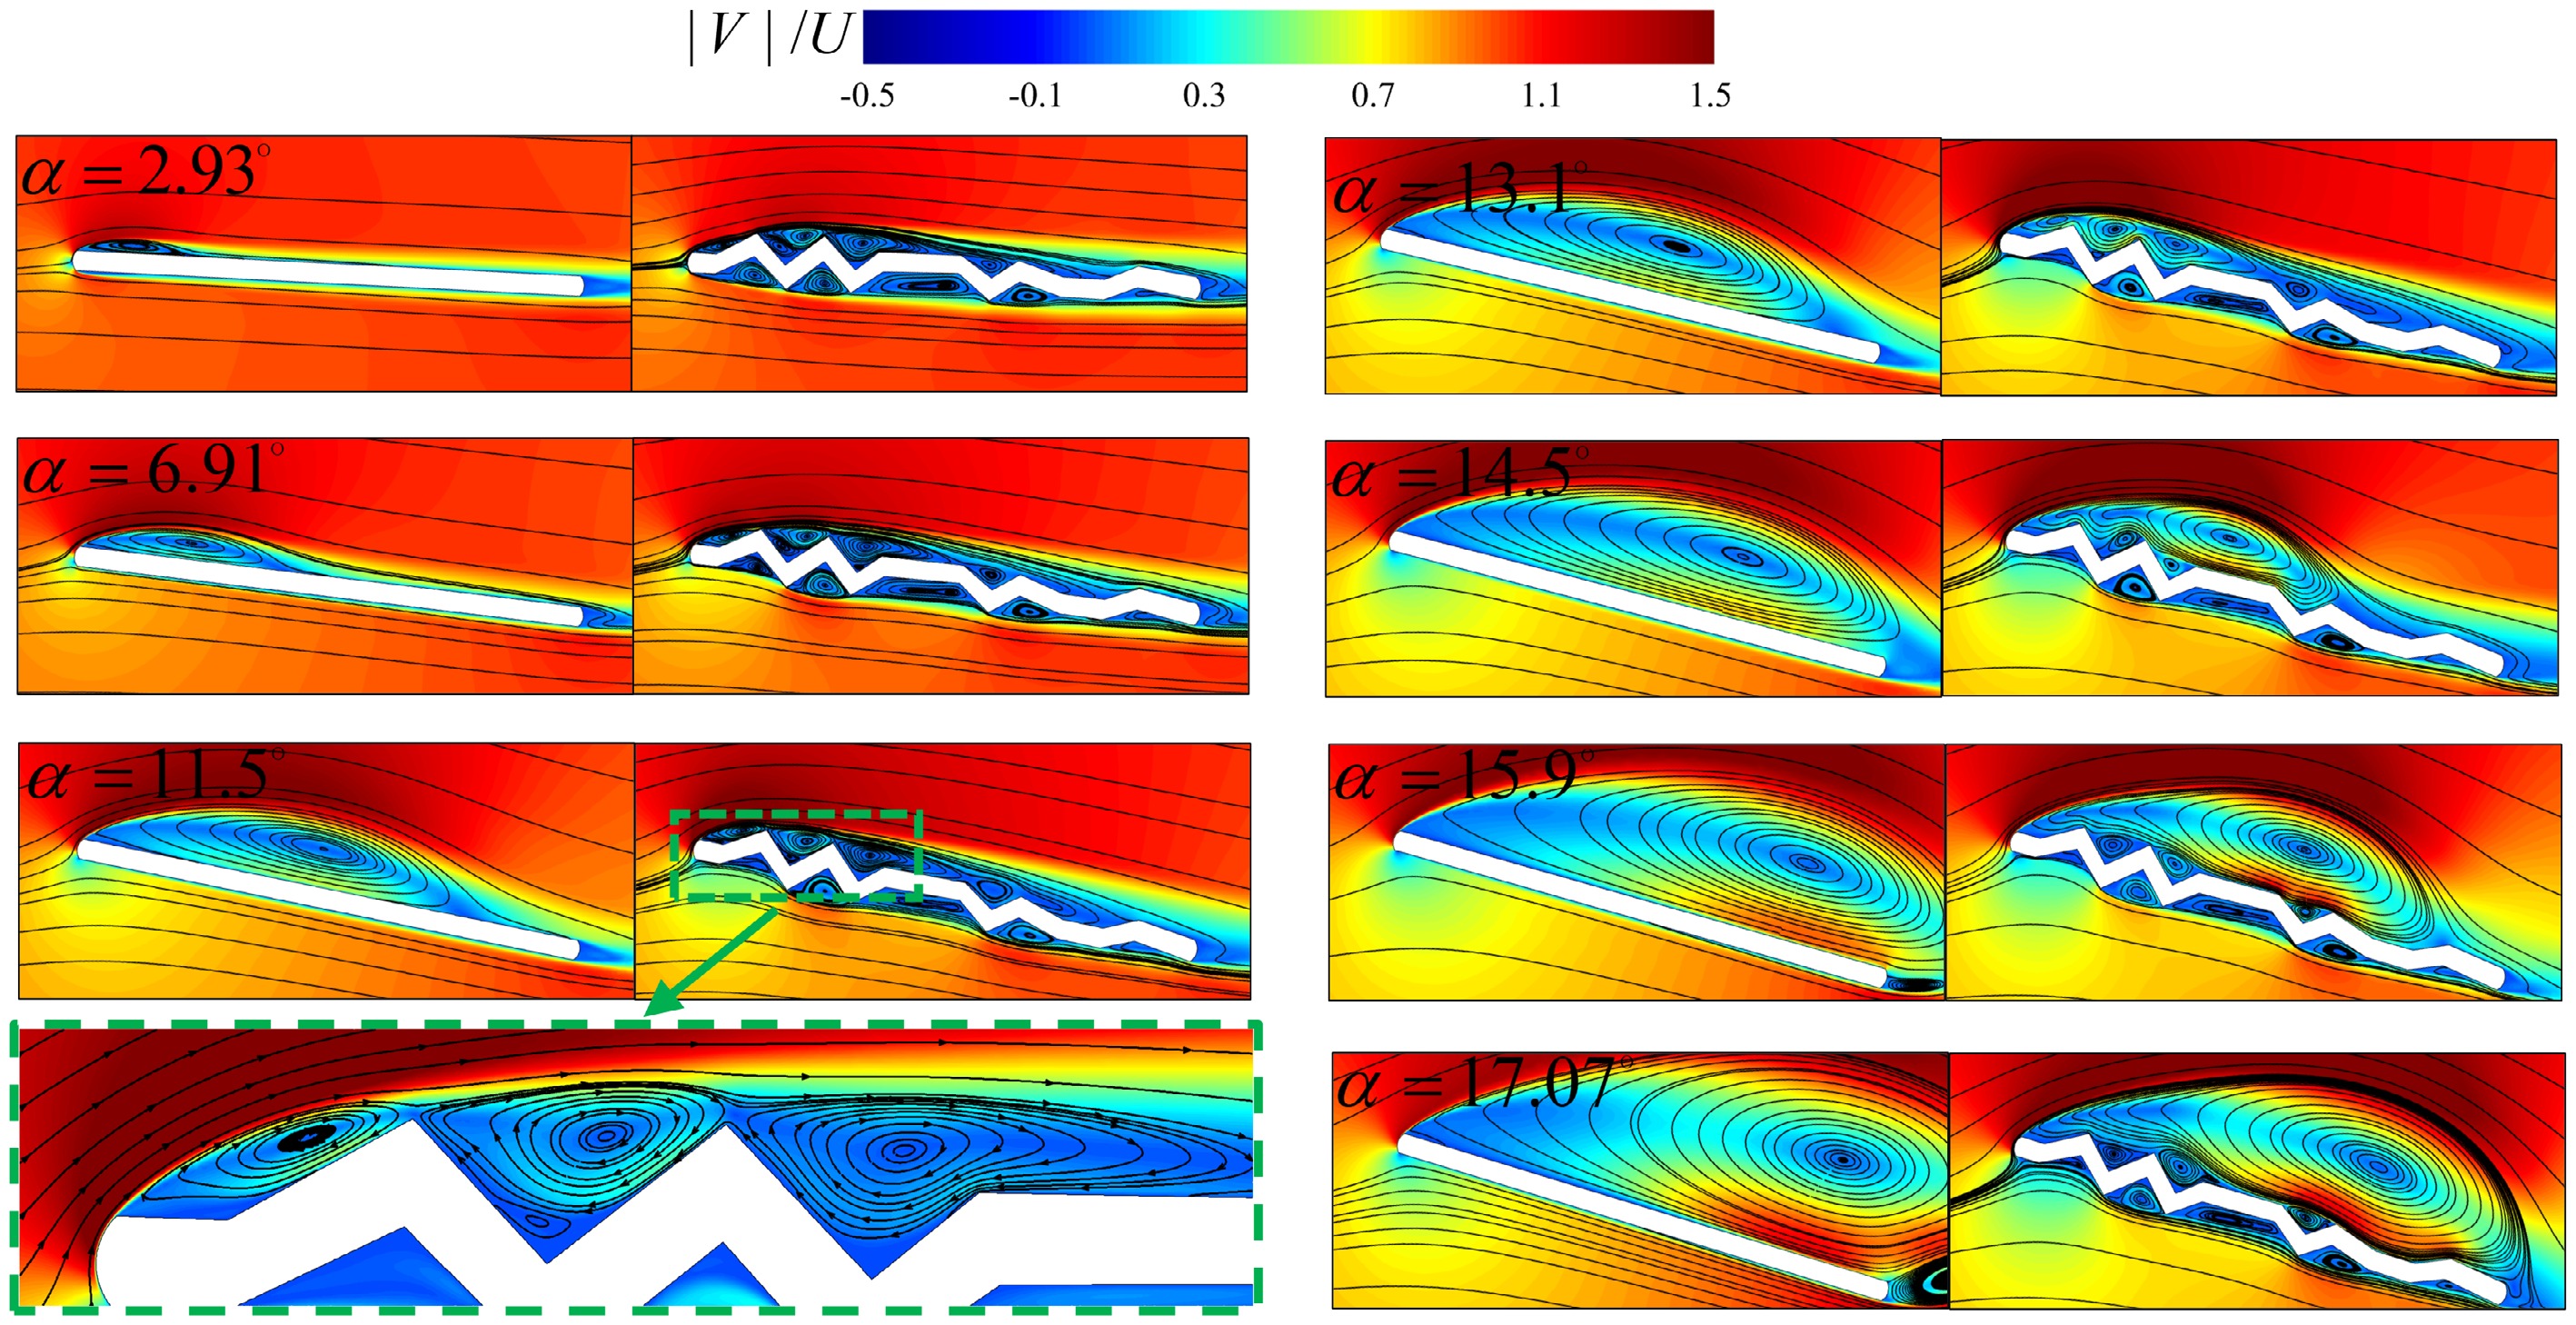
Figure 8.
Dimensionless velocity magnitude (
$ |V|/U $ -
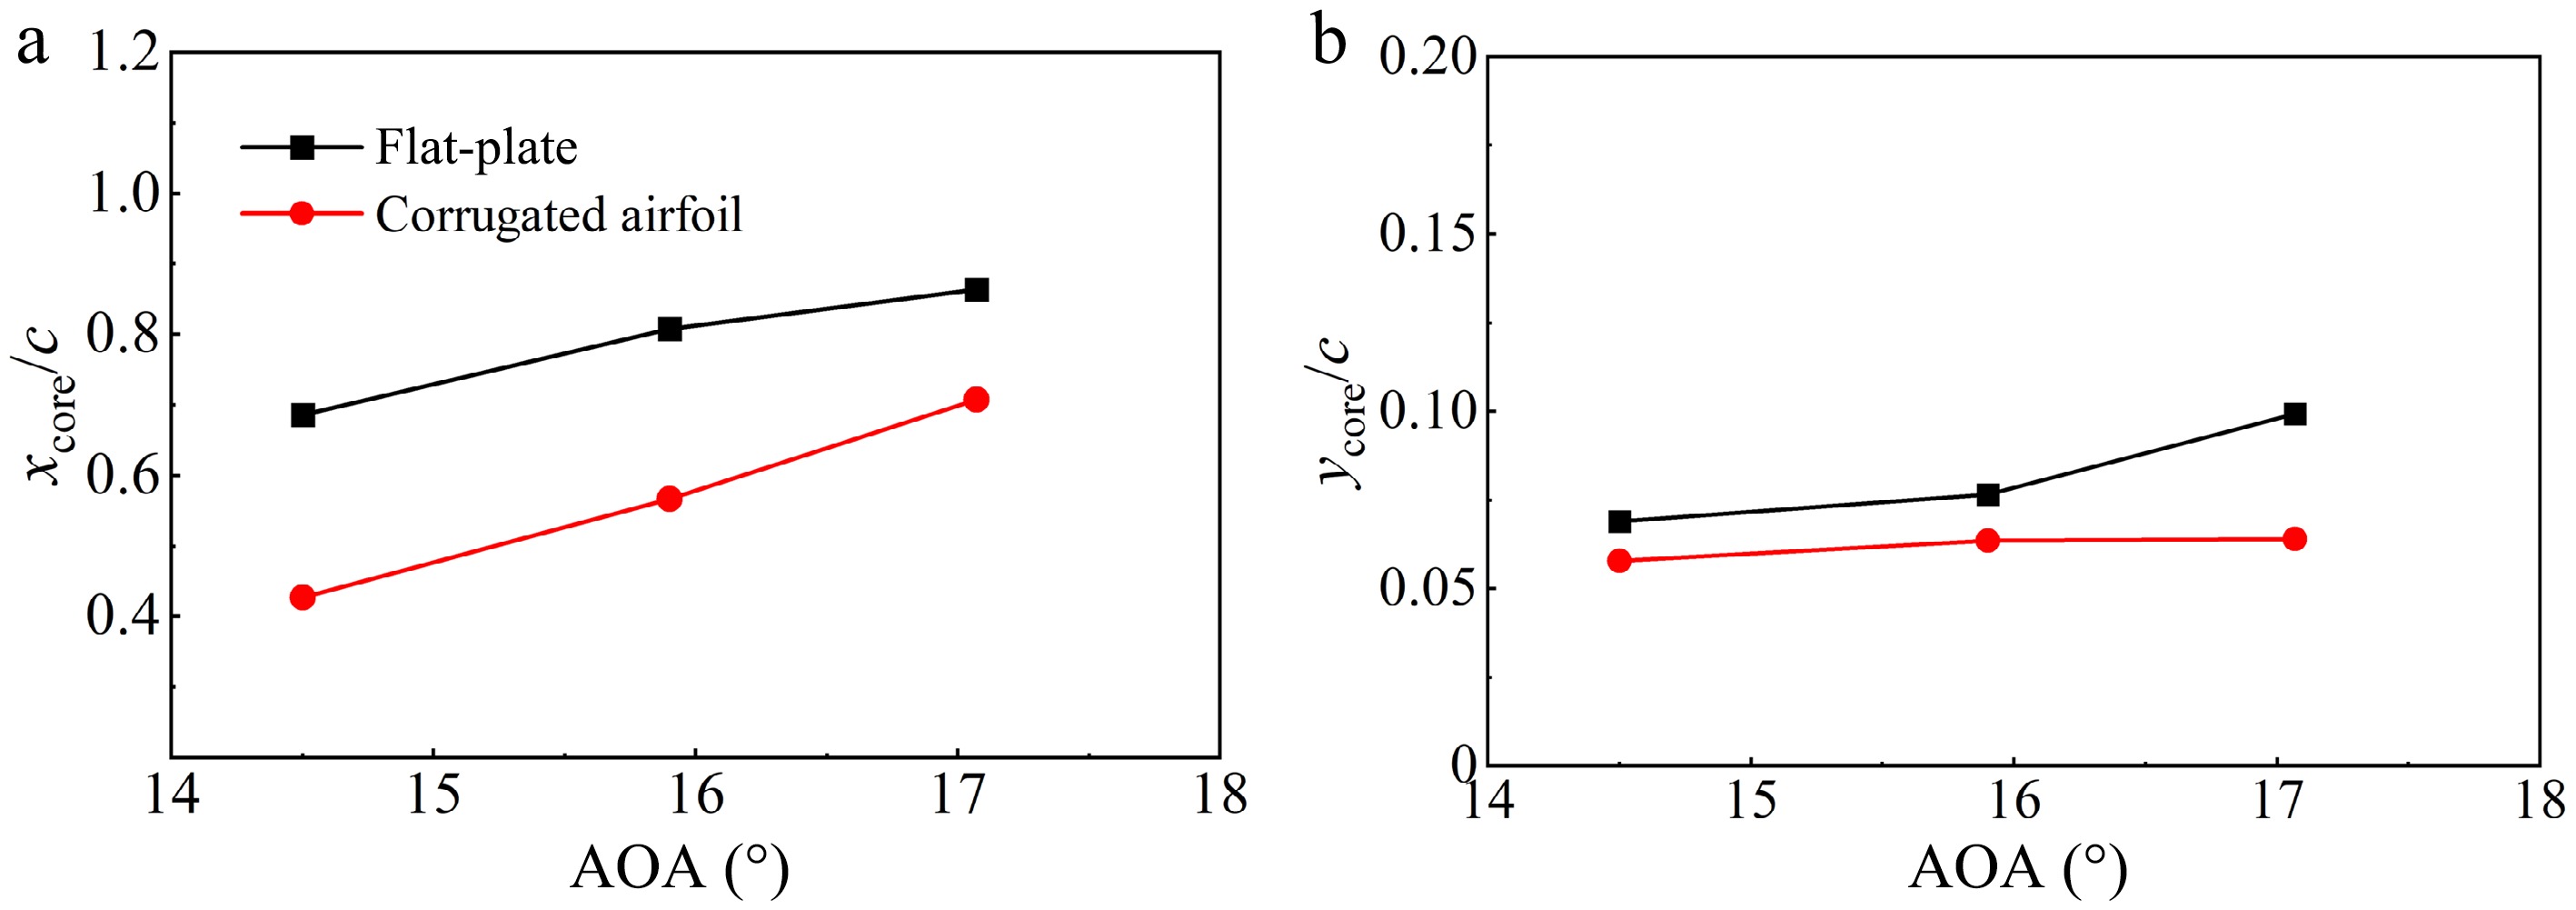
Figure 9.
Vortex-core coordinates relative to the leading-edge point for the flat-plate and corrugated airfoils at different angles of attack: (a) xcore/c and (b) ycore/c.
-
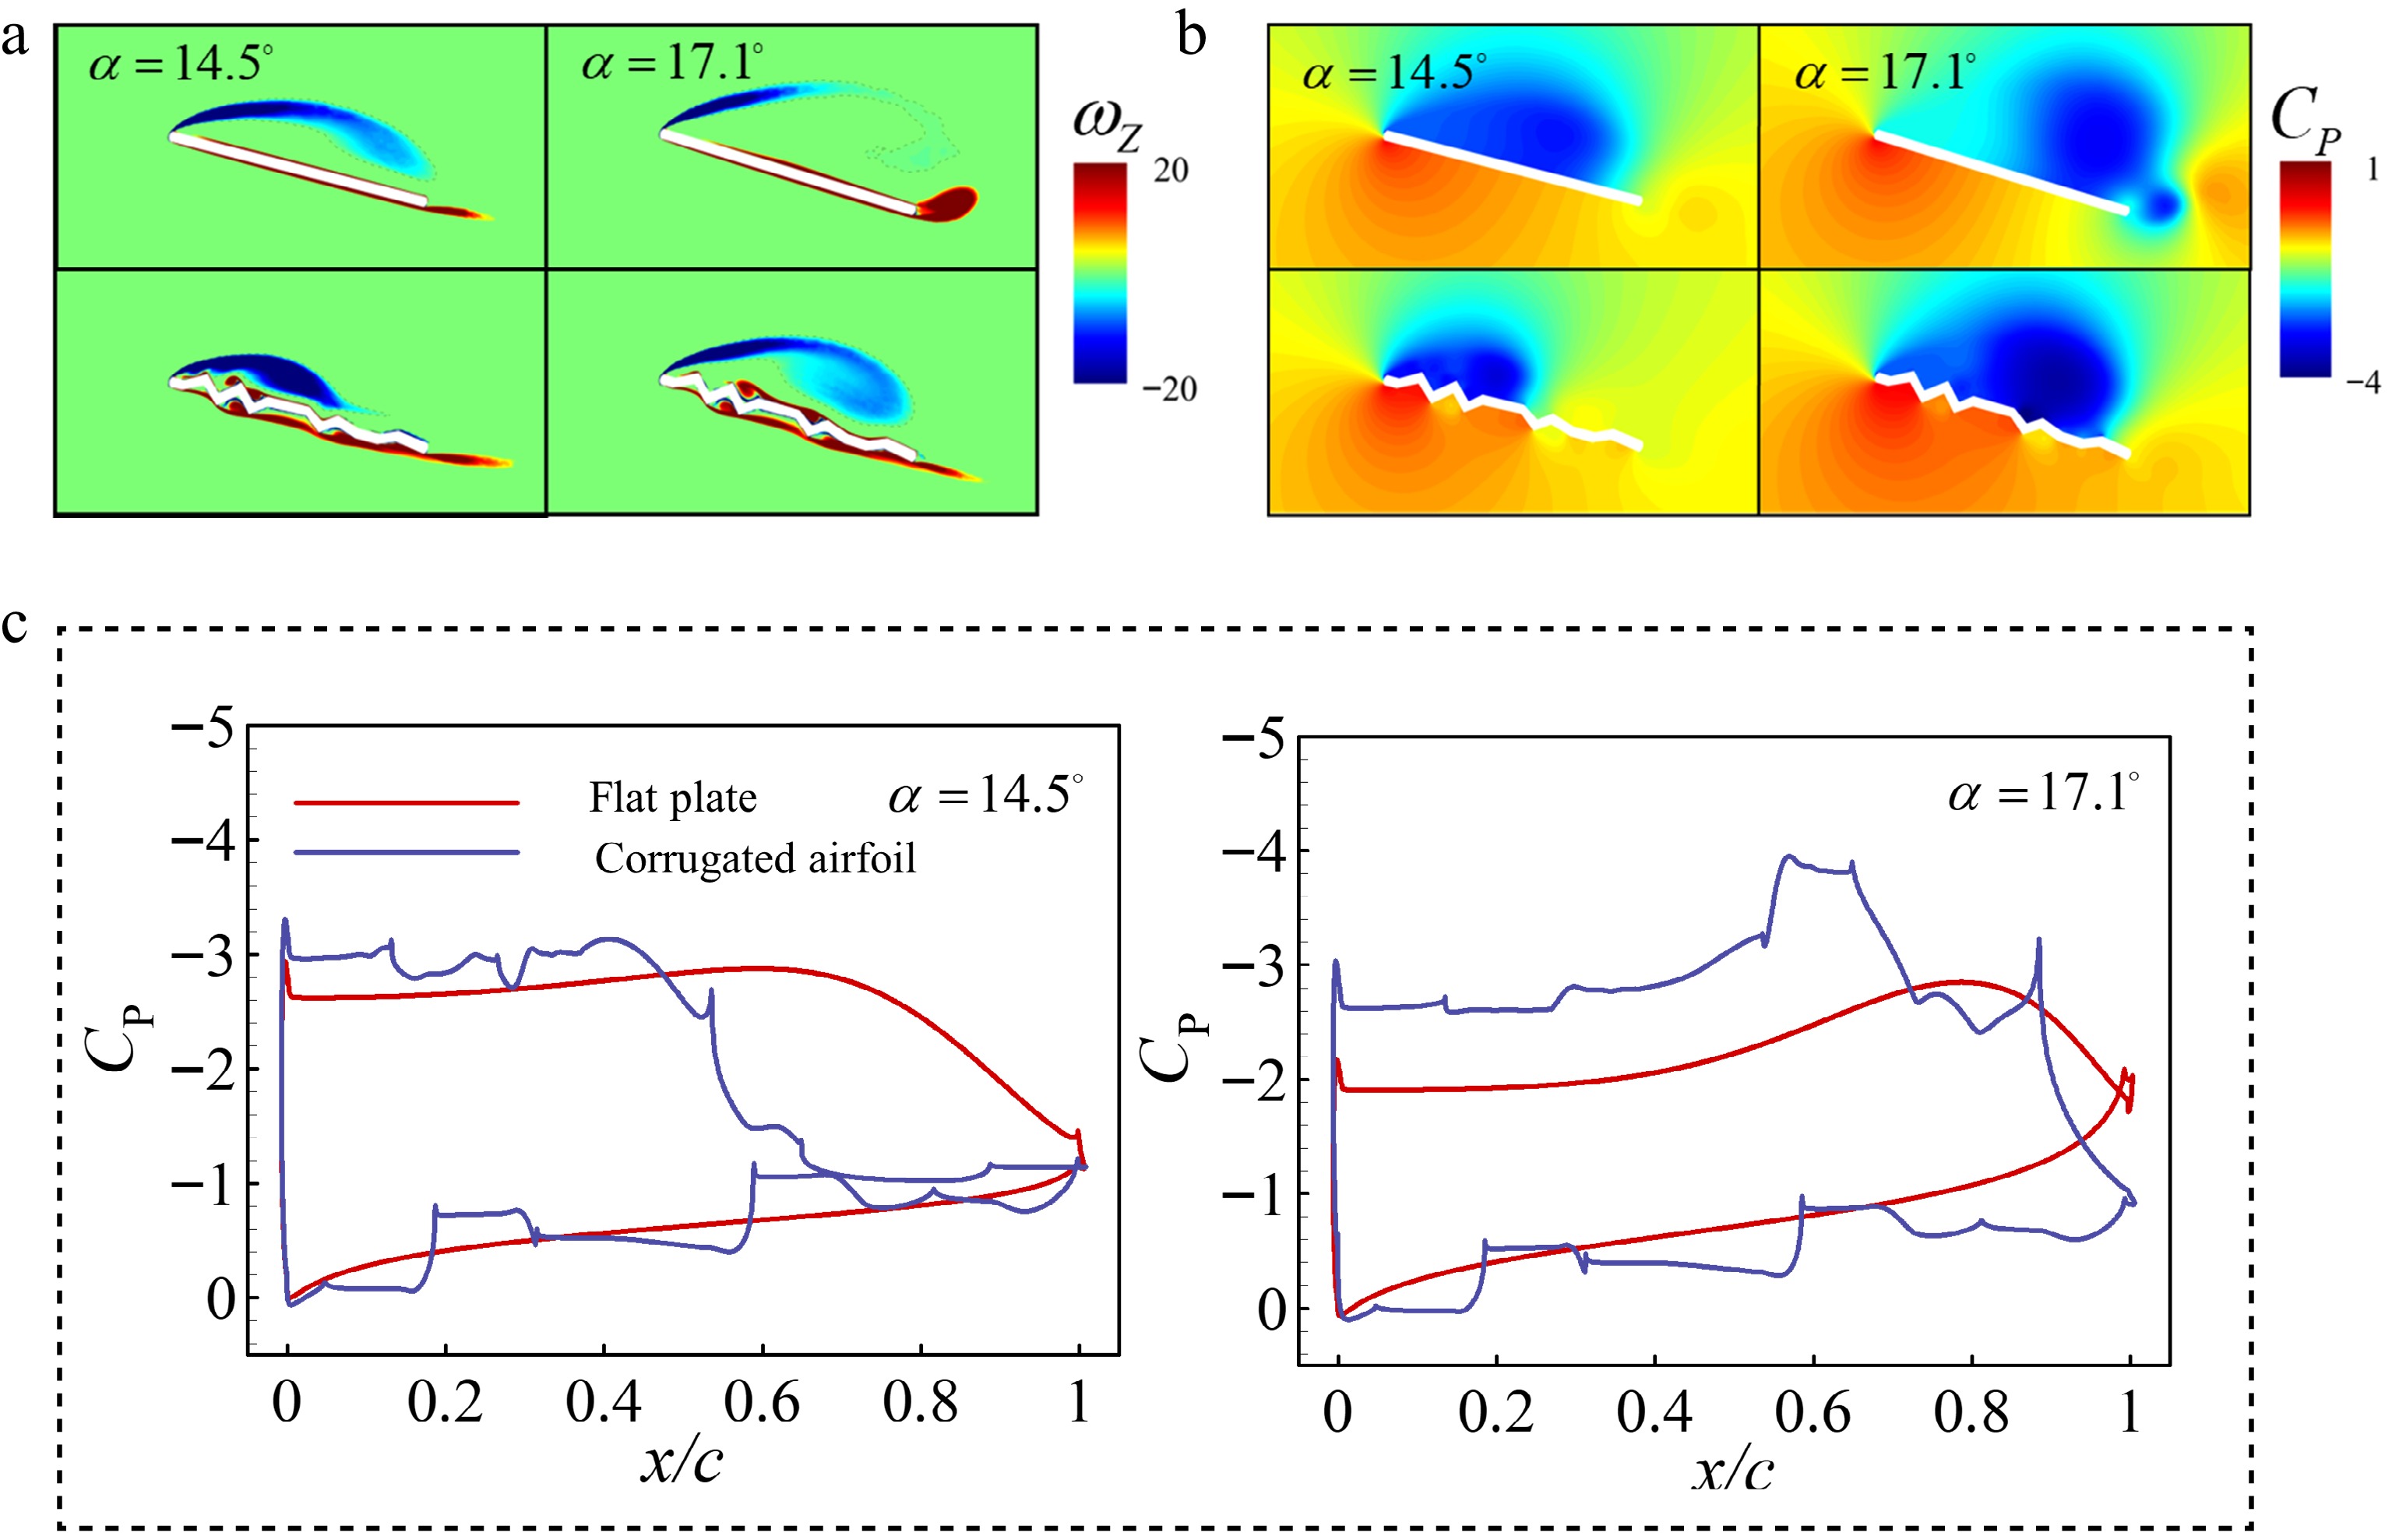
Figure 10.
(a) Dimensionless spanwise vorticity contours, (b) pressure coefficient contours, and (c) chordwise pressure coefficient of corrugated and flat-plate airfoils at pitching angles of 14.5° and 17.1°, respectively.
-
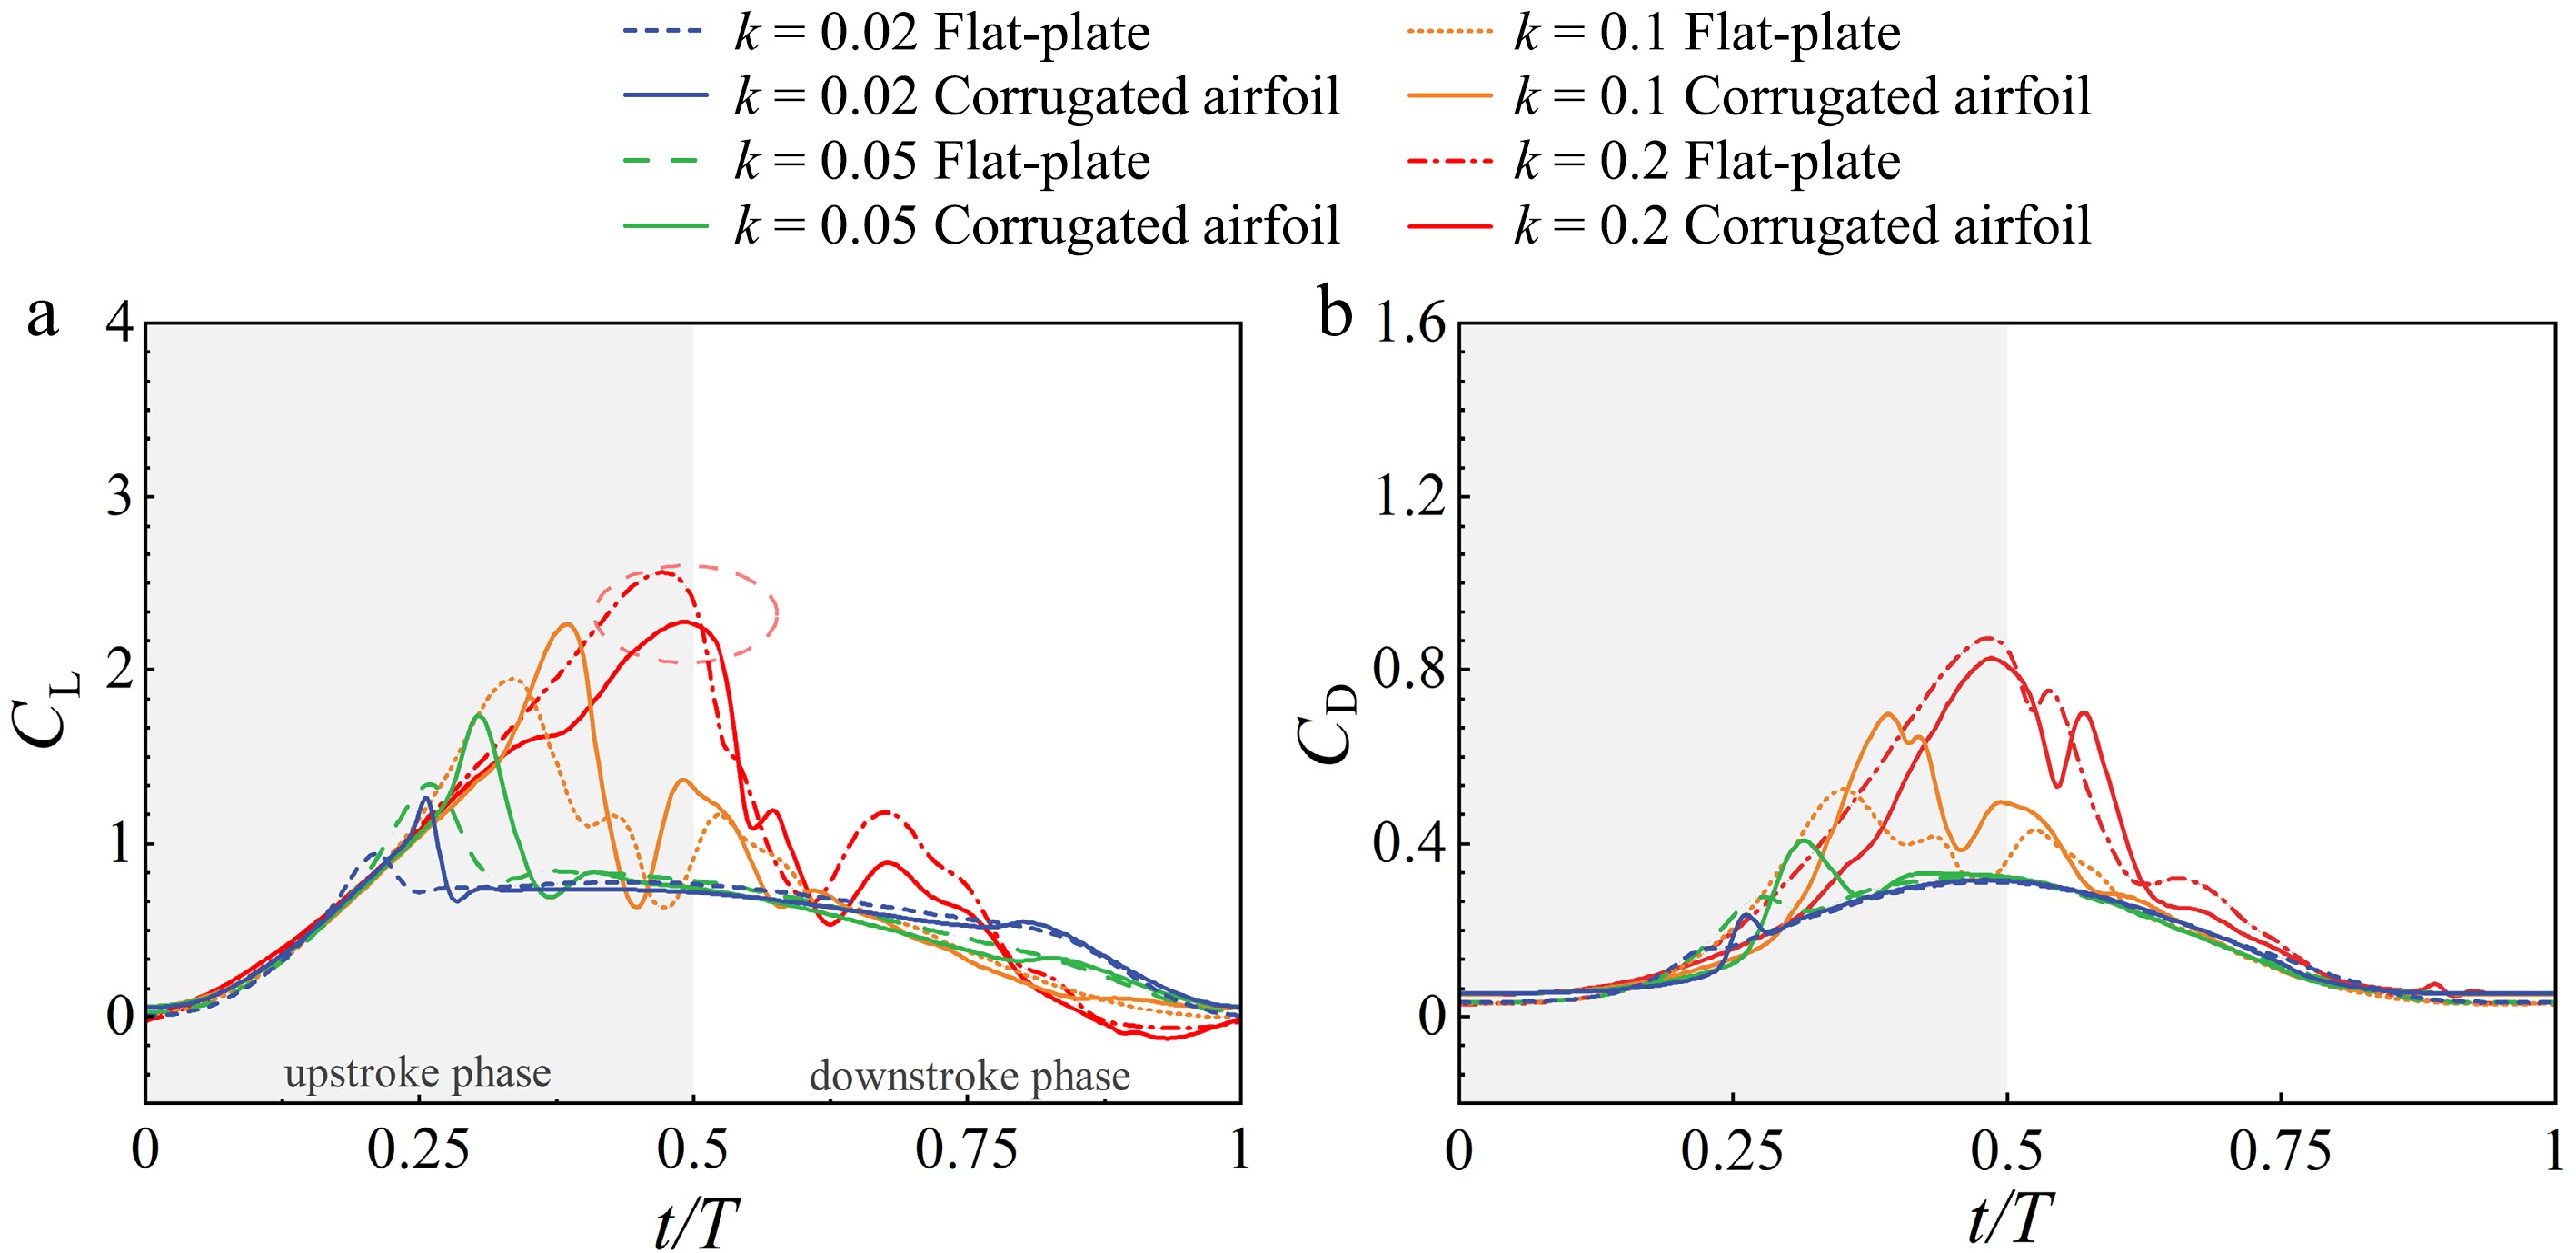
Figure 11.
Histories of (a) CL and (b) CD for the corrugated and flat-plate airfoils at k = 0.02, 0.05, 0.1, and 0.2.
-
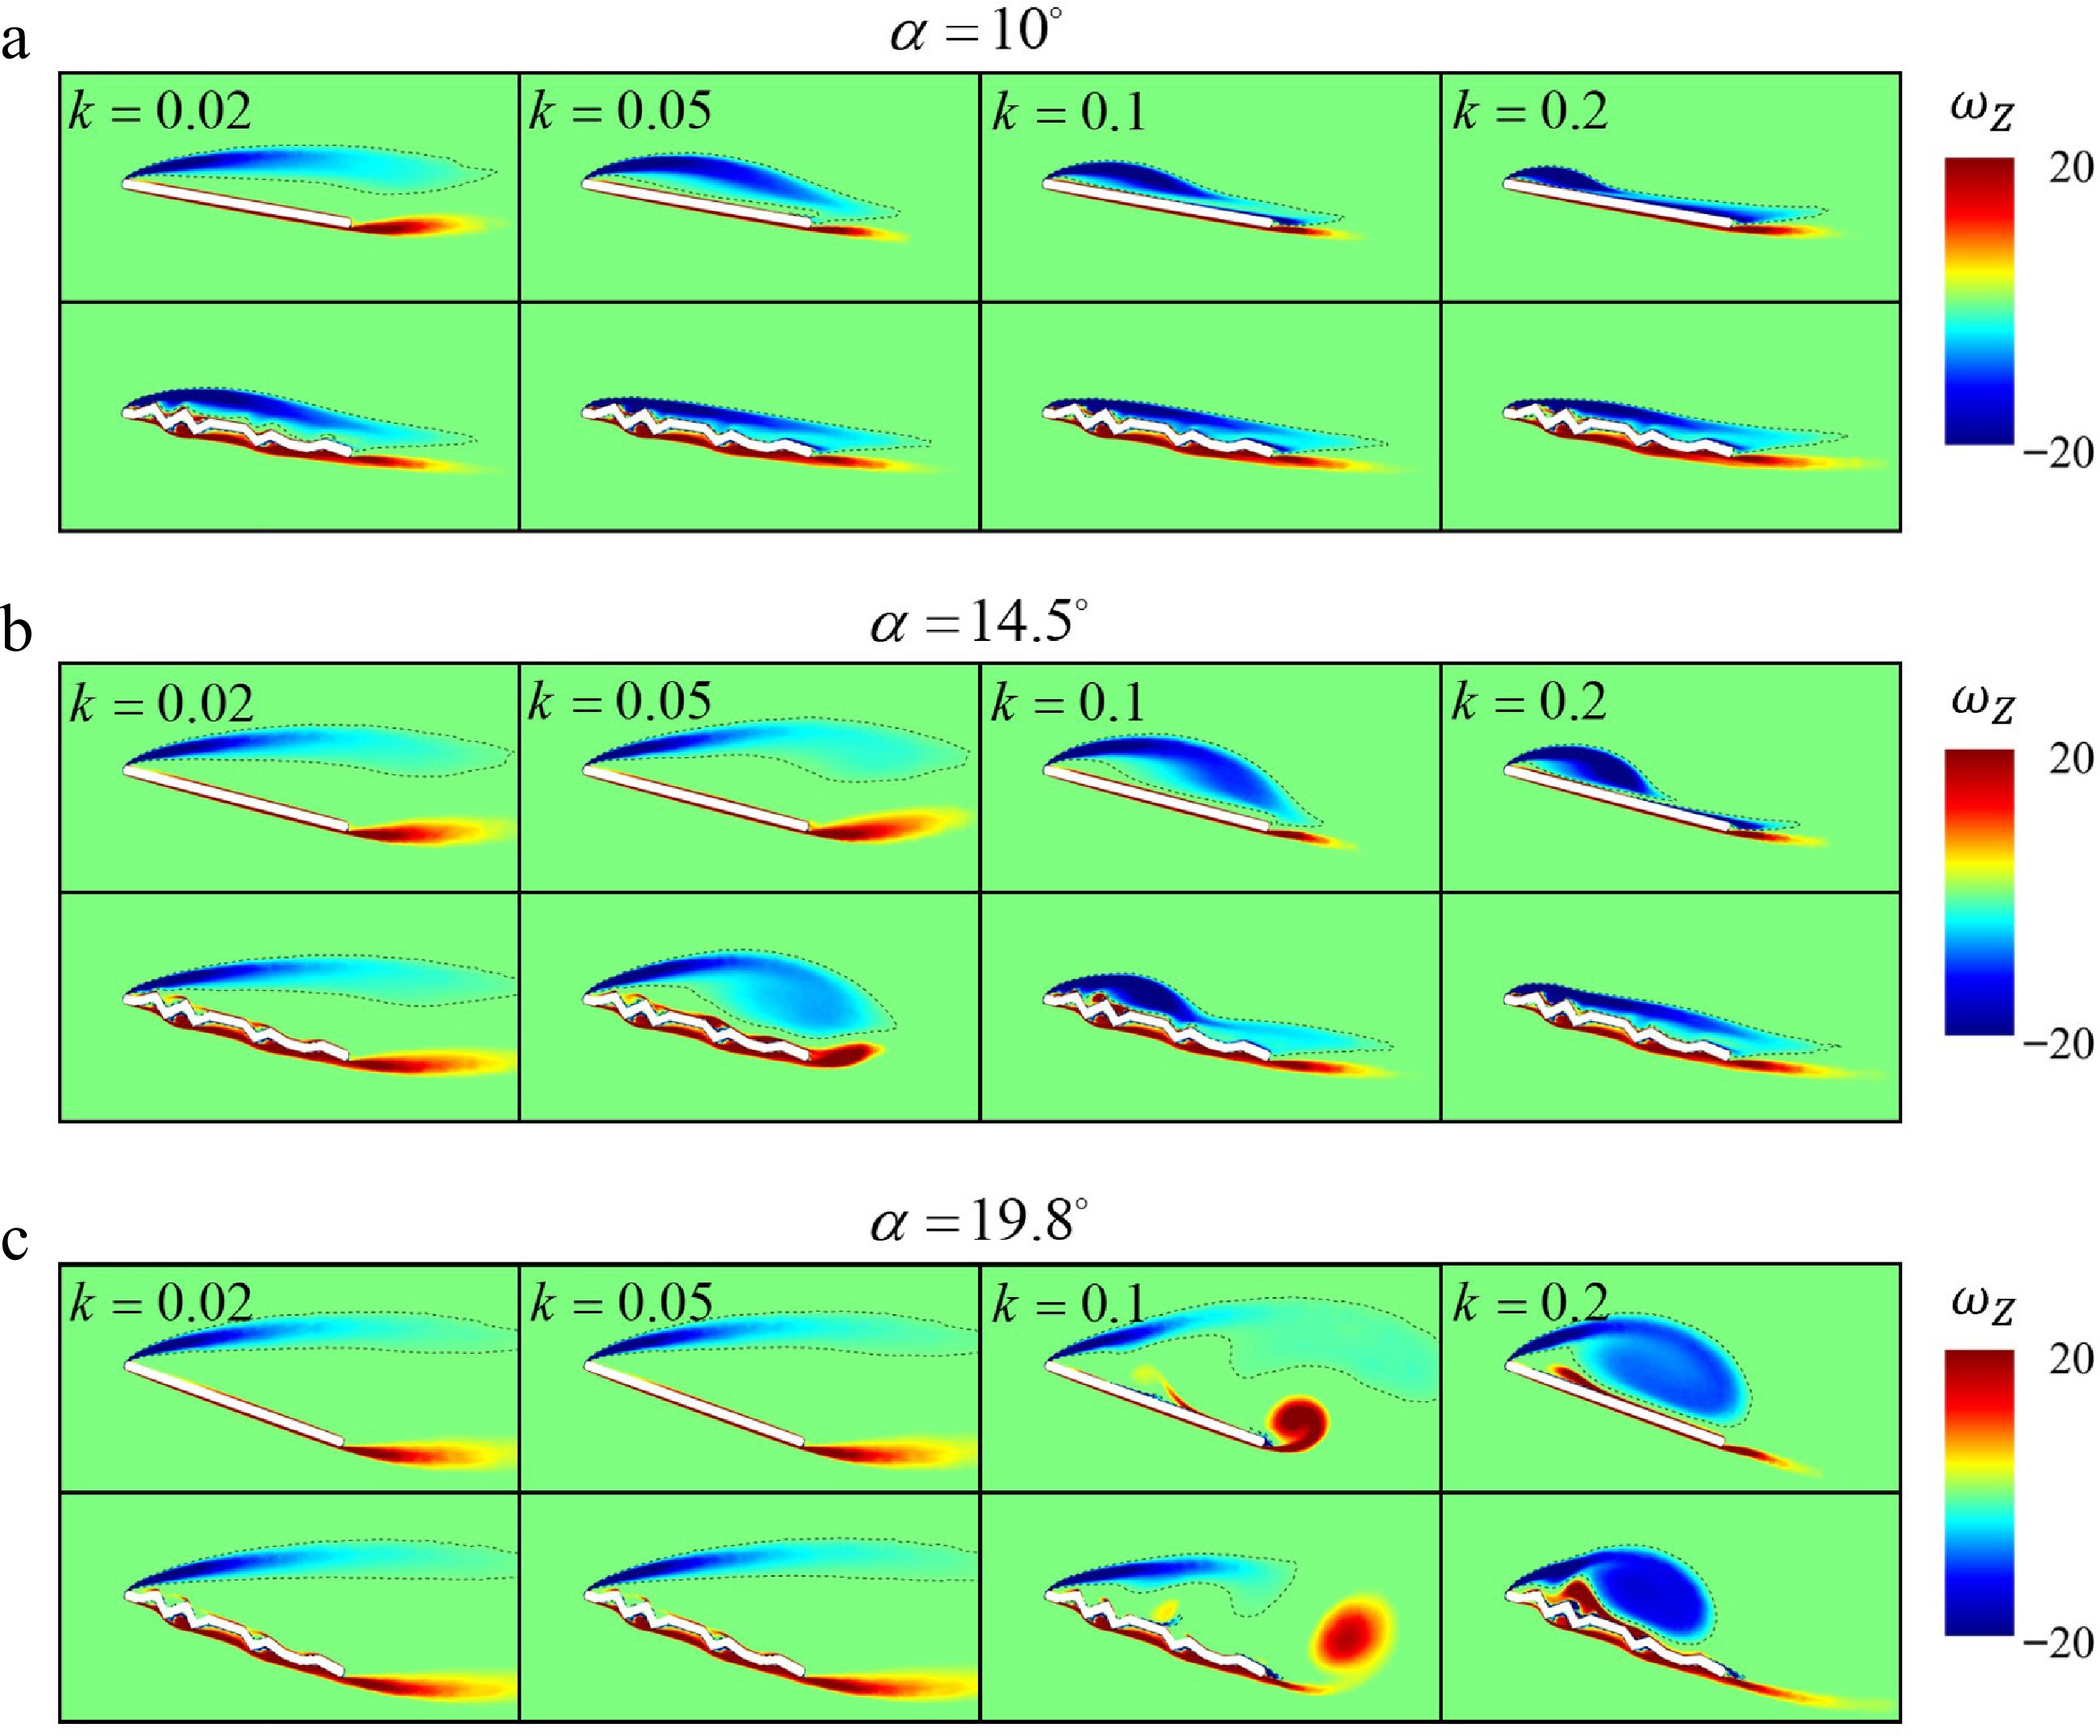
Figure 12.
Dimensionless spanwise vorticity contours of the corrugated and flat-plate airfoils at (a) α = 10°, (b) 14.5°, and (c) 19.8° for k = 0.02, 0.05, 0.1, and 0.2.
-
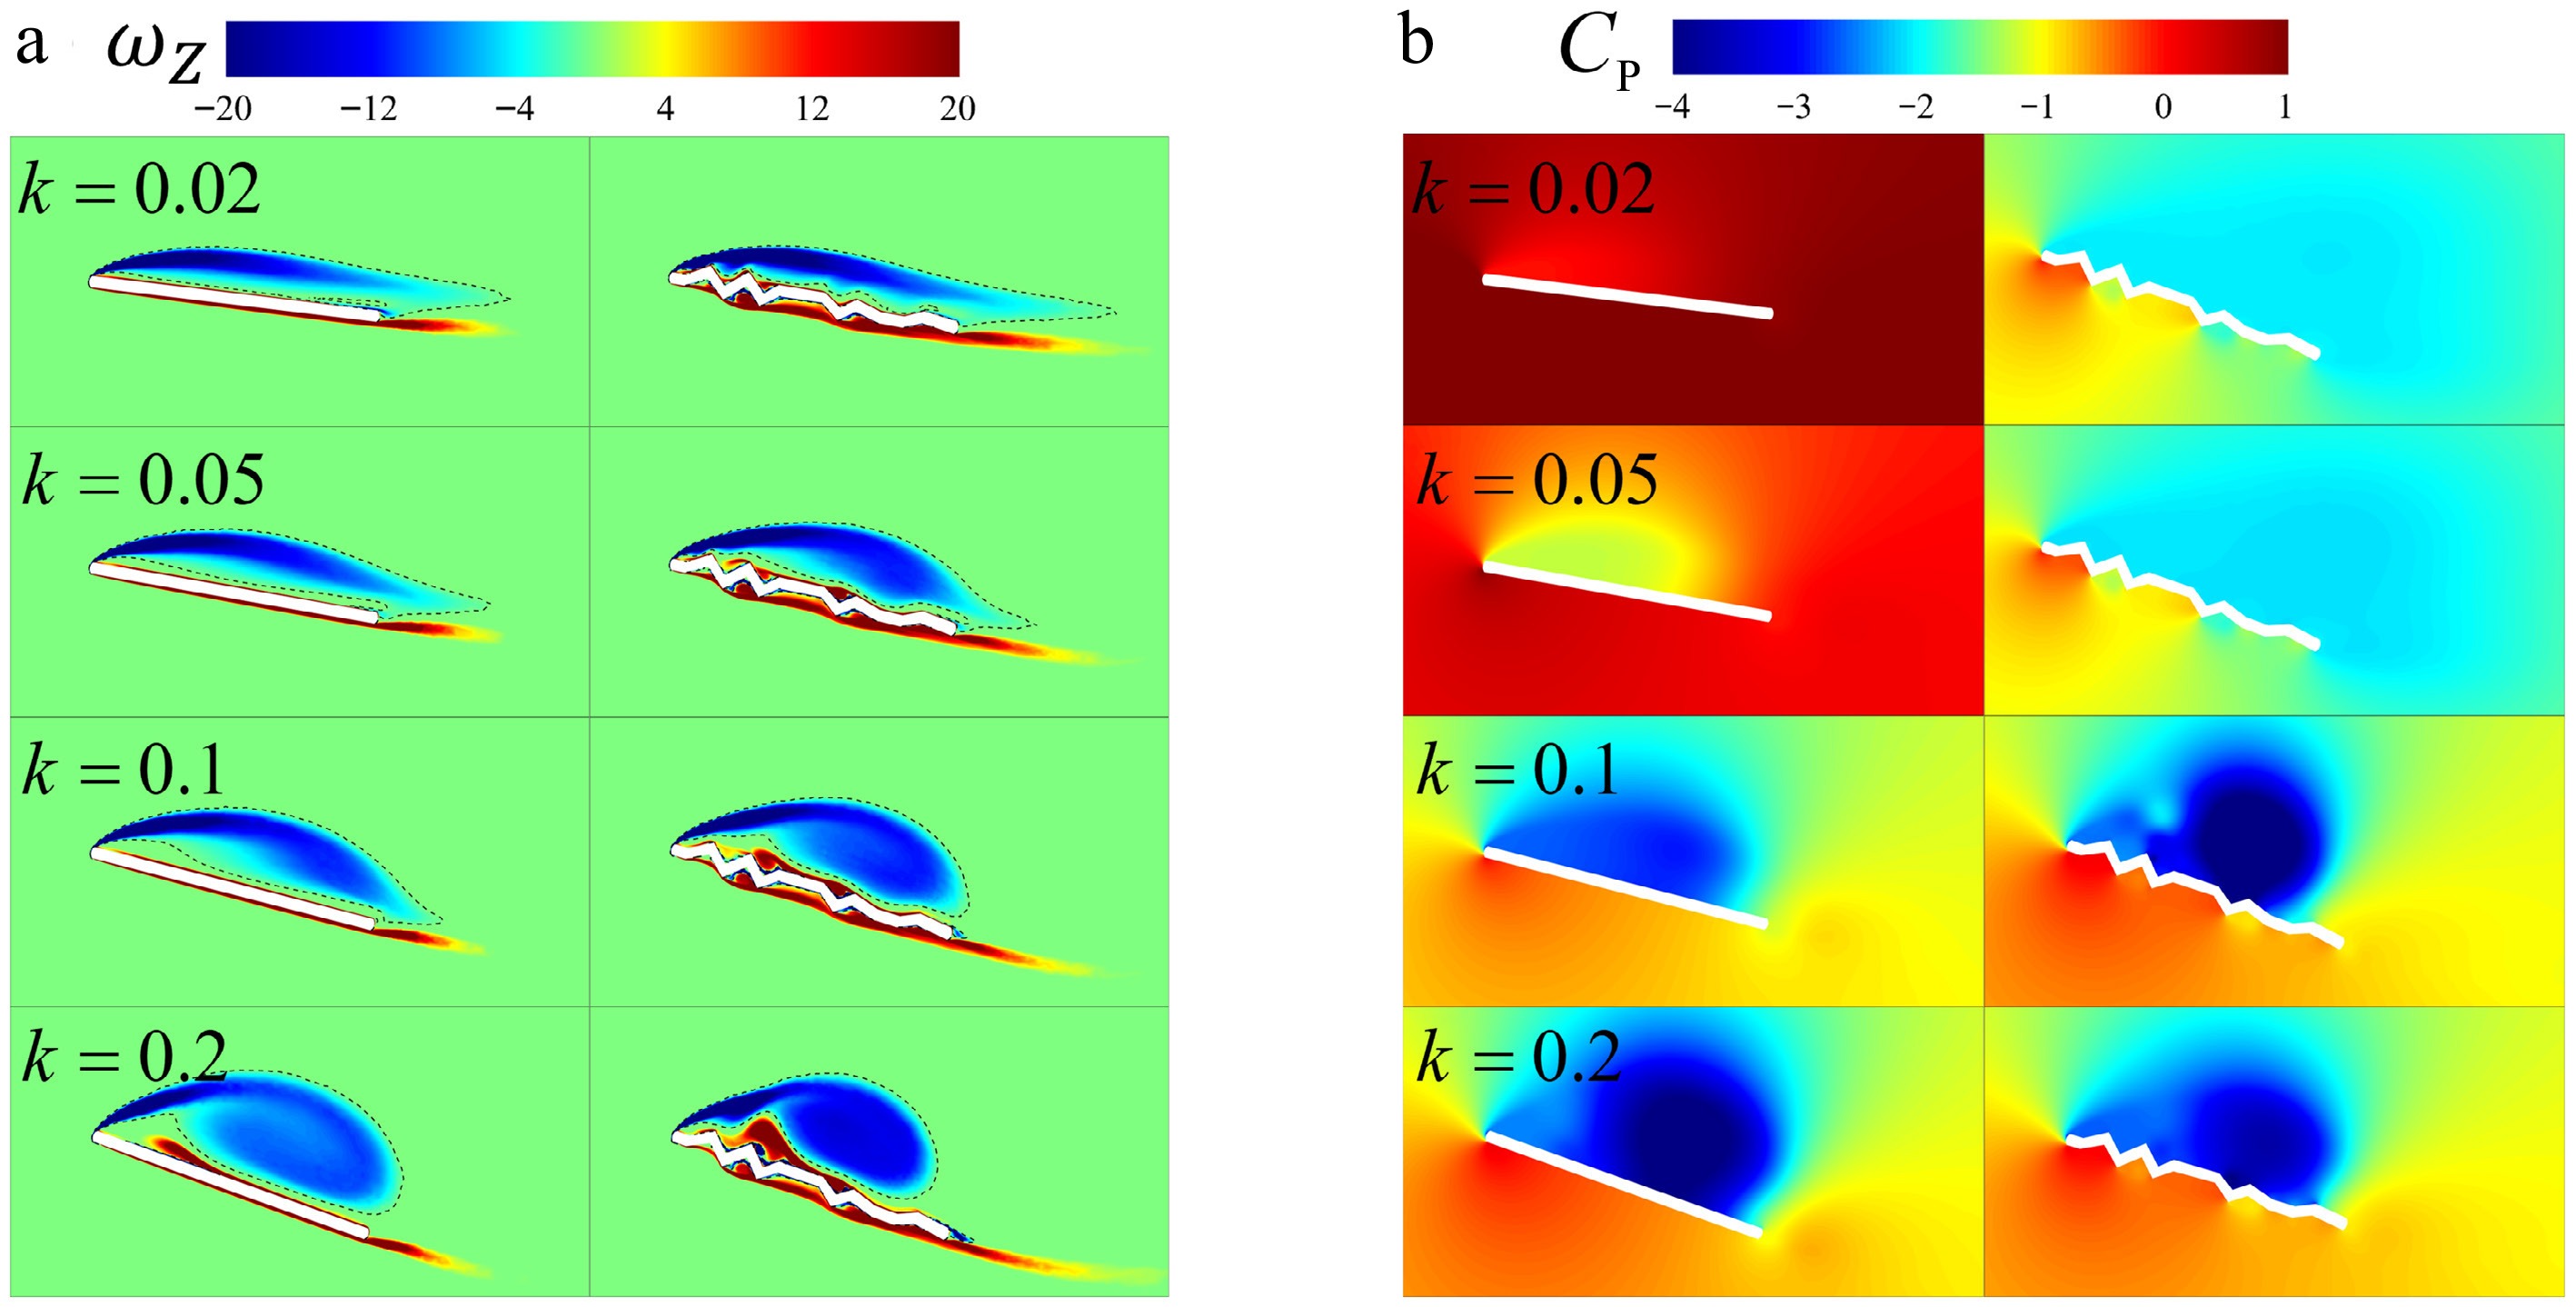
Figure 13.
Contours of (a) spanwise vorticity and (b) pressure coefficient at the peak lift for both the corrugated and flat-plate airfoils at k = 0.02, 0.05, 0.1, and 0.2.
-
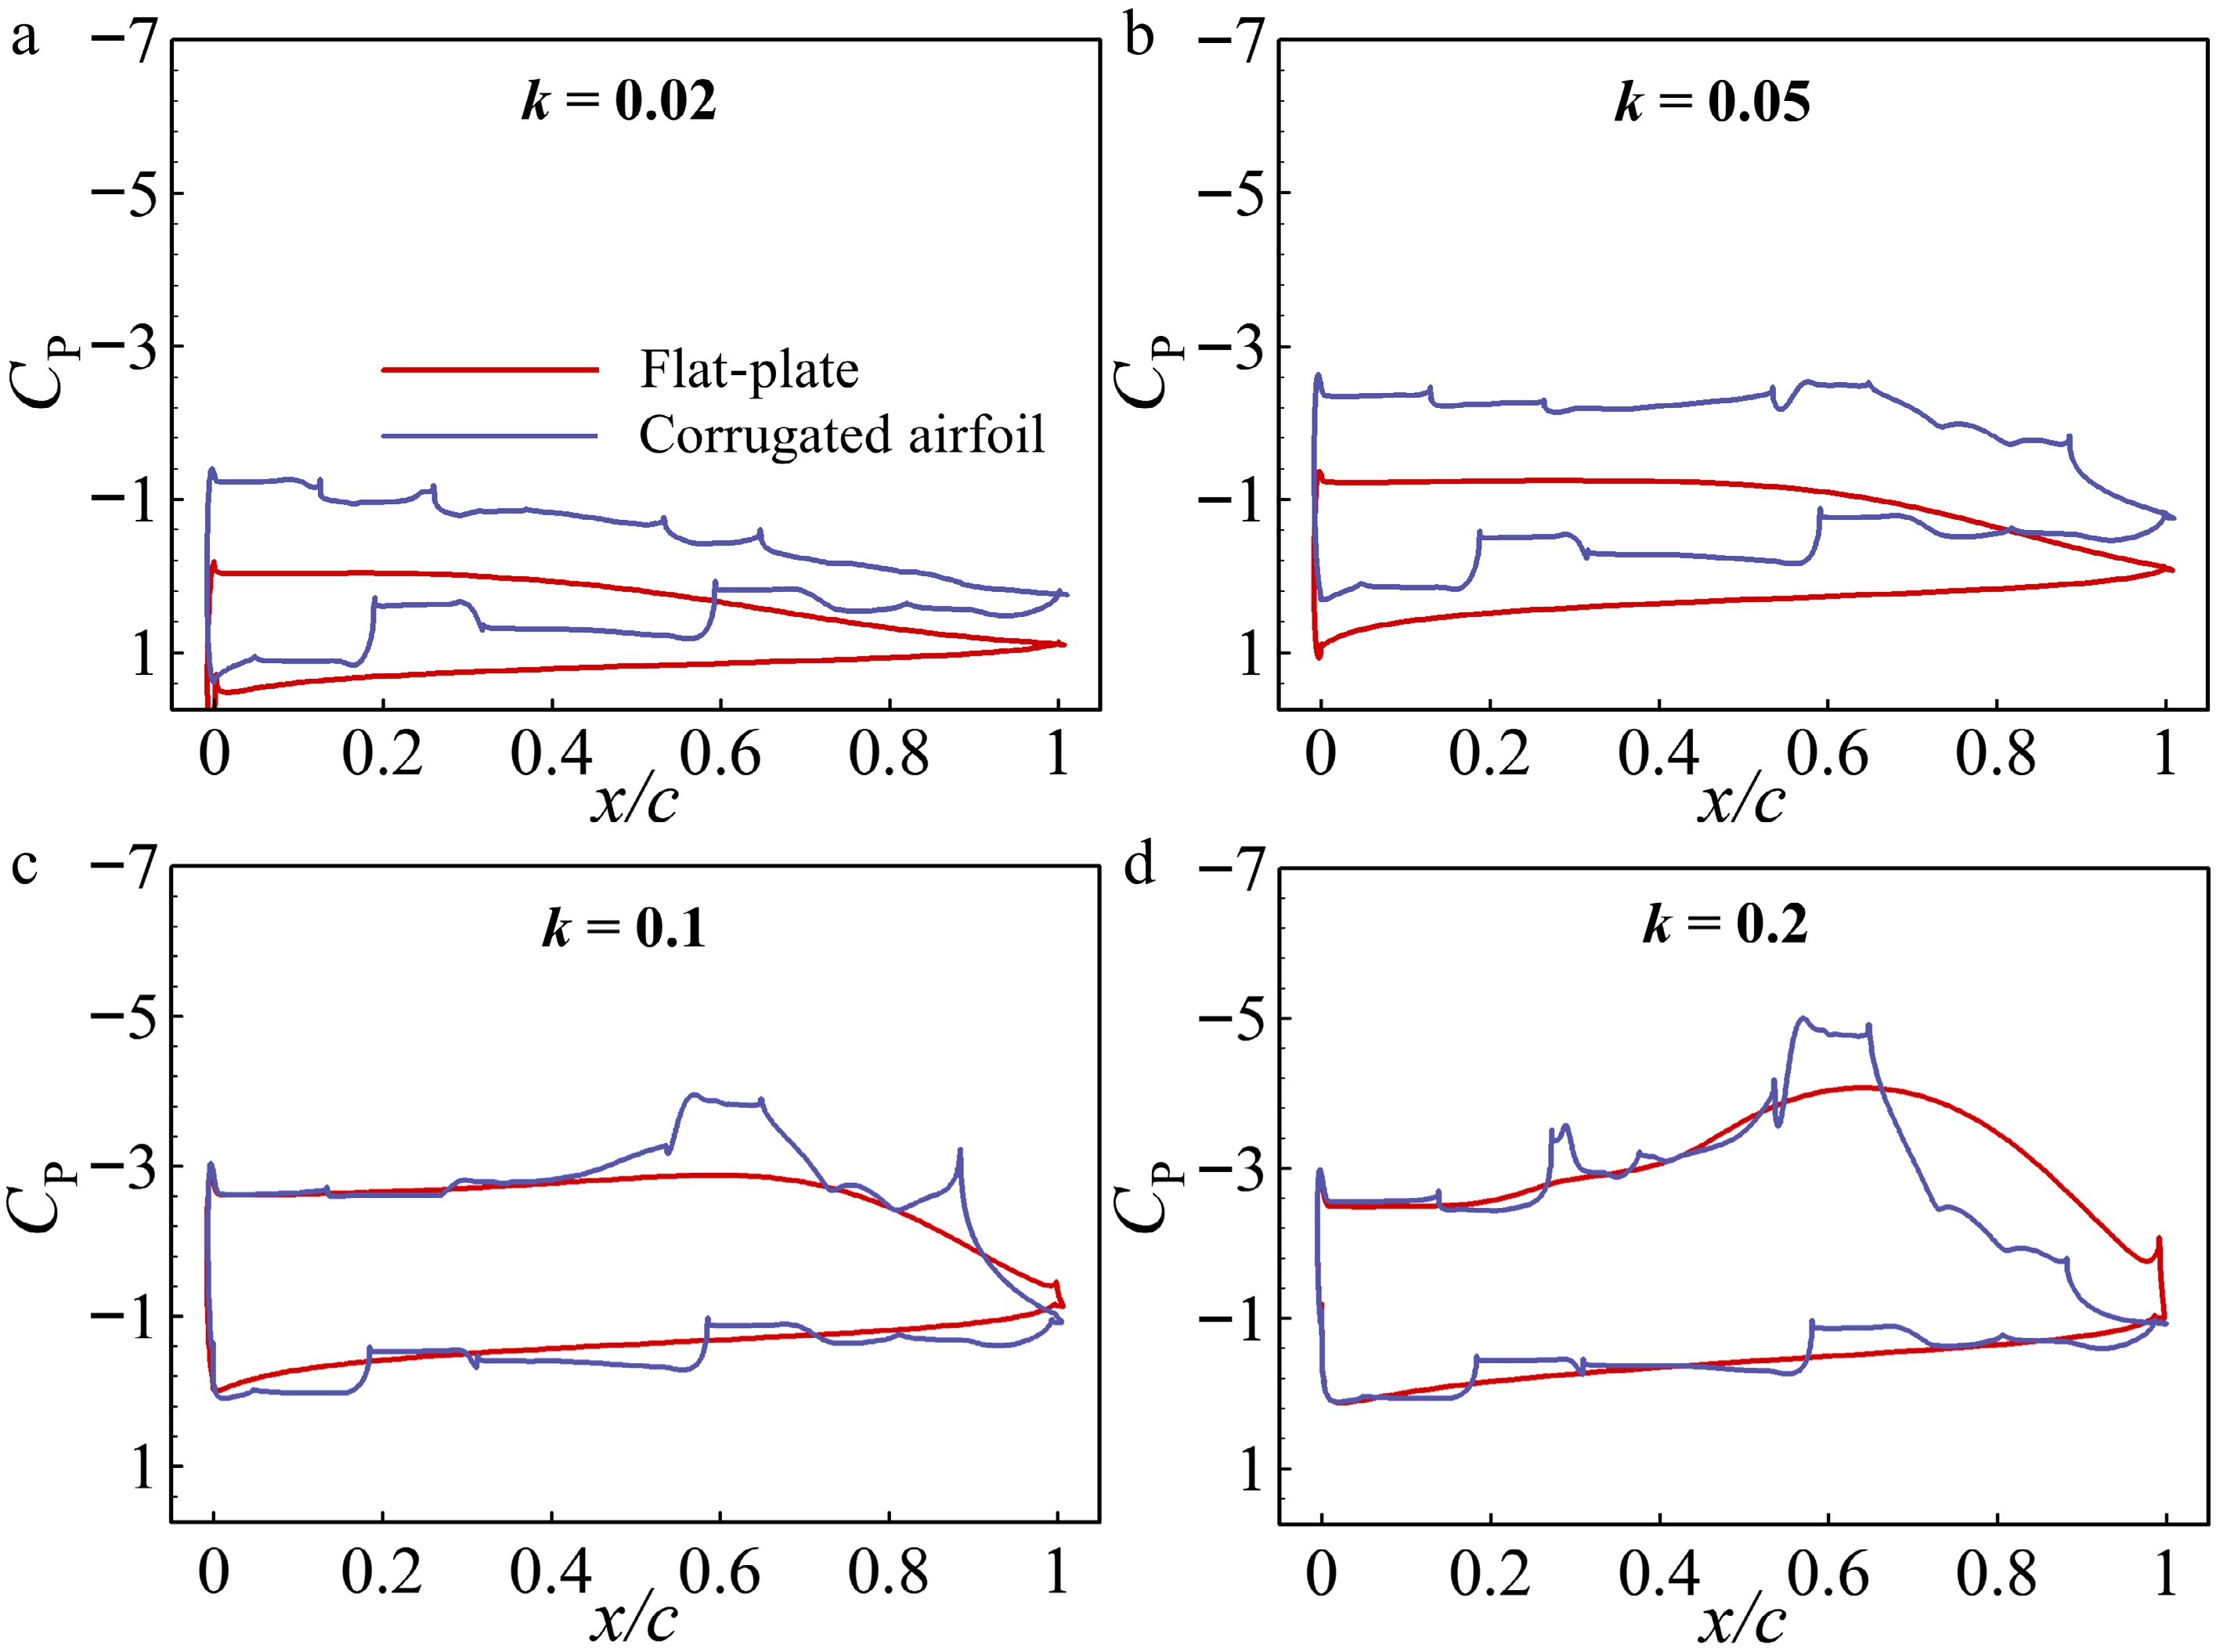
Figure 14.
Chordwise pressure coefficient distributions at the maximum angle (α = 20°) for the flat-plate and corrugated airfoils from k = 0.02 to 0.2 in panels (a)−(d).
-
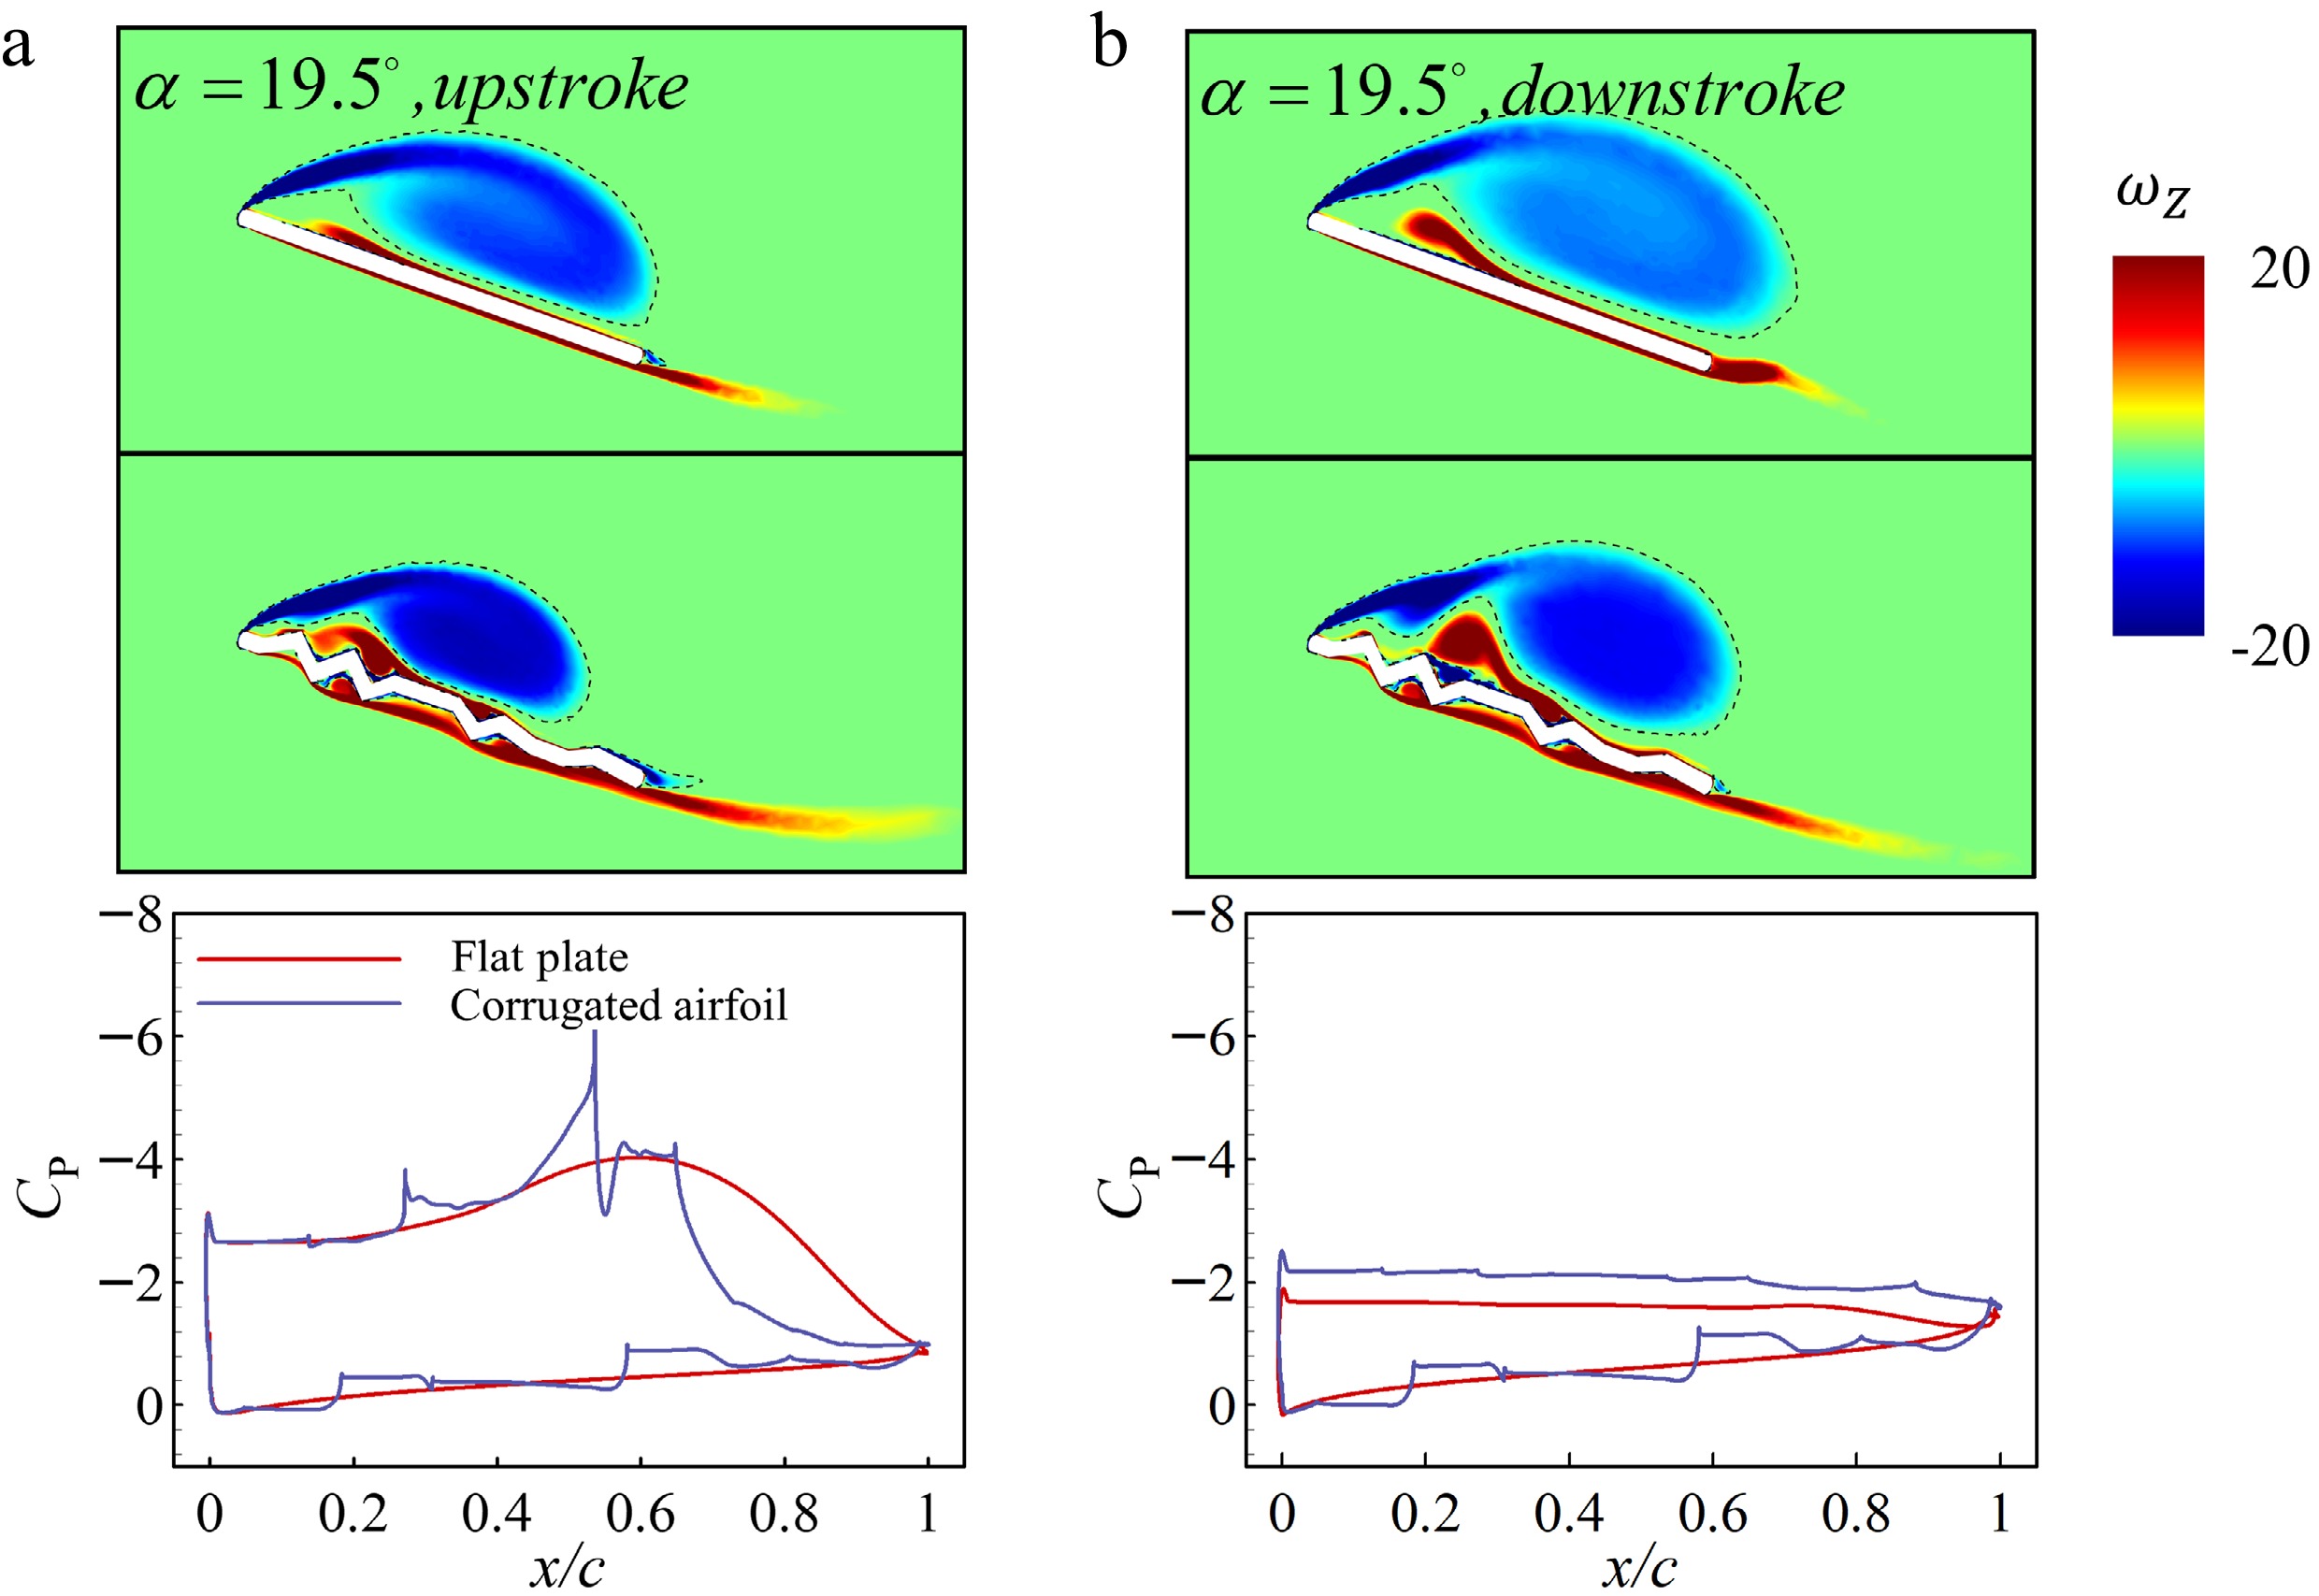
Figure 15.
Contours of dimensionless spanwise vorticity and chordwise pressure coefficient distributions at α = 19.5°, where the angle of attack approaches its maximum α = 20° during (a) upstroke and (b) downstroke phases.
-
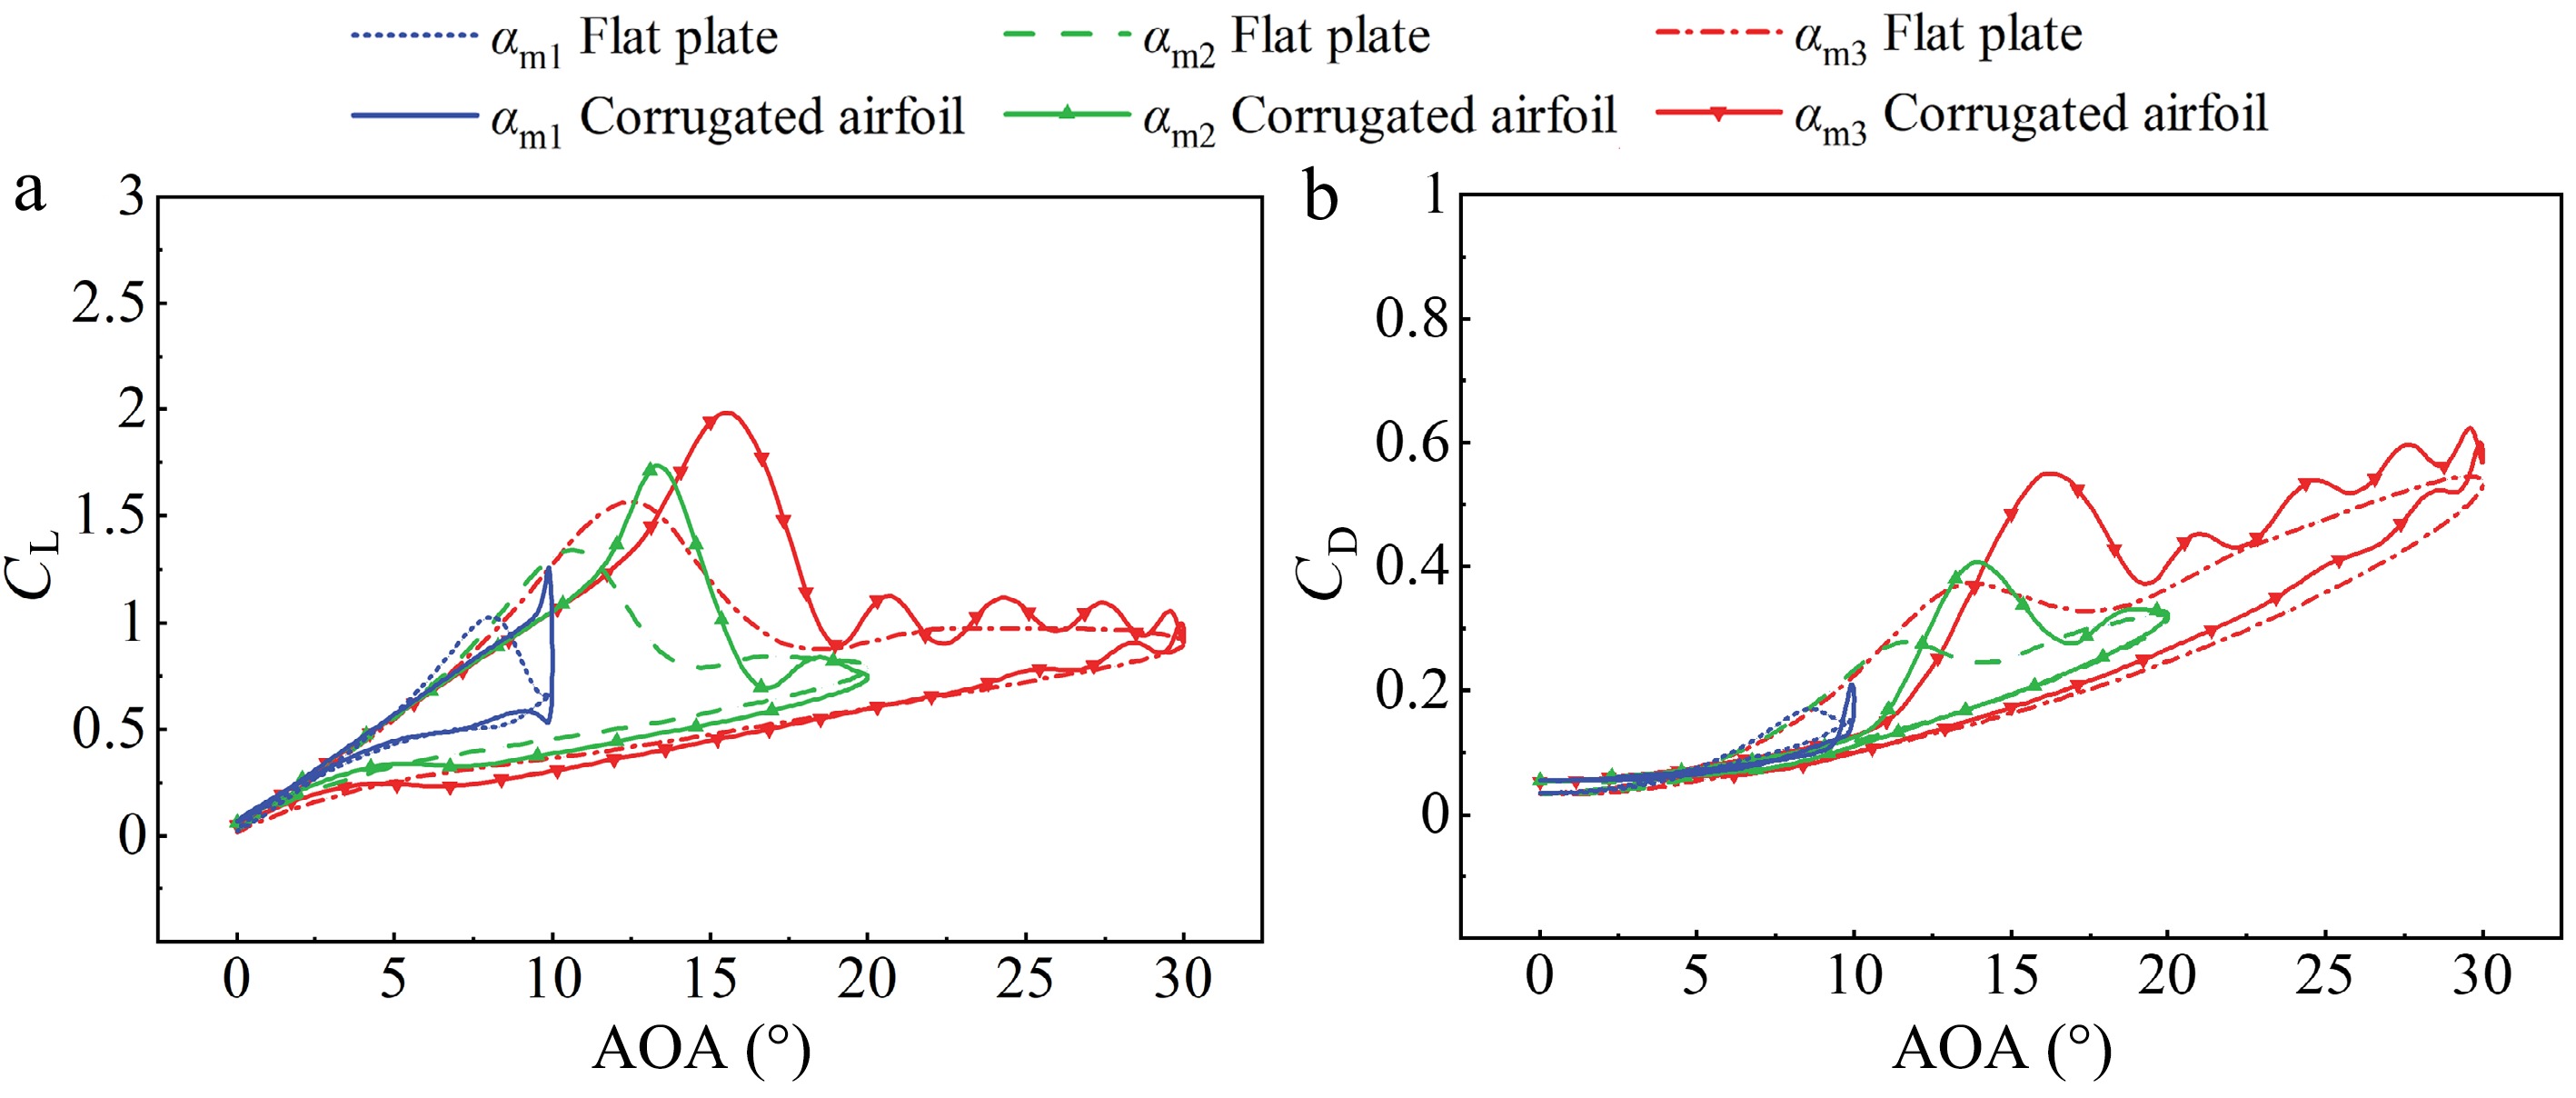
Figure 16.
Hysteresis loops of (a) lift coefficient and (b) drag coefficient for the corrugated and flat-plate airfoils at αm1 = 10°, αm2 = 20°, and αm3 = 30°.
-
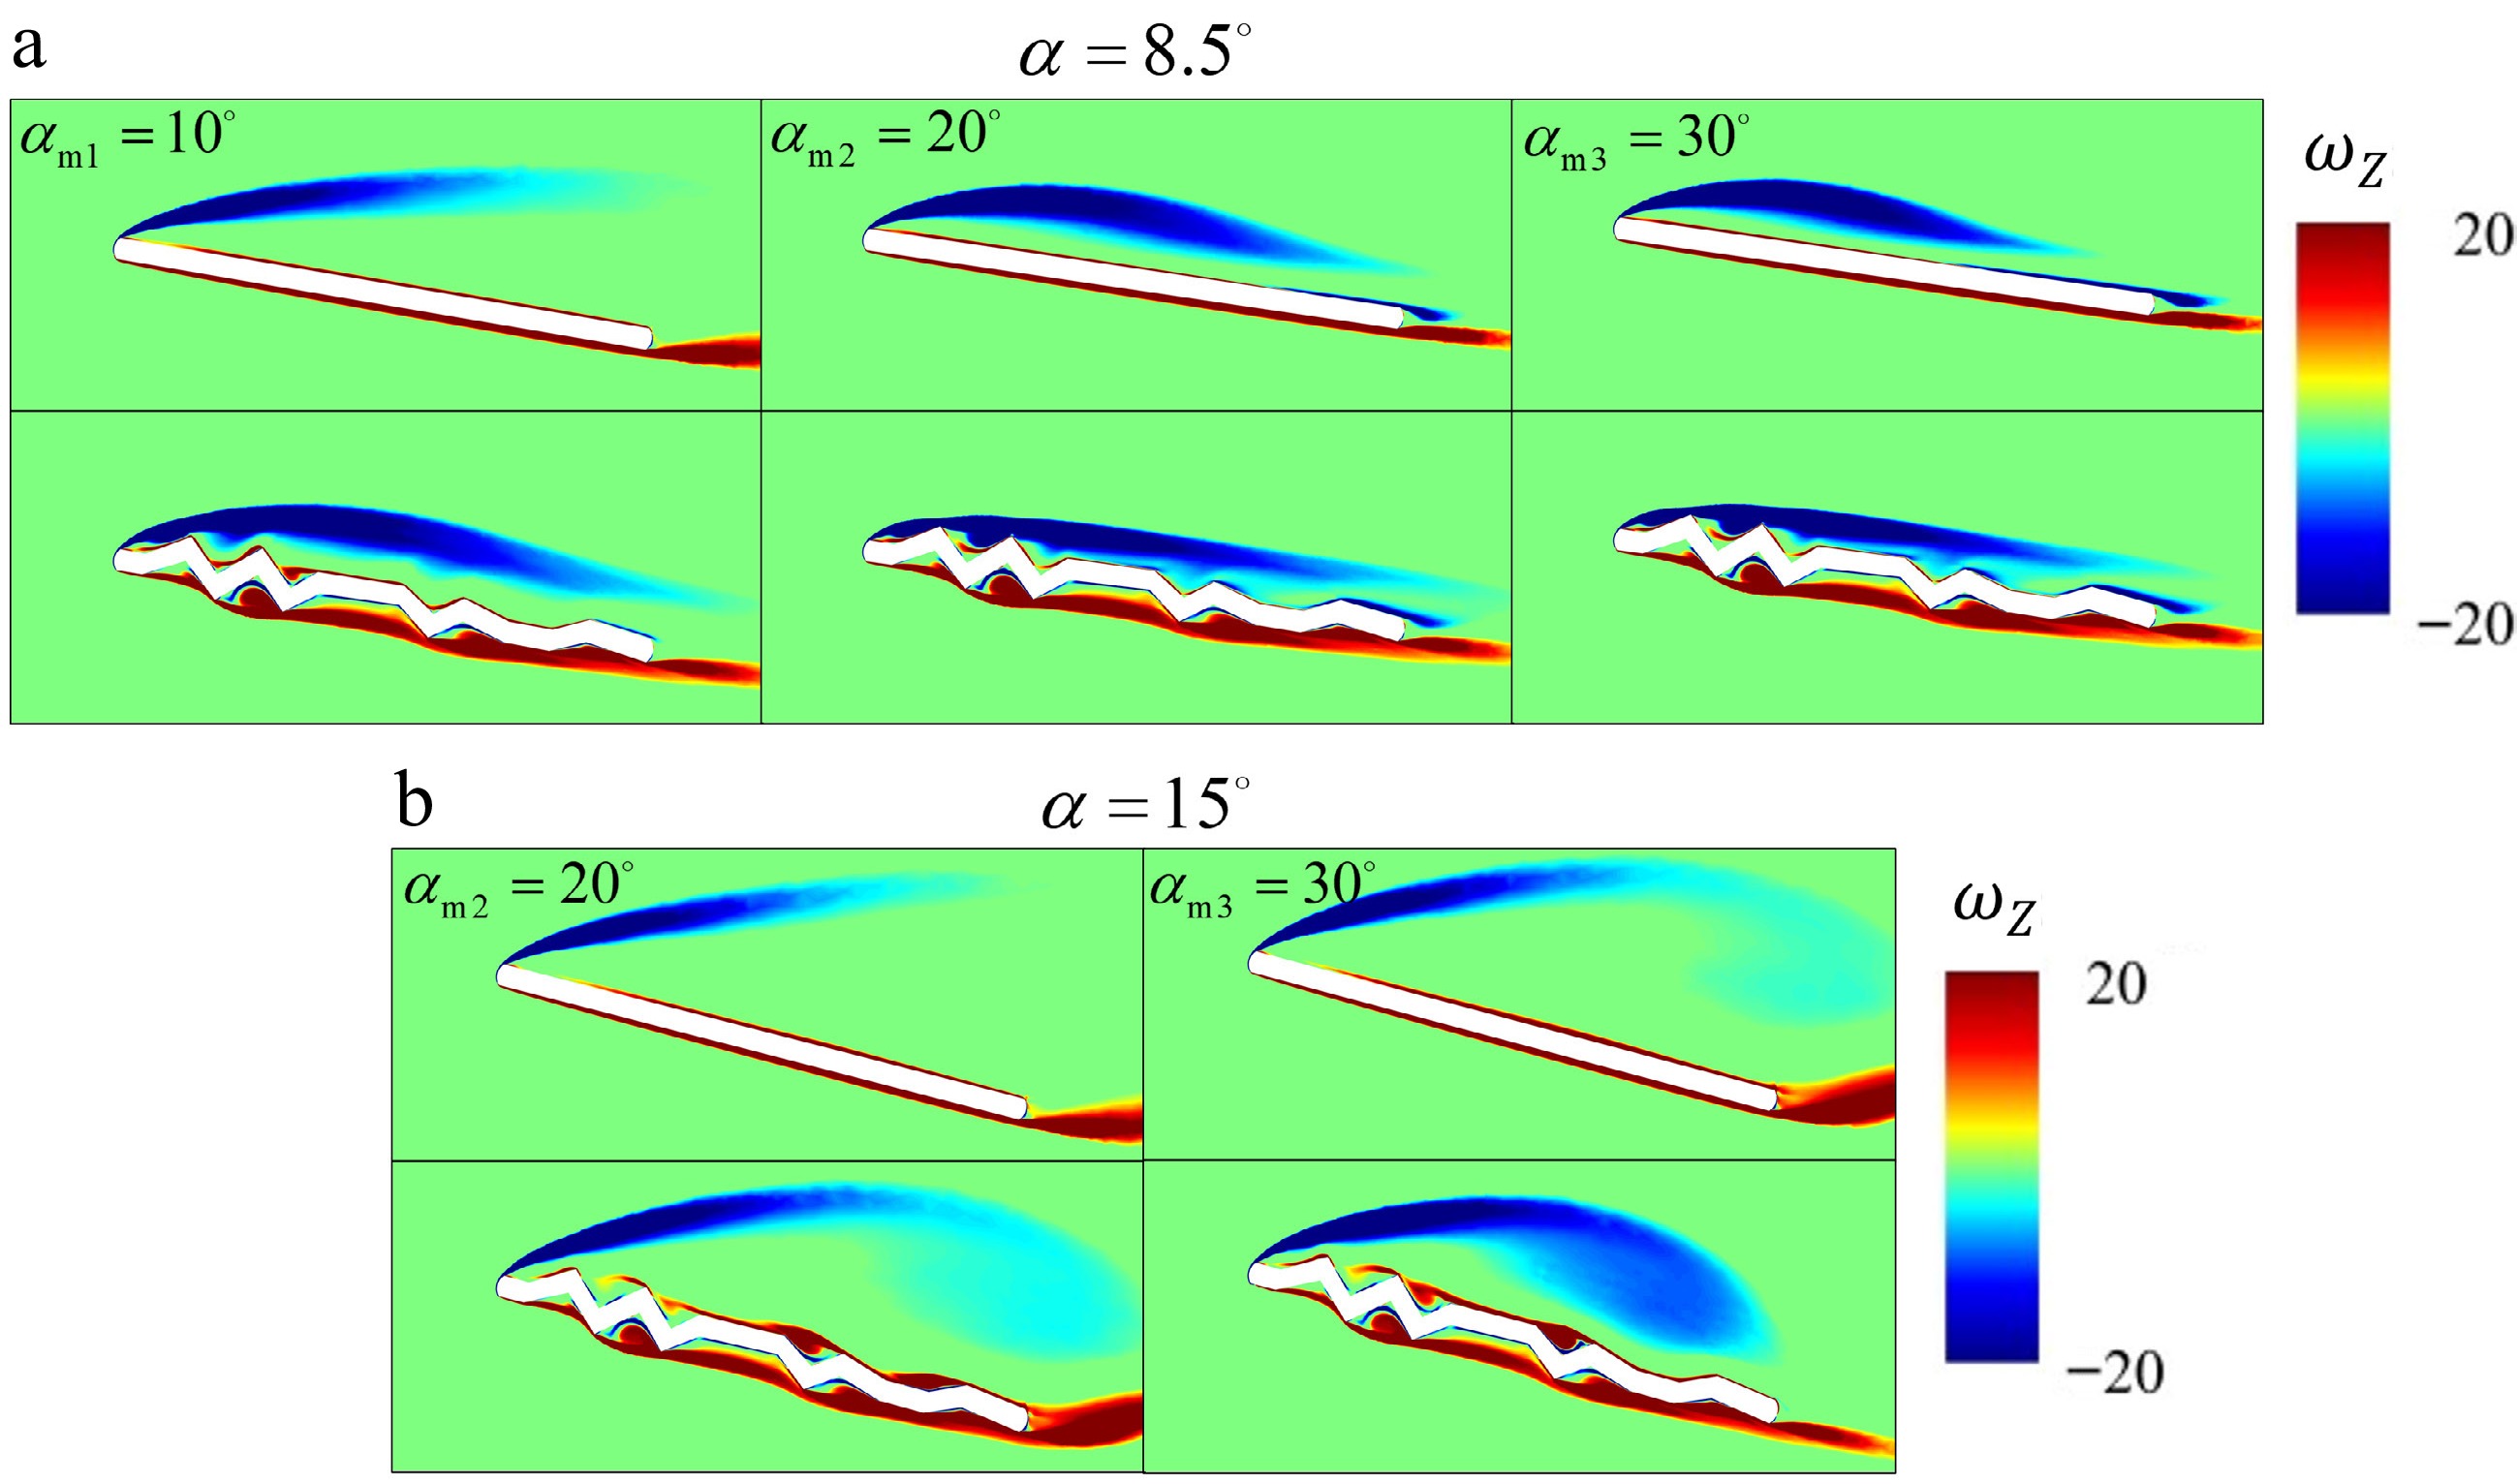
Figure 17.
Contours of dimensionless spanwise vorticity (illustrated for [a] α = 8.5° and [b] α = 15°) for the corrugated and flat-plate airfoils at αm1 = 10°, αm2 = 20°, and αm3 = 30°.
-
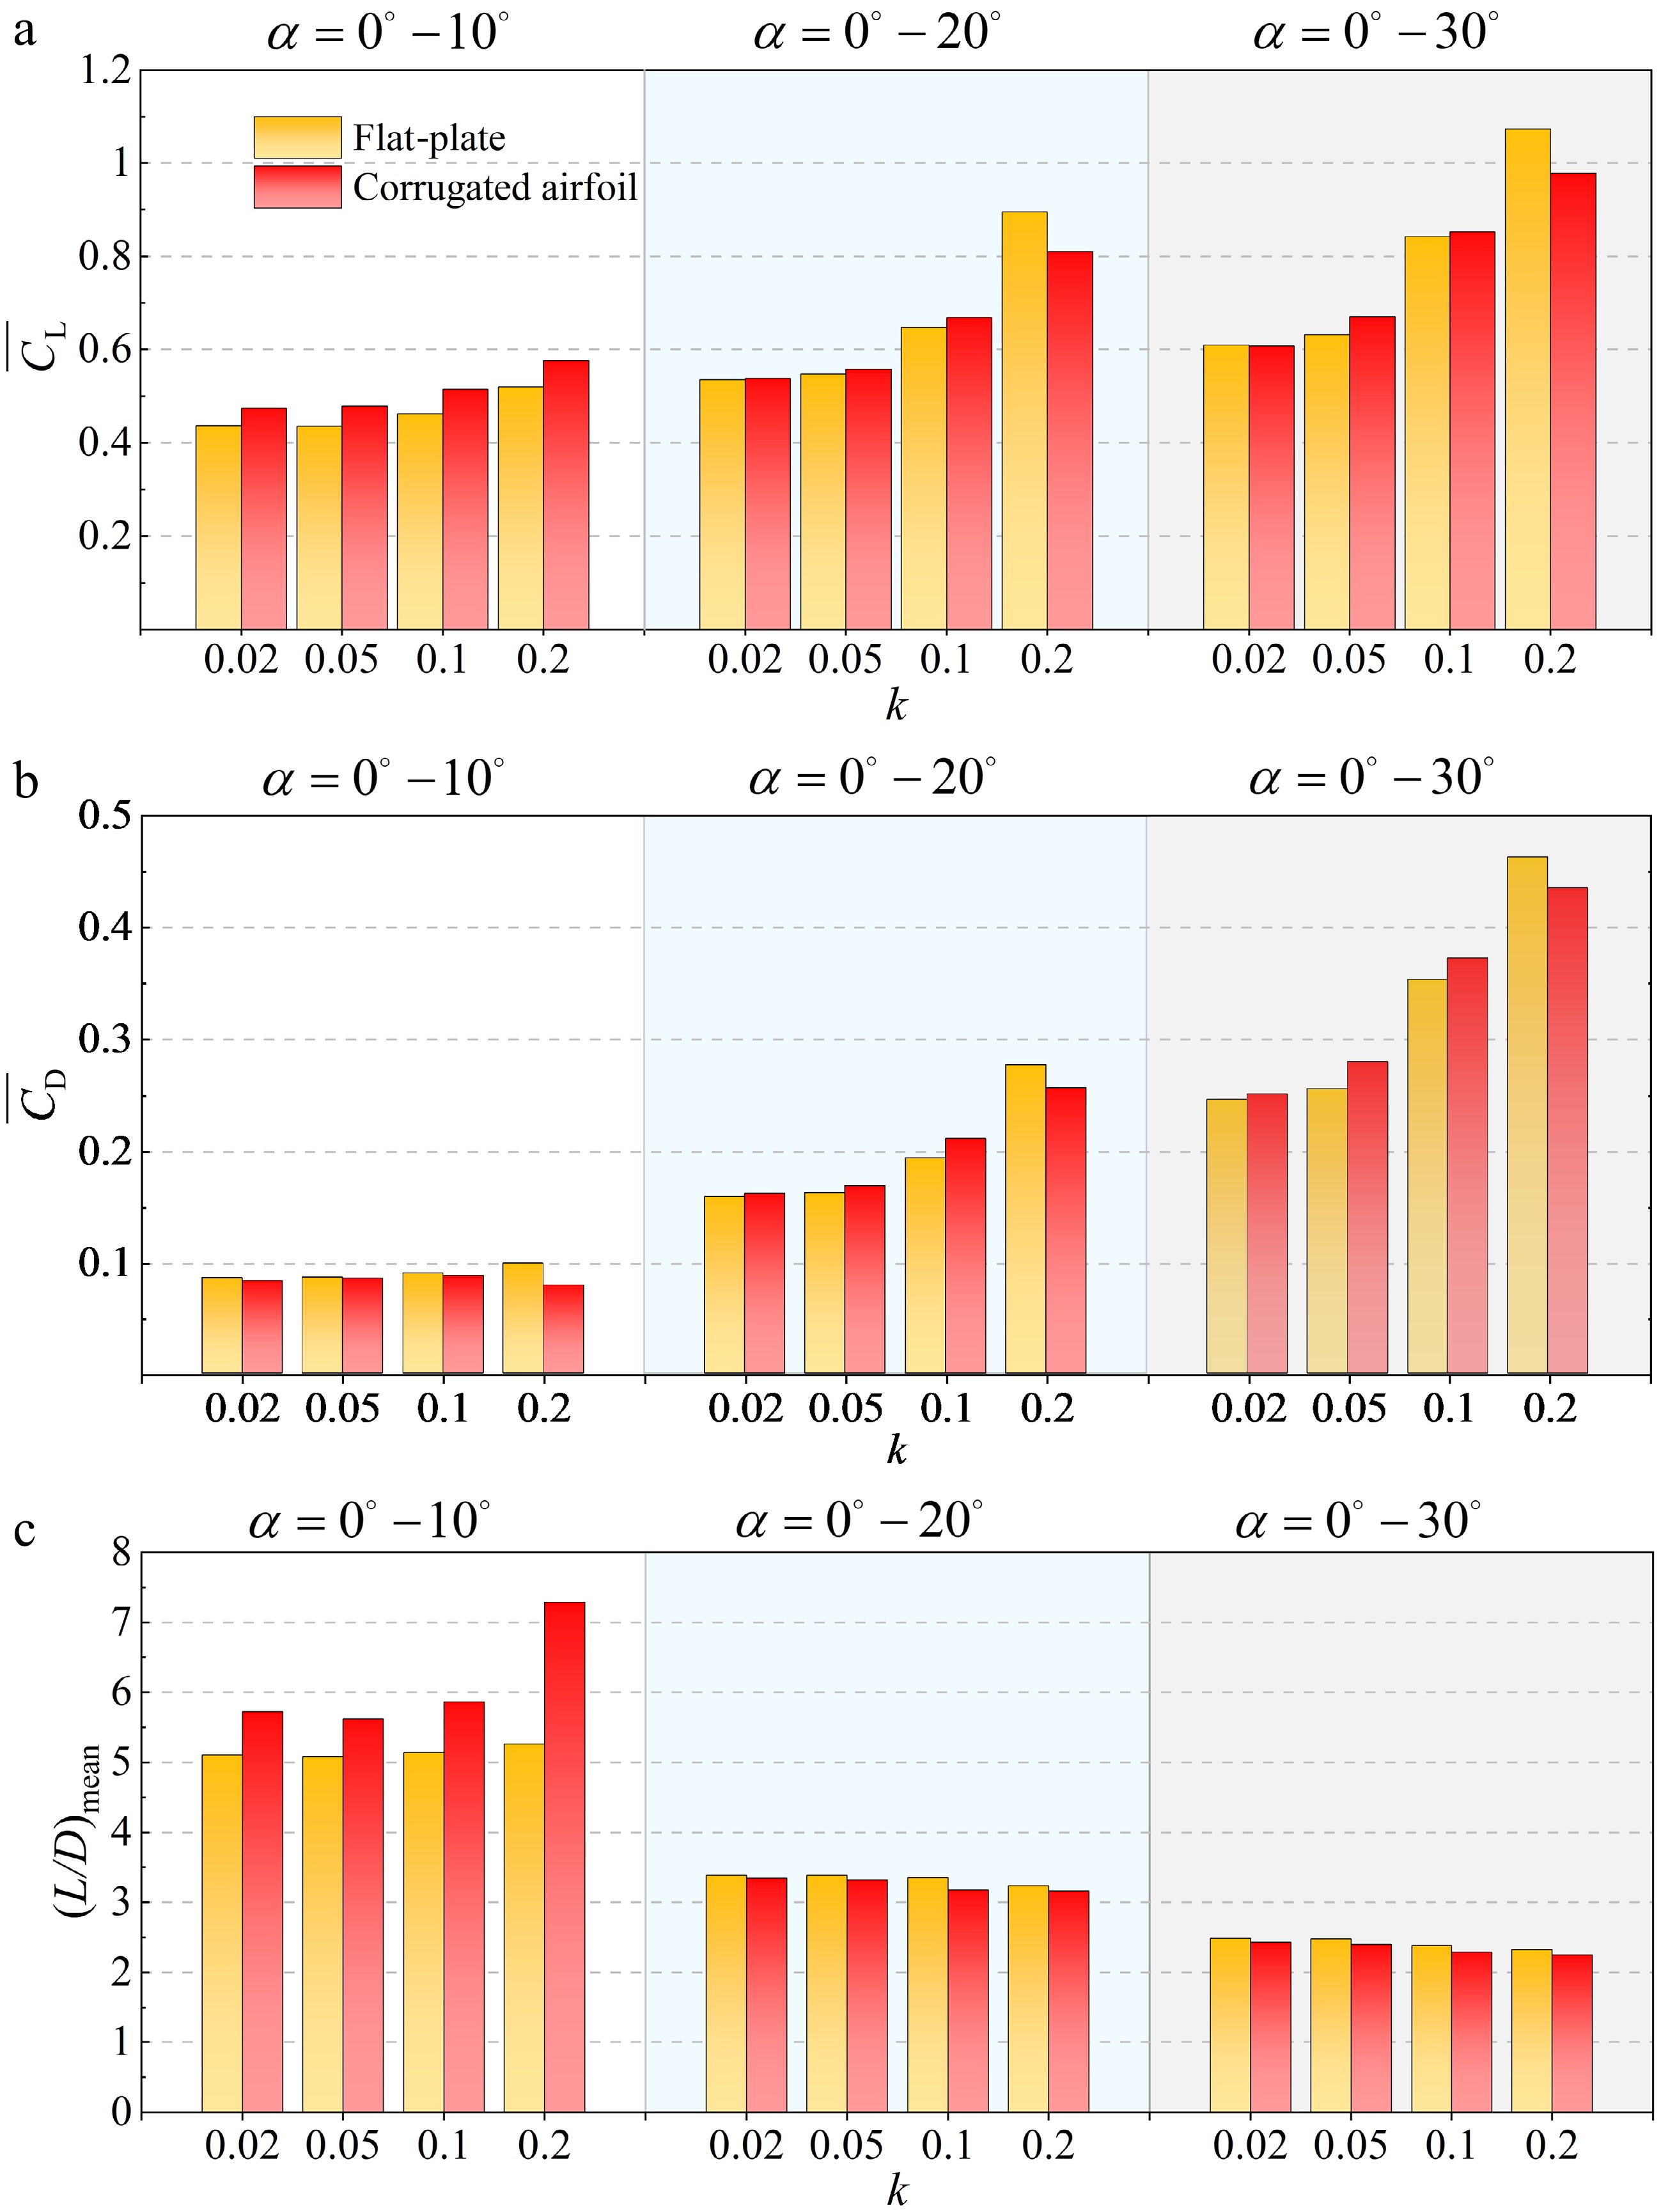
Figure 18.
Averaged values of lift, drag, and lift-to-drag ratio for the corrugated and flat-plate airfoils under different k and ranges of α: (a) lift, (b) drag, and (c) lift-to-drag ratio.
-
Mesh Time steps per cycle Cell count $ \overline{C_{\mathrm{L}}} $ 200 0.513 Medium 400 0.24 million 0.516 800 0.517 Table 1.
Mean lift coefficient for different time-step sizes.
-
k Airfoil type $ \overline{C_{\mathrm{L}}} $ $ \overline{C_{\mathrm{D}}} $ (L/D)mean 0.02 Flat-plate 0.437 0.086 5.107 Corrugated 0.474 0.083 5.725 0.05 Flat-plate 0.436 0.086 5.117 Corrugated 0.479 0.085 5.624 0.1 Flat-plate 0.462 0.090 5.143 Corrugated 0.515 0.088 5.865 0.2 Flat-plate 0.520 0.099 5.263 Corrugated 0.576 0.079 7.289 Table 2.
Cycle-averaged aerodynamic behavior of different k for α = 0°−10°.
Figures
(18)
Tables
(2)