-
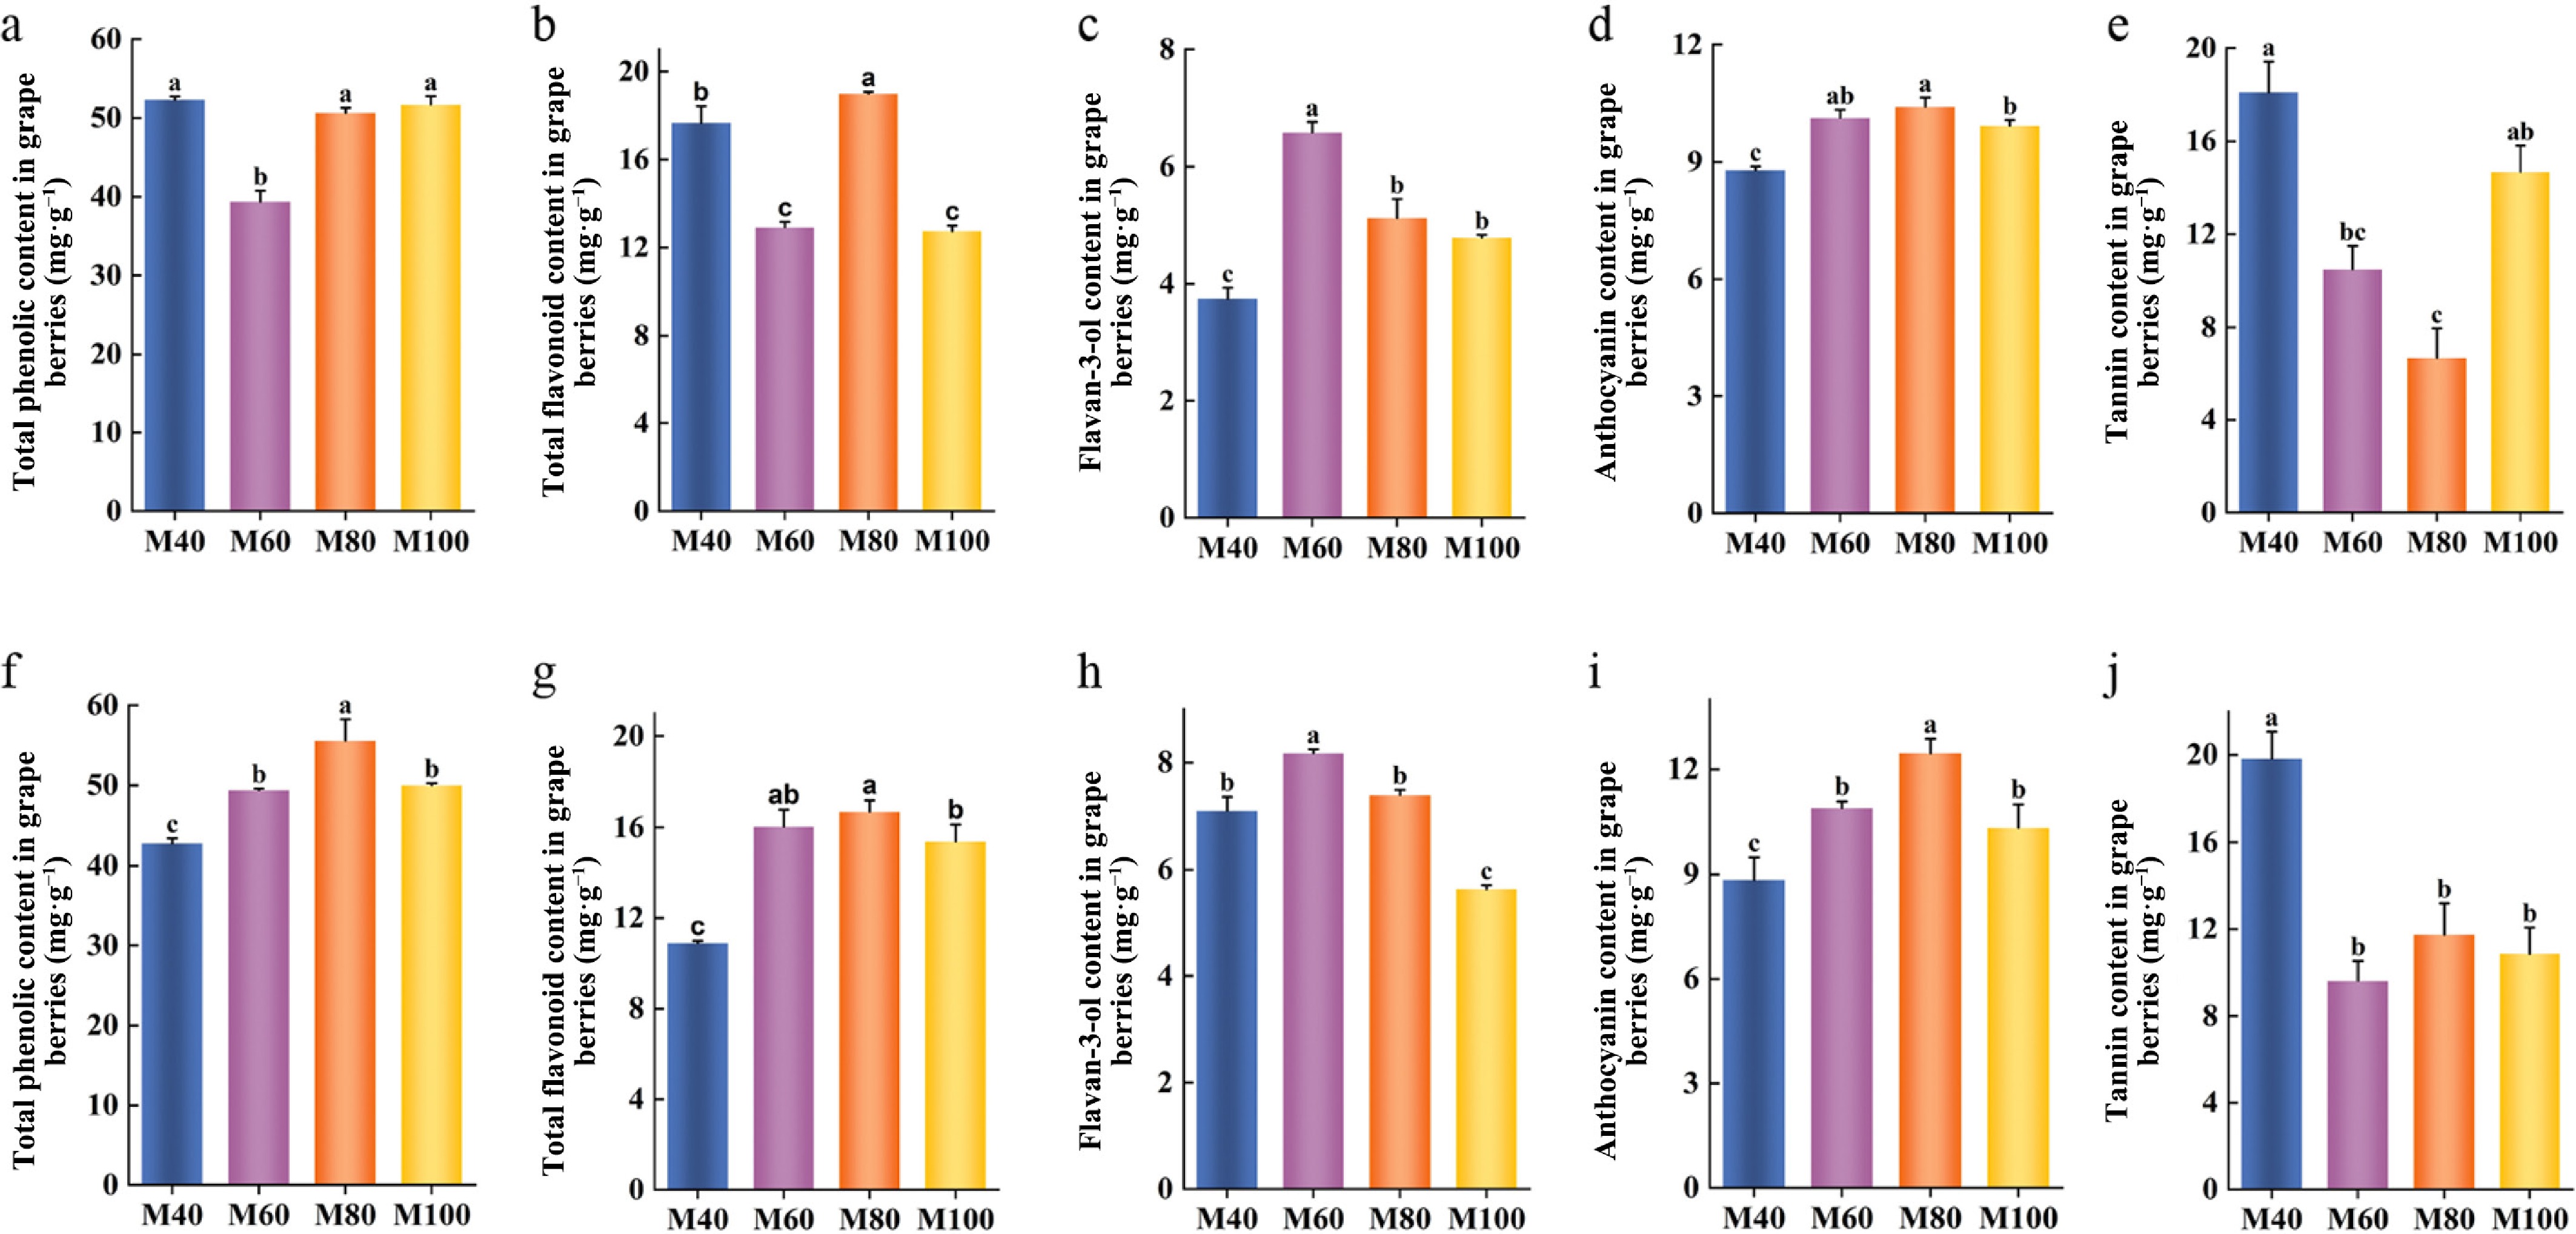
Figure 1.
Changes in total phenols, total flavonoids, and total flavan-3-ols in 'Merlot' grape berries under different canopy thicknesses. (a–e) illustrate the changes in the components in 2023; (f–j) illustrate the changes in the components in 2024. Bars show mean levels of three biological replicates (± SD). Different lowercase letters indicate levels of significance as determined by one-way ANOVA followed by Duncan's test: p < 0.05.
-
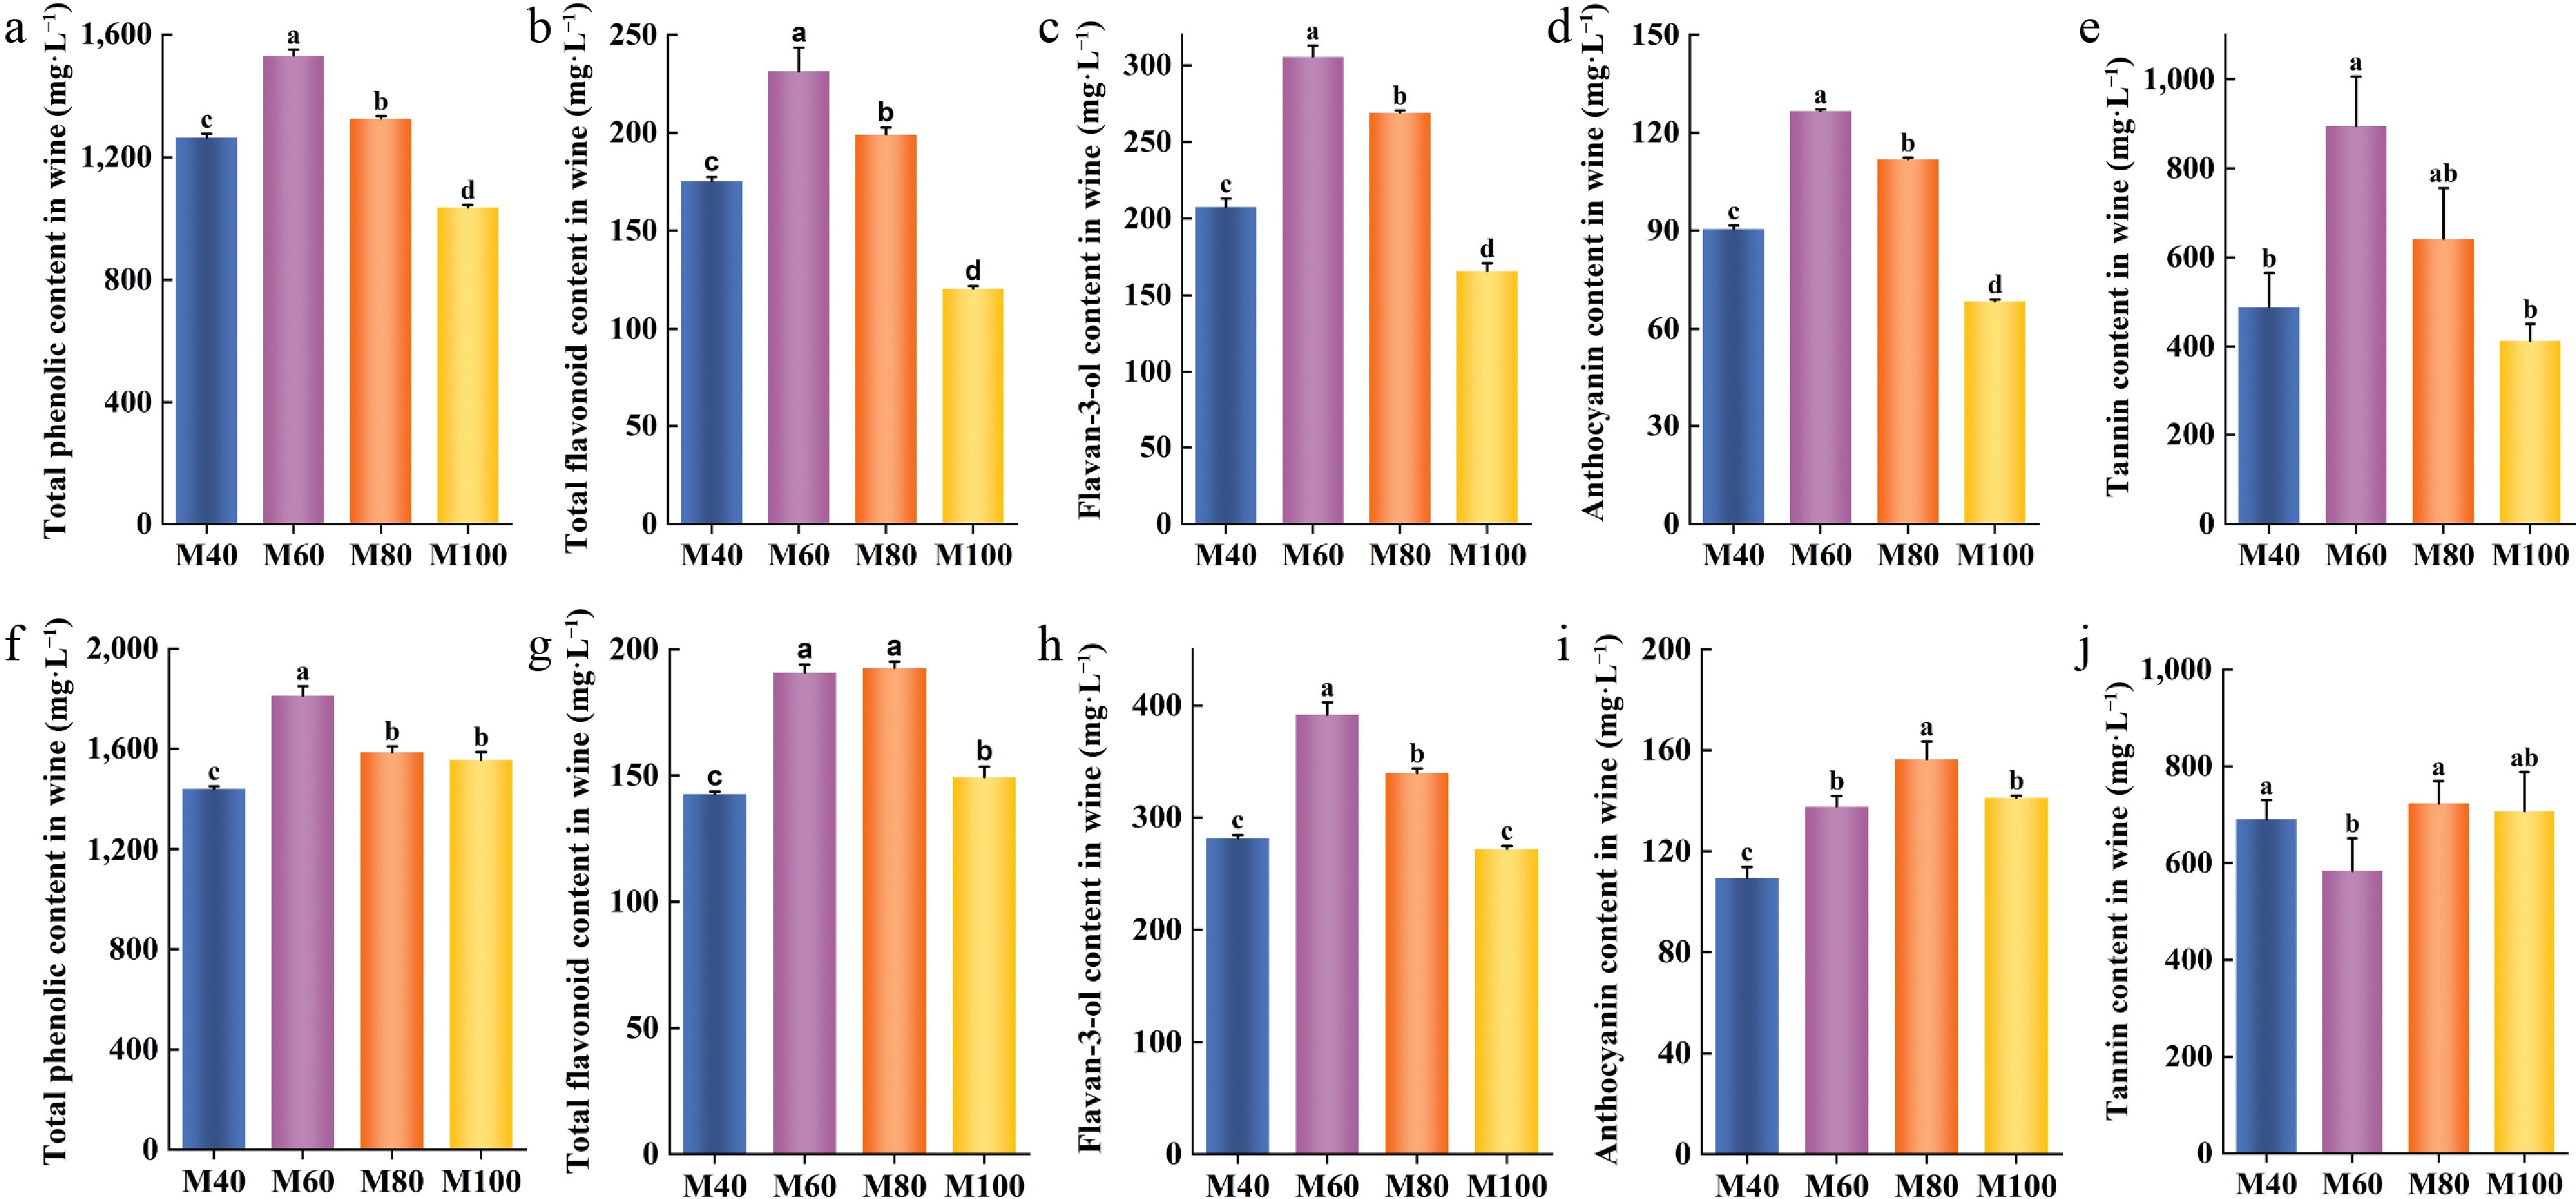
Figure 2.
Changes in total phenols, total flavonoids, total flavan-3-ols, total anthocyanins, and total tannins in 'Merlot' wine under different leaf canopy thicknesses. (a–e) show the changes in 2023; (f–j) show the changes in 2024. Bars show mean levels of three biological replicates (± SD). Different lowercase letters indicate levels of significance as determined by one-way ANOVA followed by Duncan's test: p < 0.05.
-
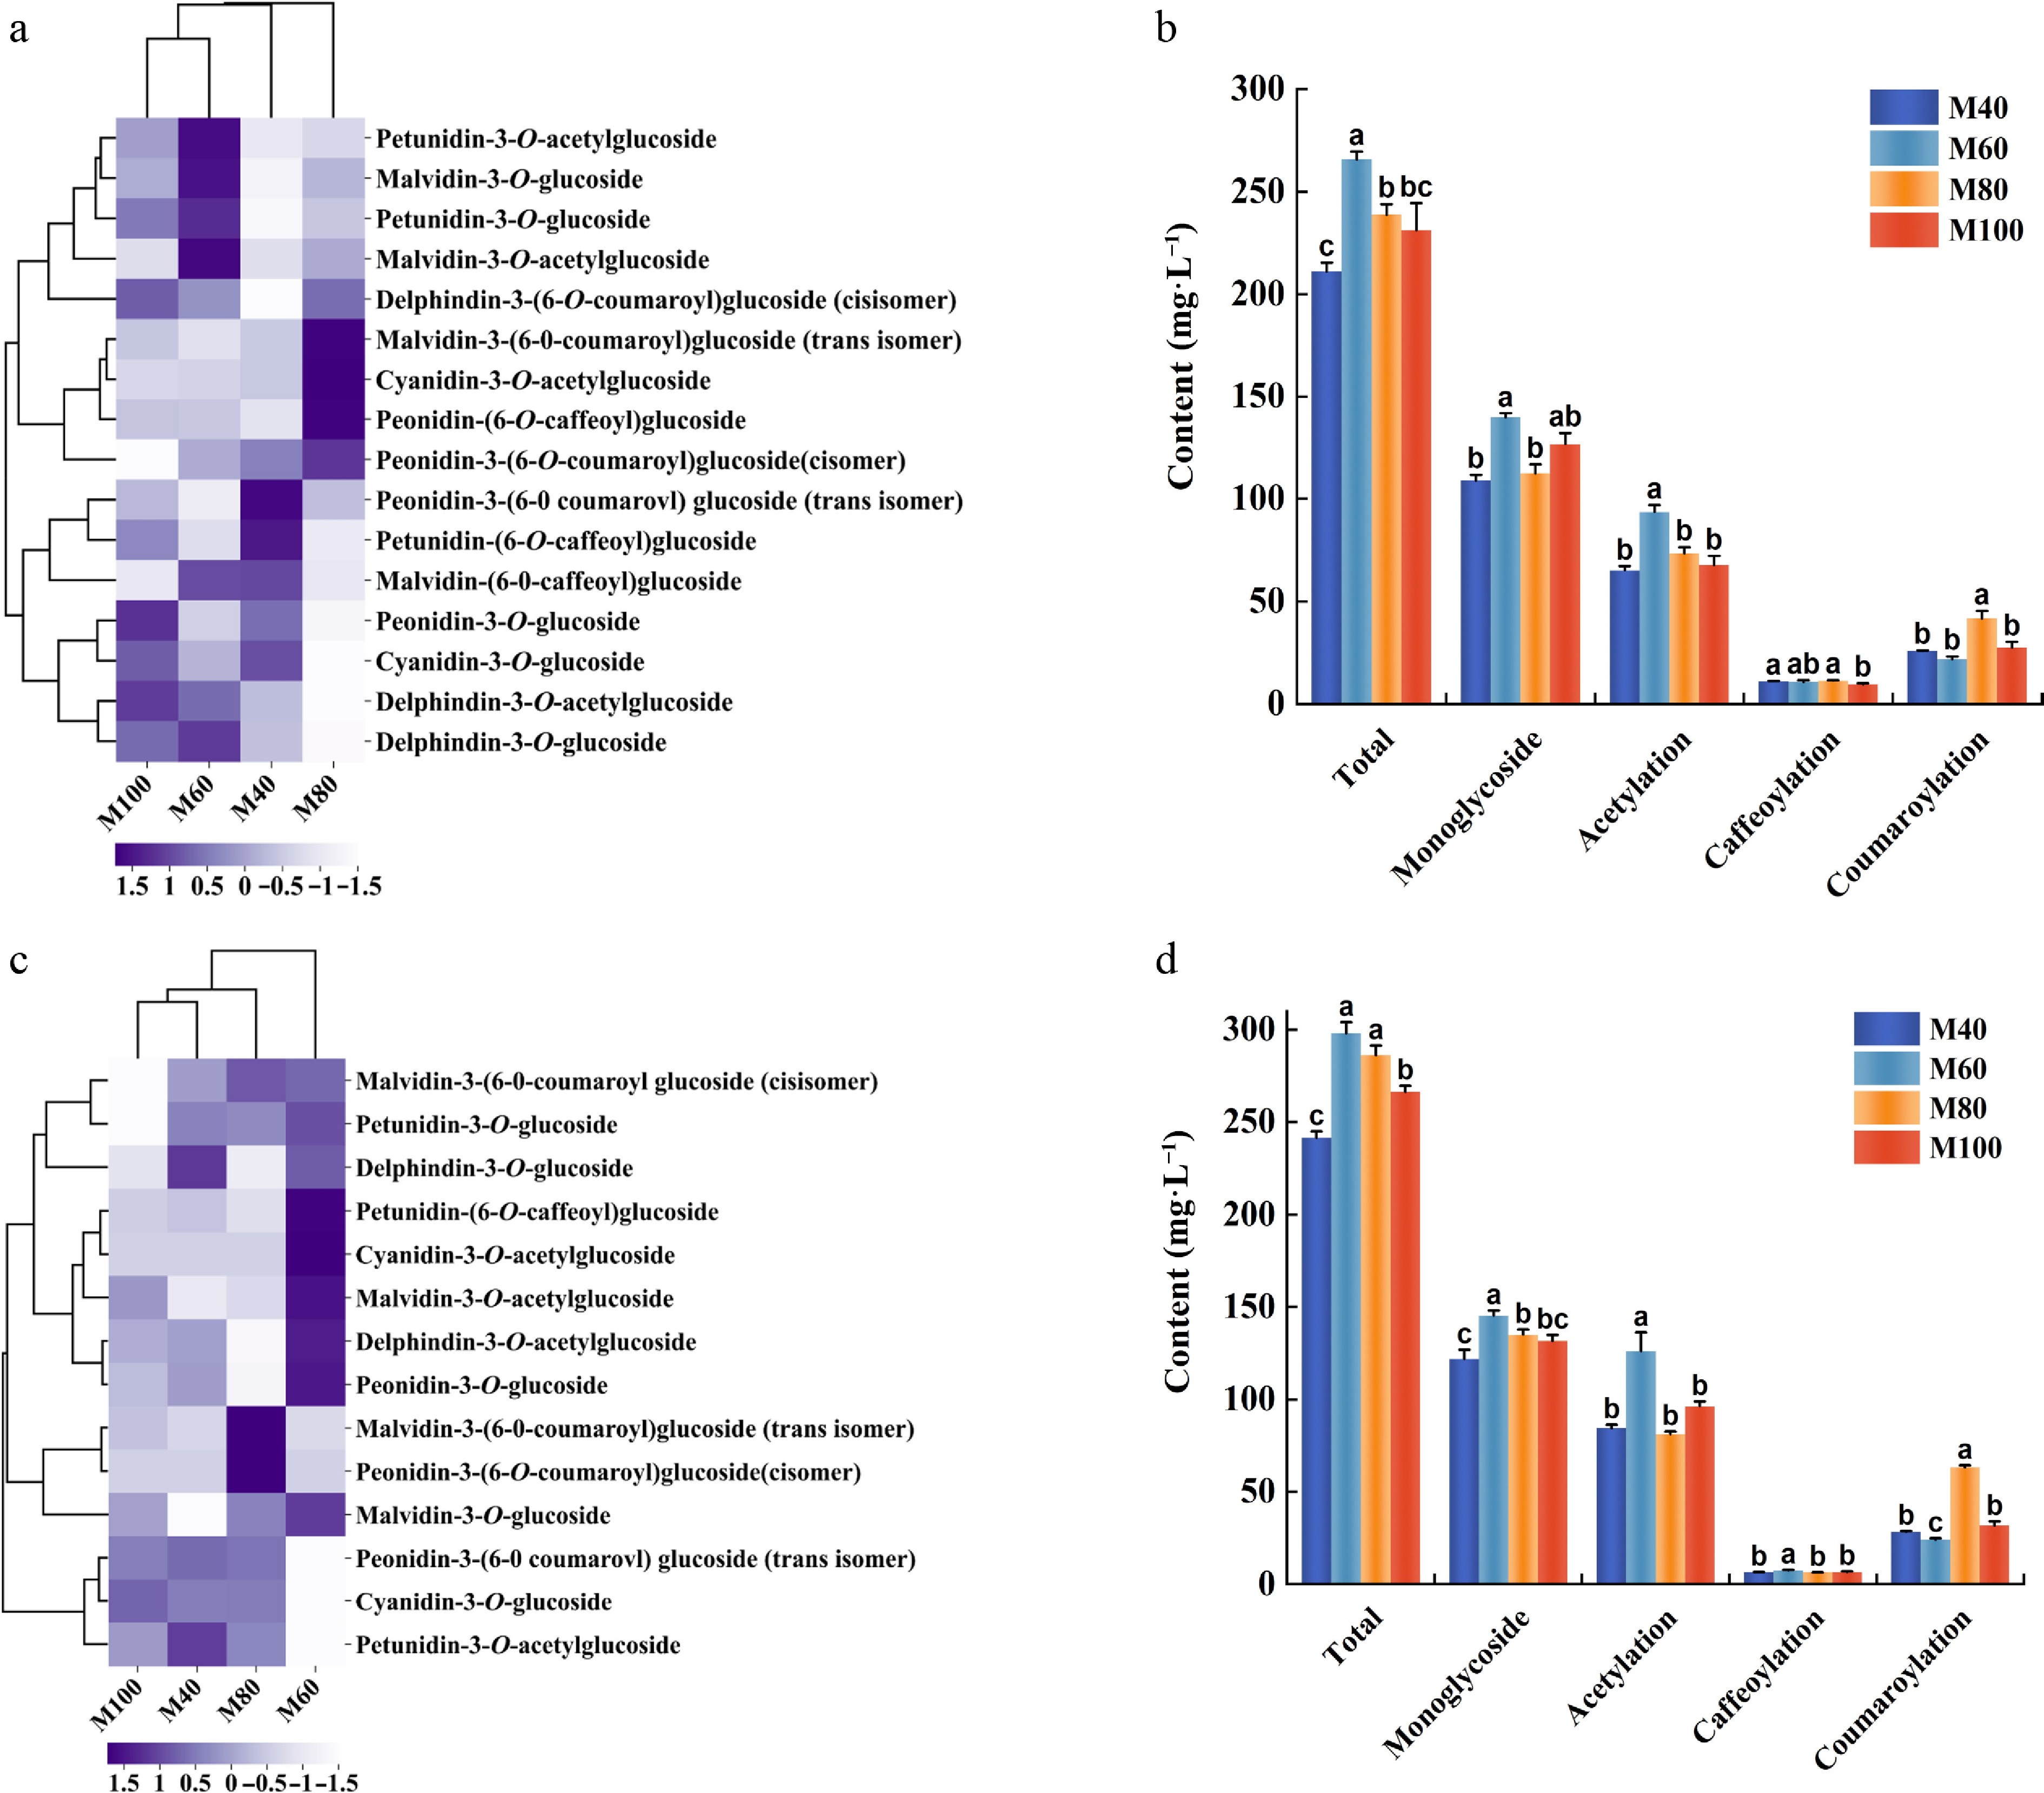
Figure 3.
Effects of canopy thickness on monomeric anthocyanins in 'Merlot' grapes. (a–d) show the heatmap clustering and quantitative classification of monomeric anthocyanins in 2023 (a, b) and 2024 (c, d). Bars show mean levels of three biological replicates (± SD). Different lowercase letters indicate levels of significance as determined by one-way ANOVA followed by Duncan's test: p < 0.05.
-
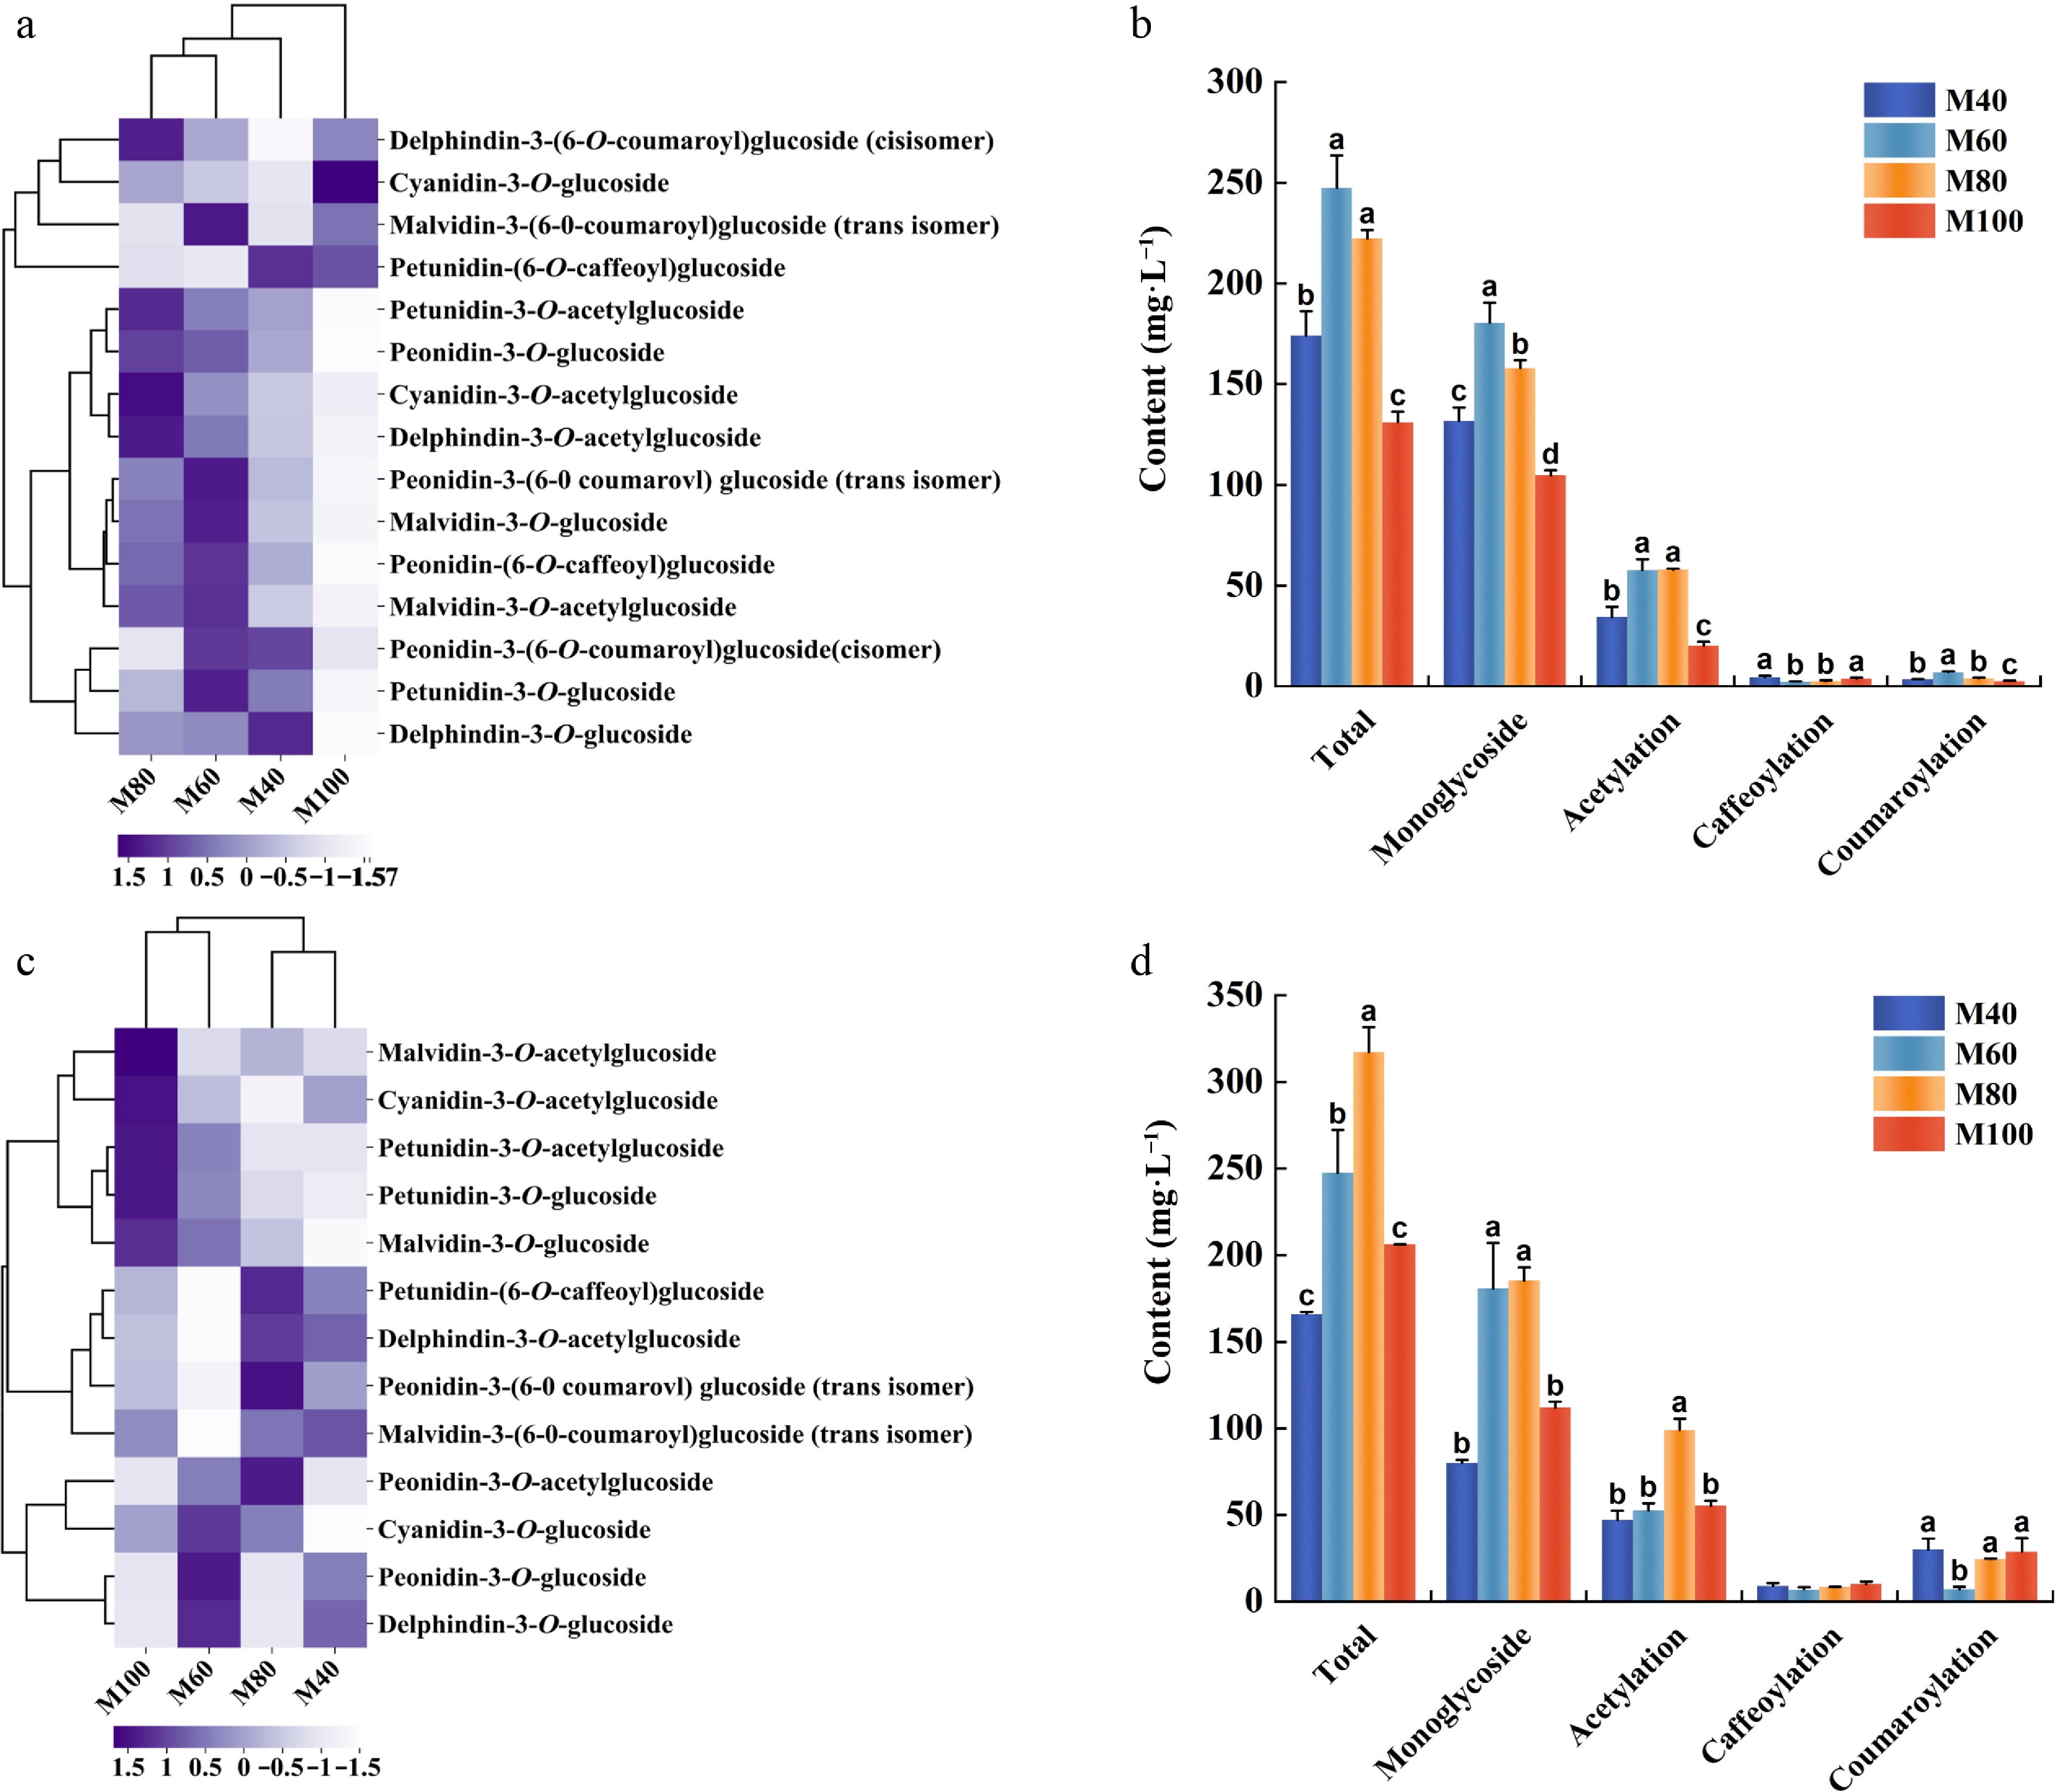
Figure 4.
Effects of canopy thickness on monomeric anthocyanins in 'Merlot' wine. (a, b) Clustering heatmap and classification with quantitative comparison of monomeric anthocyanins in 2023; (c, d) clustering heatmap and classification with quantitative comparison of monomeric anthocyanins in 2024. Bars show mean levels of three biological replicates (± SD). Different lowercase letters indicate levels of significance as determined by one-way ANOVA followed by Duncan's test: p < 0.05.
-
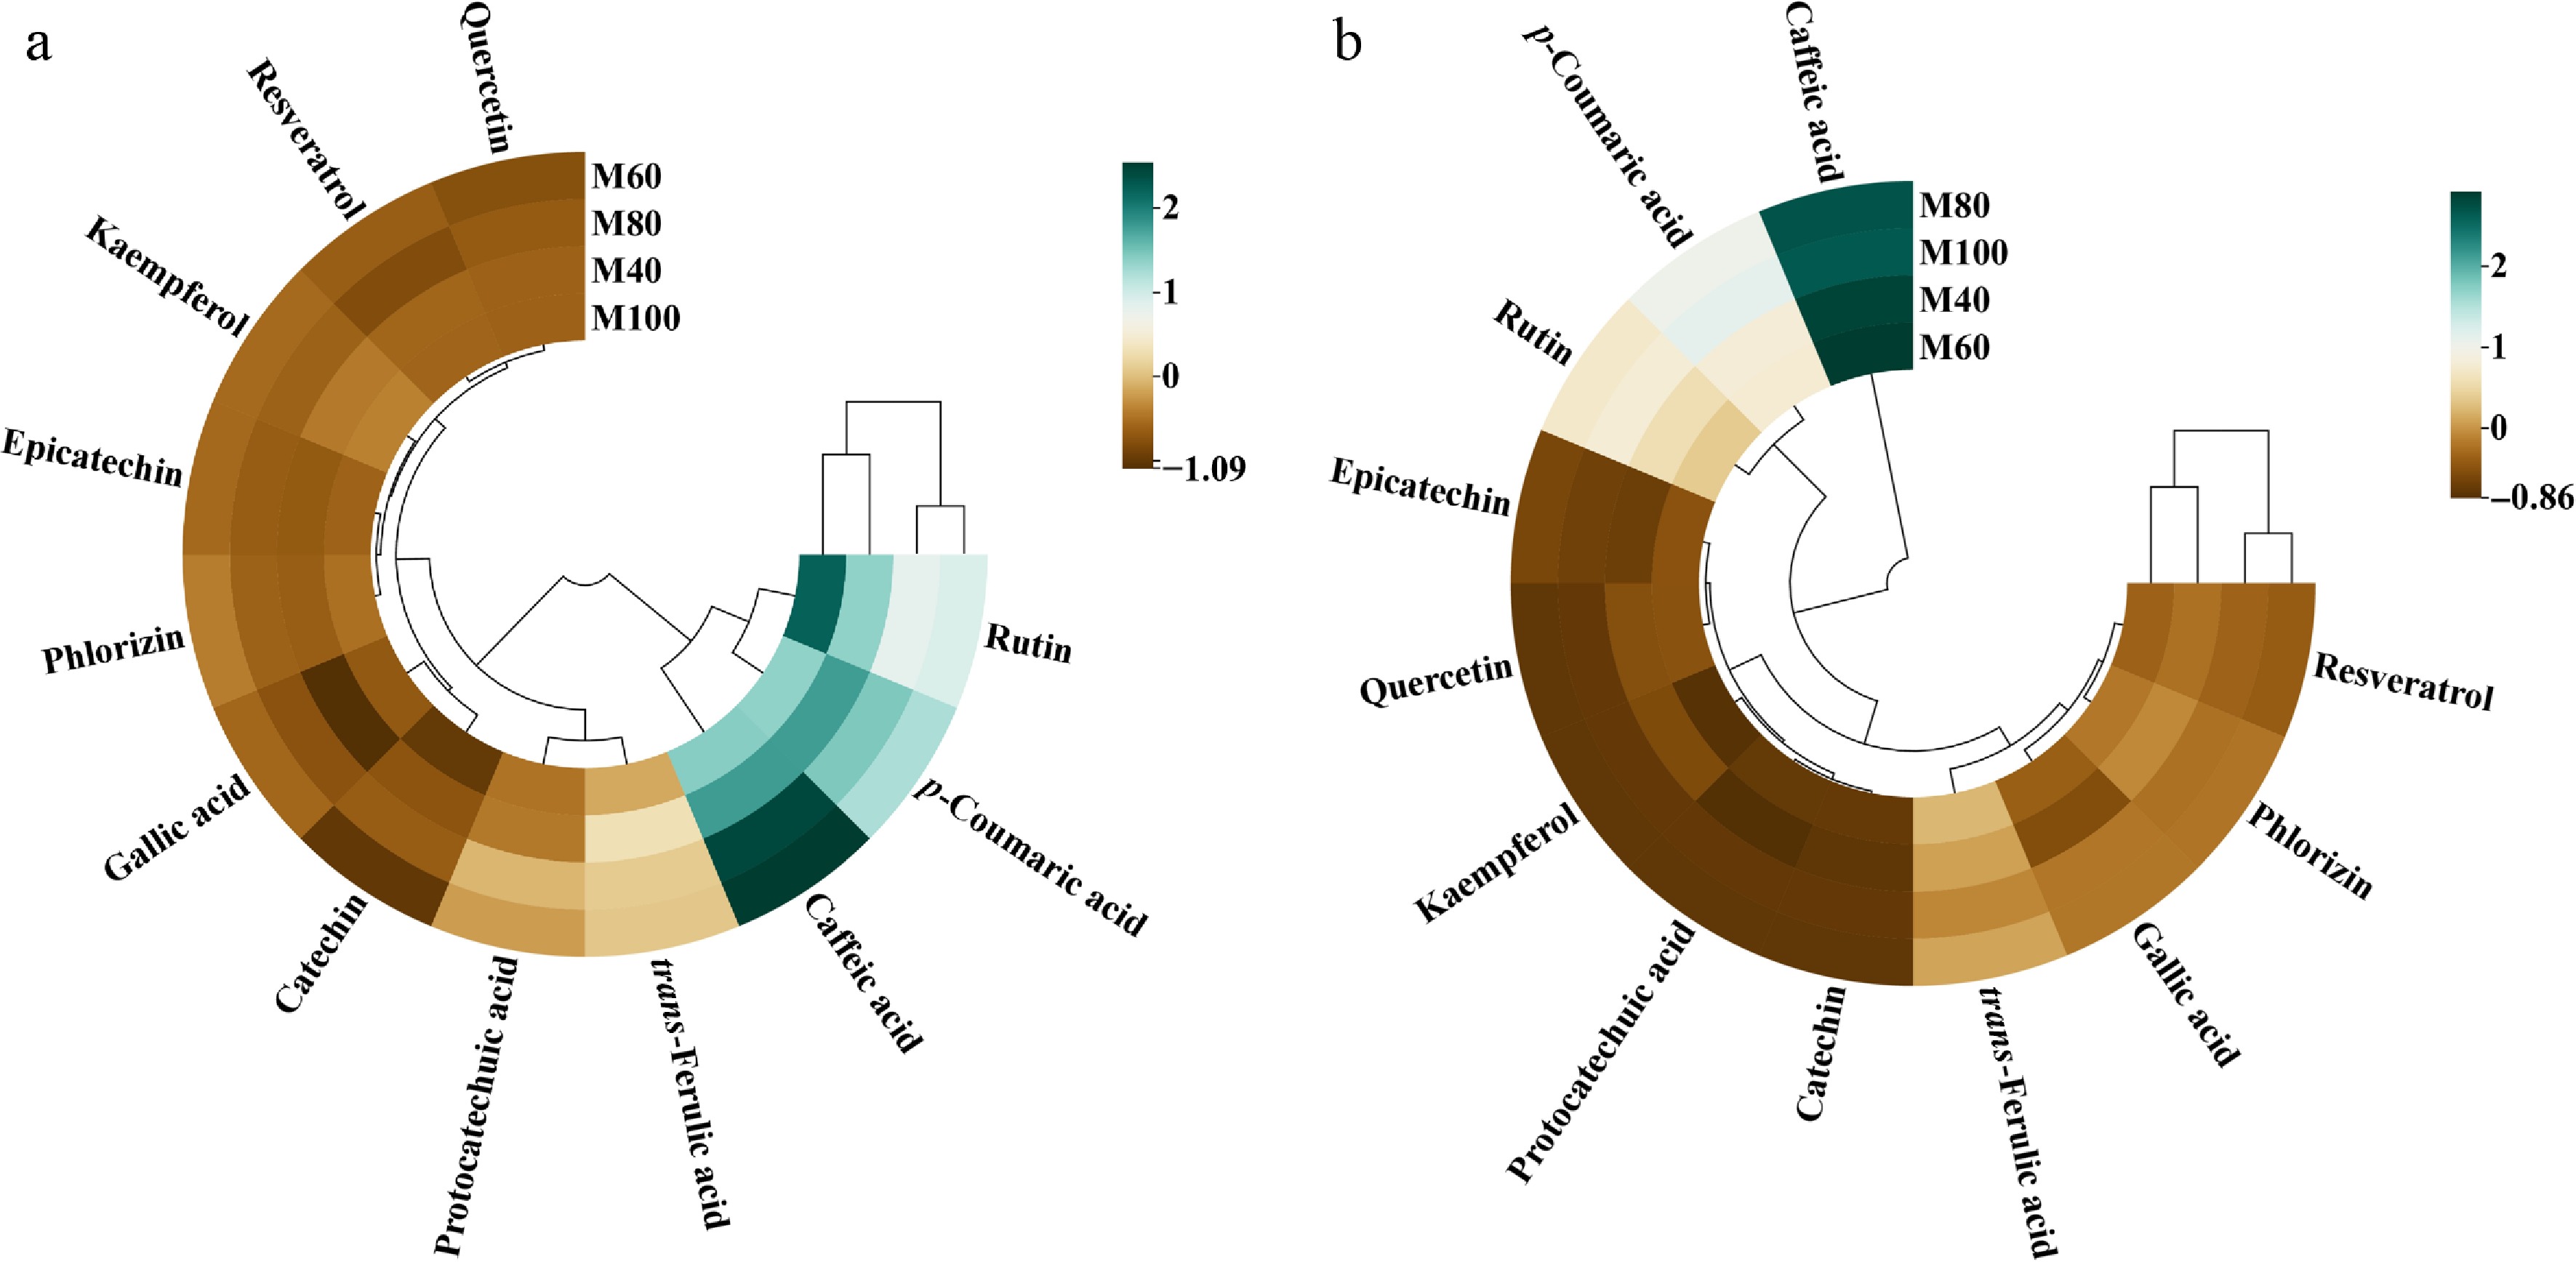
Figure 5.
Effects of canopy thickness on non-anthocyanin monomeric phenolic compounds in 'Merlot' grapes. (a) Clustered heat map of the distribution in 2023; (b) clustered heat map of the distribution in 2024.
-
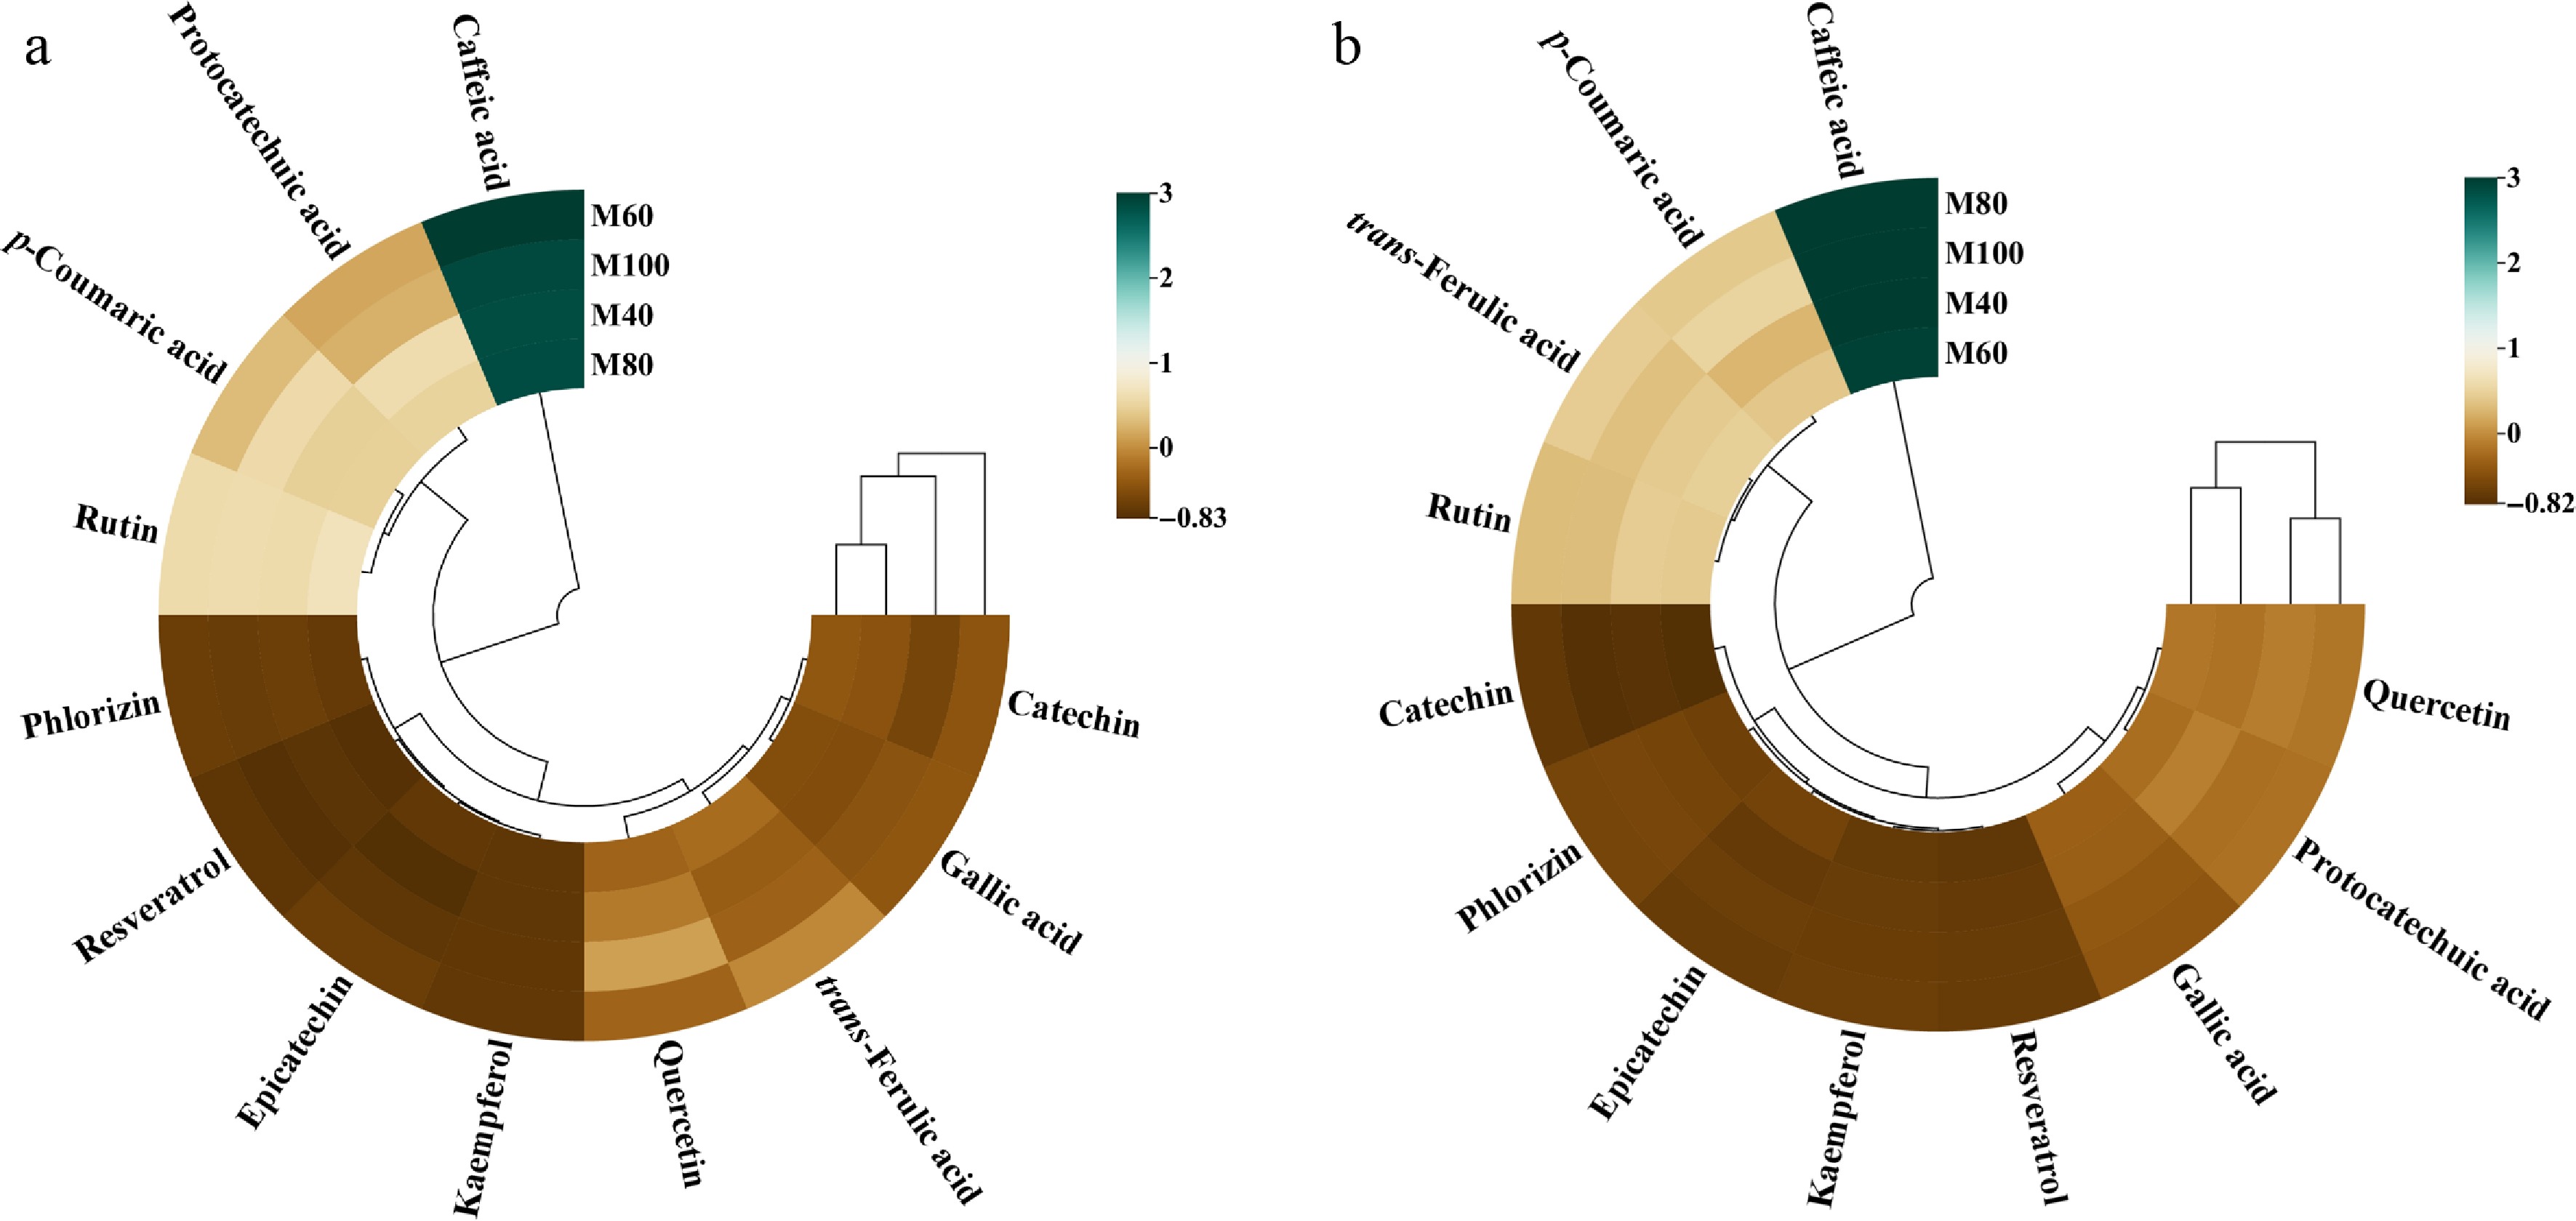
Figure 6.
Effects of canopy thickness on non-anthocyanin monomeric phenolic compounds in 'Merlot' wine. (a) Clustered heat map analysis of year 2023; (b) clustered heat map analysis of year 2024.
-
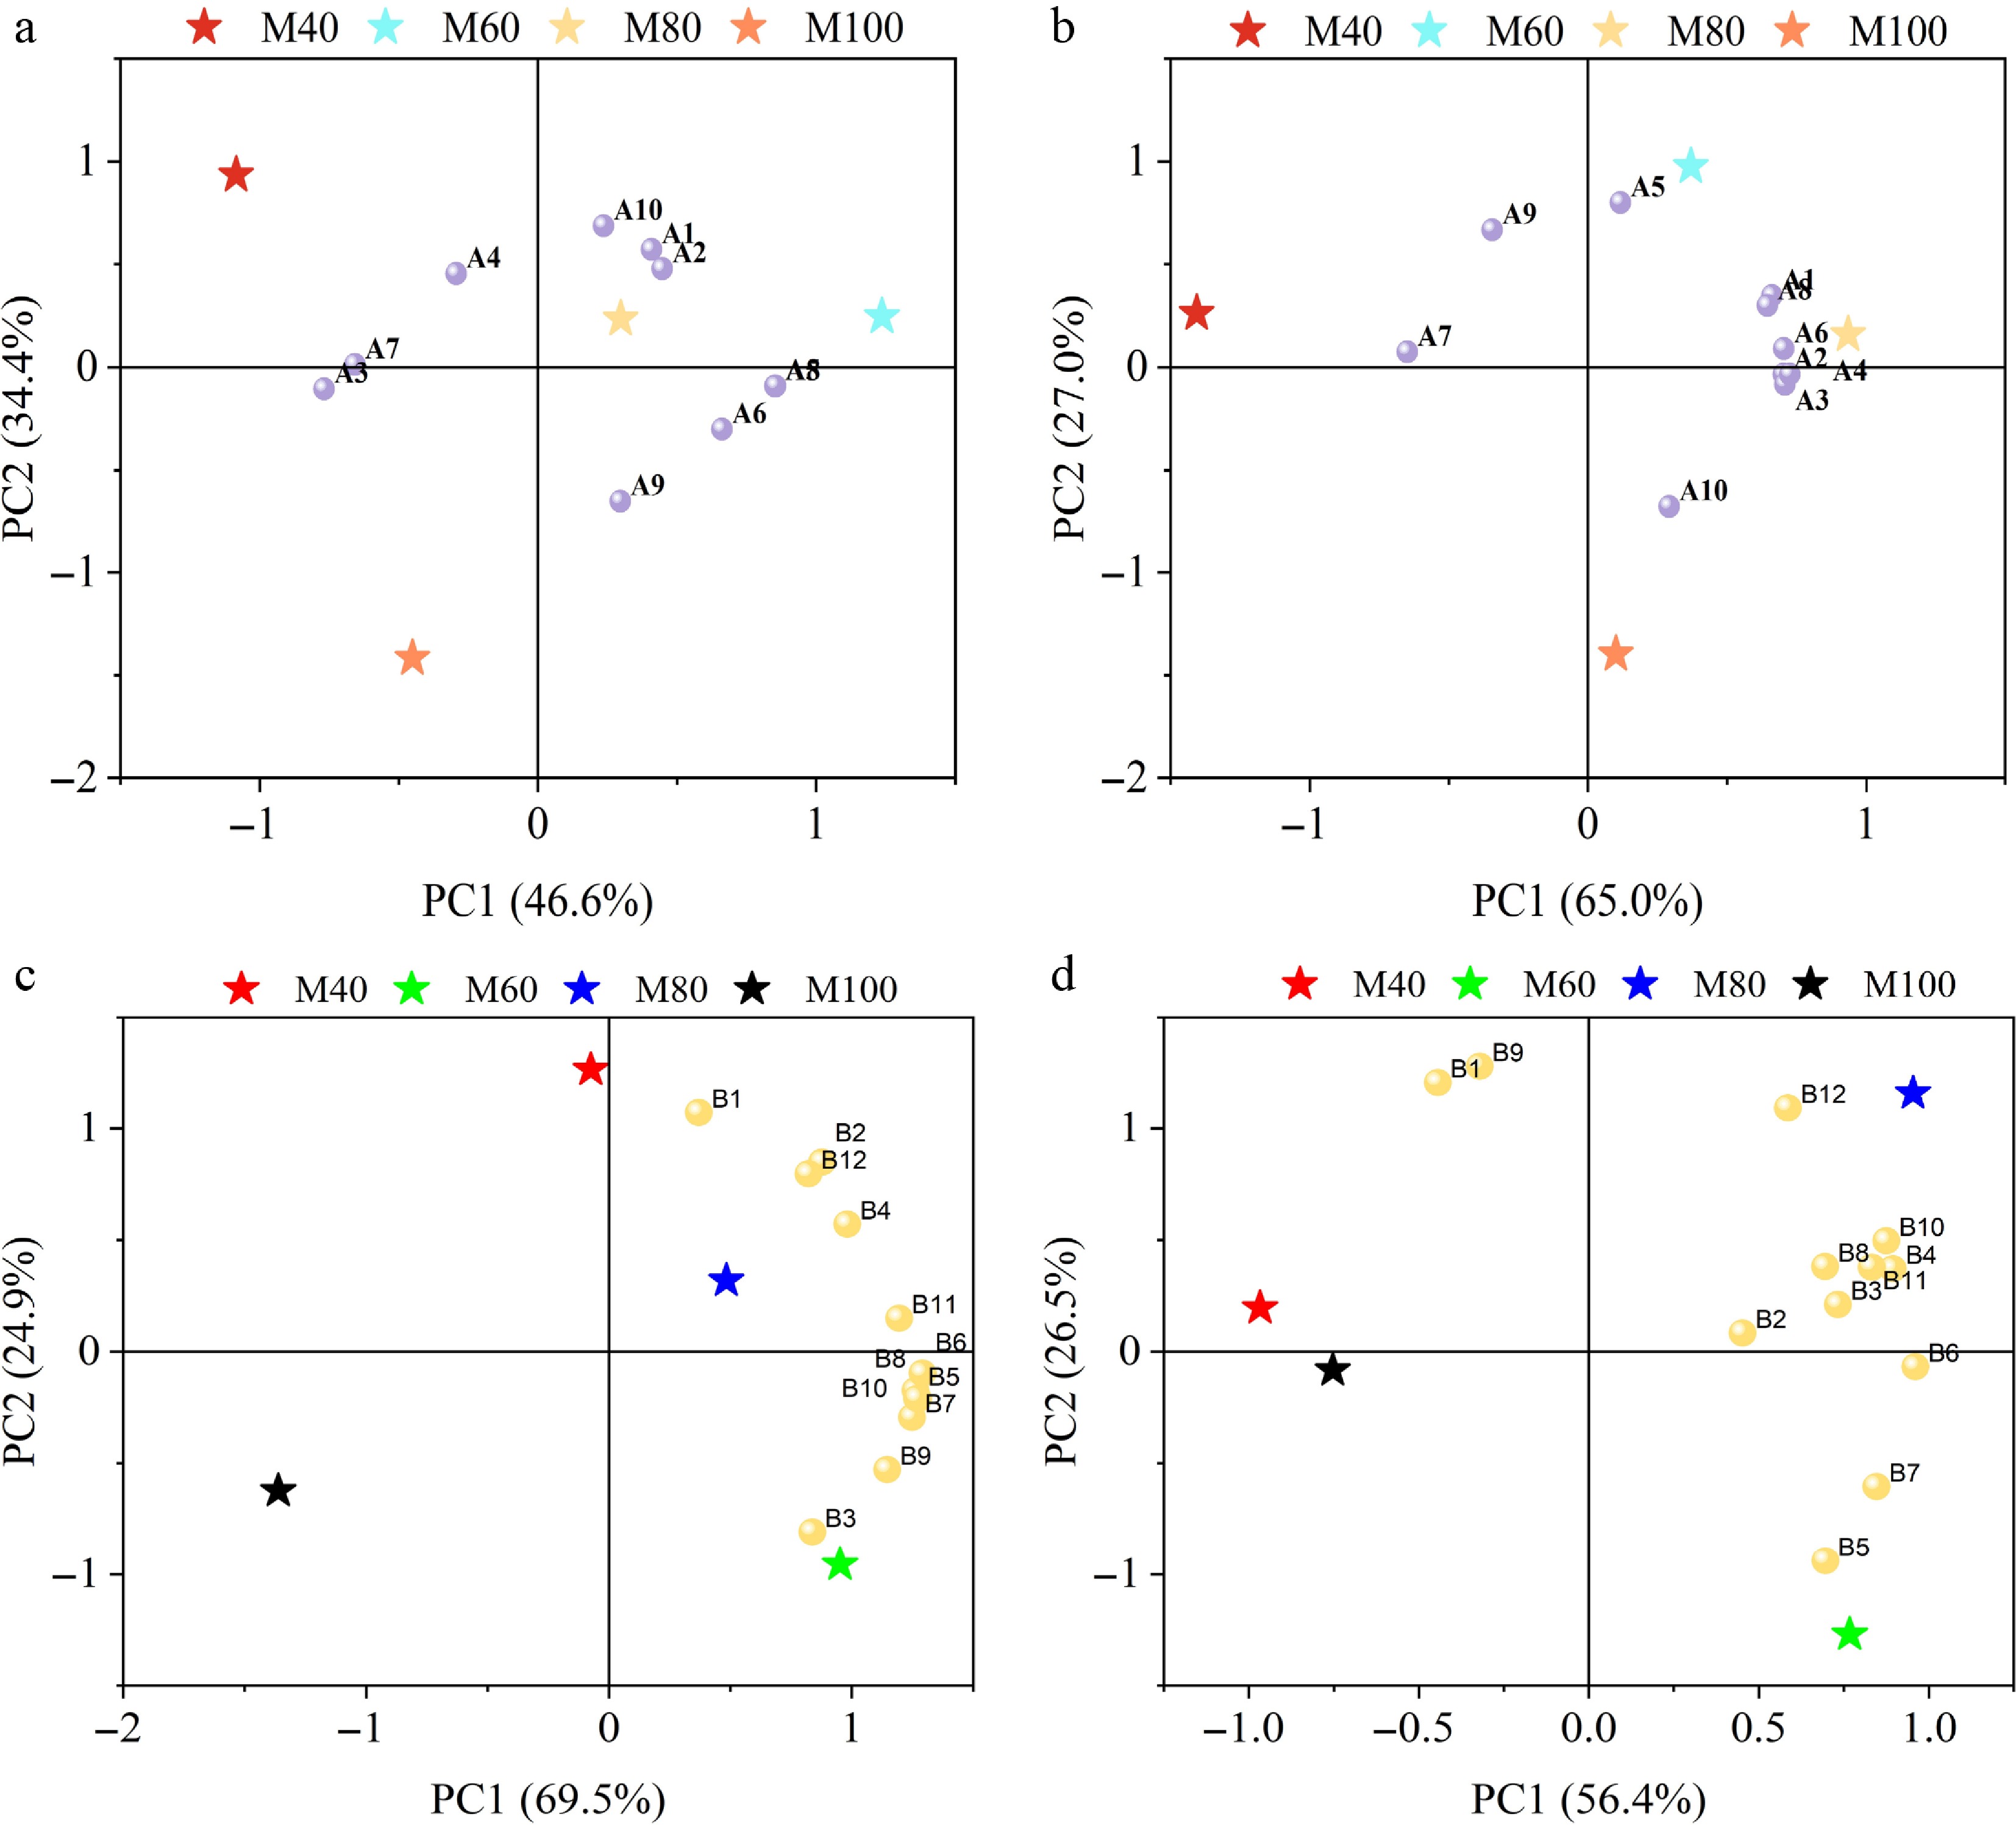
Figure 7.
Factor loading and score plots of 'Merlot' grape and wine quality under different canopy thicknesses. (a, b) represent the factor loading and score plots for 'Merlot' grapes in 2023 (a) and 2024 (b); (c, d) display the factor loading and score plots of 'Merlot' wine in 2023 (c) and 2024 (d).
-
Year Treatment PC1 PC2 Comprehensive
scoreComprehensive
ranking'Merlot' grape 2023 M40 −1.08 0.94 −0.49 3 M60 1.24 0.25 0.95 1 M80 0.30 0.24 0.28 2 M100 −0.45 −1.42 −0.73 4 2024 M40 −1.41 0.26 −0.92 4 M60 0.37 0.98 0.55 2 M80 0.94 0.16 0.71 1 M100 0.10 −1.40 −0.34 3 'Merlot' wine 2023 M40 −0.07 1.26 0.28 3 M60 0.95 −0.96 0.45 1 M80 0.48 0.32 0.44 2 M100 −1.36 −0.62 −1.17 4 2024 M40 −0.97 0.20 −0.60 4 M60 0.77 −1.27 0.12 2 M80 0.95 1.16 1.02 1 M100 −0.75 −0.08 −0.54 3 Table 1.
Comprehensive quality evaluation of 'Merlot' grape and wine under different canopy thickness.
Figures
(7)
Tables
(1)