-
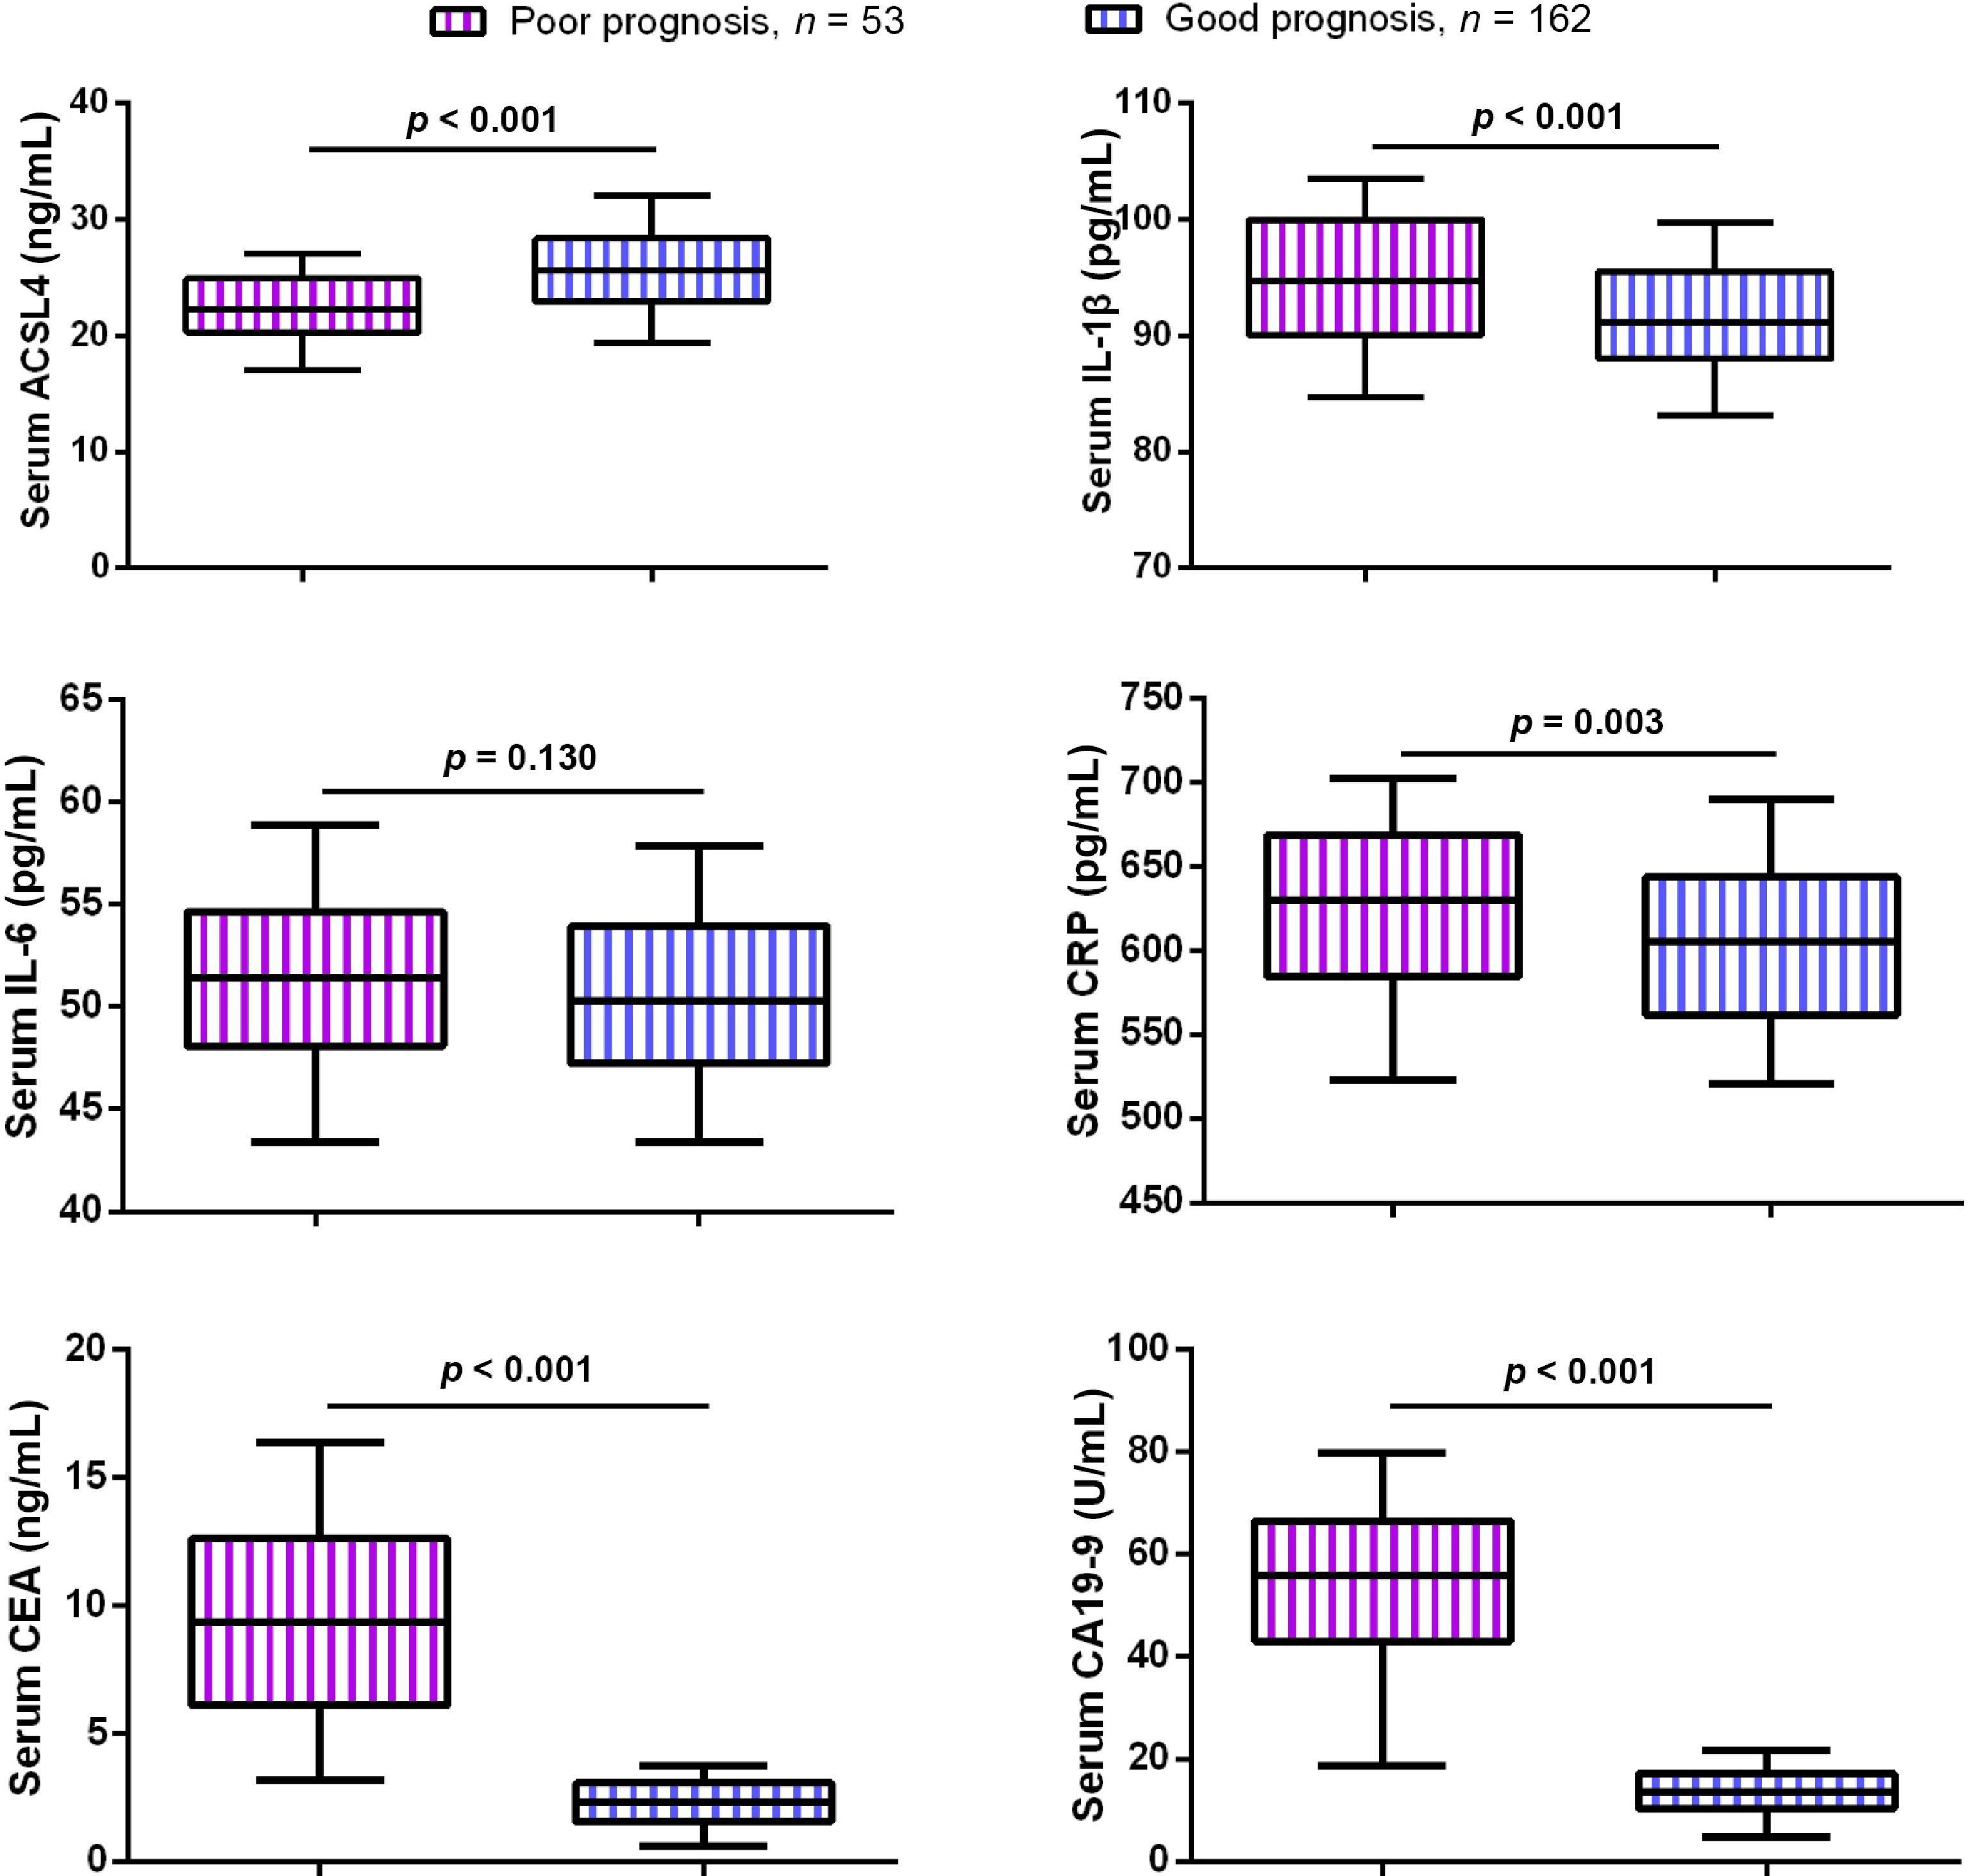
Figure 1.
Serum levels of ACSL4 and other biomarkers in colorectal cancer patients.
-
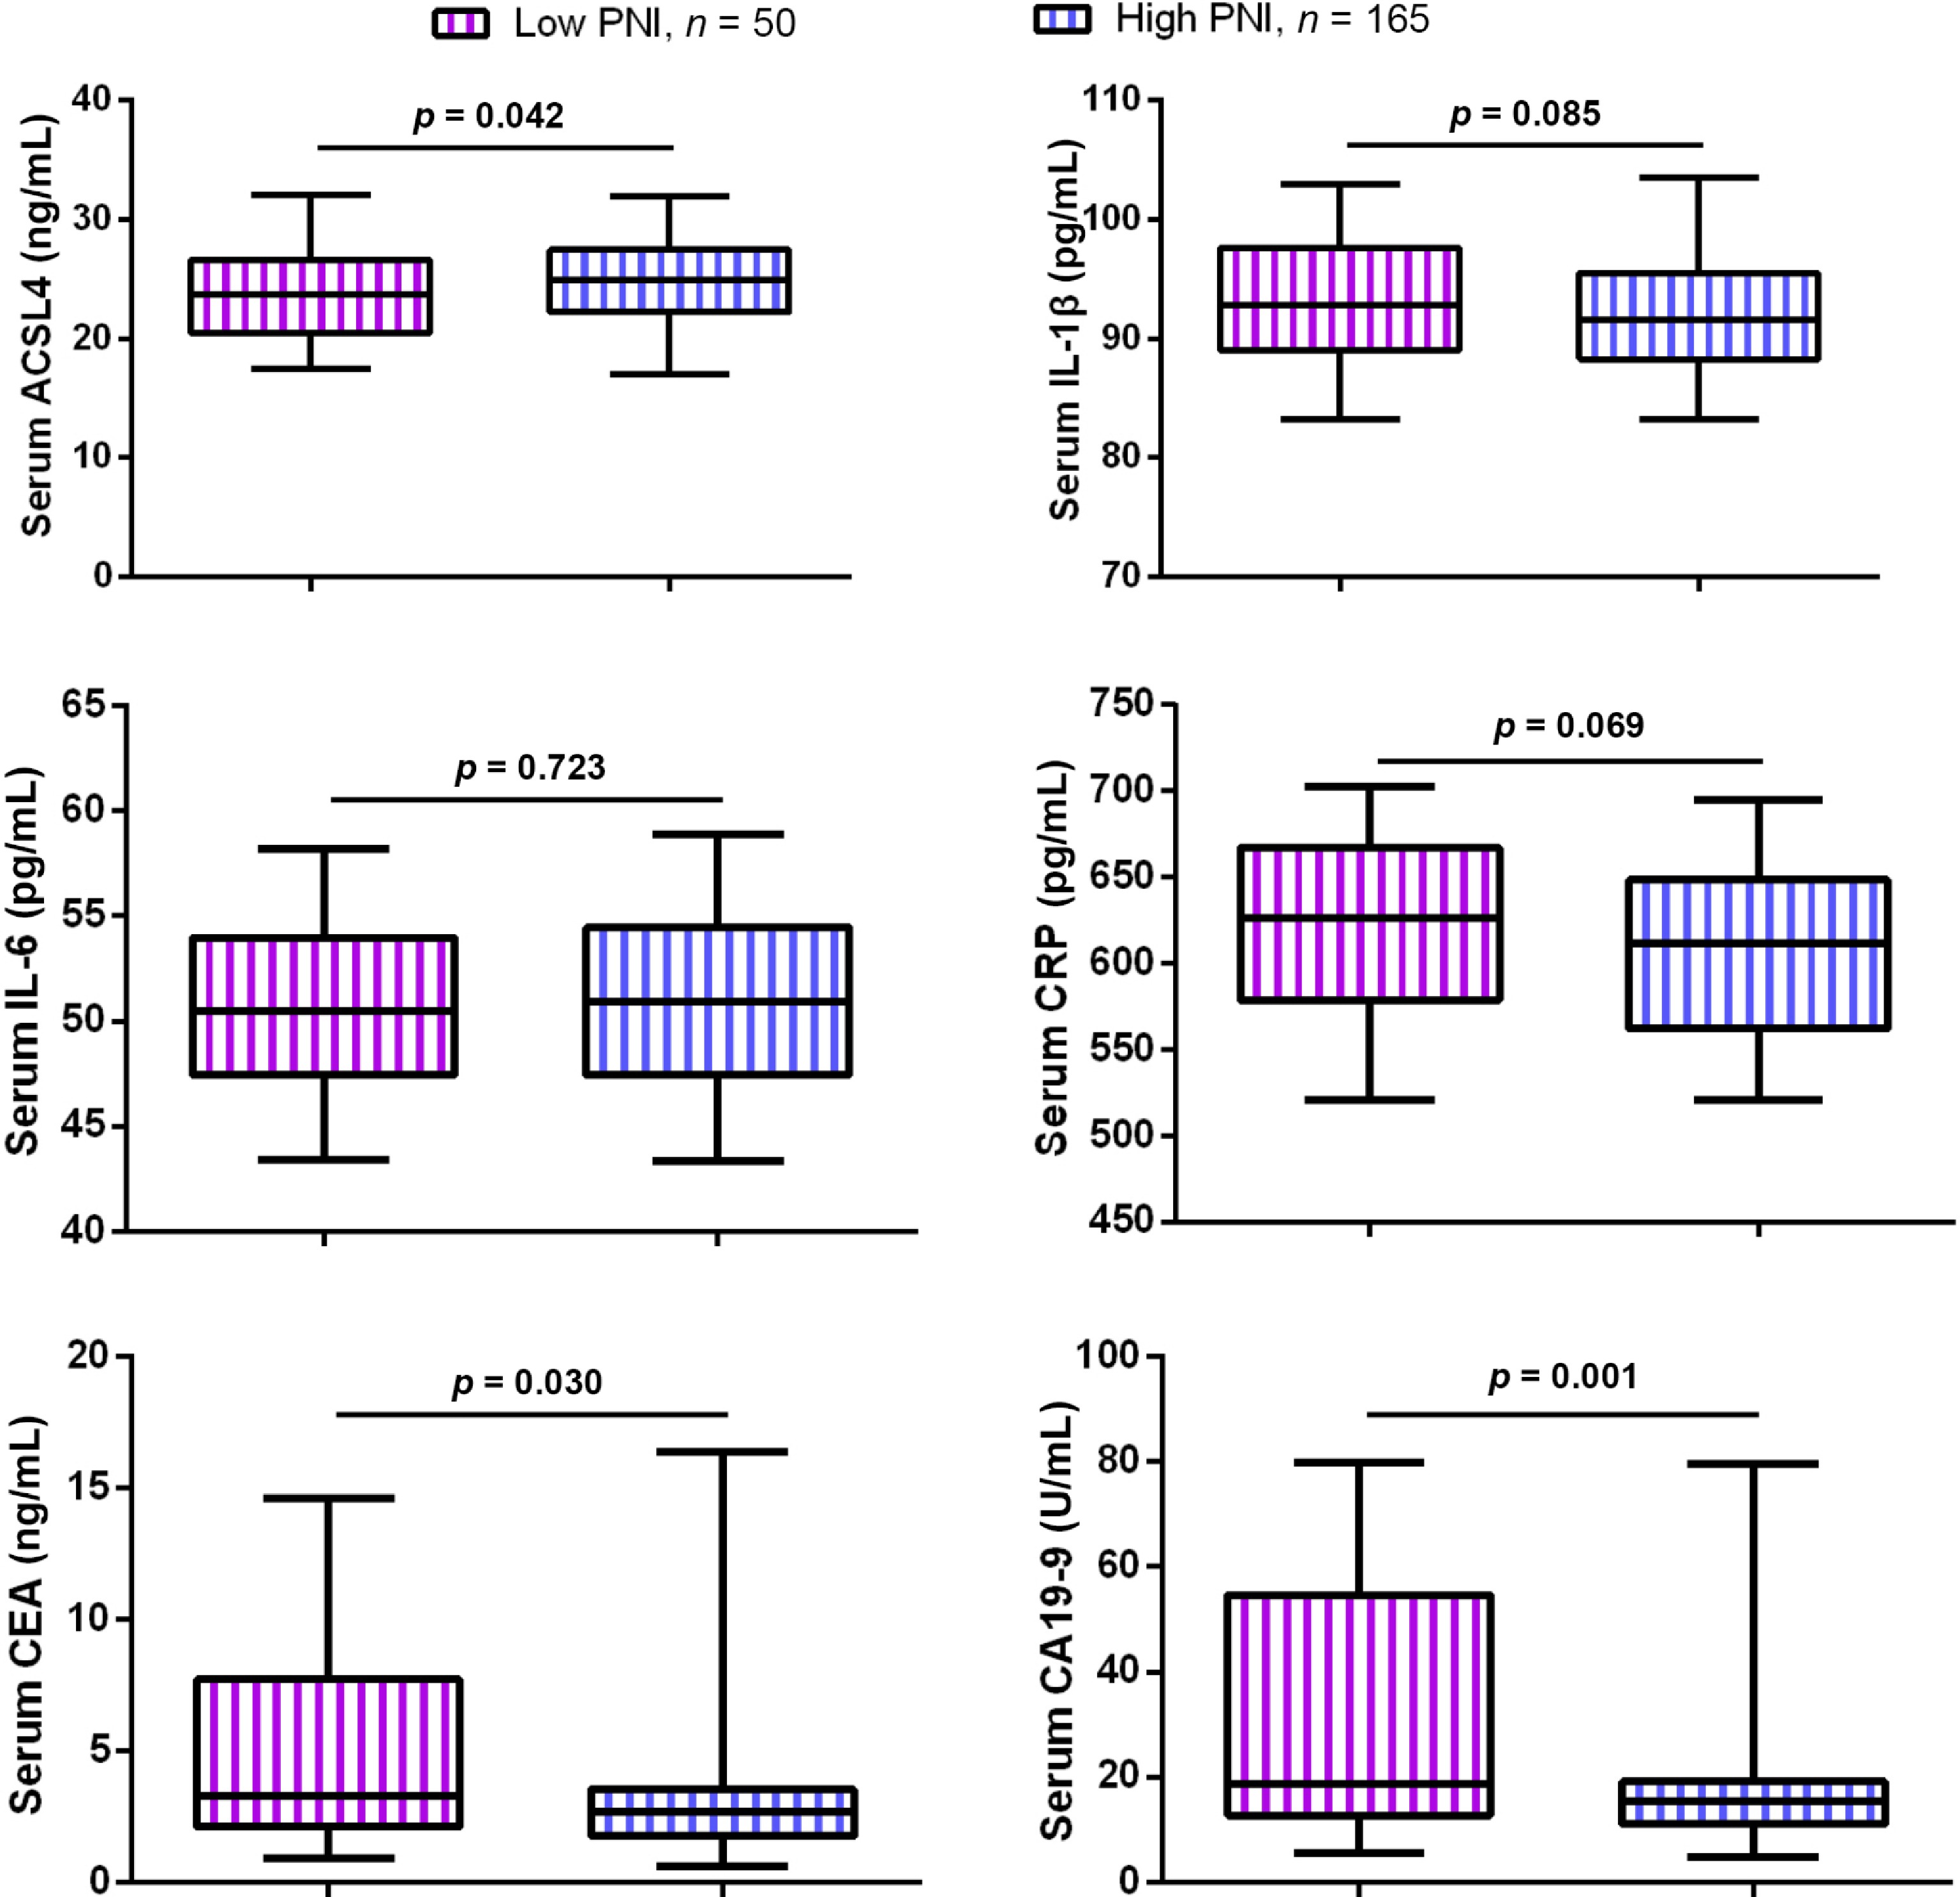
Figure 2.
Association of serum ACSL4 and other biomarkers with PNI.
-
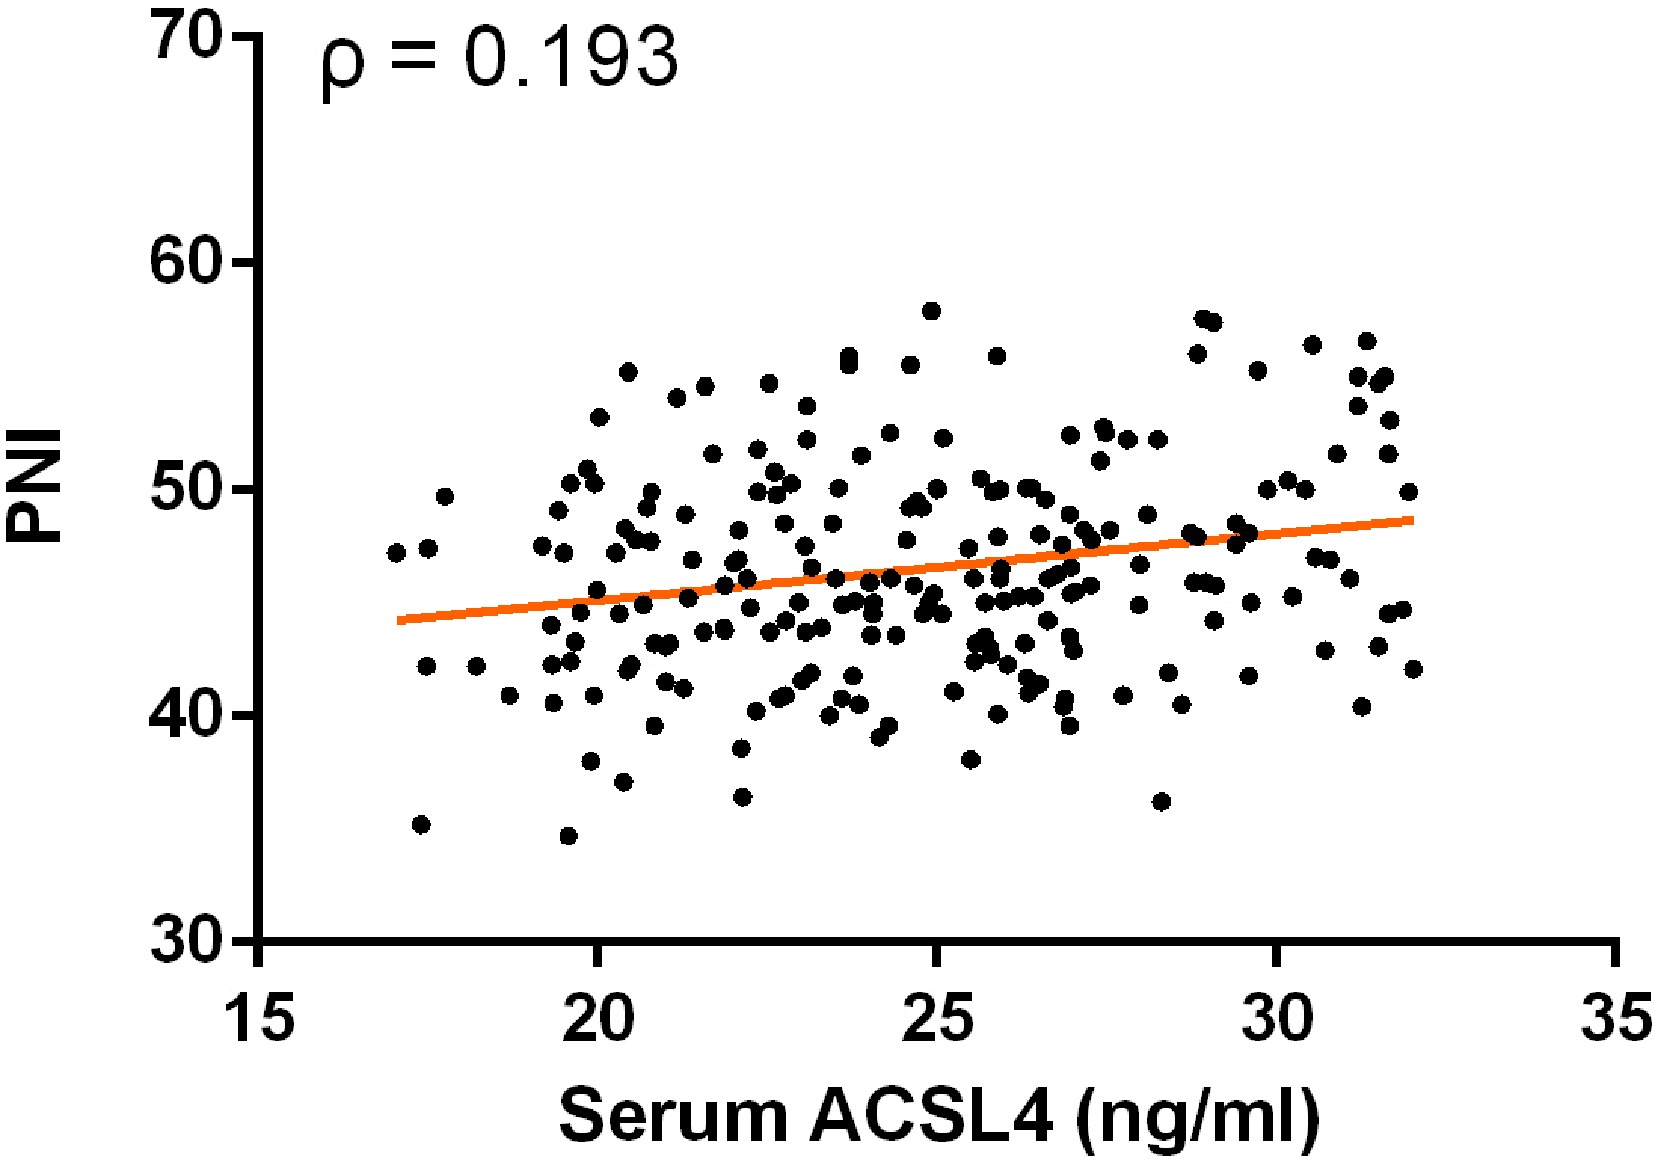
Figure 3.
Scatterplot of serum ACSL4 and PNI (Spearman's ρ = 0.193, p = 0.004)
-
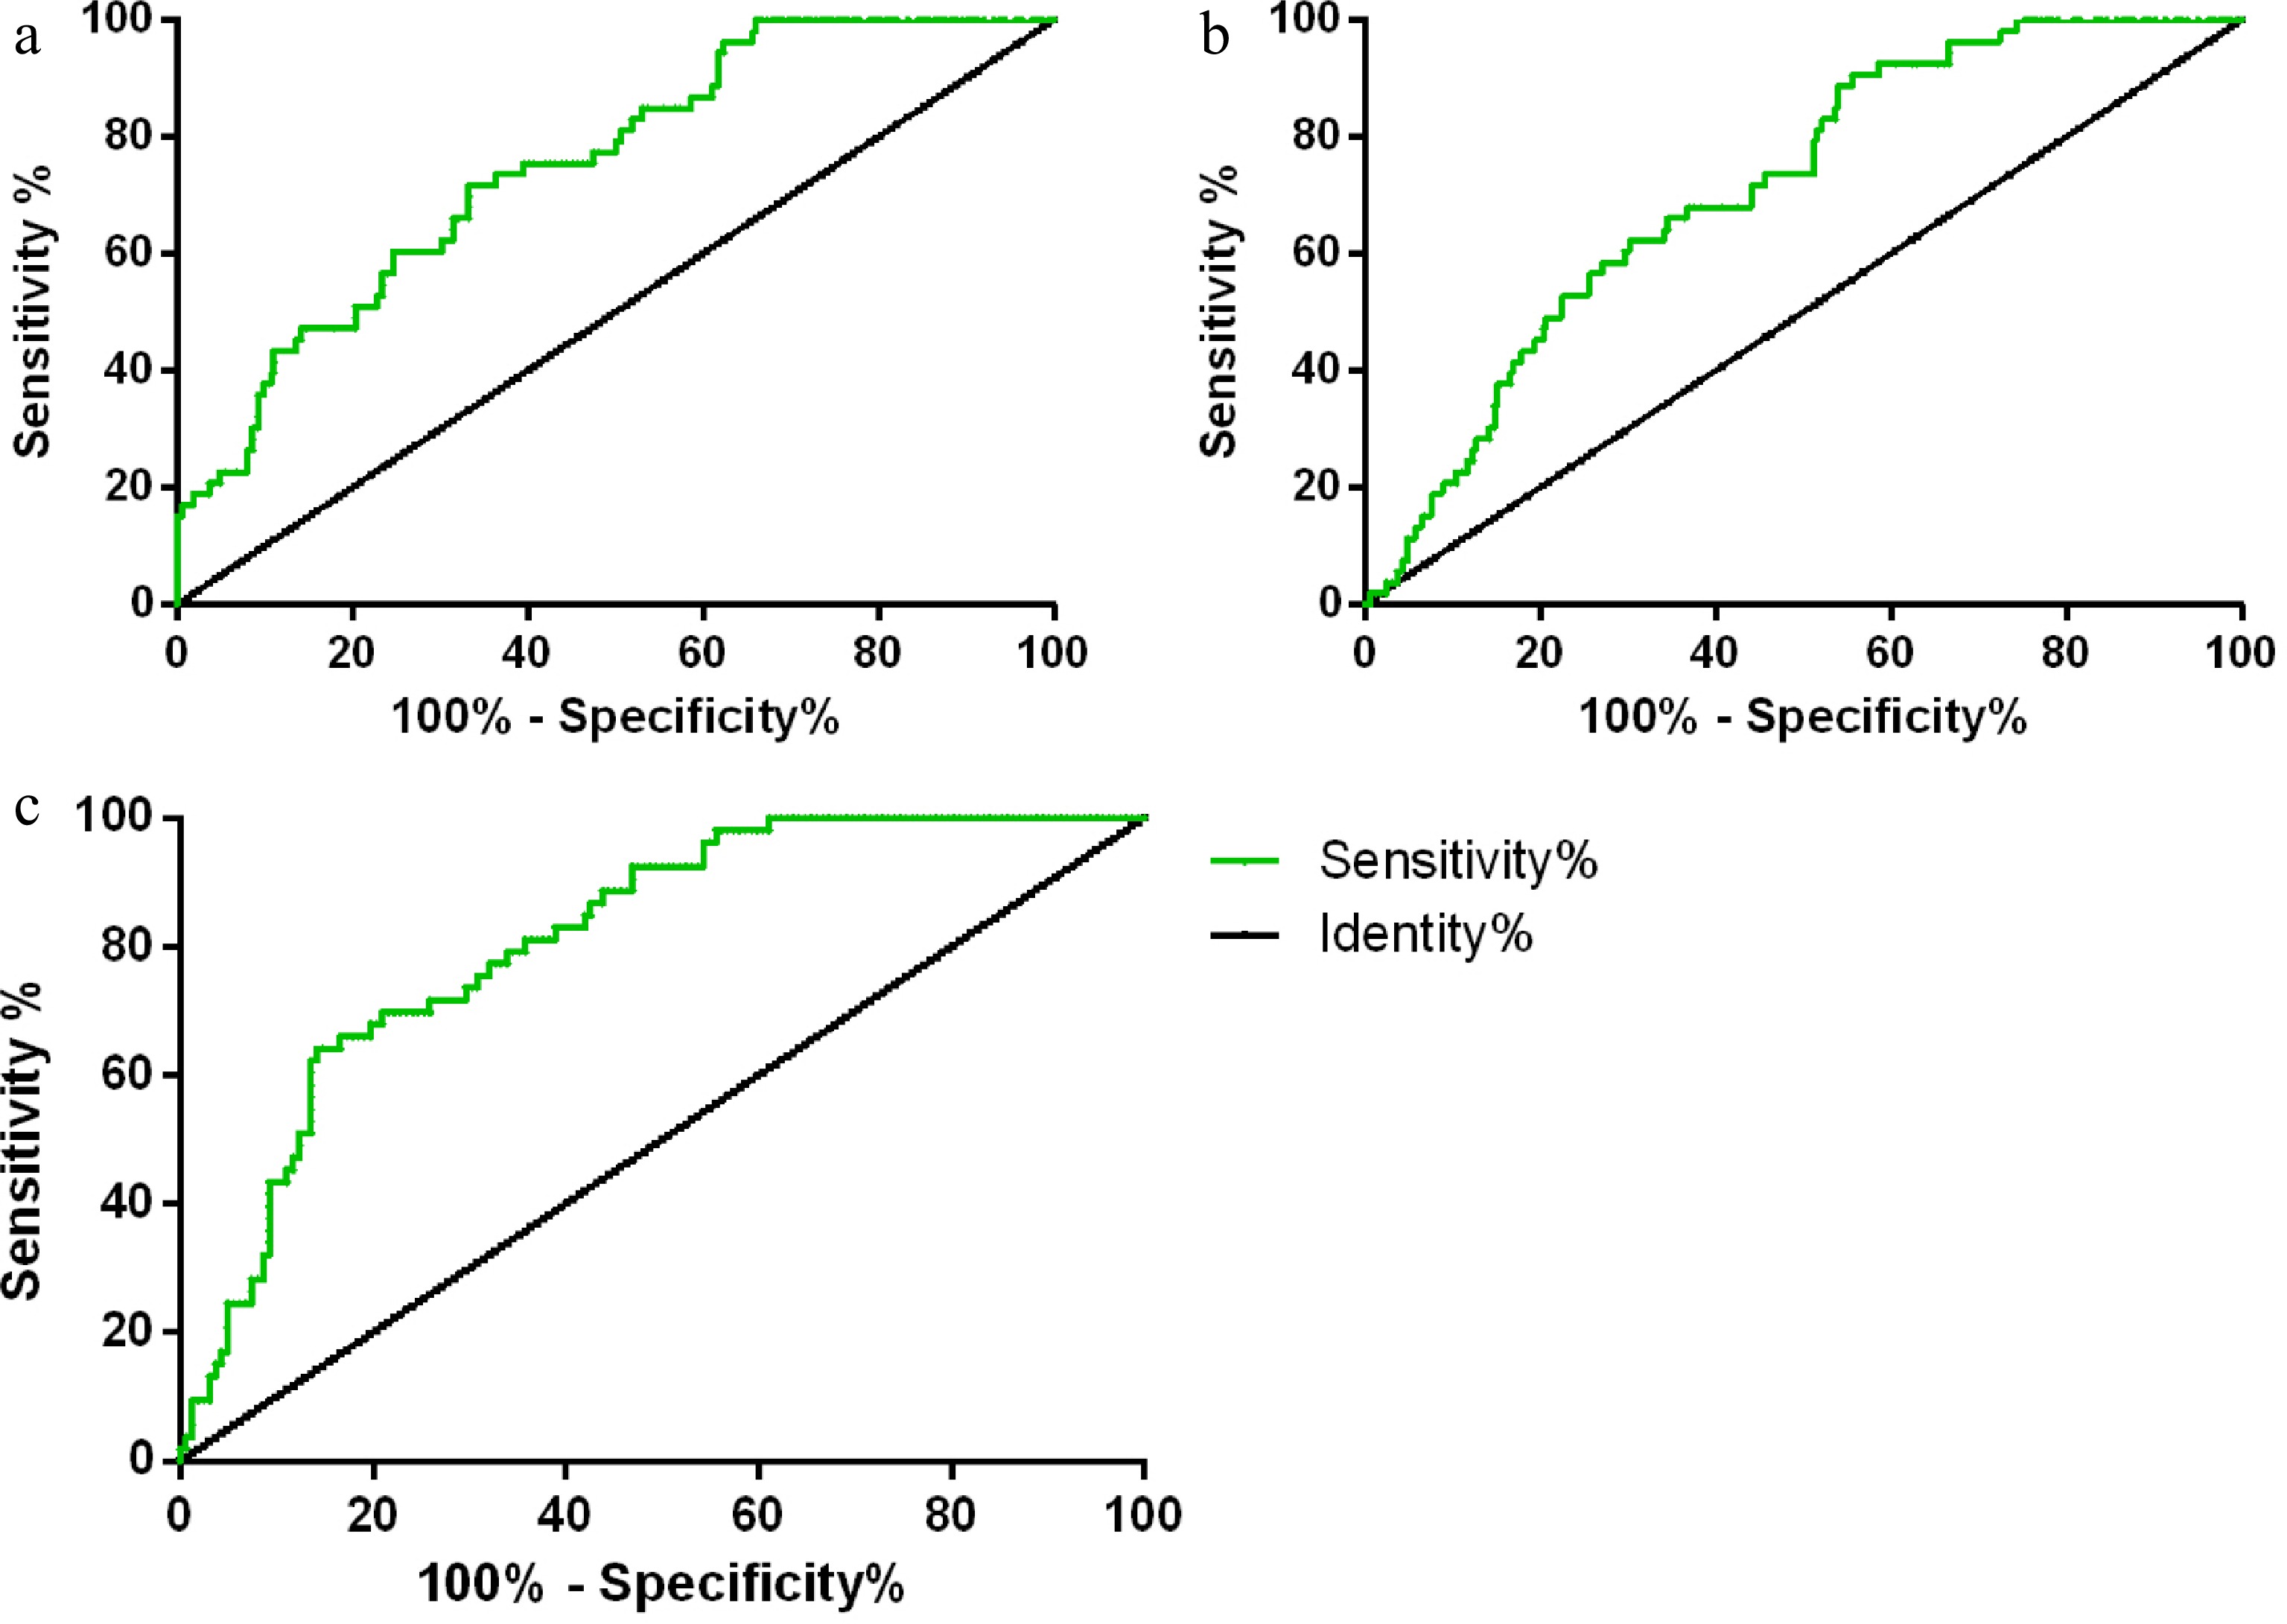
Figure 4.
ROC curves for prognosis in colorectal cancer patients. ROC curve for patients with poor prognosis: (a) ACSL4: AUC = 0.750, 95% CI 0.679–0.821; (b) PNI: AUC = 0.712, 95% CI: 0.639–0.784; (c) combine ACSL4 and PNI: AUC = 0.811, 95% CI 0.751–0.871.
-
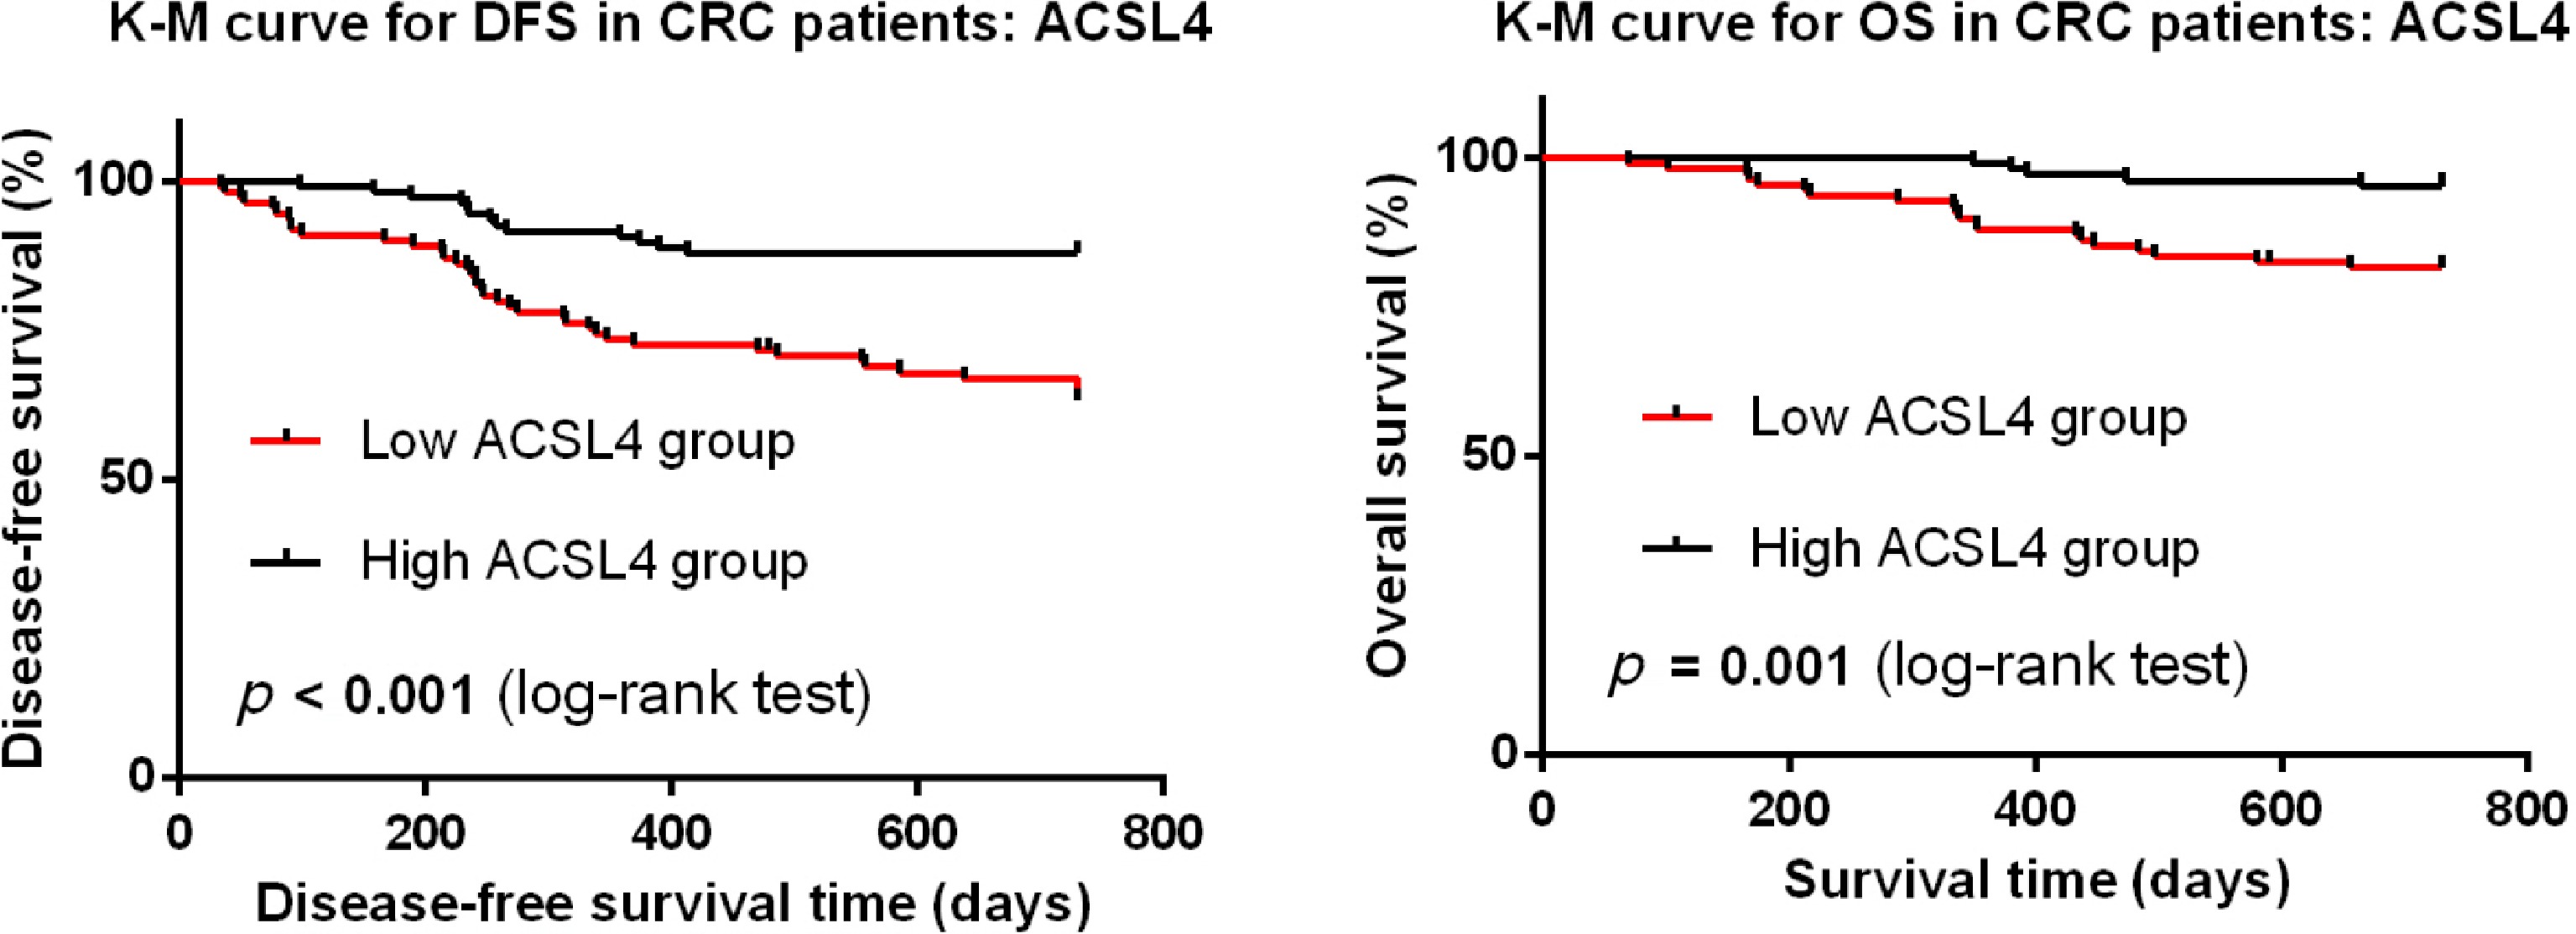
Figure 5.
Kaplan–Meier survival curves stratified by serum ACSL4 levels in CRC patients.
-
Variable Poor prognosis
group, n = 53Favorable prognosis
group, n = 162p Age (year) 58 (44–72) 55 (42–69) 0.020 Sex, female (%) 21 (39.6) 69 (42.6) 0.666 BMI 21.73 ± 2.69 21.29 ± 2.93 0.332 TNM stage < 0.001 I-II, n (%) 22 (41.5) 128 (79.0) III, n (%) 31 (58.5) 34 (21.0) Tumour diameter (cm) 7.02 ± 1.36 4.69 ± 1.05 < 0.001 ALB (g/L) 35.63 ± 3.04 37.58 ± 3.72 0.001 BL (109/L) 1.68 ± 0.40 1.95 ± 0.63 0.003 TC (mmol/L) 3.41 ± 0.52 3.39 ± 0.47 0.756 TG (mmol/L) 1.33 ± 0.15 1.35 ± 0.14 0.420 LDLC (mmol/L) 2.85 ± 0.27 2.83 ± 0.30 0.724 HDLC (mmol/L) 1.10 ± 0.17 1.08 ± 0.18 0.448 PNI 43.99 ± 3.35 47.35 ± 4.85 < 0.001 Tumor location 0.340 Right-sided colon 11 (20.8) 40 (24.7) Left-sided colon 14 (26.4) 55 (34.0) Rectum 28 (52.8) 67 (41.4) Differentiation grade 0.072 Well/moderate 37 (69.8) 132 (81.5) Poor 16 (30.2) 30 (18.5) Lymphovascular invasion 0.002 No 30 (56.6) 127 (78.4) Yes 23 (43.4) 35 (21.6) Perineural invasion 0.013 No 37 (69.8) 138 (85.2) Yes 16 (30.2) 24 (14.8) Adjuvant chemotherapy 0.436 No 20 (37.7) 71 (43.8) Yes 33 (62.3) 91 (56.2) Surgical approach 0.728 Open surgery 13 (24.5) 36 (22.2) Laparoscopic surgery 40 (75.5) 126 (77.8) Margin status 0.420 R0 51 (96.2) 159 (98.1) R1/R2 2 (3.8) 3 (1.9) ALB: albumin, BL: blood lymphocyte count, TC: total cholesterol, TG: triglyceride, LDLC: low-density lipoprotein cholesterol, HDLC: high-density lipoprotein cholesterol, PNI: prognostic nutritional index, BMI: body mass index, TNM: tumor-node-metastasis. Table 1.
Demographic and clinical data of all subjects.
-
Variable ACSL4 (ng/mL) Spearman' ρ p IL-1β (pg/mL) −0.049 0.475 IL-6 (pg/mL) 0.036 0.595 CRP (pg/mL) −0.074 0.282 CEA (ng/mL) −0.330 < 0.001 CA199 (U/mL) −0.244 < 0.001 ACSL4: acyl-CoA synthetase long-chain family member 4, IL-1β: interleukin-1 beta, IL-6: interleukin-6, CRP: C-reactive protein, CEA: carcinoembryonic antigen, CA199: carbohydrate antigen 19-9. Table 2.
Correlation analysis between ACSL4 and other biomarkers.
-
Model Variables included AUC 95% CI Base model TNM stage + tumour diameter + lymphovascular invasion 0.941 0.909–0.972 Base model + PNI TNM stage + tumour diameter + lymphovascular invasion + PNI 0.953 0.928–0.978 Base model + PNI + ACSL4 TNM stage + tumour diameter + lymphovascular invasion + PNI + ACSL4 0.964 0.942–0.986 AUC, area under the receiver operating characteristic curve; CI, confidence interval; PNI, prognostic nutritional index; ACSL4, acyl-CoA synthetase long-chain family member 4; CEA, carcinoembryonic antigen; TNM, tumor-node-metastasis. Table 3.
Incremental AUC of clinicopathologic model with PNI and ACSL4.
-
Variables Wald Odds ratio 95% CI p TNM stage 11.854 8.298 2.487–27.688 0.001 Tumour diameter (cm) 31.138 5.617 3.064–10.299 < 0.001 PNI 4.209 0.880 0.779–0.994 0.040 ACSL4 (ng/mL) 9.649 0.736 0.606–0.893 0.002 Lymphovascular invasion 1.787 2.219 0.690–7.137 0.181 PNI: prognostic nutritional index, ACSL4: acyl-CoA synthetase long-chain family member 4. Table 4.
Logistic regression for risk factors of poor prognosis in CRC patients.
Figures
(5)
Tables
(4)