-
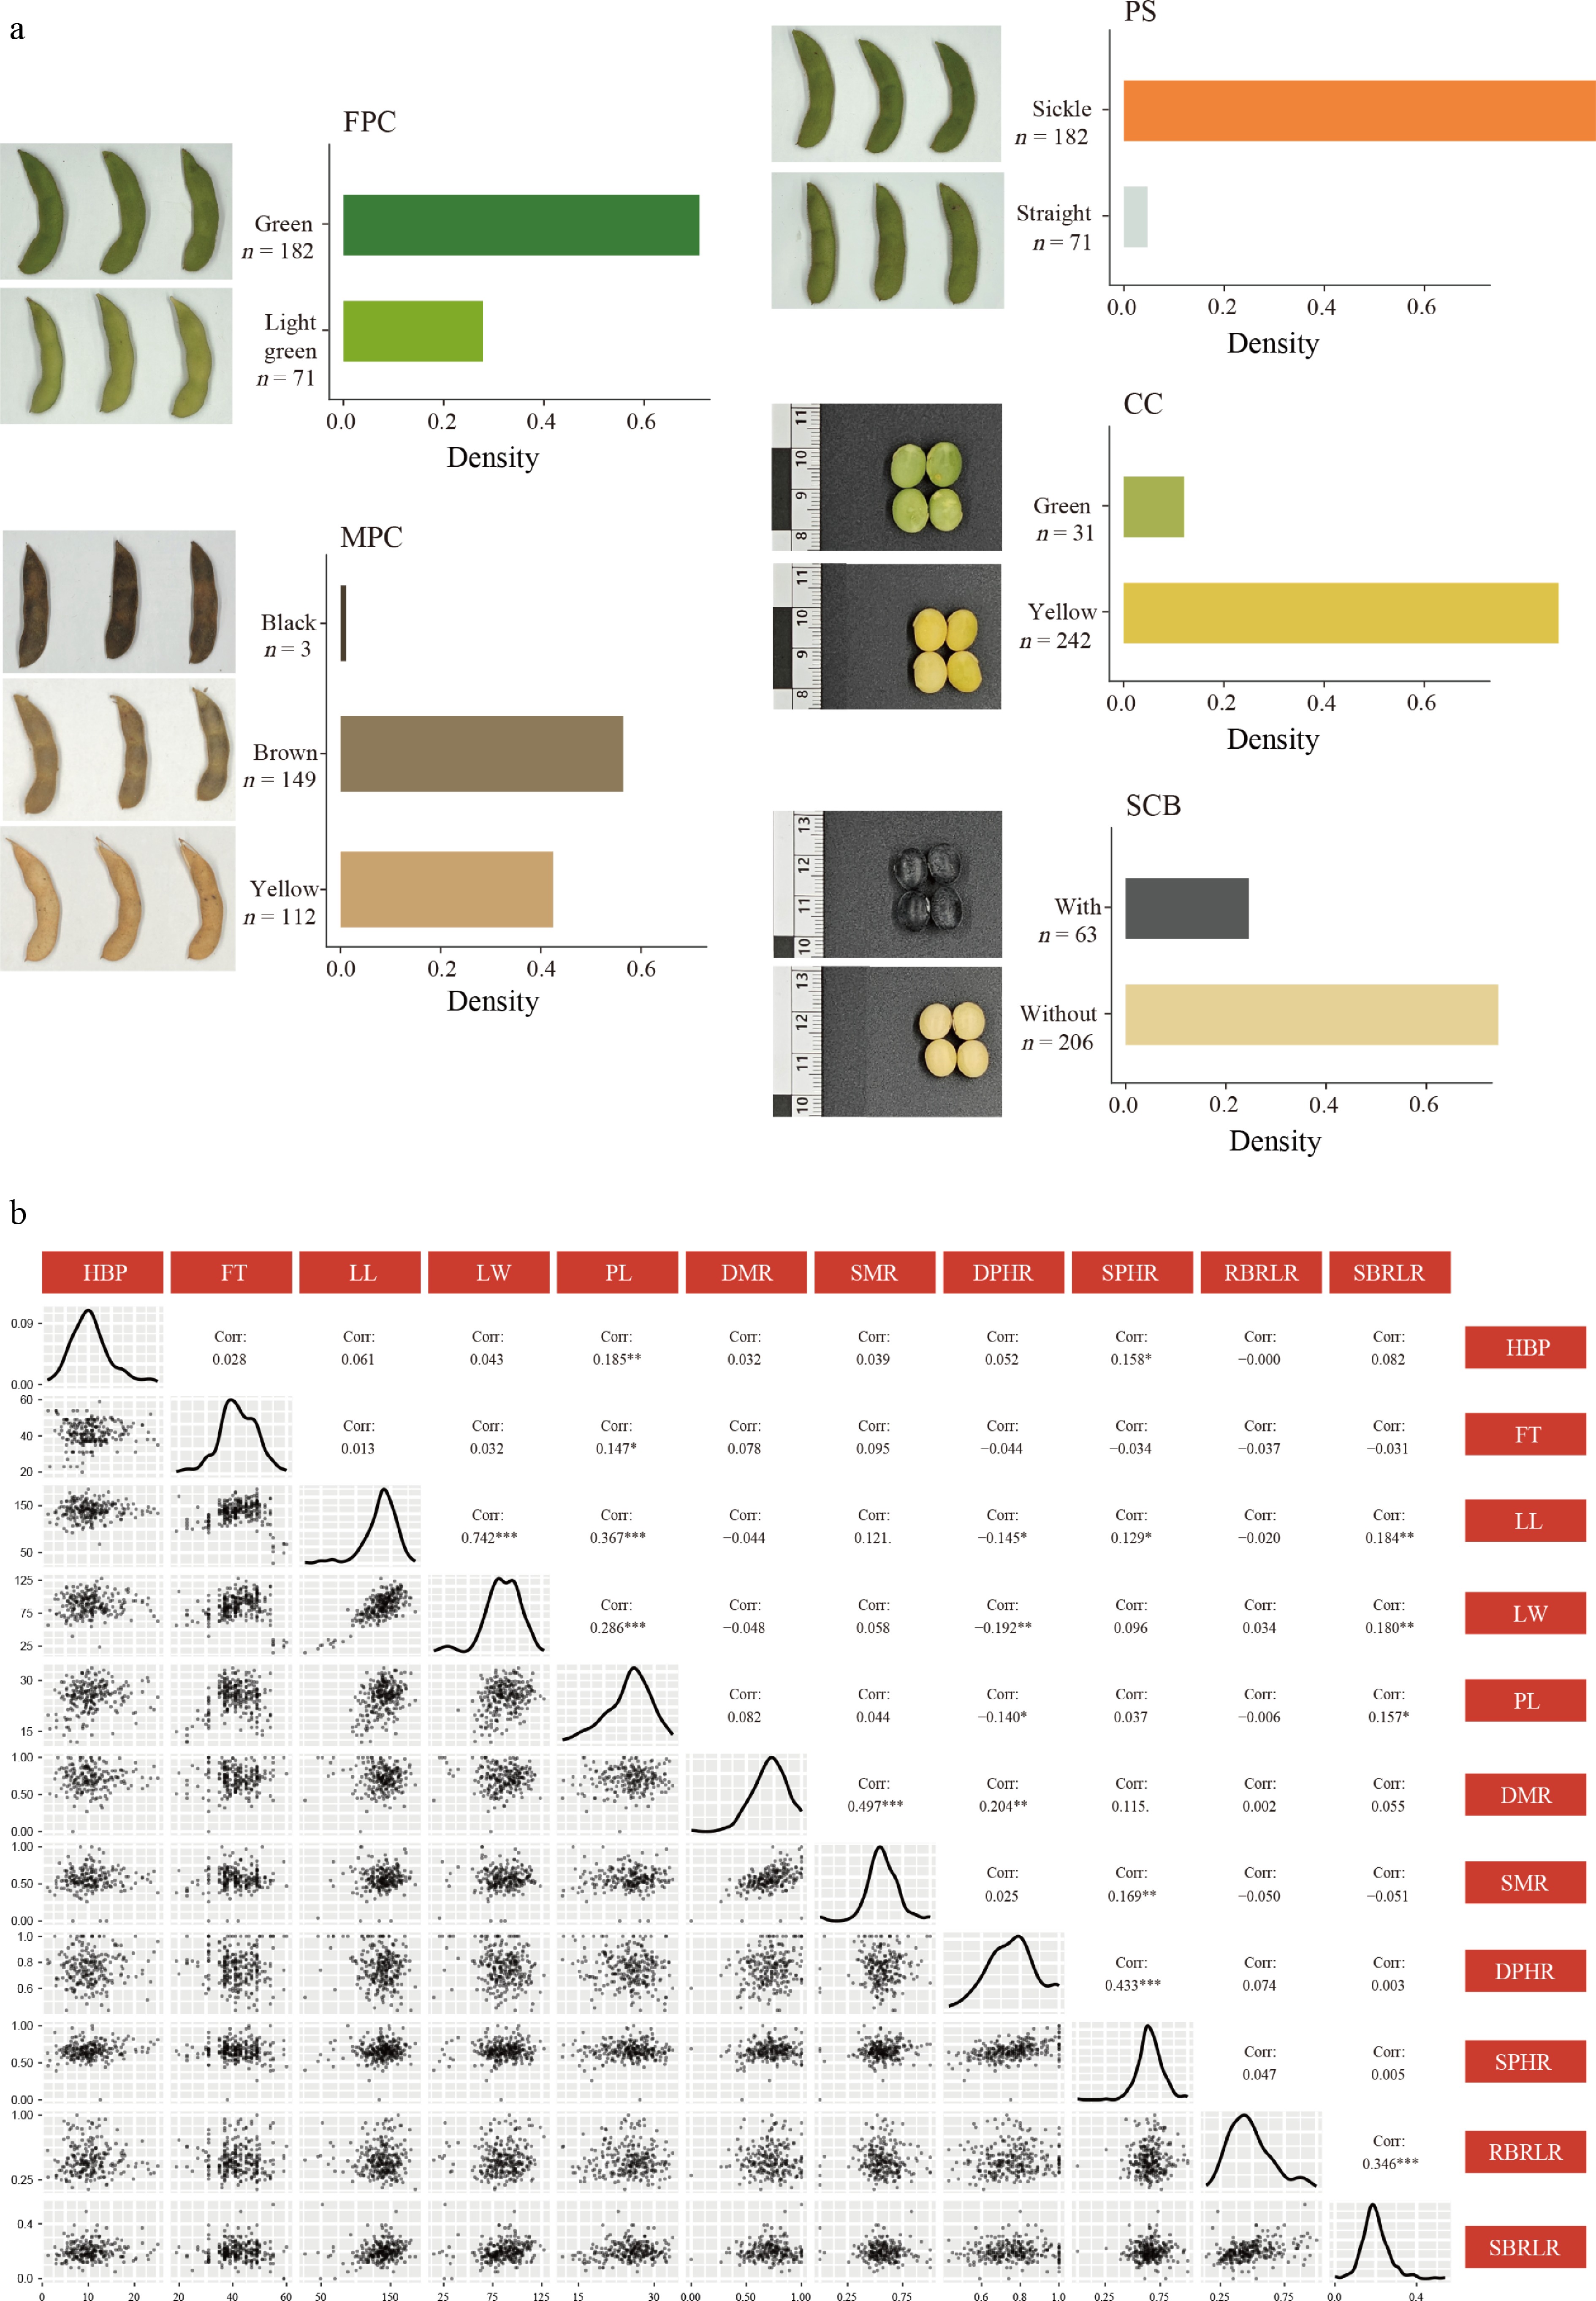
Figure 1.
Phenotypic diversity of Zhejiang soybean landraces. (a) Qualitative traits including fresh pod color (FPC), mature pod color (MPC), pod shape (PS), cotyledon color (CC), and seed coat bloom (SCB) vary in distribution. (b) Distribution and correlation of quantitative traits.
-
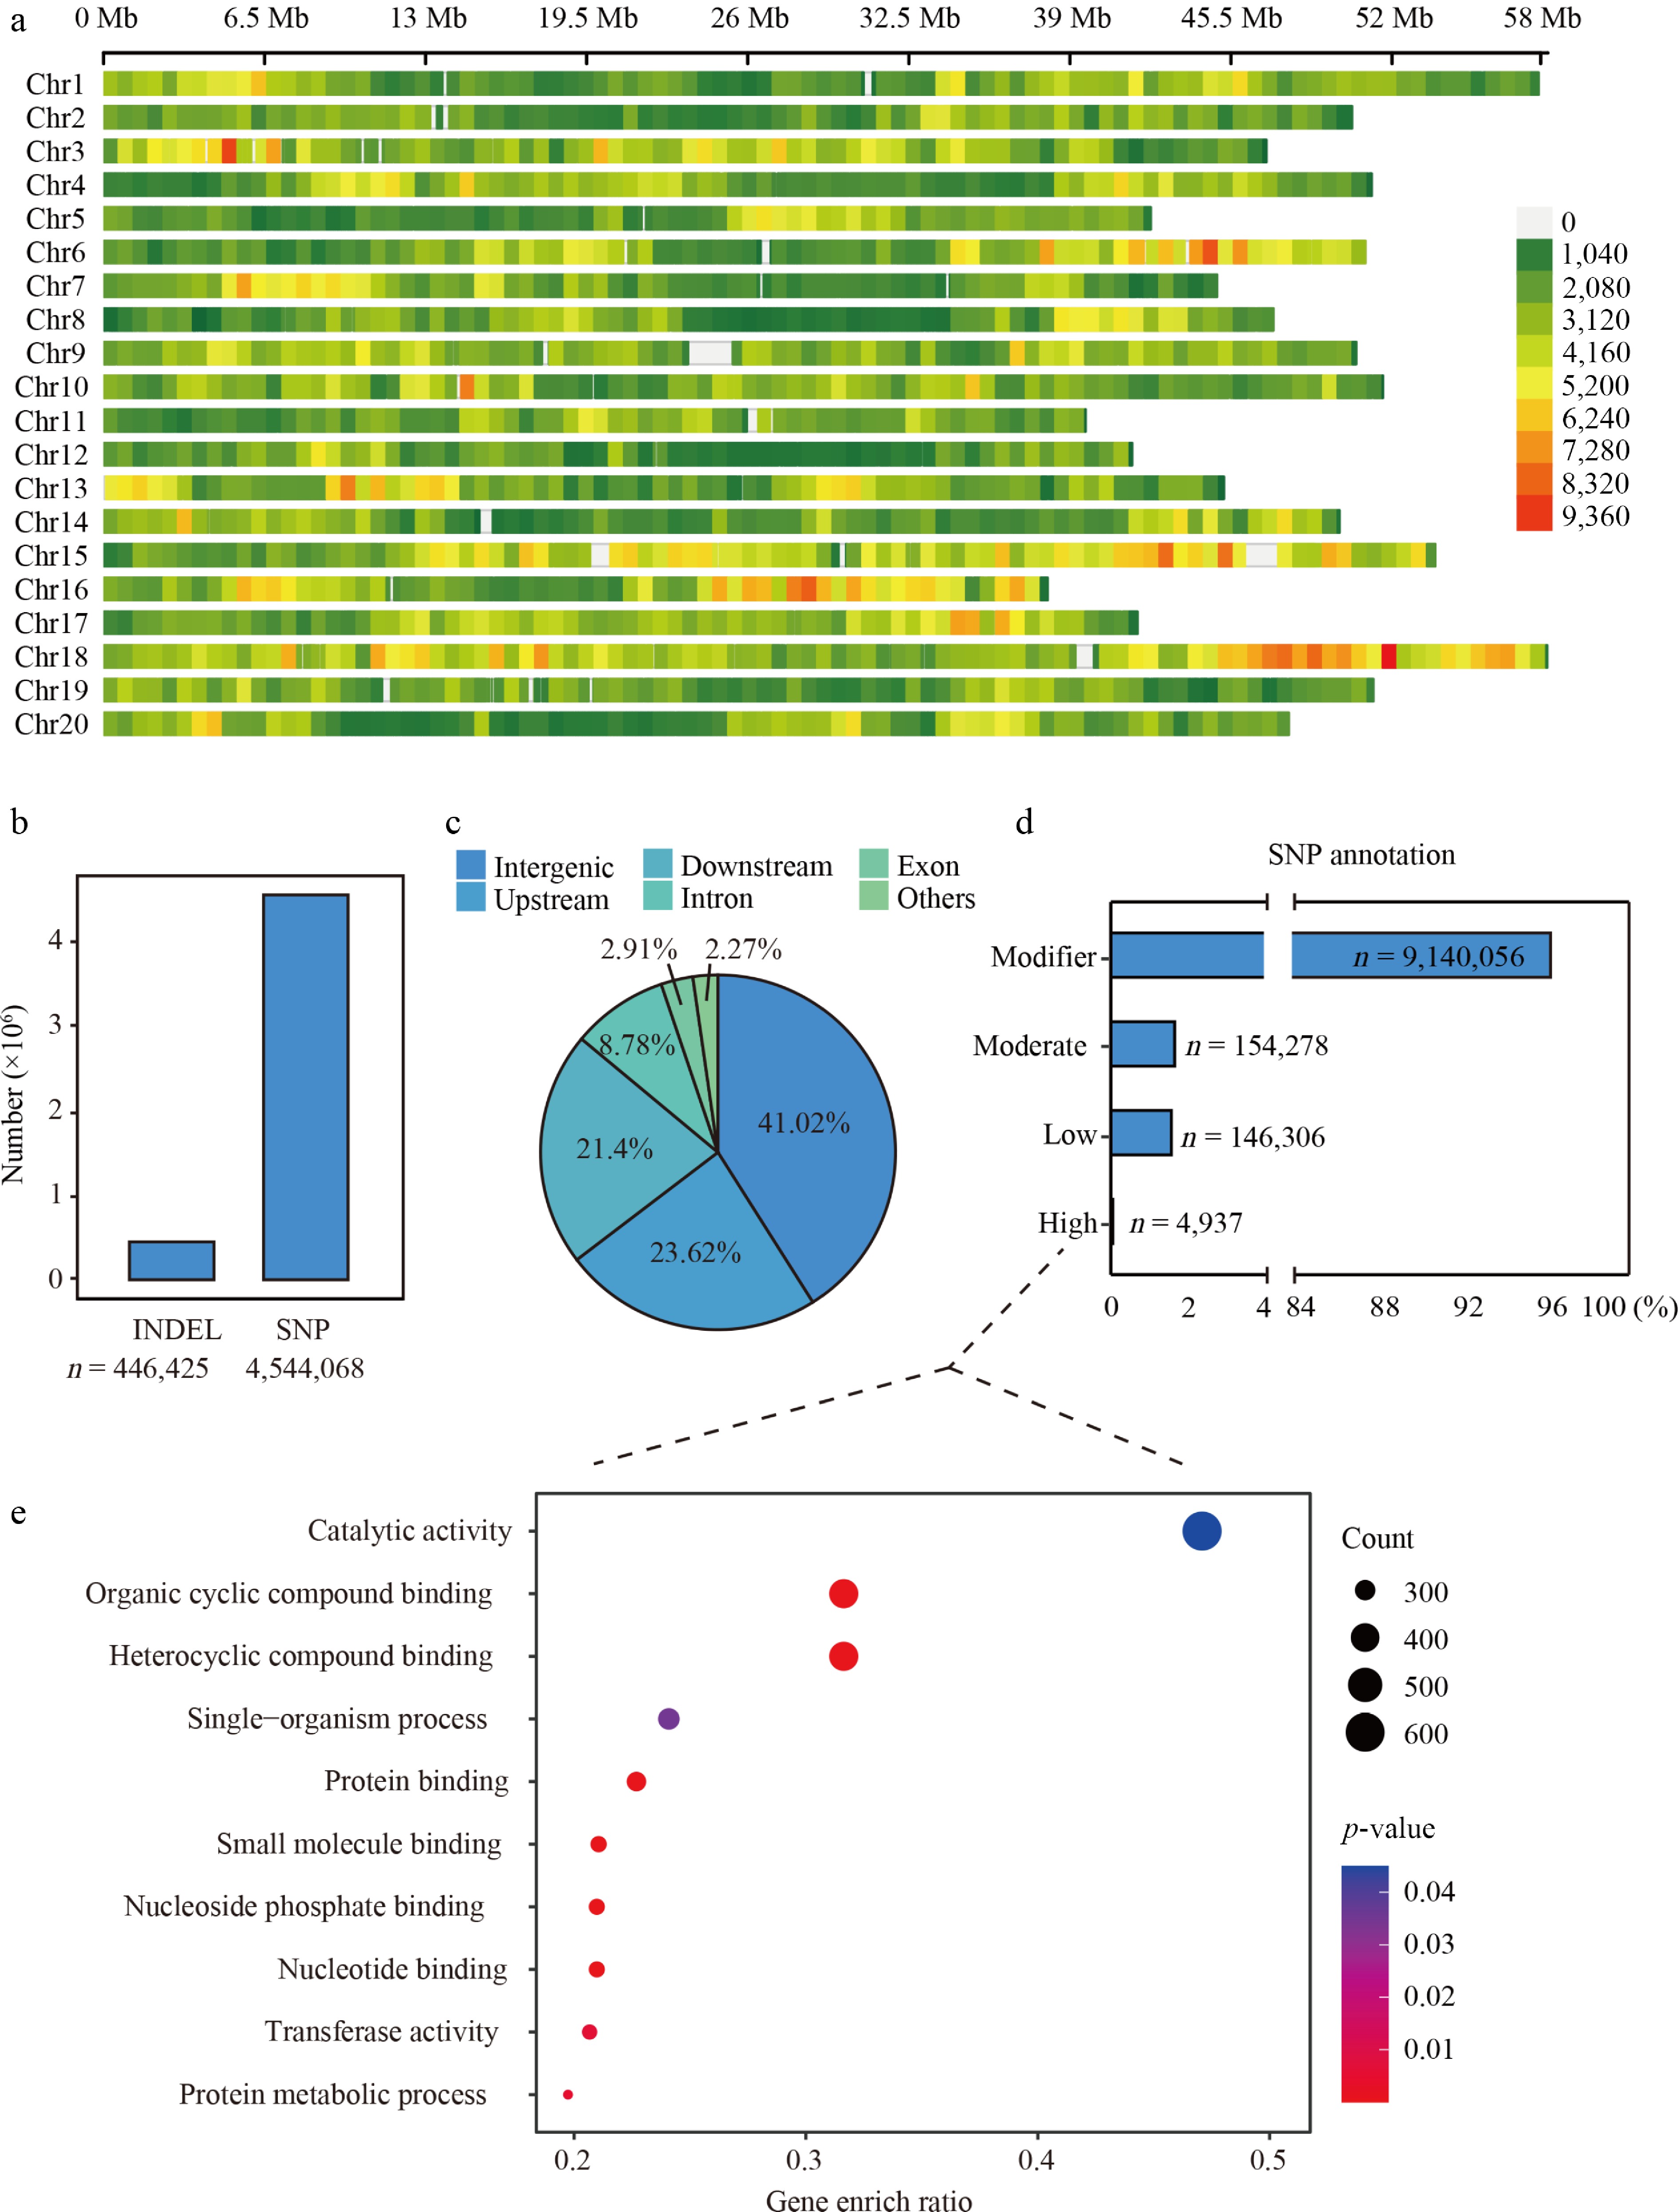
Figure 2.
The genomic differences in the transcribed region of Glycine max. (a) The distribution of SNPs on chromosomes of Glycine max. The heatmap shows the density of SNPs. (b) The total number of SNPs and INDELs of Glycine max. (c) Pie chart representing the distribution of SNPs by the region of the gene. Different color blocks represent different regions. (d) Annotation of SNPs based on their effects on protein functions. HIGH: variants likely to have a significant disruptive impact on the protein, such as causing protein truncation, loss of function, or triggering nonsense-mediated decay. Moderate: variants that may moderately affect protein function without complete disruption. Low: variants presumed to have little to no effect on protein function or behavior. Modifier: Variants that are typically non-coding or affect non-coding regions, where the impact on protein function is unclear or predicted to be minimal. (e) GO terms for genes that have high-impact SNPs affecting protein function.
-
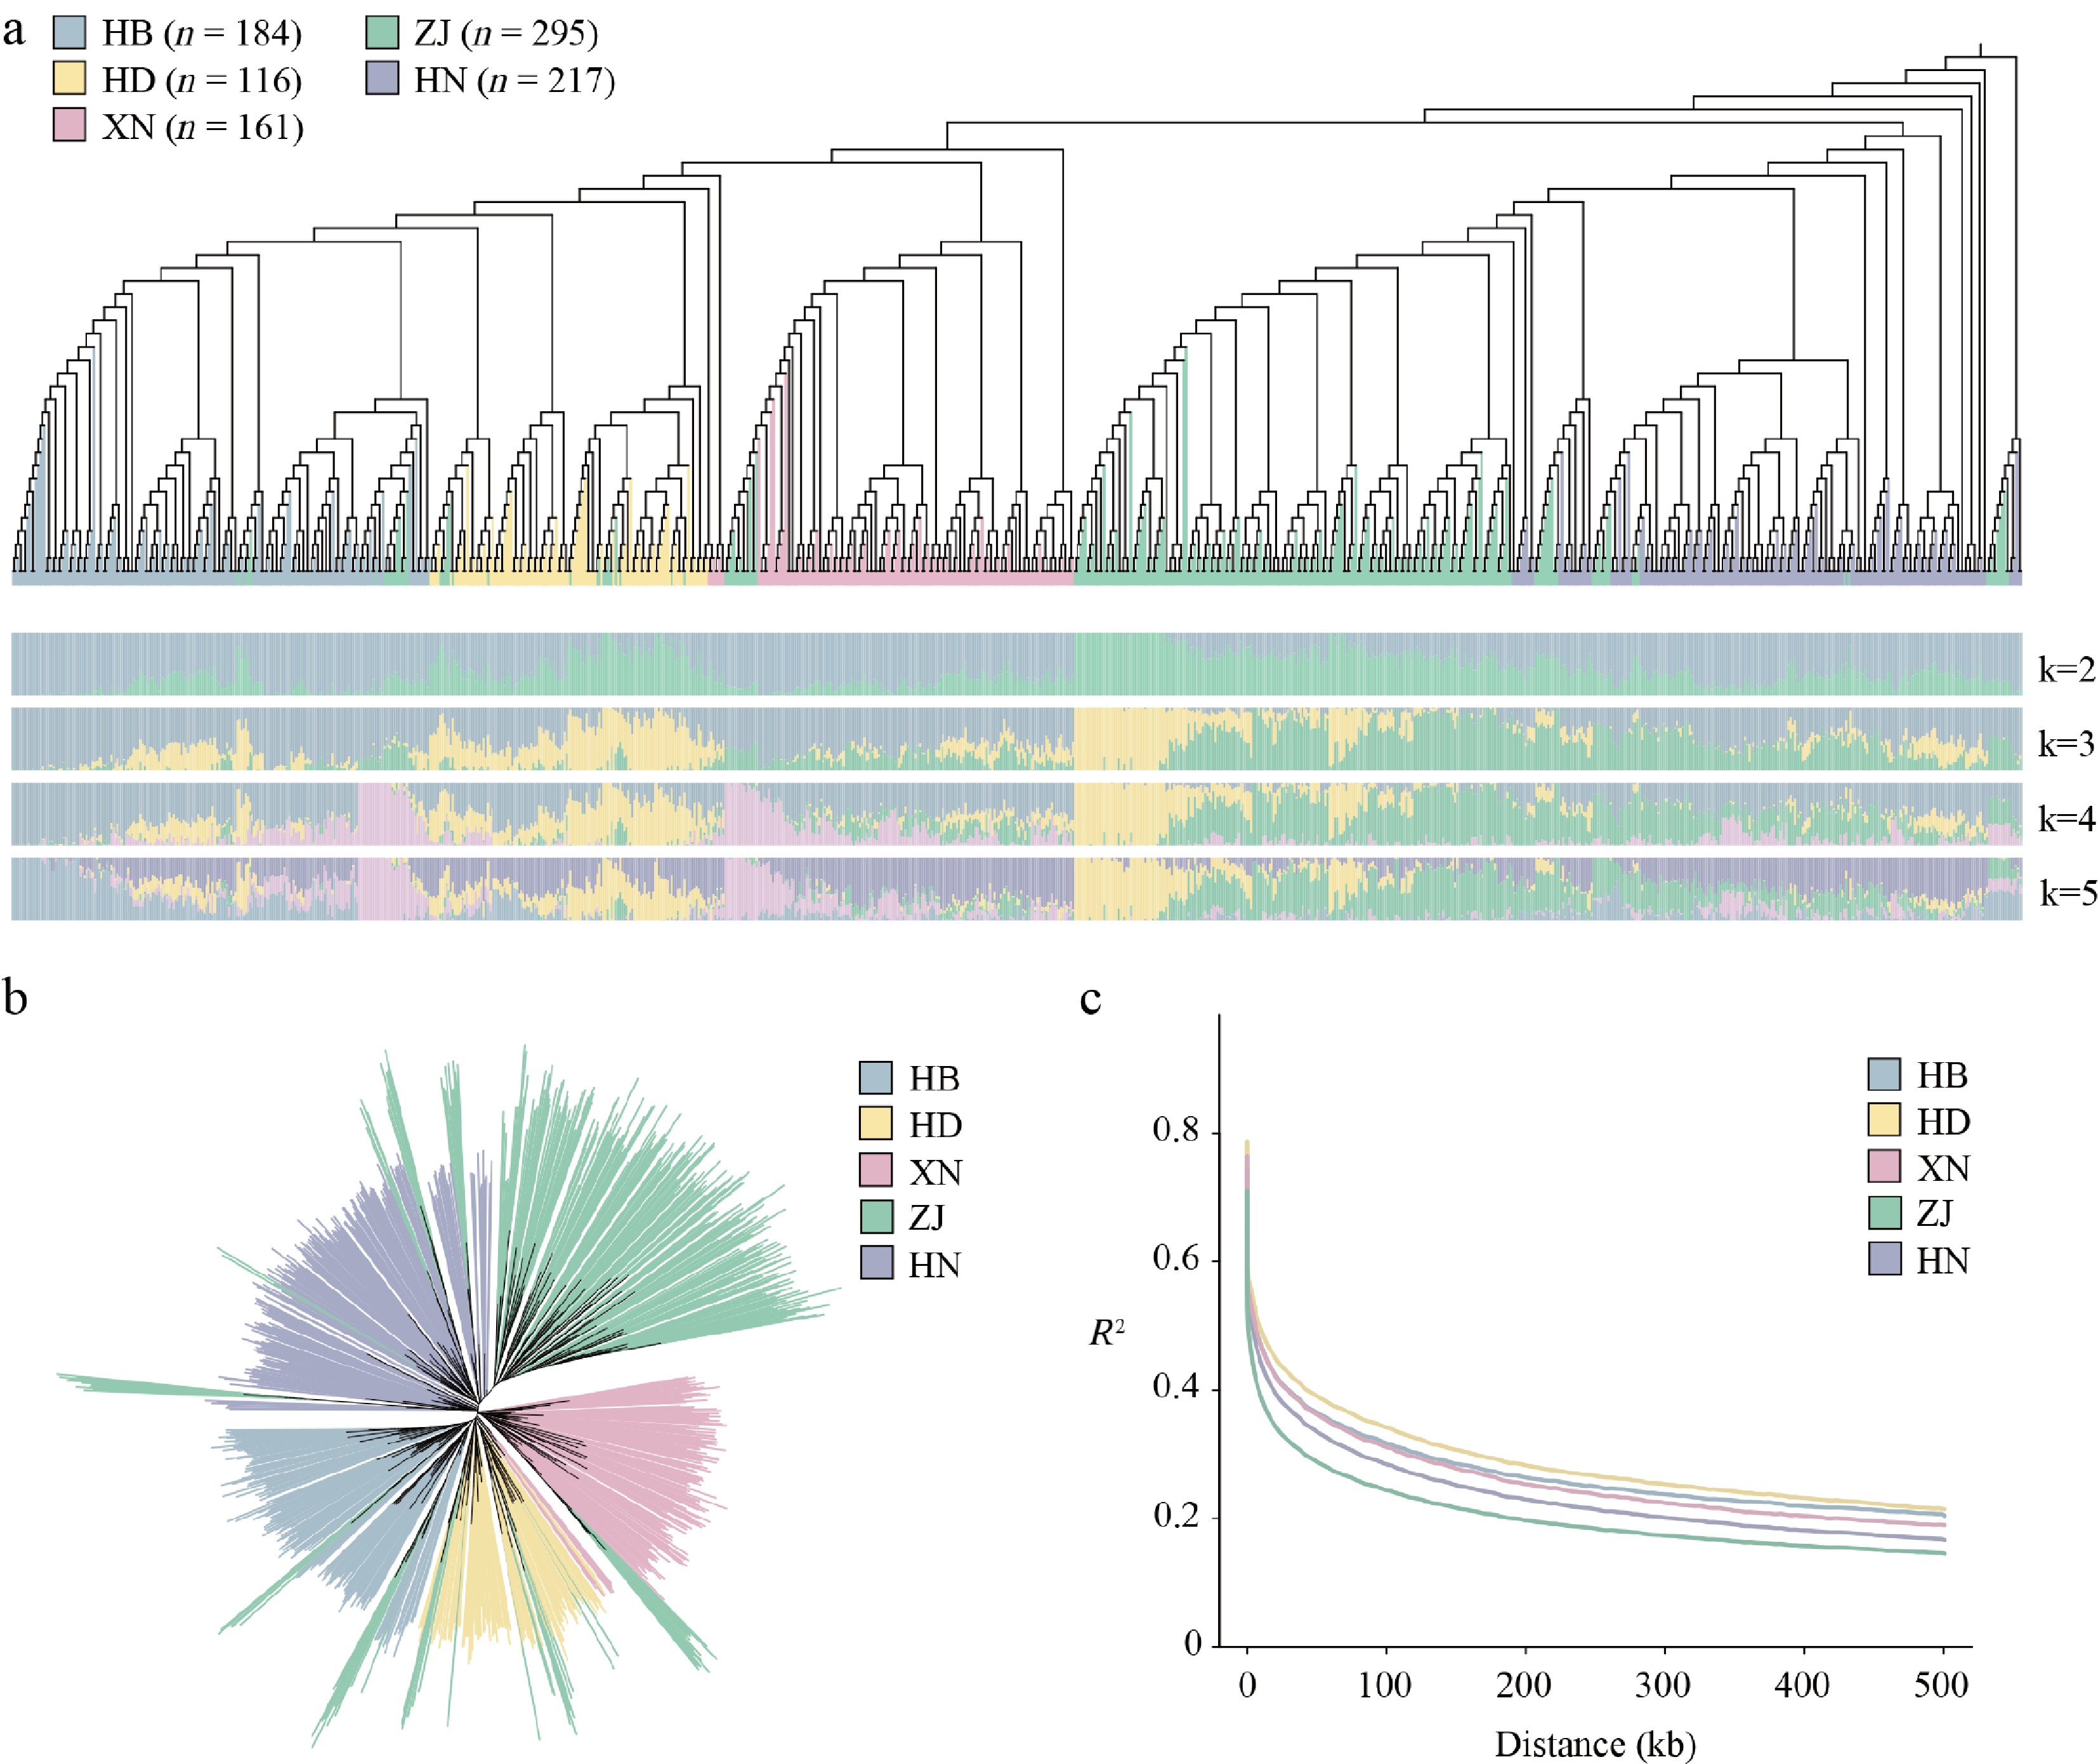
Figure 3.
Phylogenomic relationships, population structure, and genomic diversity of 973 Glycine max accessions. (a) Phylogenetic tree and population structure of Glycine max accessions, including those from Zhejiang Province and surrounding regions. (b) Classification and differences of accessions from Zhejiang Province and surrounding regions. (c) LD decay of the five subgroups showing diversity in accessions from Zhejiang Province.
-
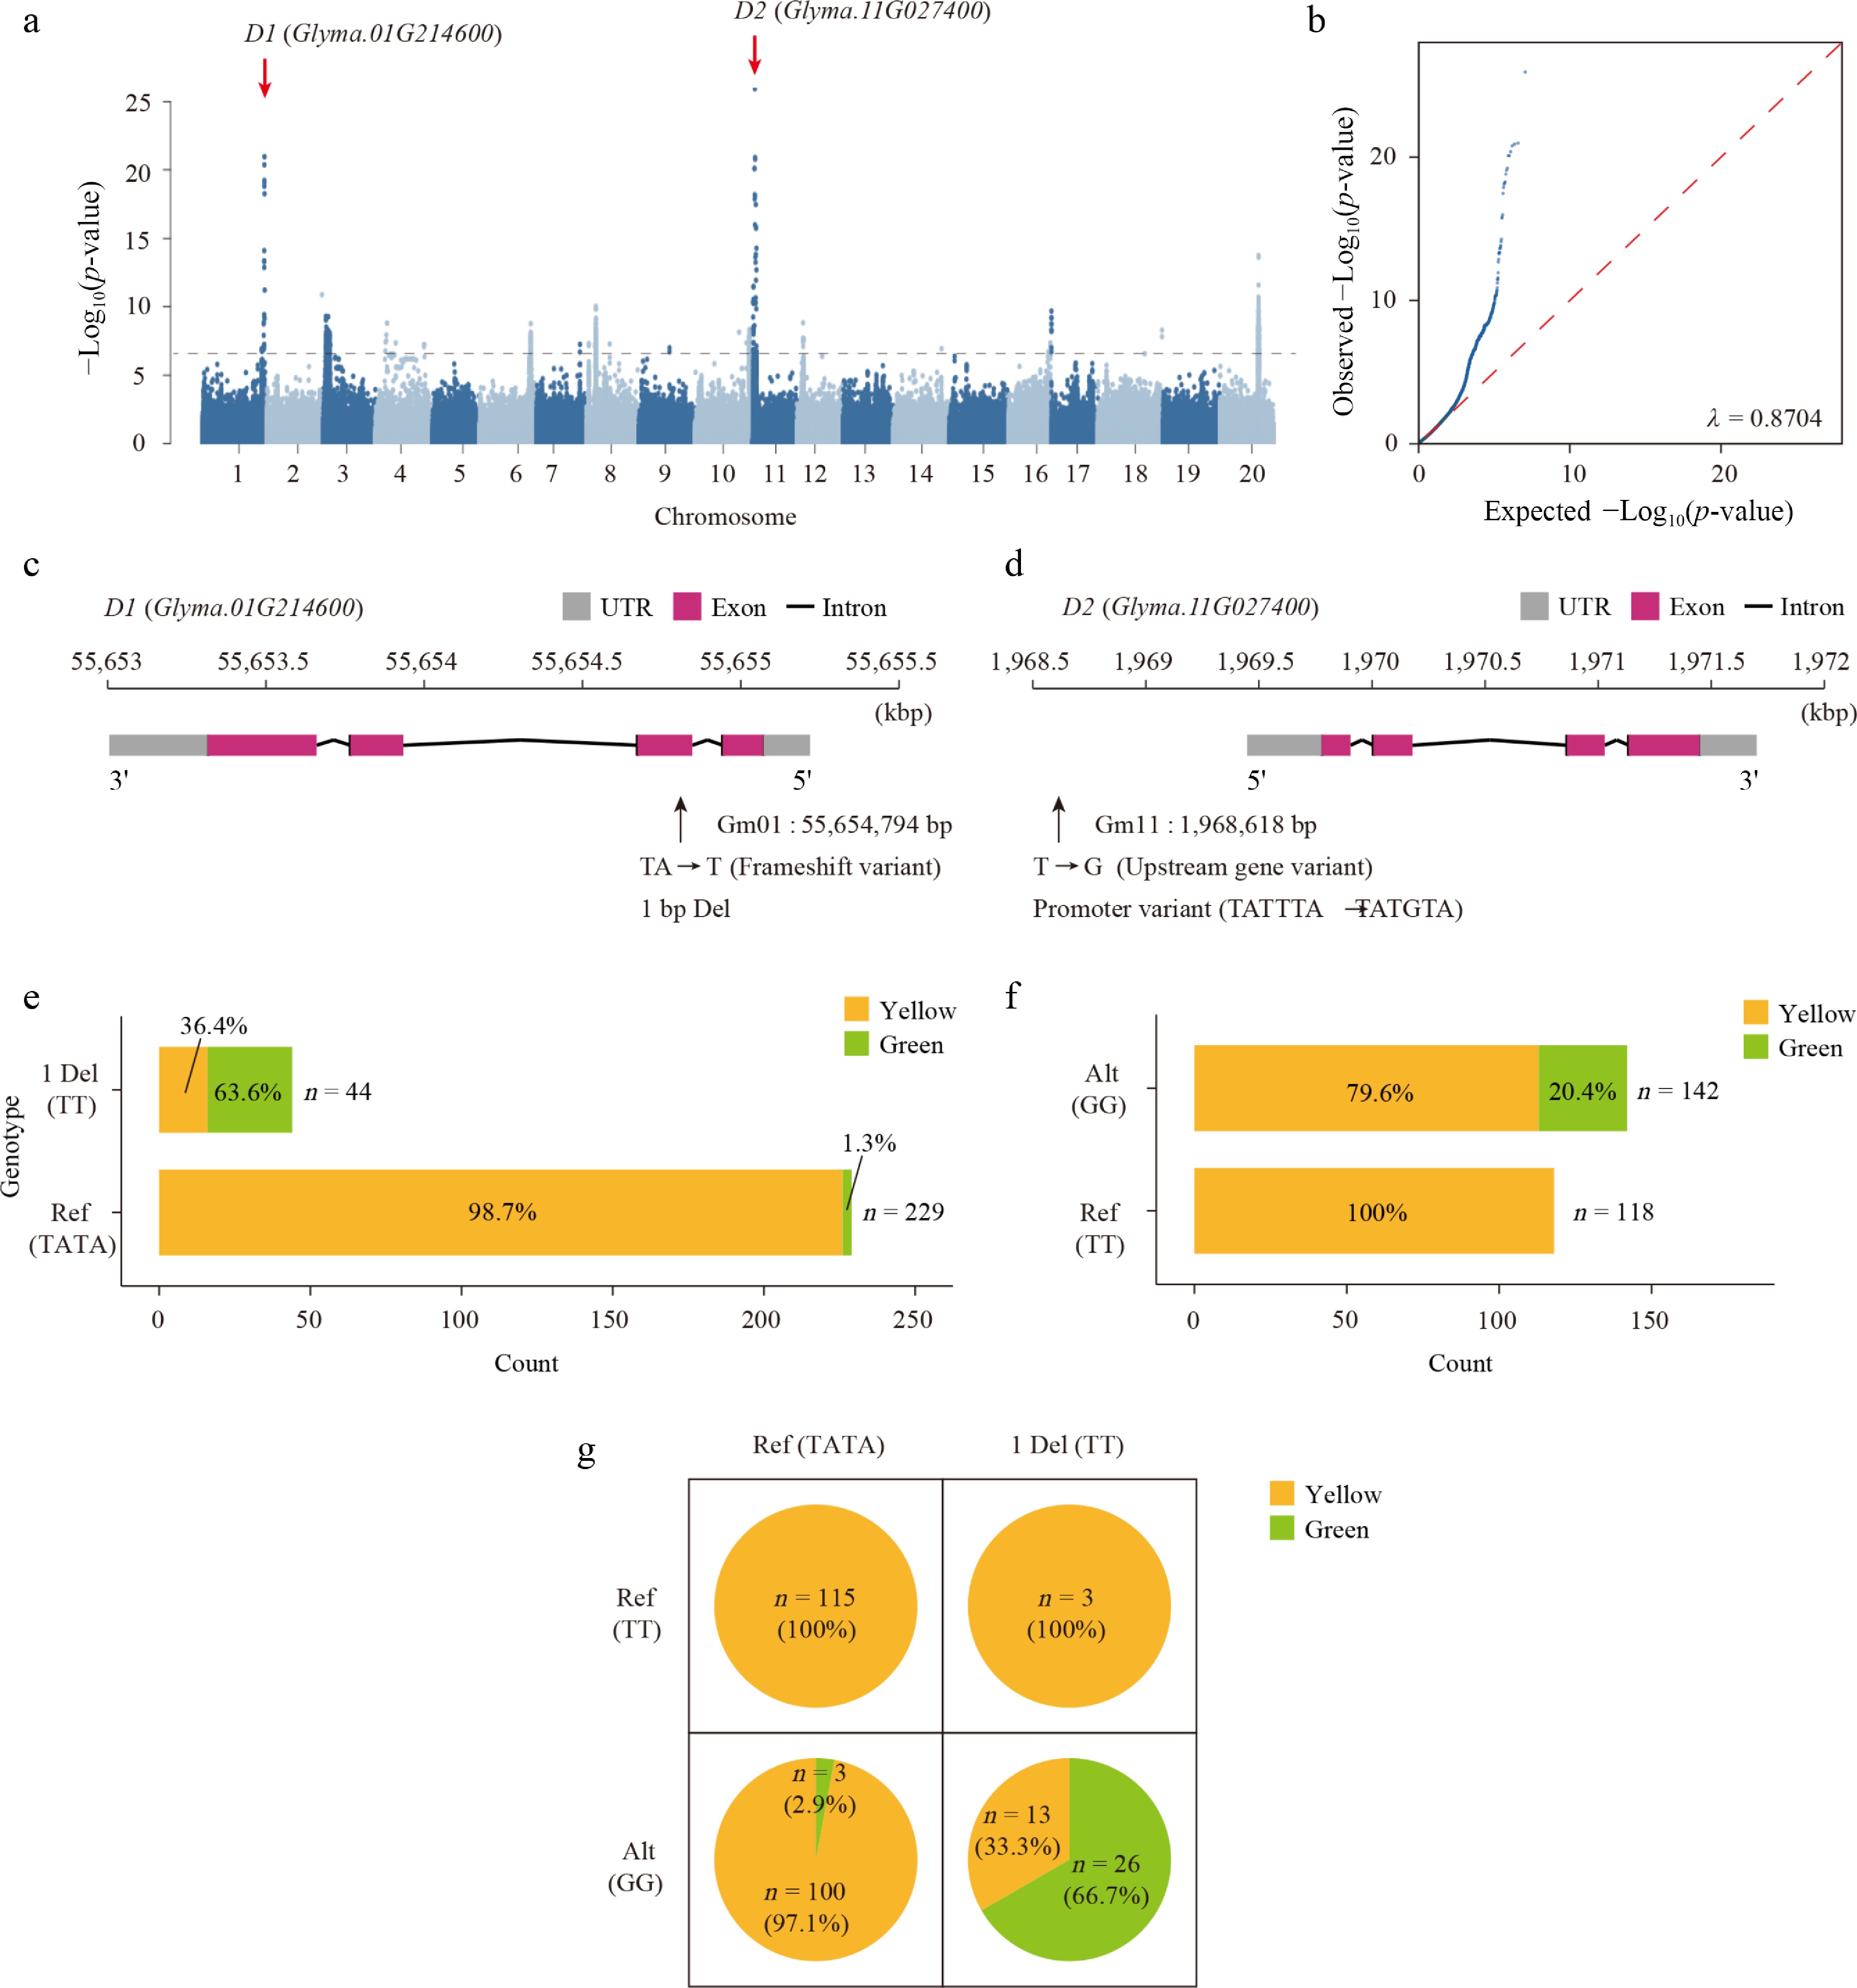
Figure 4.
GWAS analysis of cotyledon color. (a) Manhattan plot for the GWAS of cotyledon color. D1 (Glyma.01G214600) and D2 (Glyma.11G027400) are indicated as the key genes involved in the regulation of cotyledon color. (b) Quantile-quantile (QQ) plot of GWAS results for cotyledon color; λ denotes the genomic inflation factor. (c), (d) Gene structure and mutation information of D1 and D2 genes. Candidate functional variation is indicated by a black arrow. (e), (f) Histogram plots showing the distribution of cotyledon color in soybean accessions with different haplotypes. (g) Pie chart displaying the results of a joint analysis of the two haplotypes.
-
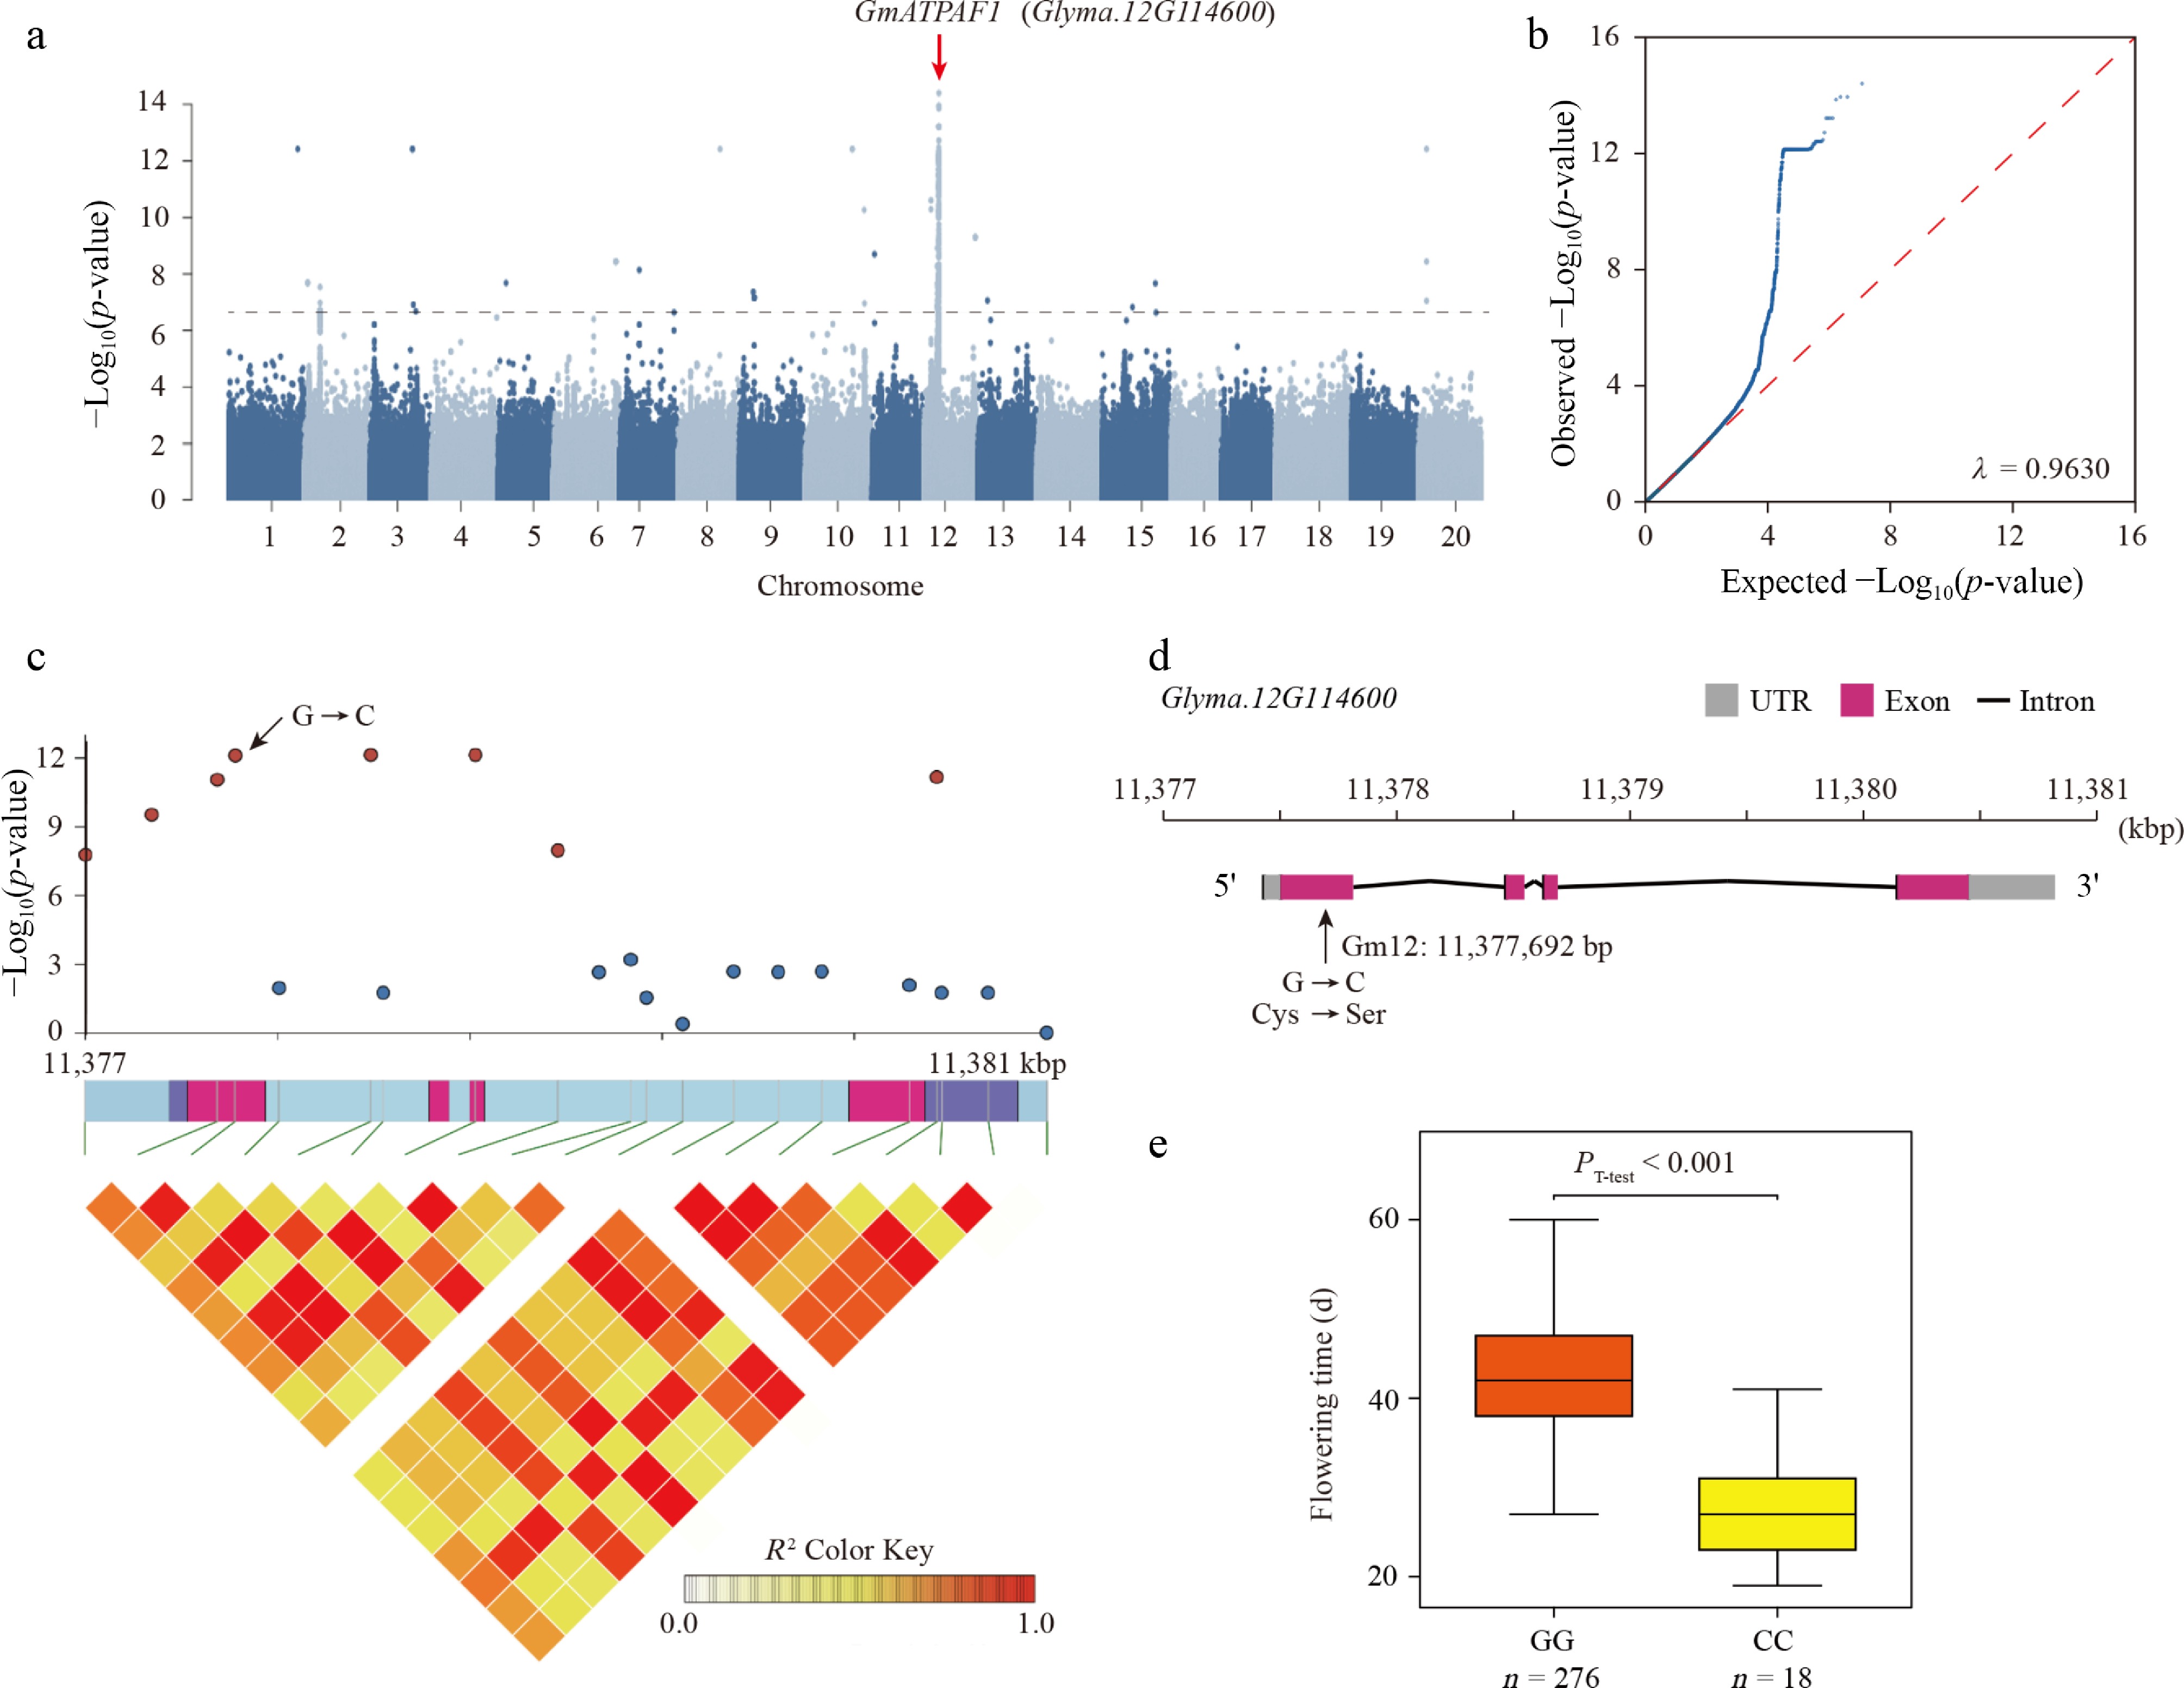
Figure 5.
GWAS analysis of flowering time. (a) Manhattan plot for the GWAS of flowering time (day). The ATP synthase assembly factor 1 (Glyma.12G114600) gene was identified as the potential causal gene influencing flowering time. (b) QQ plot of GWAS results for flowering time; λ denotes the genomic inflation factor. (c) Heatmap illustrating SNP markers in an LD block within the region of the GmATPAF1 gene. (d) Gene structure and mutation information for the GmATPAF1 gene. Candidate functional variation is indicated by a black arrow. (e) Box plot comparing flowering time across two haplotypes.
-
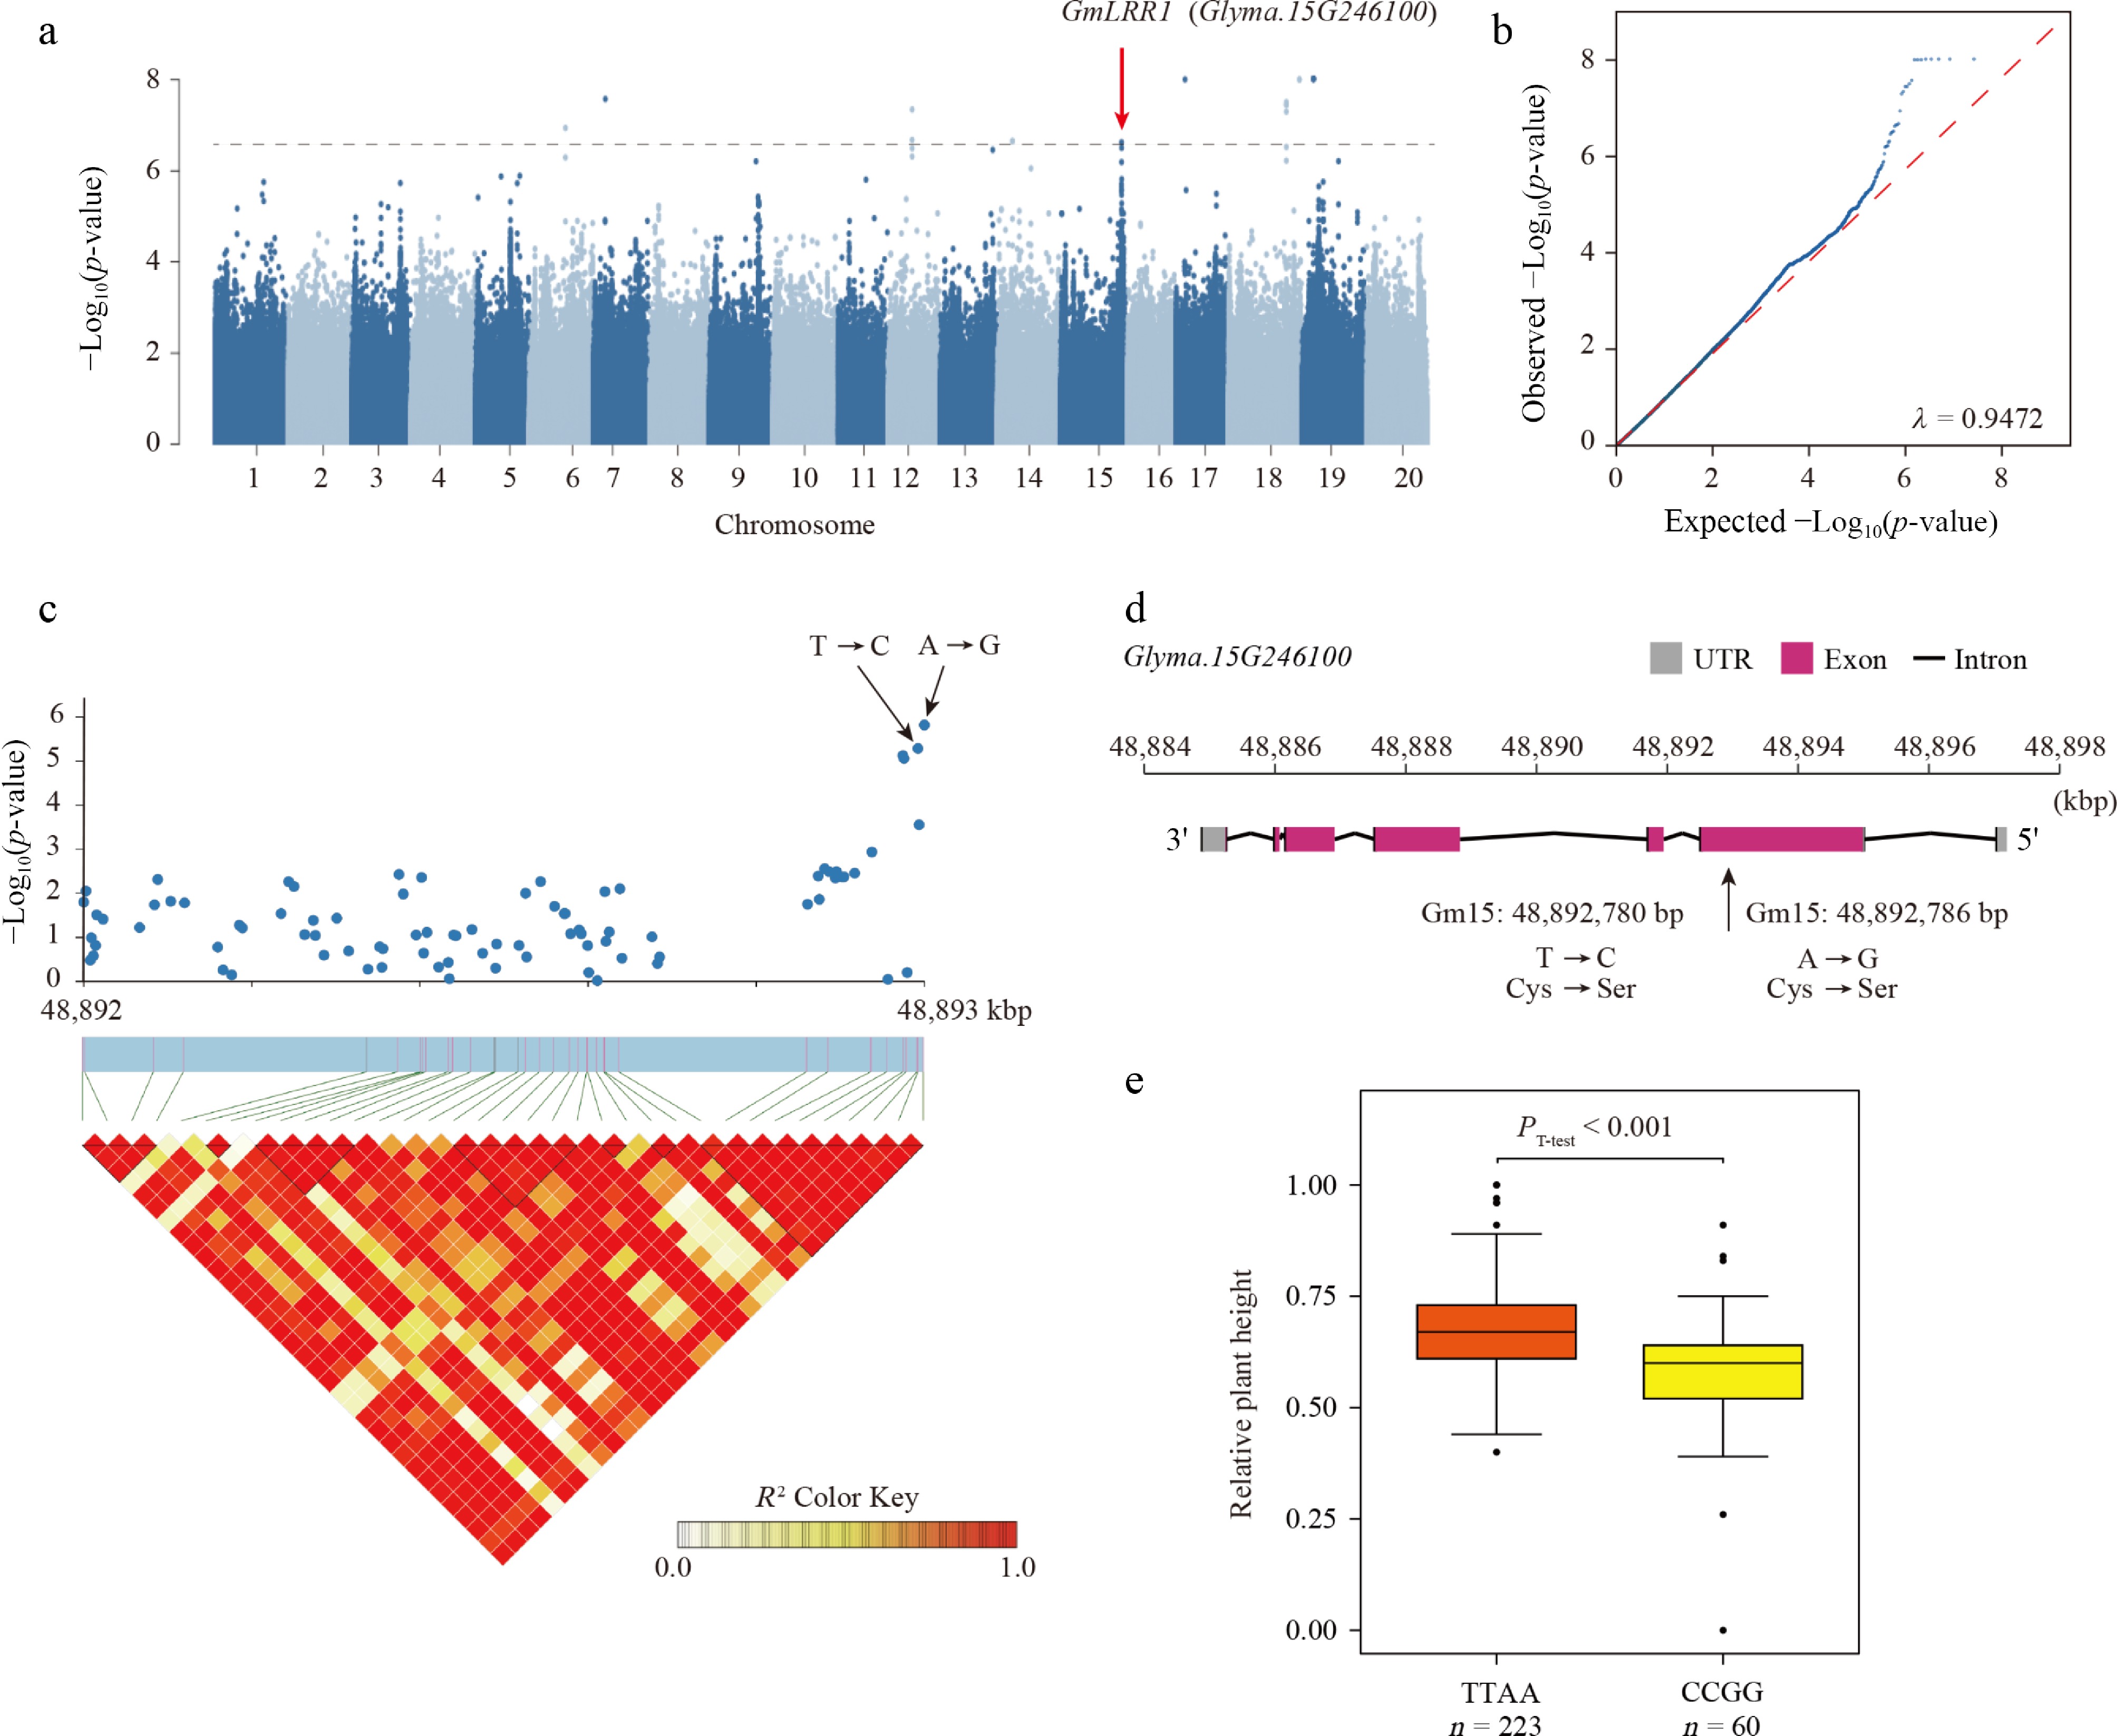
Figure 6.
GWAS analysis of salt tolerance. (a) Manhattan plot for the GWAS of relative plant height under salt stress. The LRR1 gene (Glyma.15G246100) was identified as the potential causal gene. (b) QQ plot of GWAS results for relative plant height under salt stress; λ denotes the genomic inflation factor. (c) Heatmap showing SNP markers in an LD block within the region of the GmLRR1 gene. (d) Gene structure and mutation information of the GmLRR1 gene. Candidate functional variation is indicated by a black arrow. (e) Box plot showing the distribution of salt tolerance across two haplotypes.
Figures
(6)
Tables
(0)