













-
Soybean (Glycine max [L.]) is an annual legume native to China, serving as a vital crop for agricultural oil, animal feed, and human nutrition as a primary source of edible oil and protein[1]. Despite its importance, China relies heavily on soybean imports to satisfy more than 80% of domestic demand[2]. Although the country possesses abundant wild soybean resources, soybean production has increased only modestly over the past five decades[3]. Consequently, a deeper understanding of the genetic mechanisms underlying key soybean traits is urgently needed to accelerate breeding efforts and improve both yield and quality.
The identification of genes with high breeding value is central to soybean improvement. Over the past three decades, thousands of quantitative trait loci (QTLs) associated with more than 200 traits have been reported[4]. Genome-wide association study (GWAS) provides an effective framework for rapidly and precisely dissecting the genetic variation underlying complex traits. For example, Contreras-Soto et al.[5] conducted a GWAS using single nucleotide polymorphism (SNP) markers and haplotype information from 169 soybean cultivars evaluated across four locations in Southern Brazil, identifying haplotypes significantly associated with seed yield, seed width, and plant height. Fang et al.[6] analyzed 809 soybean accessions and identified 245 significant genetic loci, 95 of which showed genetic interactions with other loci. Duan et al.[7] performed GWAS analysis on more than 1,800 soybean accessions and found that natural variation in the GmST gene influences seed thickness and size through differential transcript abundance. In addition to SNP-based GWAS, structural variation-based GWAS (SV-GWAS) have also been applied. For instance, Zhang et al.[8] conducted an SV-GWAS involving 547 soybean accessions and identified 6,013 SVs significantly associated with 22 traits. Genetic studies have further expanded to other important soybean traits, including cold tolerance[9], sucrose enrichment[10], and phosphorus efficiency[11]. However, most previous GWAS have focused primarily on improved cultivars or broad germplasm collections, while regionally adapted landraces, particularly those with specialized uses, remain underrepresented.
Vegetable soybean is a cultivated form of Glycine max within the family Leguminosae and is harvested during the reproductive stages R6 (bulging pods) to R7 (early maturity) for direct consumption[12]. Zhejiang Province, located in the low-latitude southern Yangtze River Basin of China, is characterized by diverse geomorphology, a favorable climate, and a highly developed agricultural landscape[13]. With a long history of soybean cultivation, extensive varietal diversity, and abundant germplasm resources, Zhejiang has become a key production region for high-protein and vegetable soybeans[14]. Soybean resources from this region exhibit substantial genetic diversity and harbor numerous valuable alleles. Therefore, elucidating the genetic architecture of local soybean traits and identifying key regulatory genes are critical for the development of high-yielding and high-quality cultivars.
In this study, we investigated the genetic basis of key soybean agronomic traits in Zhejiang Province, China. A total of 28 agronomic traits were evaluated across 295 soybean accessions. We subsequently conducted population structure analysis, GWAS, and haplotype analysis to identify genomic regions associated with these traits. The identification of candidate genes through this integrative approach provides a foundation for molecular marker-assisted breeding and genetic improvement of soybean.
-
In this study, 295 soybean accessions were planted at the Yangdu Research Base, Zhejiang Academy of Agricultural Sciences (120.21551° E, 30.25308° N) on July 22, for both years 2022 and 2023. These accessions, primarily collected from across Zhejiang Province, China, are highly representative of the region. Standard agronomic practices for soybean cultivation were strictly followed throughout the experiment[15]. A total of 28 phenotypic traits were assessed, including 15 qualitative traits and 13 quantitative traits. These traits were manually photographed and measured, with the experiments replicated twice, once in each of the 2 years (2022 and 2023). For each trait, five biological replicates were recorded. Detailed information on the phenotyping process is provided in Supplementary Table S1. Monthly climatic data at the Haining experimental site were recorded for the soybean growing season from July to October in 2022 and 2023. For July, August, September, and October, respectively, the monthly mean temperatures were 30.7, 31.6, 23.8, and 18.6 °C in 2022, compared with 29.6, 28.2, 25.9, and 20.3 °C in 2023. Monthly total precipitation for the same months was 65.1, 54.7, 236.5, and 56.4 mm in 2022, and 213.6, 138.9, 153.9, and 35.8 mm in 2023. Mean sunshine duration was 11.2, 10.7, 7.8, and 6.7 h in 2022, and 7.9, 9.6, 7.8, and 7.9 h in 2023.
Seedling salt stress experiment
-
The experiment was conducted in pots, with each variety divided into nine portions (10 seeds per pot). Plants were watered every 2–3 d and interplanted once the cotyledons had fully expanded, leaving six plants in each pot. When the true leaves were fully expanded (approximately 10 d after planting), 250 mL of 300 mmol/L NaCl solution was added to each pot. On the 15th day, the NaCl concentration was increased to 400 mmol/L, with another 250 mL of solution added per pot. On the 20th day, plant height and fresh weight were recorded, and plants were photographed. Control plants were irrigated with an equal volume of water without NaCl. Relative plant height under salt stress was calculated as the ratio of plant height under salt treatment to that under control conditions.
DNA sequencing and genotyping
-
DNA was extracted from young soybean leaf tissues using the CTAB method[16]. Libraries for each soybean sample were prepared with ~350 bp inserts according to the manufacturer's instructions (Illumina Inc., San Diego, CA, USA). Sequencing was performed on an Illumina HiSeq 2500 with paired-end reads of 90 bp. The reads were quality controlled using fastp software (v0.23.2)[17]. Clean reads were mapped to the Williams 82 reference genome (Glycine max Wm82.a4.v1). A raw population genotype file, containing SNPs and InDels (insertion/deletion), was generated using the HaplotypeCaller module of the Genome Analysis Toolkit (GATK, v4.5.0.0)[18]. After applying stringent quality control measures, including a missing genotype rate of ≤ 0.20 and a minor allele frequency (MAF) of ≥ 0.05 in VCFtools software (v0.1.16)[19], a total of 4,544,068 high-quality SNPs were selected. These high-quality SNPs were then used for further analysis. Variant functional annotation was performed using SnpEff (v5.1)[20].
Gene Ontology (GO) enrichment analysis
-
Gene Ontology (GO) enrichment analysis was performed using the GOstats package[21] in R (v2.70.0). GO annotations were constructed based on the gene-to-GO annotation file released on a public database (
https://systemsbiology.cau.edu.cn/agriGOv2/ )[22]. The background gene set was defined as all genes with available GO annotations under the same annotation system. Enriched GO terms were identified using a hypergeometric test.Population analysis
-
A phylogenetic tree was constructed using Phylip (v3.697) software (Retief, 2000) and visualized using ggtree (v3.12.0)[23]. To determine the optimal number of subpopulations, different levels of K (K = 2 to 15) were tested using the best K module. Principal component analysis (PCA) was performed on individual genotypes using Genome-wide Complex Trait Analysis (GCTA, v1.92.1)[24], and the first two principal components were plotted using ggplot2 (v3.3.6) (
https://cran.r-project.org/web/packages/ggplot2/ ) to visualize the population structure (Supplementary Fig. S1a). To quantify genomic differentiation between different growth regions, nucleotide diversity (π) and divergence (FST) were calculated in 20 kb sliding windows with a 10 kb step size using software VCFtools (v0.1.16)[19] to quantify genomic differentiation between different growth regions. The nucleotide diversity (π) was plotted using ggplot2 (v3.3.6) (https://cran.r-project.org/web/packages/ggplot2/ ) to further visualize the population structure.Linkage disequilibrium and haplotype analysis
-
To estimate and compare the pattern of linkage disequilibrium (LD), the squared allele-frequency correlation coefficient (r2) between pairwise SNPs was computed using PopLDdecay (v3.43)[25]. The average r2 value was calculated for pairwise markers within a 10 kb window, and these values were averaged across the whole genome. Genome-wide LD was estimated using LD BlockShow software (v1.40)[26], which also calculated the r2 values among SNPs with known genomic positions. Genotypes were grouped into independent sets based on specific haplotypes. To estimate the significance of differences between haplotype groups, a Student's t-test was performed.
Genome-wide association study (GWAS)
-
We conducted the GWAS using 4,544,068 high-quality SNPs. Association analysis was performed using the Efficient Mixed-Model Association eXpedited (EMMAx) program (v2012-021-0) (
https://genome.sph.umich.edu/wiki/EMMAX )[27]. The kinship matrix, representing pairwise genetic similarities derived from the simple matching coefficients, was used as the variance–covariance matrix for the random effects and calculated by EMMAx (v2012-021-0) (https://genome.sph.umich.edu/wiki/EMMAX )[27]. To correct for population stratification, the first three principal components were used as covariates. The effective number of independent SNPs and the suggestive p-value were estimated using the Genetic Type I error calculator (GEC, v0.2)[28]. In the mixed model, a suggestive p-value significance threshold of p < 7.20 × 10⁻⁷ was applied.To further evaluate the robustness of the GWAS results, additional association analyses were performed using the rMVP R package (v0.2.6)[29] (
https://github.com/xiaolei-lab/rMVP ), implementing both the general linear model (GLM) and the mixed linear model (MLM). For the GLM, the top three principal components were included as fixed-effect covariates to correct for population stratification[30]. For the MLM, the genomic relationship matrix (GRM), constructed using the VanRaden method[31], was used as the variance–covariance matrix for random effects, and the top three principal components were included as fixed-effect covariates. Variance components in the MLM were estimated using restricted maximum likelihood (REML) with the Brent optimization algorithm implemented in rMVP.Candidate gene expression analysis
-
Expression data for candidate genes were obtained from the public soybean transcriptome database[32]. Gene expression levels were quantified as Fragments Per Kilobase of exon model per Million mapped fragments (FPKM), which were further visualized as bar plots to show the tissue expression patterns of candidate genes.
-
To characterize phenotypic variation, 295 soybean accessions collected from Zhejiang Province were cultivated in Haining, as detailed in Supplementary Table S2. A total of 28 agronomic traits, including 15 qualitative and 13 quantitative traits, were recorded through manual measurement and photographic documentation during the 2022 and 2023 growing seasons. Correlation analysis demonstrated high repeatability of phenotypic measurements across the two years (Supplementary Table S2). Pearson correlation coefficients (PCC) exceeded 0.8 for most traits, with the exception of petiole length (PCC = 0.218, p = 1.28 × 10⁻³, Student's t-test), mature time (PCC = 0.592, p = 2.36 × 10⁻²⁵, Student's t-test), leaf length (PCC = 0.634, p = 8.73 × 10⁻³⁰, Student's t-test), and leaf width (PCC = 0.643, p = 4.29 × 10⁻³¹).
Substantial variation was observed among qualitative traits across the population. Fresh pod color (FPC) was predominantly green (n = 182) or light green (n = 71) (Fig. 1a), whereas mature pod color (MPC) was mainly brown (n = 149) or yellow (n = 112), with only a few accessions displaying black pods (n = 3) (Fig. 1a). Pod shape was largely sickle-shaped (n = 182), while a smaller proportion of accessions exhibited straight pods (n = 71) (Fig. 1a). Cotyledon color (CC) was predominantly yellow (n = 242). In addition, approximately one-quarter of the accessions exhibited seed coat bloom (n = 63), resulting in a duller seed surface appearance (Fig. 1a).
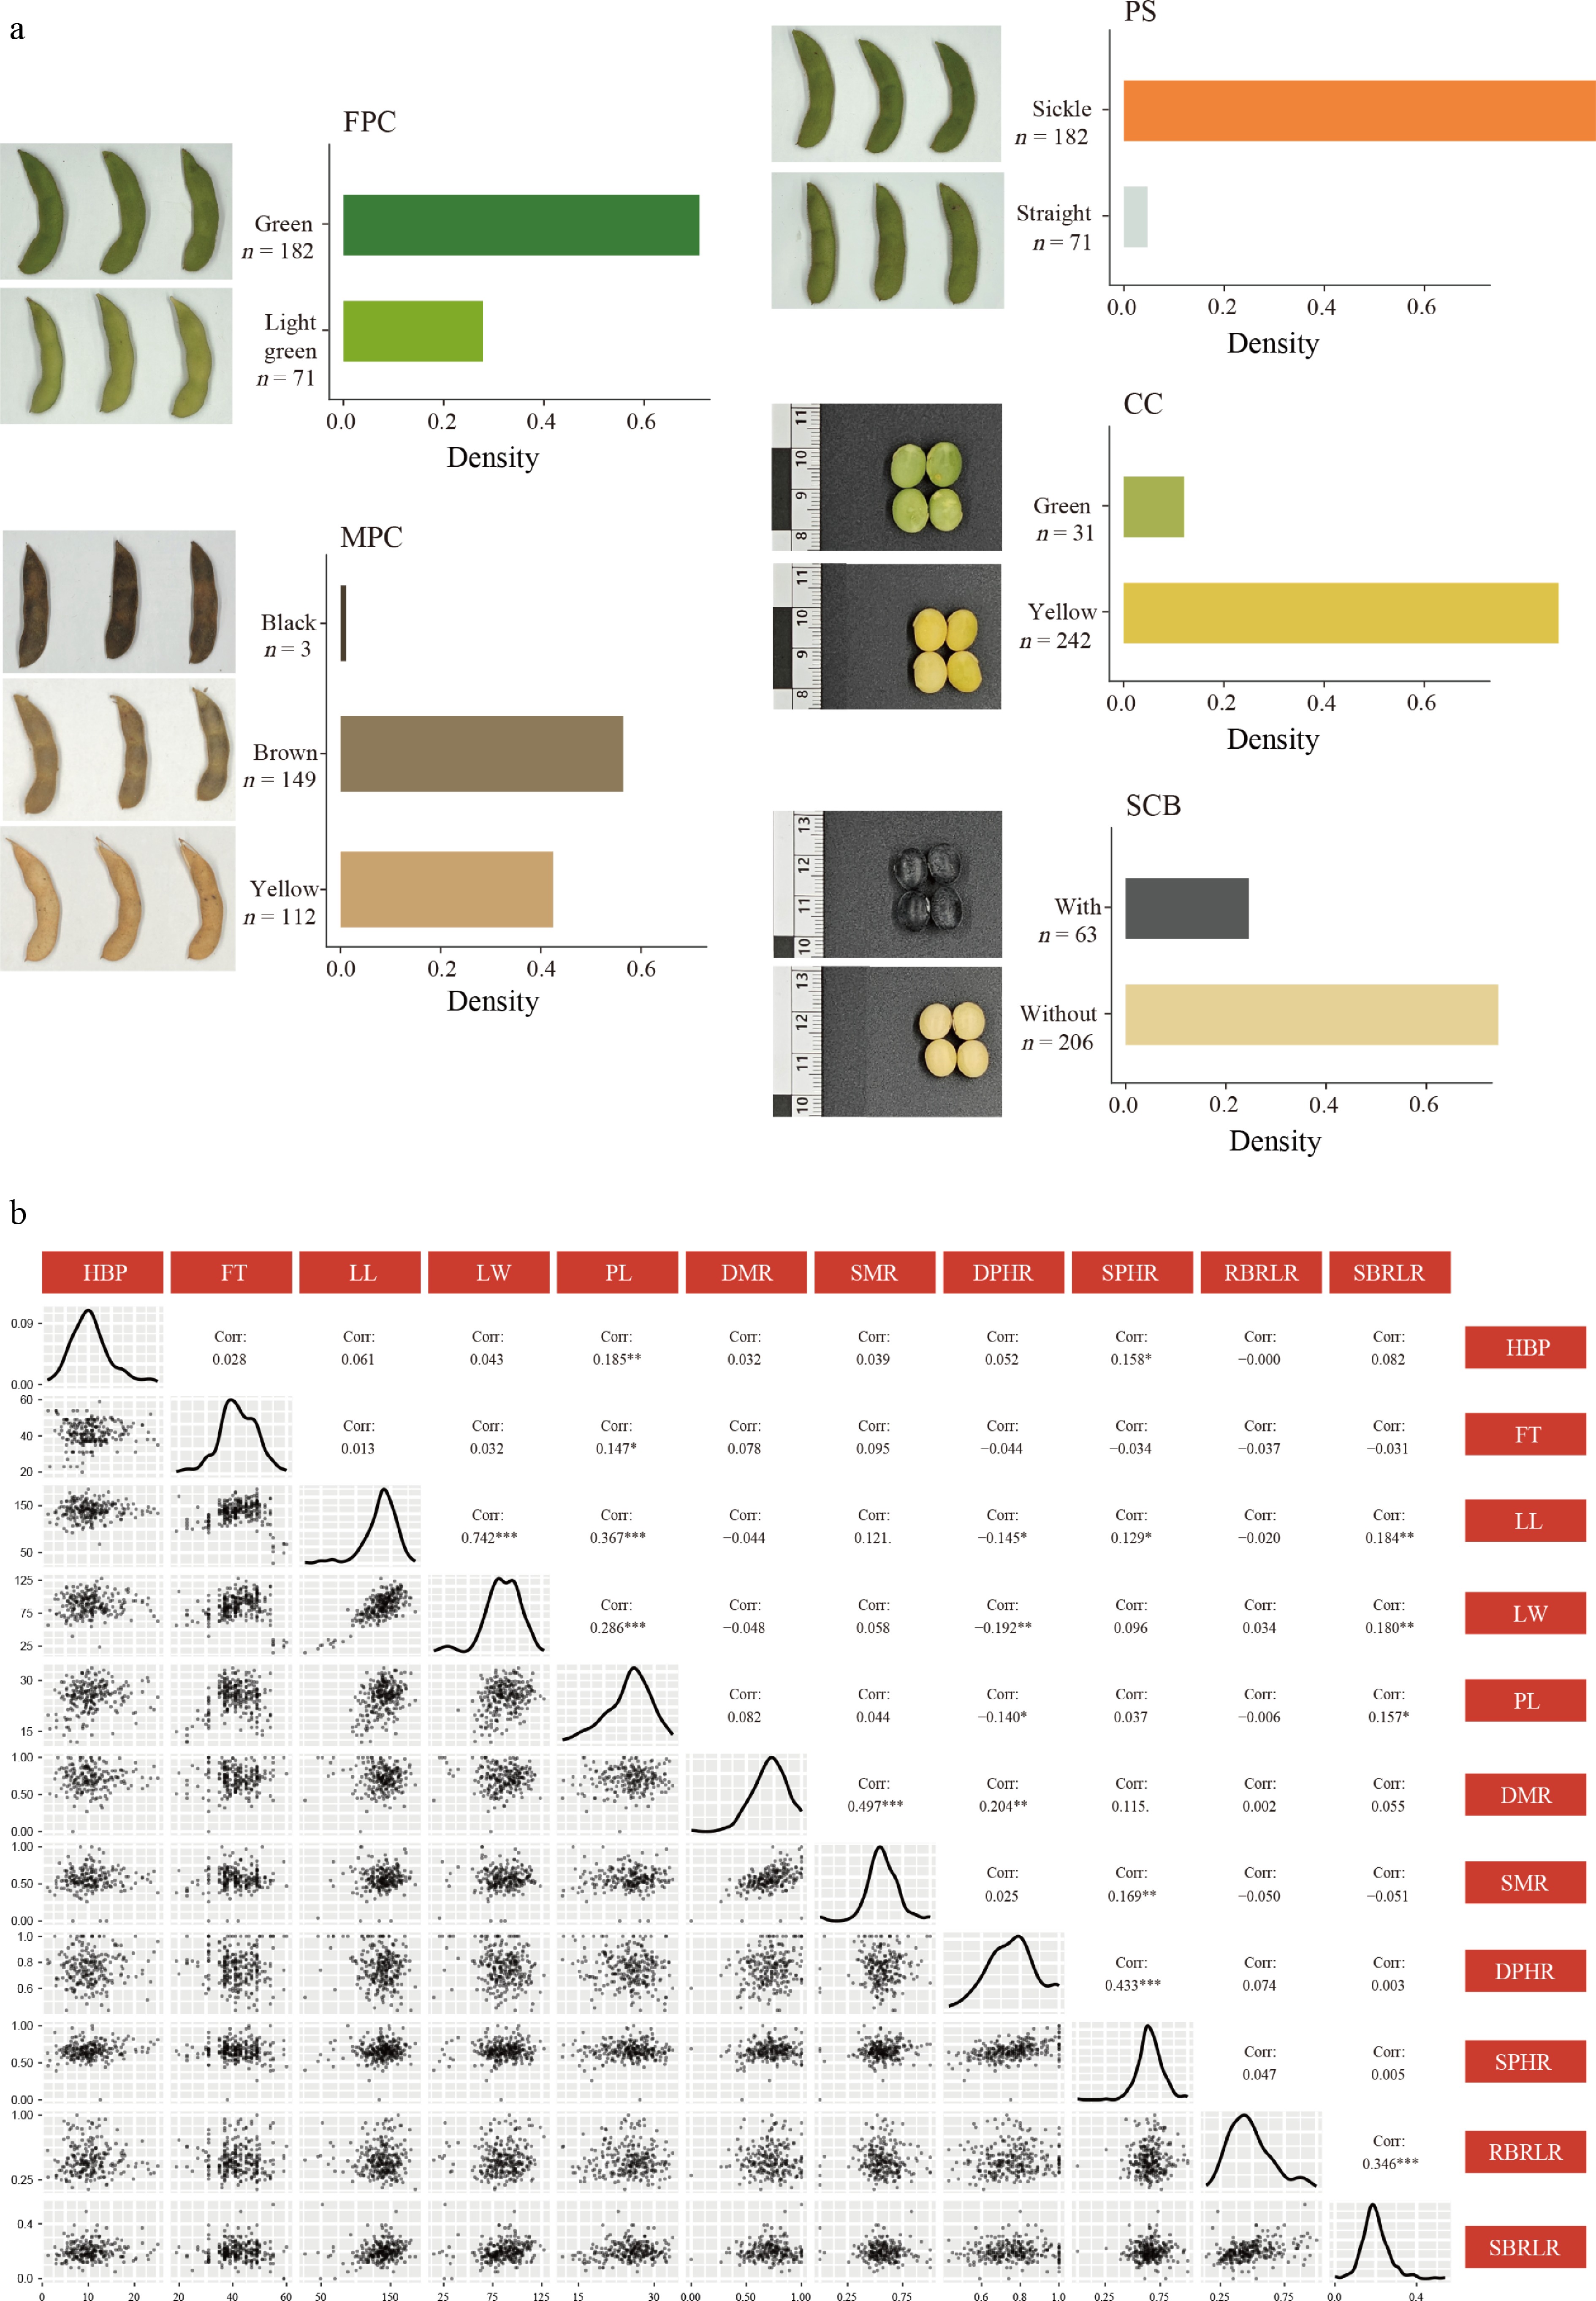
Figure 1.
Phenotypic diversity of Zhejiang soybean landraces. (a) Qualitative traits including fresh pod color (FPC), mature pod color (MPC), pod shape (PS), cotyledon color (CC), and seed coat bloom (SCB) vary in distribution. (b) Distribution and correlation of quantitative traits.
Spearman's rank correlation analysis revealed significant relationships among multiple agronomic traits. Leaf length (LL) showed strong positive correlations with leaf width (LW) (r = 0.742, p < 0.001, Student's t-test) and petiole length (PL) (r = 0.367, p < 0.001, Student's t-test). Similar correlation patterns were observed for stress-related traits. The dry matter ratio under salt stress (SMR) was significantly correlated with the dry matter ratio under drought stress (DMR) (r = 0.497, p < 0.001, Student's t-test), and the salt-stressed plant height ratio (SPHR) was positively correlated with the drought-stressed plant height ratio (DPHR) (r = 0.433, p < 0.001, Student's t-test) (Fig. 1b).
Genome-wide variation landscape of Zhejiang soybean germplasm
-
To assess the genetic diversity of soybean germplasm from Zhejiang province, 295 accessions were subjected to whole-genome sequencing with an average sequencing depth of 12.36 × (Supplementary Table S3). After strict quality control, a total of 4,544,068 high-quality single-nucleotide polymorphisms (SNPs) were retained, with a missing genotype rate < 0.20 and a minor allele frequency (MAF) > 0.05. These SNPs were distributed across all 20 soybean chromosomes, corresponding to an average density of one SNP per 227 bp (Supplementary Table S4). Chromosome 12 harbored the fewest SNPs (133,763), whereas chromosome 18 contained the highest number (412,456), consistent with previous reports describing elevated SNP density on chromosome 18 (Fig. 2a)[33].
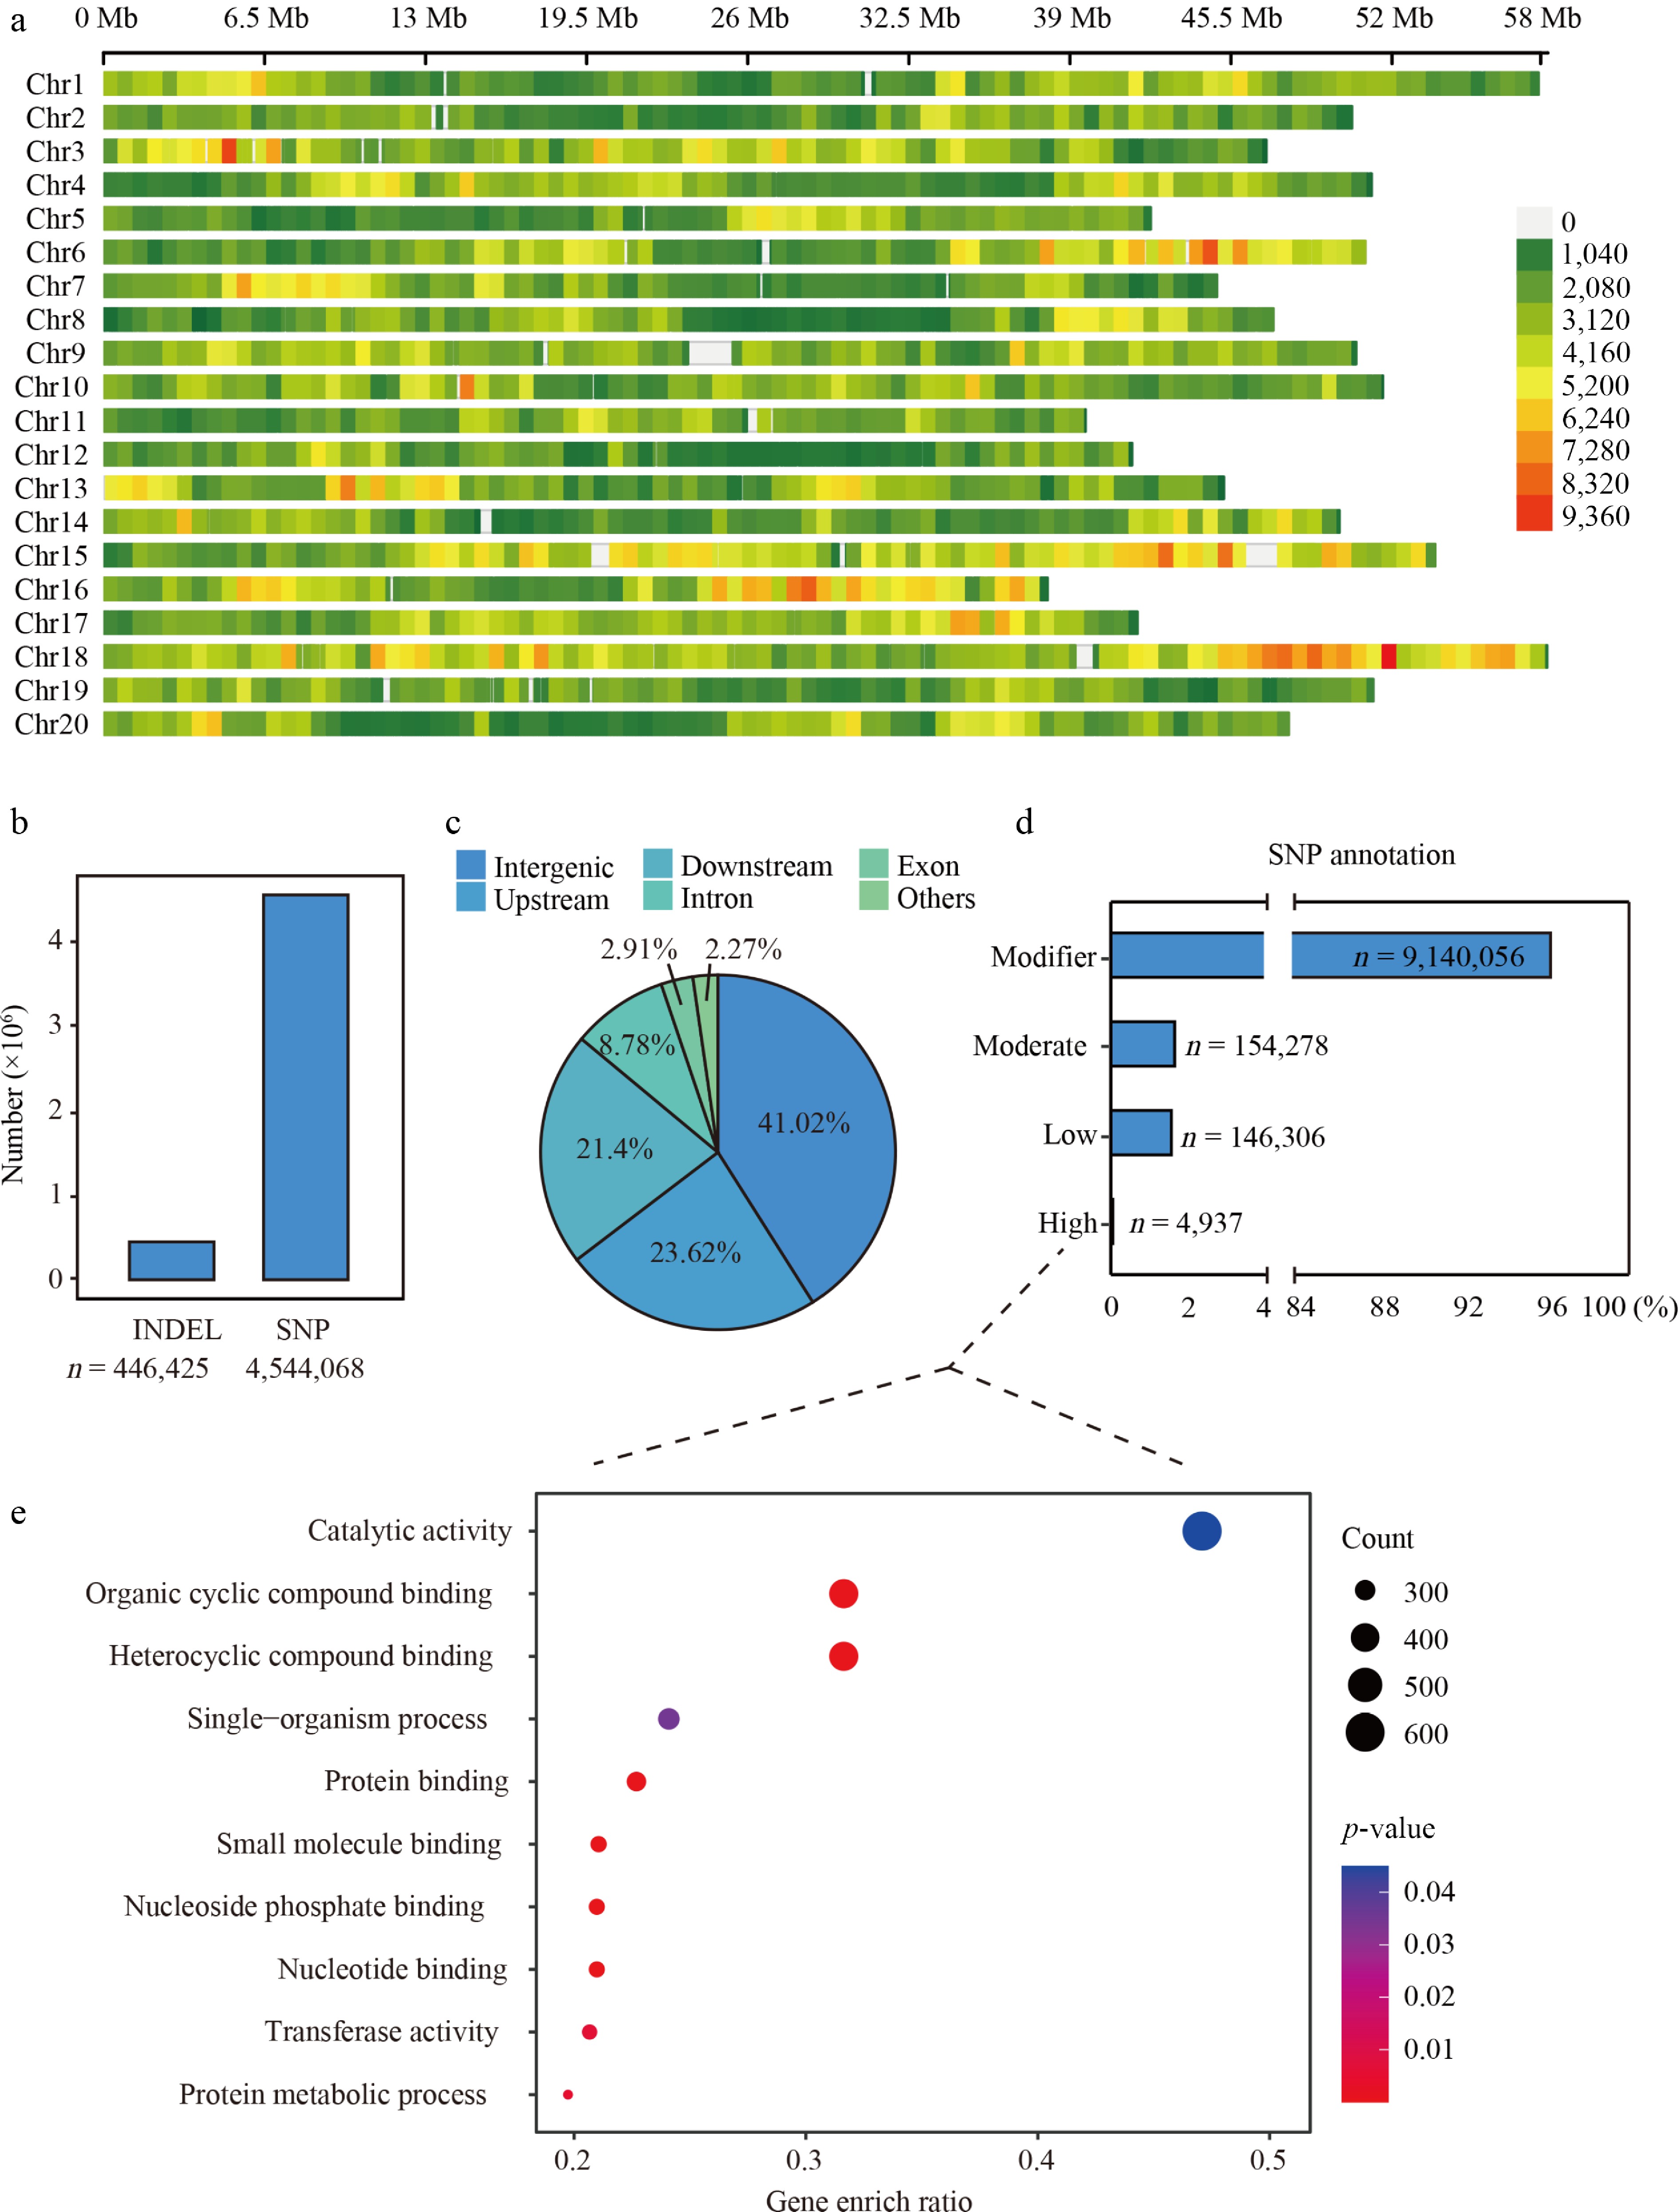
Figure 2.
The genomic differences in the transcribed region of Glycine max. (a) The distribution of SNPs on chromosomes of Glycine max. The heatmap shows the density of SNPs. (b) The total number of SNPs and INDELs of Glycine max. (c) Pie chart representing the distribution of SNPs by the region of the gene. Different color blocks represent different regions. (d) Annotation of SNPs based on their effects on protein functions. HIGH: variants likely to have a significant disruptive impact on the protein, such as causing protein truncation, loss of function, or triggering nonsense-mediated decay. Moderate: variants that may moderately affect protein function without complete disruption. Low: variants presumed to have little to no effect on protein function or behavior. Modifier: Variants that are typically non-coding or affect non-coding regions, where the impact on protein function is unclear or predicted to be minimal. (e) GO terms for genes that have high-impact SNPs affecting protein function.
In addition to SNPs, a total of 446,425 insertion-deletion (InDel) variants were identified (Fig. 2b). Functional annotation revealed that most SNPs were located in intergenic regions (41.02%), followed by upstream (23.62%), downstream (21.40%), and intronic regions (8.78%) (Fig. 2c). To evaluate the potential functional consequences of these variants, all polymorphisms were annotated. The majority of variants were classified as modifiers (96.77%, n = 9,140,056), indicating noncoding variants or variants with predicted minimal or uncertain effects on gene function (Fig. 2d). In contrast, only a small proportion of variants (0.23%) were categorized as high-impact variants, which are predicted to severely affect protein function through mechanisms such as premature stop codons, loss of start codons, or frameshift mutations (Fig. 2d; Supplementary Table S5). Gene Ontology (GO) enrichment analysis of genes harboring high-impact variants revealed significant enrichment in functional categories related to catalytic activity and cyclic compound binding, including heterocyclic and organic cyclic compound binding (Fig. 2e; Supplementary Table S6). Additional enrichment was observed for processes associated with protein binding, nucleotide binding, and other biosynthesis-related functions (Fig. 2e), suggesting that these high-impact variants may contribute to functional diversification within the Zhejiang soybean germplasm.
Population structure analysis of soybean accessions from Zhejiang Province and other regions
-
Soybean cultivars originating from different geographical regions are shaped by distinct environmental conditions and selection pressures. To place the Zhejiang soybean germplasm in a broader genomic context, we integrated 295 accessions from Zhejiang Province with 678 publicly available soybean accessions from other regions of China, yielding a total of 973 accessions for population genetic analyses[34,35]. The comparison panel included 184 accessions from North China (HB), 116 from Eastern China (HD), 161 from Southwest China (XN), and 217 from South China (HN), all genotyped using the same analytical pipeline (Supplementary Table S7). Phylogenetic analysis and model-based population structure inference consistently partitioned the accessions into five distinct clusters that largely corresponded to their geographical origins (Fig. 3a). These patterns reflect both natural and artificial selection acting on regional soybean landraces. Genetic differentiation between the Zhejiang accessions and those from other regions was further evaluated using the fixation index (FST). The Zhejiang accessions exhibited the highest differentiation compared to the HB region (FST = 0.07), whereas the lowest differentiation was observed between Zhejiang and HN accessions (FST = 0.02) (Supplementary Fig. S1a).
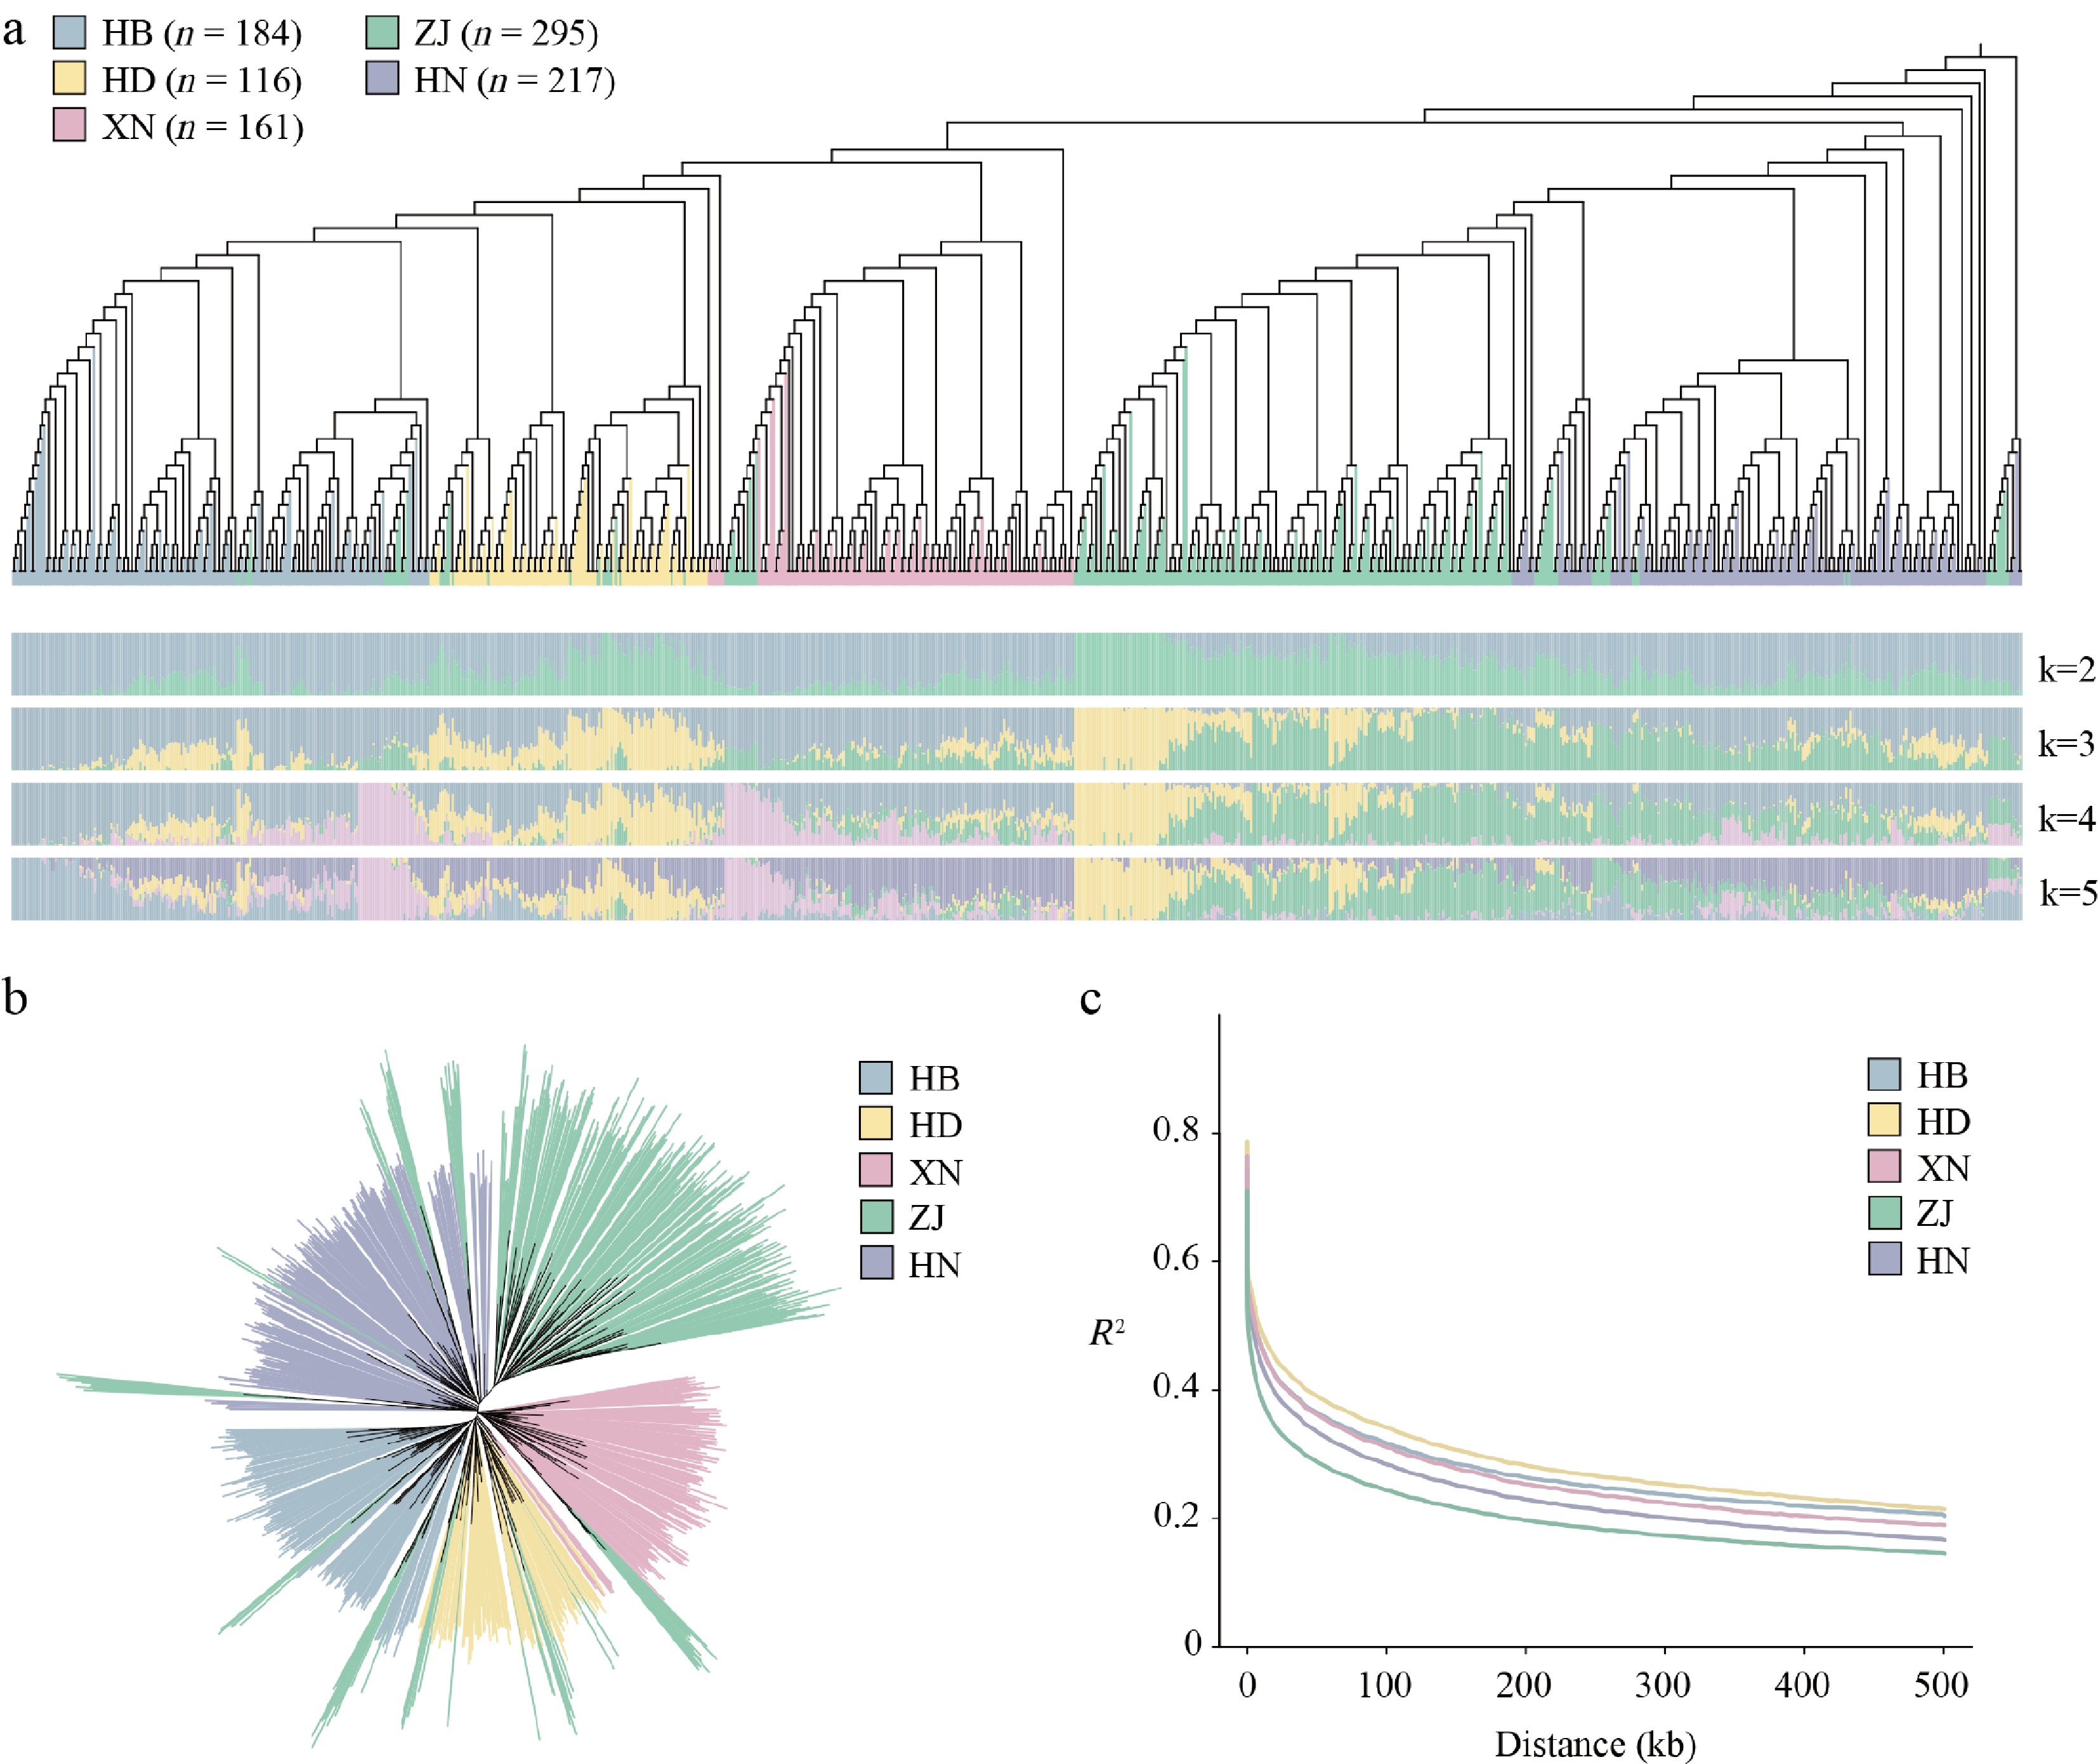
Figure 3.
Phylogenomic relationships, population structure, and genomic diversity of 973 Glycine max accessions. (a) Phylogenetic tree and population structure of Glycine max accessions, including those from Zhejiang Province and surrounding regions. (b) Classification and differences of accessions from Zhejiang Province and surrounding regions. (c) LD decay of the five subgroups showing diversity in accessions from Zhejiang Province.
Nucleotide diversity (π) analysis revealed that the Zhejiang accessions possessed a higher level of genetic diversity (πZJ = 1.39 × 10⁻³) compared with accessions from other regions, including HB (πHB = 1.19 × 10⁻³), HD (πHD = 1.07 × 10⁻³), XN (πXN = 1.14 × 10⁻³), and HN (πHN = 1.21 × 10⁻³) (Supplementary Fig. S1b). Linkage disequilibrium (LD) decay was assessed using the pairwise correlation coefficient (r2). Among the regional populations, the HD population displayed relatively slow LD decay, whereas the Zhejiang population showed the most rapid LD decay, indicative of higher recombination rates and greater genetic diversity (Fig. 3c). Collectively, these results demonstrate that soybean accessions from Zhejiang Province form a genetically distinct group and harbor elevated genomic diversity relative to accessions from other regions of China.
Candidate gene loci associated with cotyledon color of soybean via GWAS
-
GWAS was conducted on 28 agronomic traits evaluated in 2022 and 2023. Under broadly comparable climatic conditions during the soybean growing seasons of the 2 years, the results for qualitative traits showed high reproducibility across years. The results for qualitative traits showed high reproducibility across the 2 years. Integrating GWAS with linkage disequilibrium (LD) analysis, we identified a total of 81 significant association signals corresponding to 422 candidate genes. Among the traits analyzed, flowering time exhibited the fewest signals (n = 4), all localized on chromosome 12, whereas cotyledon color showed the largest number of signals (n = 16), primarily distributed on chromosomes 1 and 11 (Supplementary Table S8).
The Stay Green (SGR) gene family is known to regulate chlorophyll degradation and leaf coloration in plants[36] and has been implicated in cotyledon color regulation in pea (Pisum sativum)[37,38]. In soybean, Song et al.[39] previously mapped two qualitative loci controlling cotyledon color, designated D1 and D2, using next-generation sequencing–based bulk segregant analysis (BSA). Consistent with these findings, our GWAS detected significant loci for cotyledon color on chromosomes 1 and 11, encompassing the known genes GmSGR, D1 (Glyma.01G214600), and D2 (Glyma.11G027400) (Fig. 4a). As reported previously[39], a 1-bp deletion (Chr1: 55,654,794) was identified within the D1 gene, resulting in a frameshift mutation (Fig. 4b). Haplotype analysis revealed that among accessions carrying this deletion, a majority displayed green cotyledons (63.6%, n = 28/44), whereas nearly all accessions without the deletion exhibited yellow cotyledons (98.7%, n = 226/229) (Fig. 4d). In addition, a SNP variant (Chr11: 1,968,618, p value = 9.13 × 10⁻⁶) in the promoter region of the D2 gene (from T to G) was identified (Fig. 4c). Haplotype analysis showed that all accessions with the reference allele displayed yellow cotyledons, whereas green cotyledons were observed only among accessions carrying the mutant allele (20.4%, n = 29) (Fig. 4e). Further haplotype analysis combining variation at both D1 and D2 demonstrated that accessions lacking mutations at either locus consistently exhibited yellow cotyledons. In contrast, green cotyledon color predominated among accessions harboring mutations at both loci (66.7%, n = 26) (Fig. 4f). In addition, tissue expression data obtained from the public soybean database showed that both D1 and D2 were highly expressed in cotyledons (Supplementary Fig. S2a). Together, these results confirm D1 and D2 as major determinants of cotyledon color variation in soybean and illustrate the additive effects of these loci on phenotypic expression.
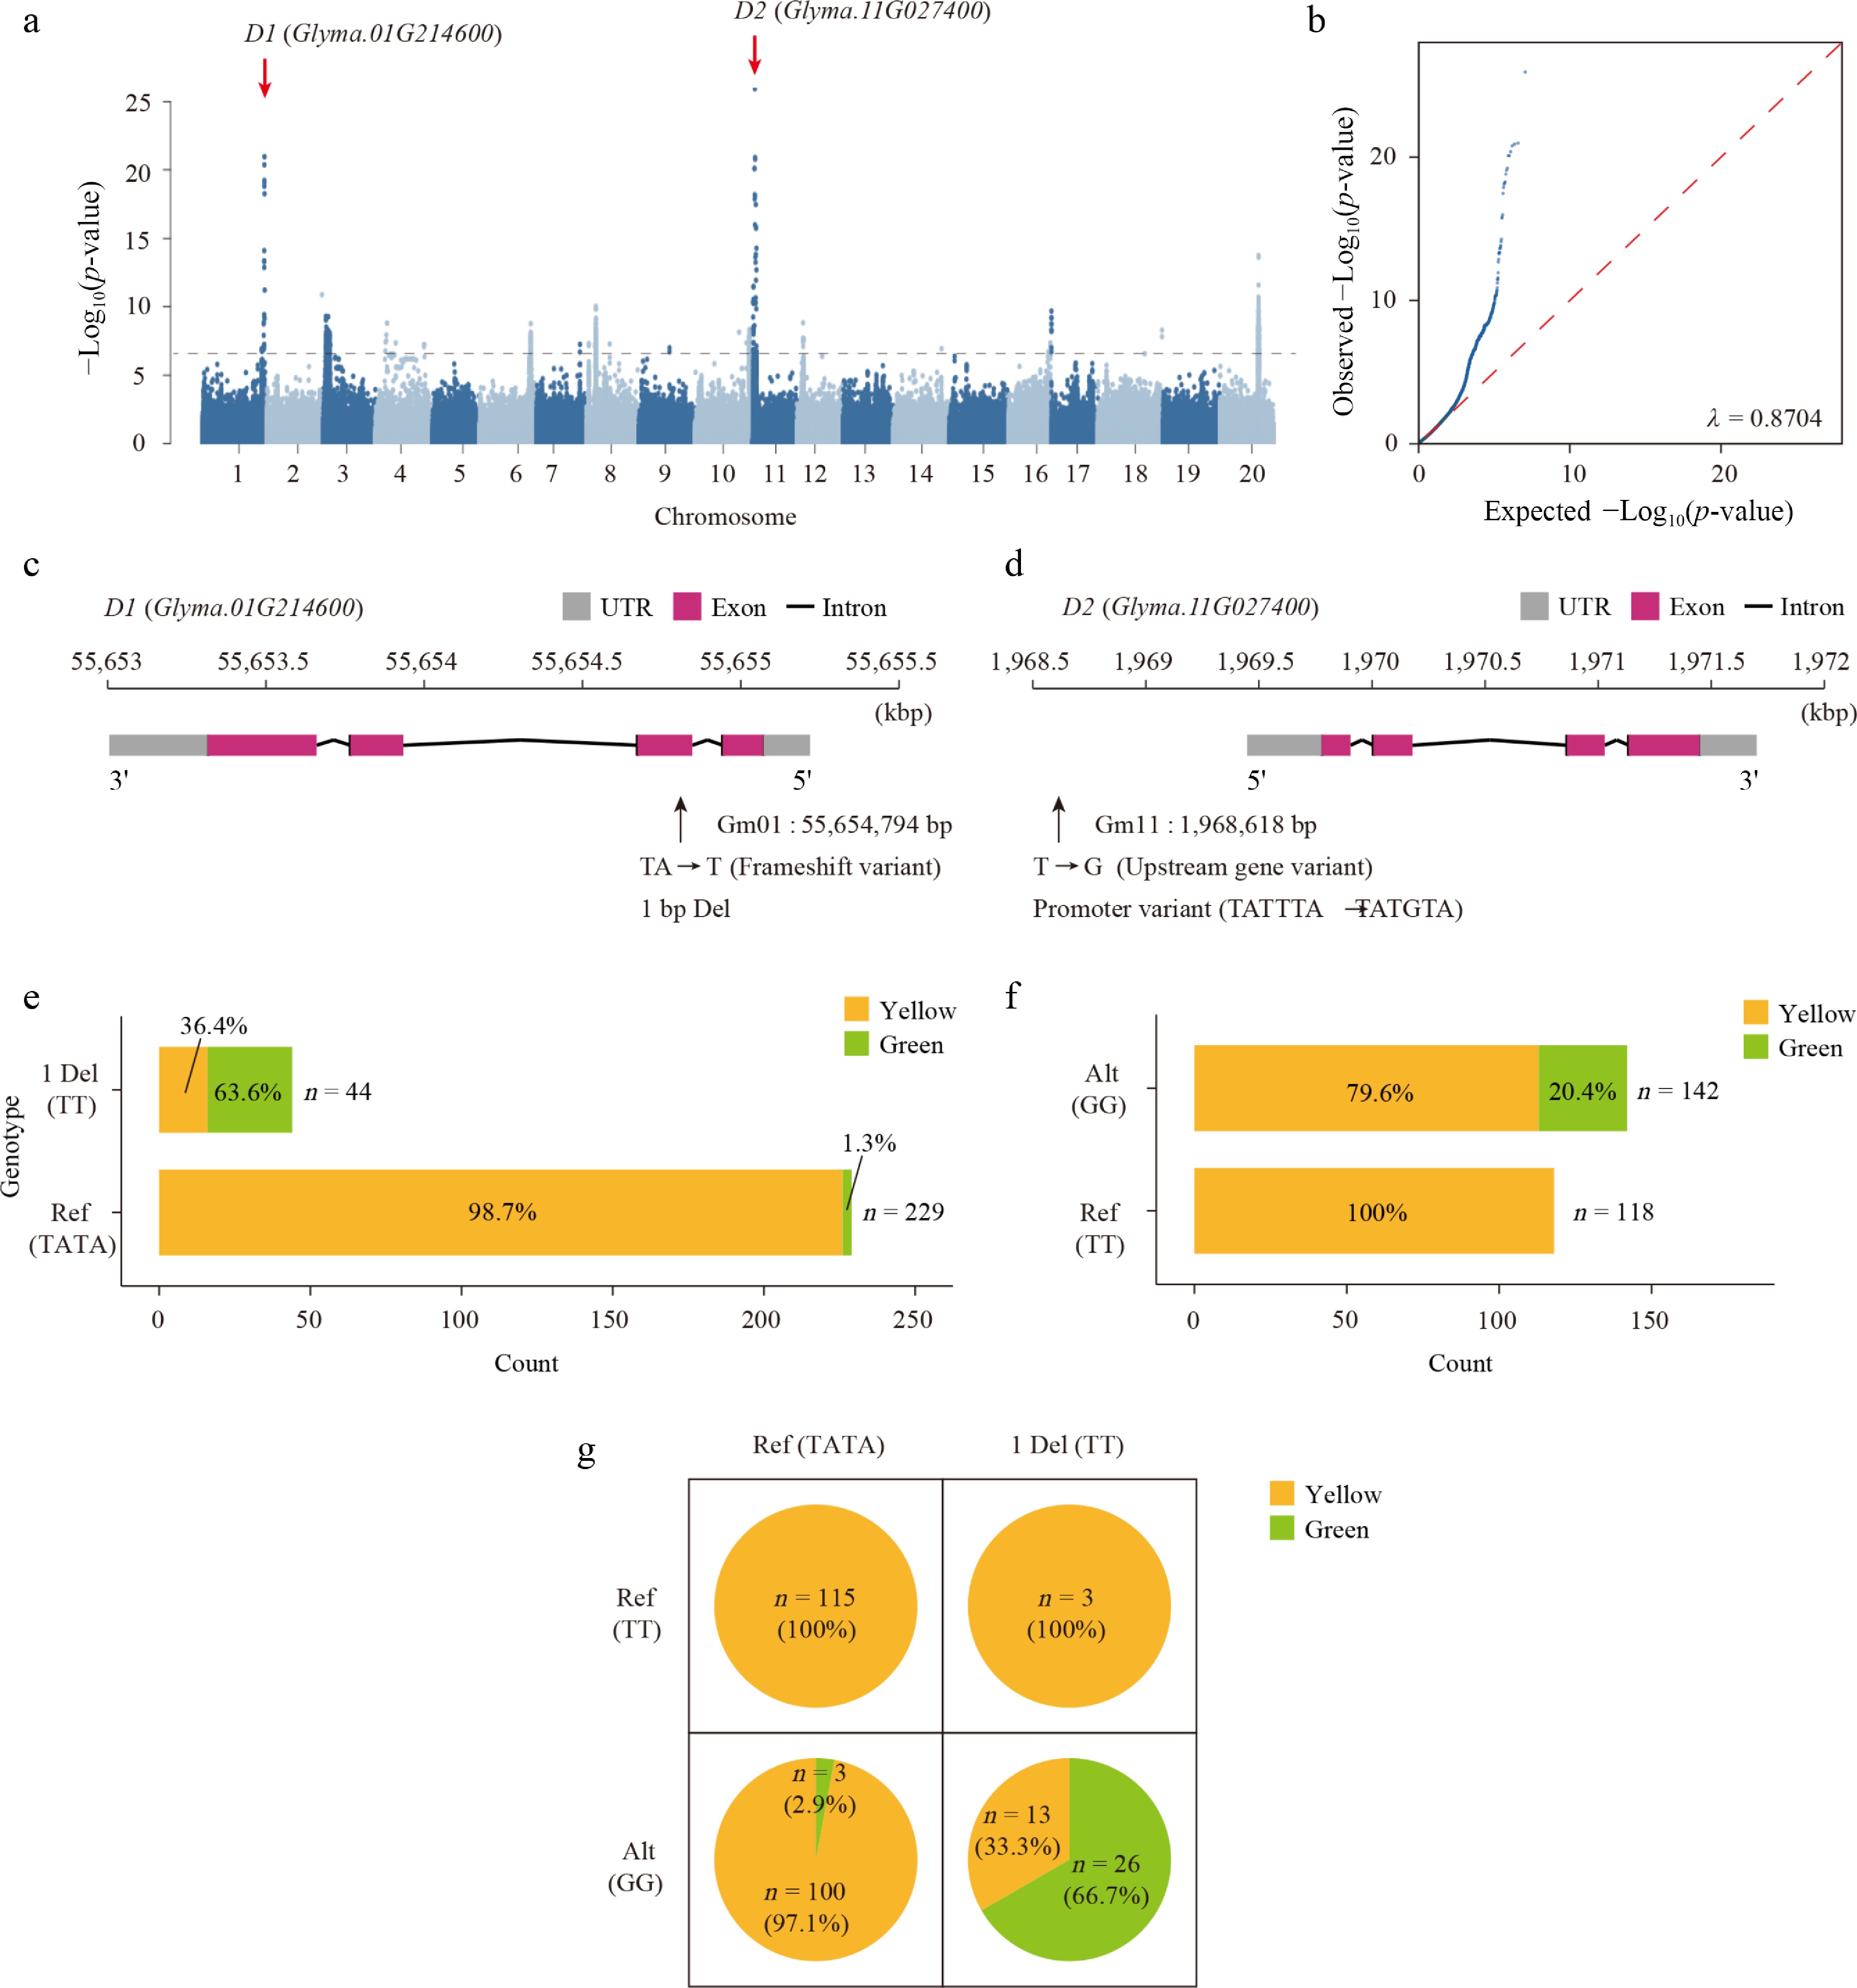
Figure 4.
GWAS analysis of cotyledon color. (a) Manhattan plot for the GWAS of cotyledon color. D1 (Glyma.01G214600) and D2 (Glyma.11G027400) are indicated as the key genes involved in the regulation of cotyledon color. (b) Quantile-quantile (QQ) plot of GWAS results for cotyledon color; λ denotes the genomic inflation factor. (c), (d) Gene structure and mutation information of D1 and D2 genes. Candidate functional variation is indicated by a black arrow. (e), (f) Histogram plots showing the distribution of cotyledon color in soybean accessions with different haplotypes. (g) Pie chart displaying the results of a joint analysis of the two haplotypes.
Candidate gene loci associated with flowering time of soybean via GWAS
-
For flowering time, nine candidate genes were encompassed within the associated LD blocks. Through SNP effect classification and gene function annotation, we identified a prominent locus on chromosome 12 harboring the ATP synthase assembly factor 1 (GmATPAF1) gene (Glyma.12G114600) (Fig. 5a). A significant signal (Chr12: 11,377,692, p value = 7.60 × 10⁻¹³) on the first exon of Glyma.12G114600 (GmATPAF1) was strongly associated with soybean flowering time (Fig. 5b). This signal corresponds to a nonsynonymous substitution from guanine (G) to cytosine (C), resulting in an amino acid change from cysteine (Cys) to serine (Ser) (Fig. 5c). Haplotype analysis further demonstrated a clear phenotypic effect of this variant, with accessions carrying the mutant genotype (CC) exhibiting significantly shorter flowering times compared with those carrying the reference allele (Fig. 5d). Tissue expression data obtained from the public soybean database showed that GmATPAF1 was broadly expressed across multiple tissues, with detectable expression levels in all tissues analyzed (Supplementary Fig. S2c). Pan et al.[40] previously identified potential QTLs and candidate genes on soybean chromosome 12 associated with circadian rhythm (Glyma.12G07861, from 5,496,565 to 5,511,828) and regulation of flower development (Glyma.12G05250, from 3,499,371 to 3,503,151). However, these genes were physically distant from the GmATPAF1 locus identified in the present study. Moreover, other reported genetic variants influencing soybean flowering time are predominantly located on chromosomes other than chromosome 12[41], suggesting GmATPAF1 as a distinct candidate gene associated with flowering time variation in the Zhejiang soybean germplasm.
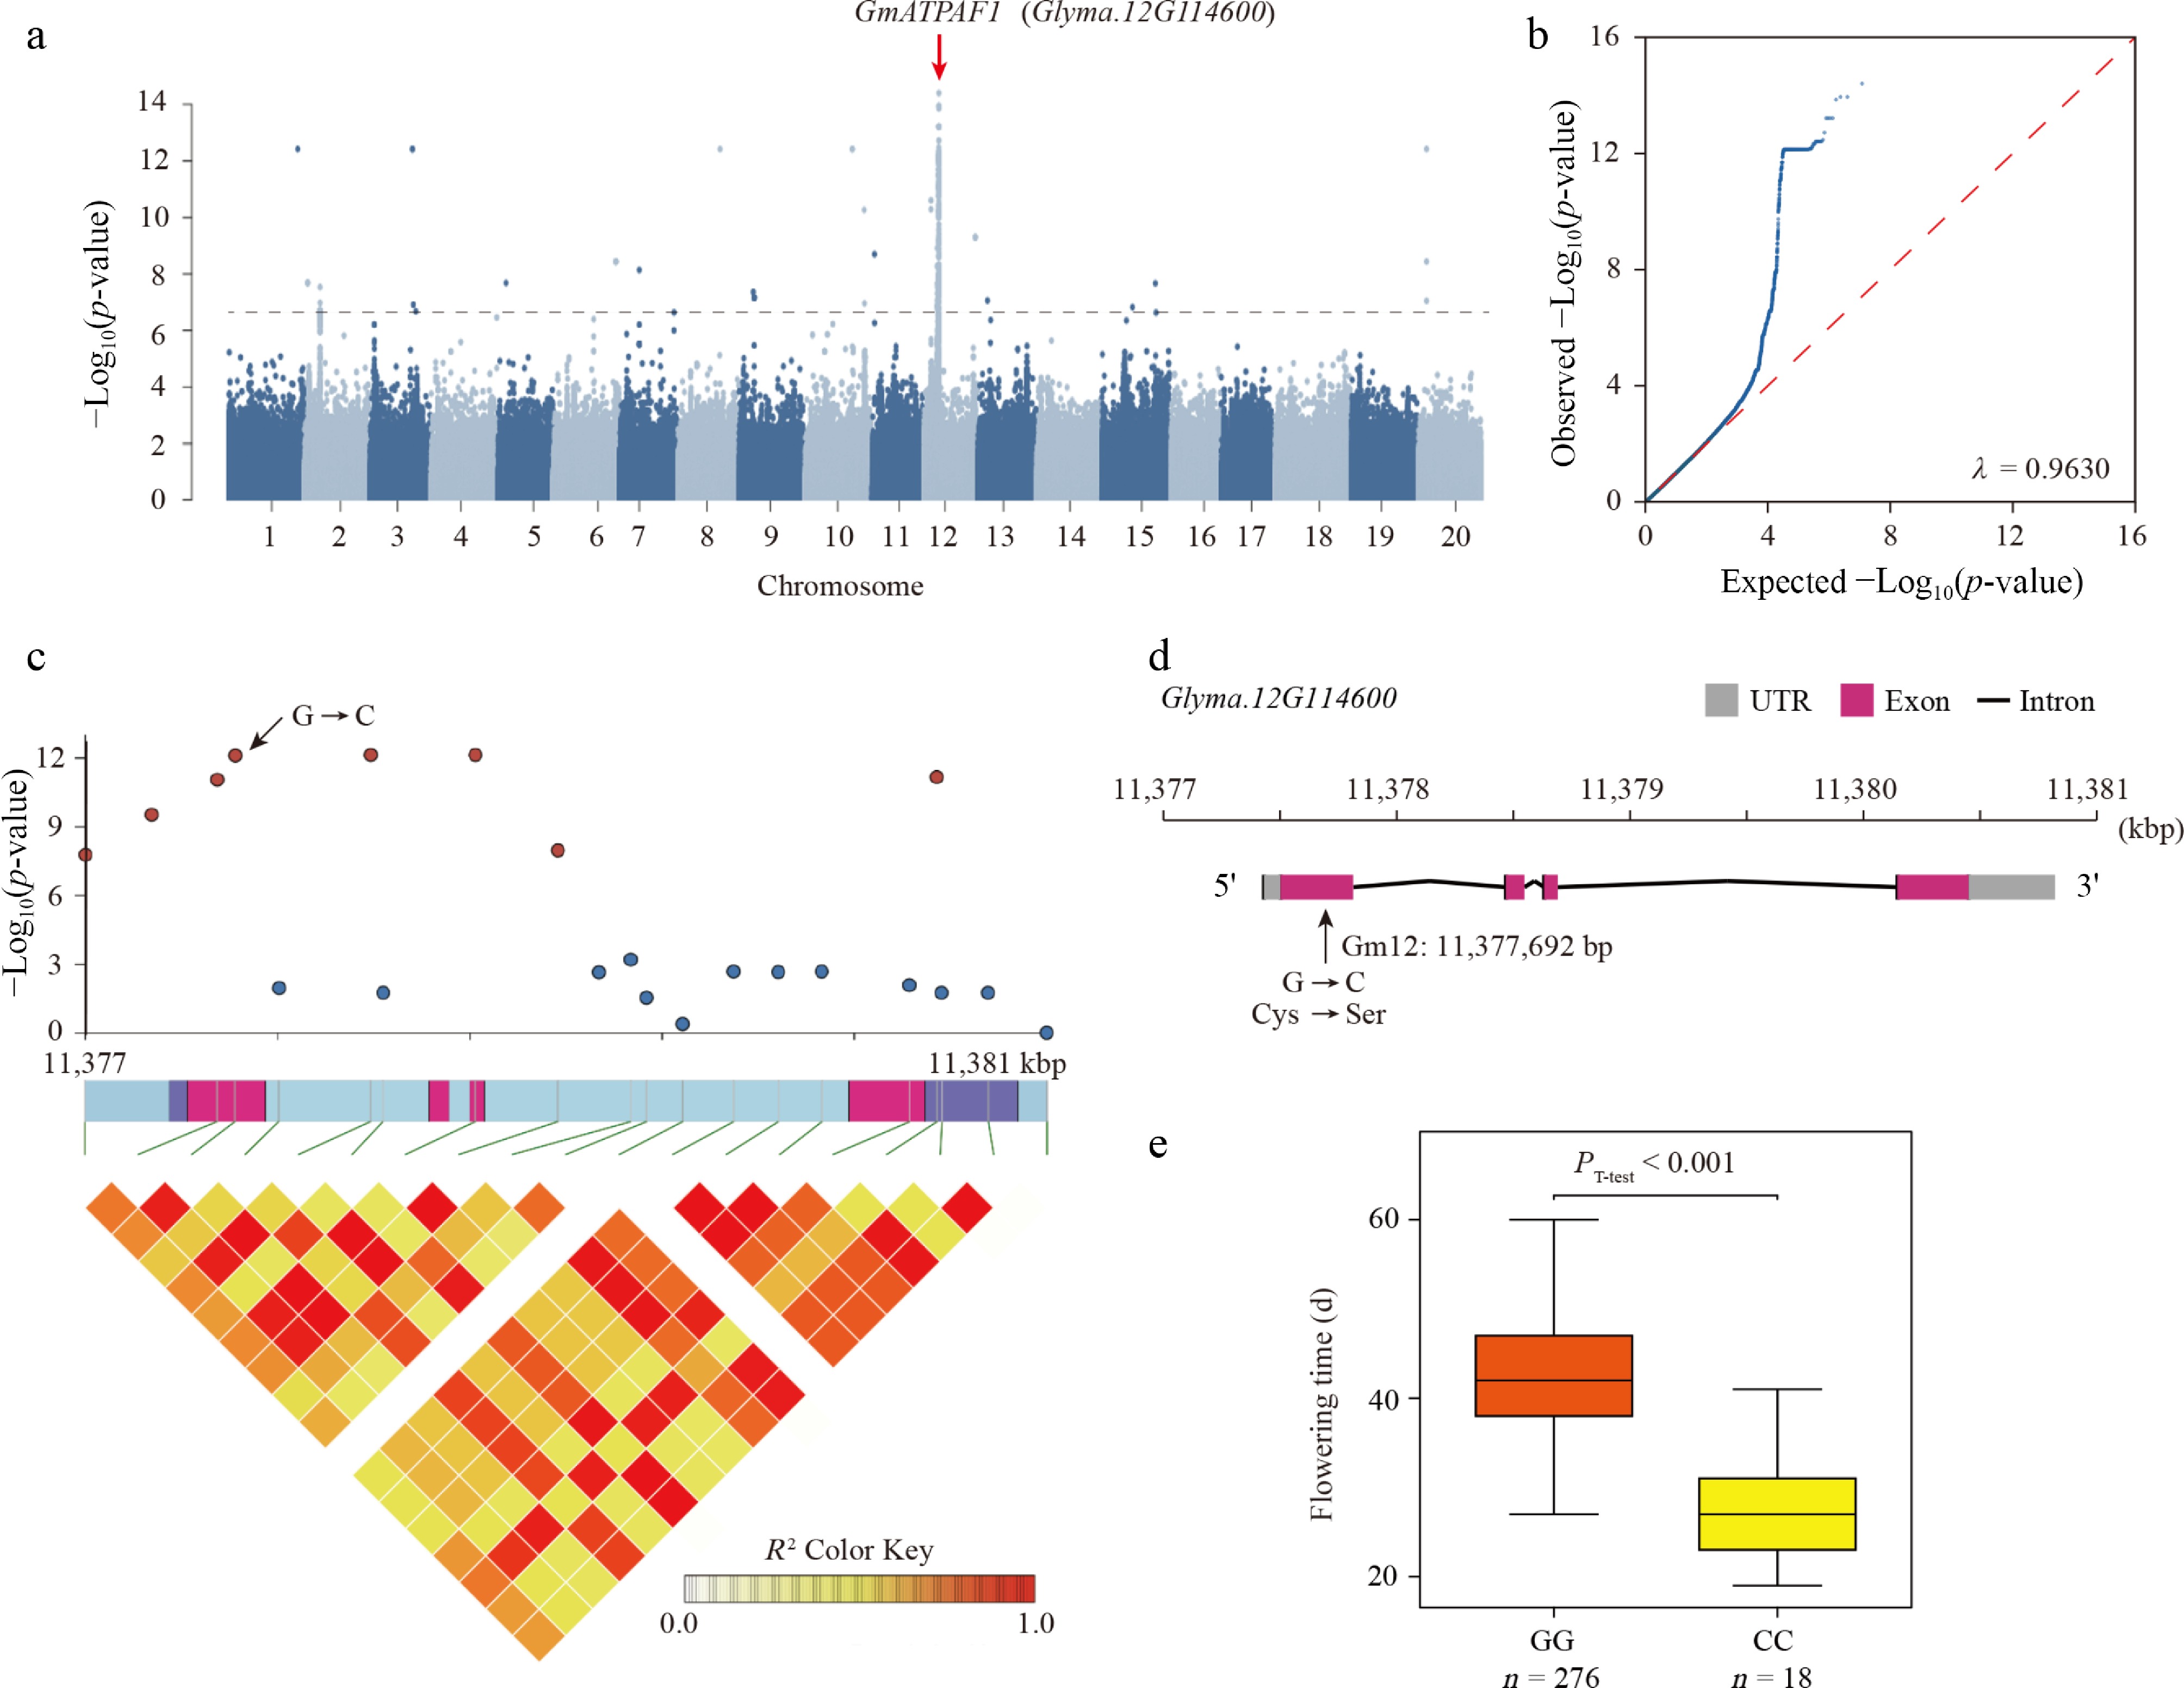
Figure 5.
GWAS analysis of flowering time. (a) Manhattan plot for the GWAS of flowering time (day). The ATP synthase assembly factor 1 (Glyma.12G114600) gene was identified as the potential causal gene influencing flowering time. (b) QQ plot of GWAS results for flowering time; λ denotes the genomic inflation factor. (c) Heatmap illustrating SNP markers in an LD block within the region of the GmATPAF1 gene. (d) Gene structure and mutation information for the GmATPAF1 gene. Candidate functional variation is indicated by a black arrow. (e) Box plot comparing flowering time across two haplotypes.
Candidate gene loci associated with salt stress tolerance and seed coat bloom of soybean via GWAS
-
Leucine-rich repeat (LRR) proteins play important roles in signal perception and the activation of defense responses in plants[42]. LRR receptor-like kinases (LRR-RLKs) have been reported to participate in salt stress responses in rice[43], maize[44], and soybean[45]. In this study, gene function annotation identified GmLRR1 (Glyma.15G246100) on chromosome 15 as a candidate gene associated with salt stress tolerance (Fig. 6a). Two closely linked SNPs (Chr15: 48,892,780, p-value = 5.18 × 10⁻⁶; Chr15: 48,892,786, p-value = 1.52 × 10⁻⁶) located in the first exon of GmLRR1, were associated with plant height under salt stress (Fig. 6b). These signals corresponded to nonsynonymous nucleotide mutations, from thymine (T) to cytosine (C) and adenine (A) to guanine (G), resulting in amino acid changes from cysteine (Cys) to serine (Ser) (Fig. 6c). The two SNPs were in strong linkage disequilibrium, and additional SNPs were observed in accessions carrying single mutations. Haplotype analysis revealed significant differences in relative plant height between the two major haplotypes under salt stress conditions (Fig. 6d).
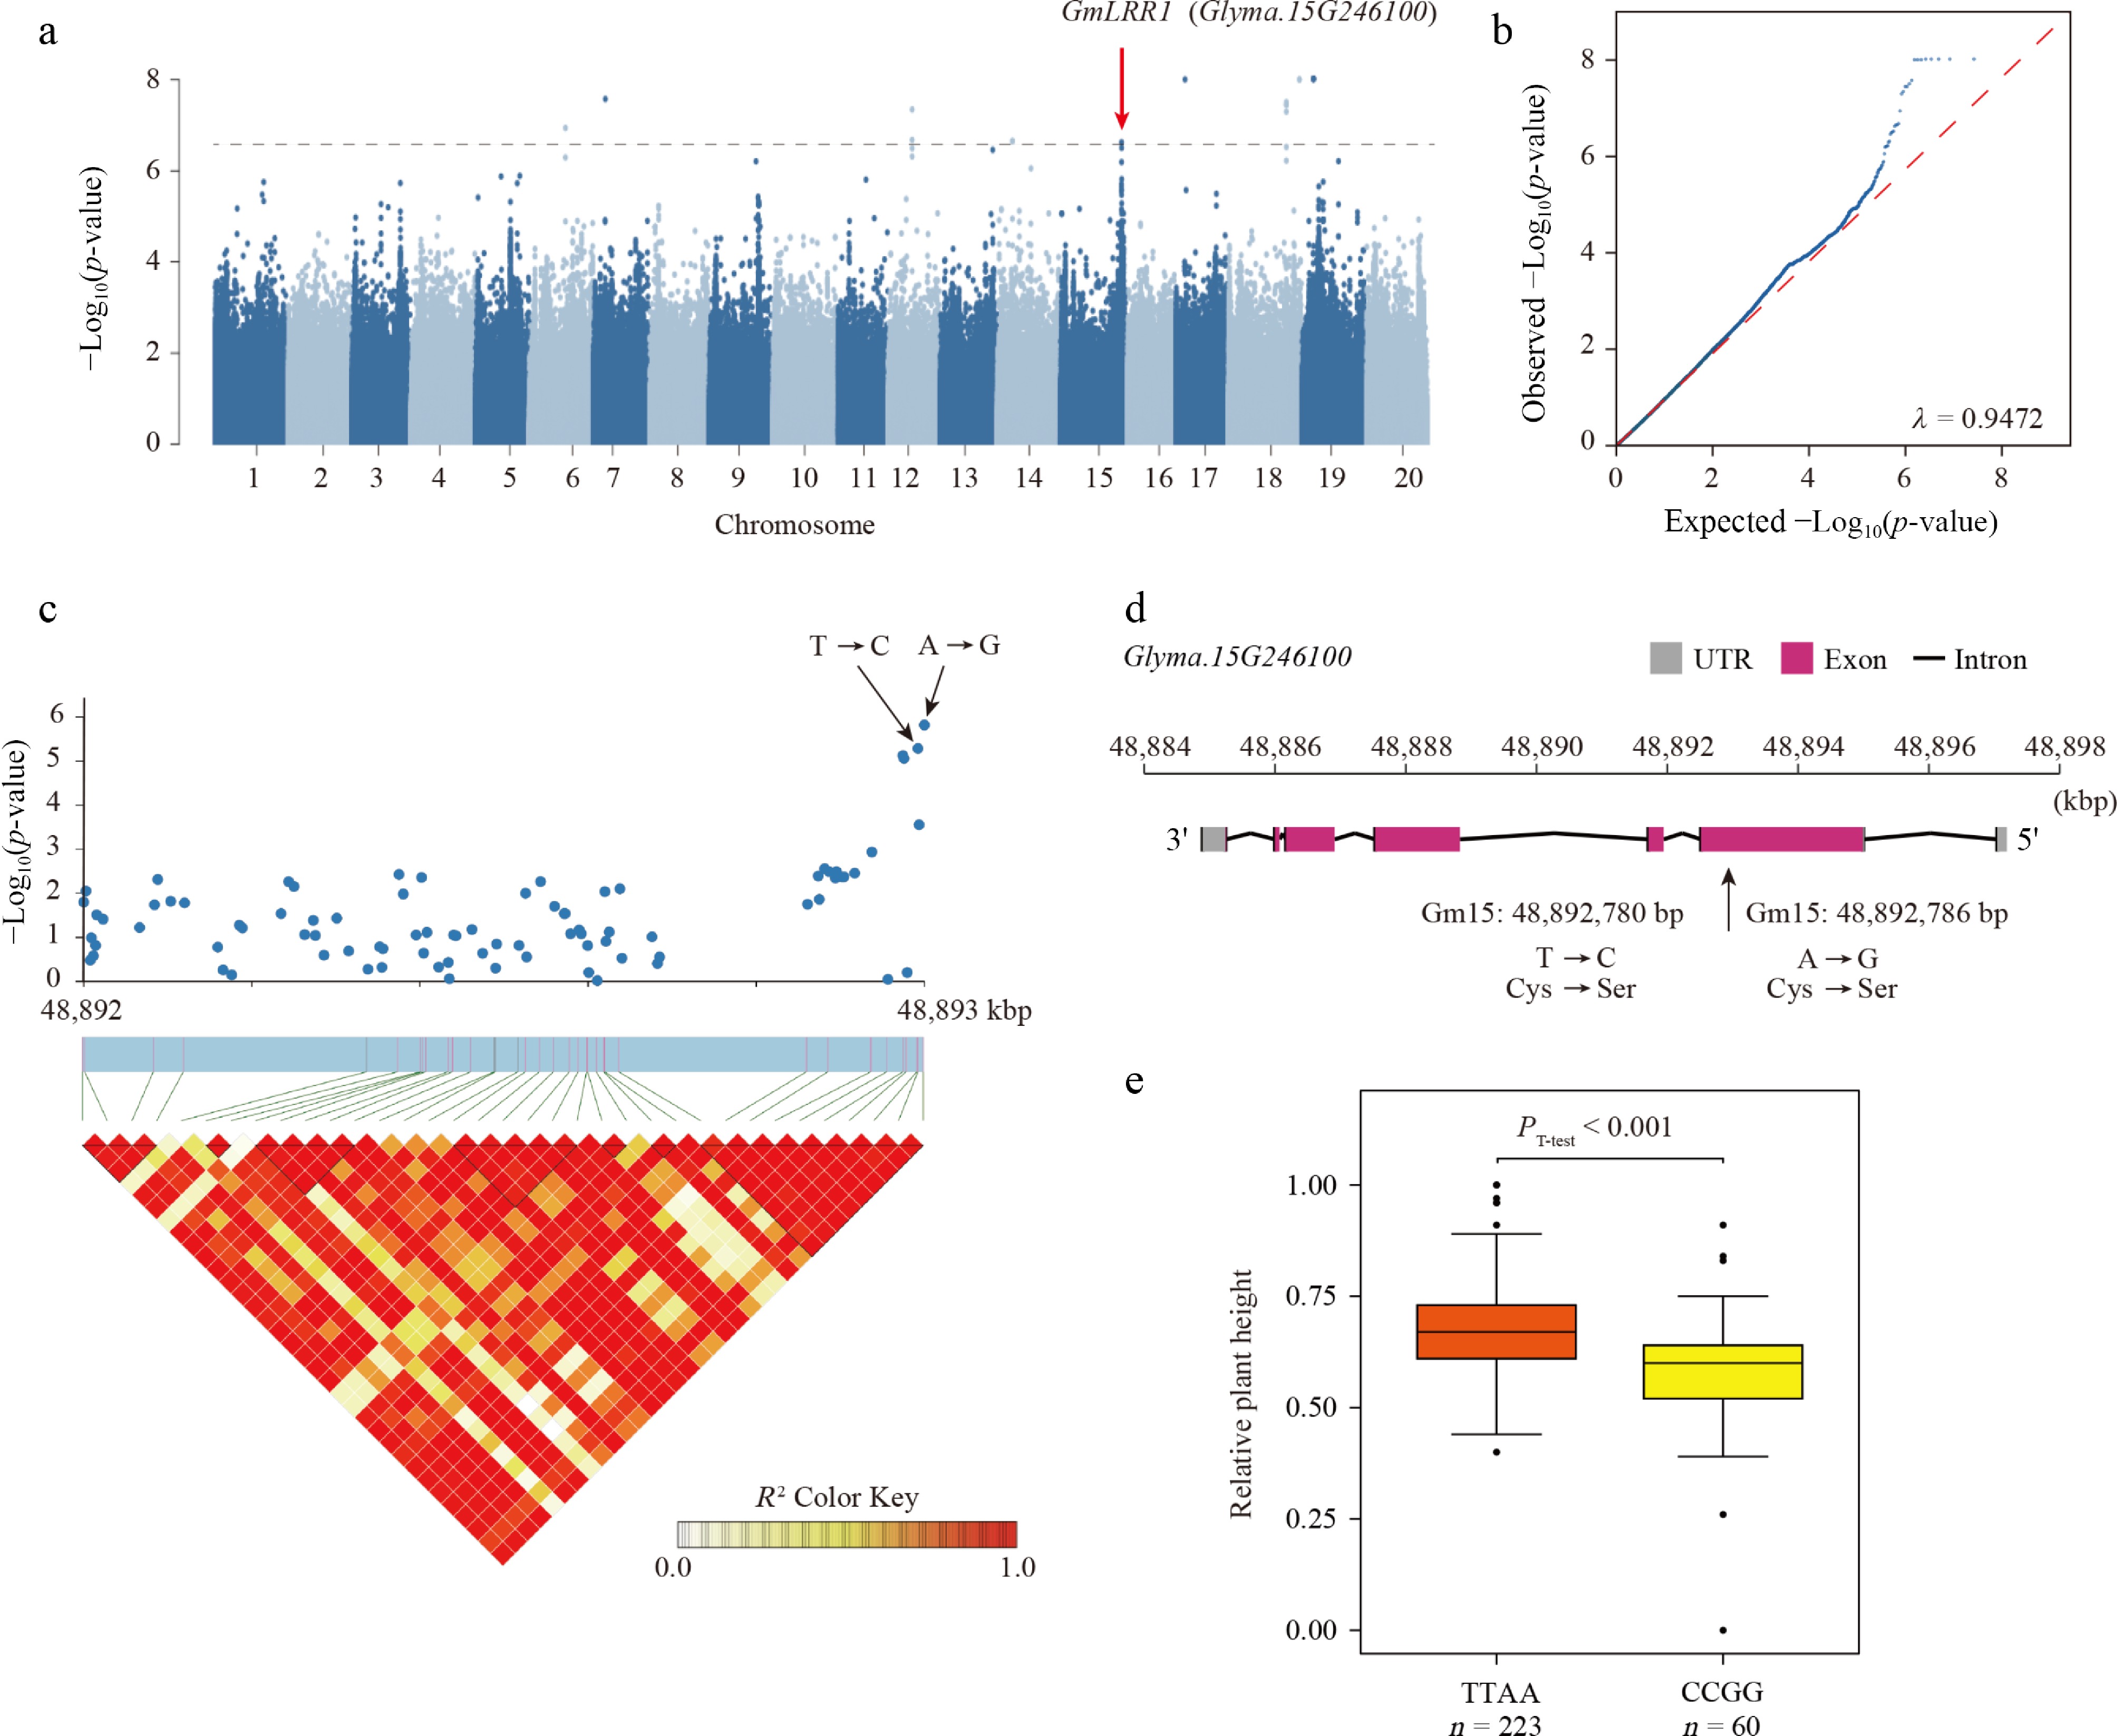
Figure 6.
GWAS analysis of salt tolerance. (a) Manhattan plot for the GWAS of relative plant height under salt stress. The LRR1 gene (Glyma.15G246100) was identified as the potential causal gene. (b) QQ plot of GWAS results for relative plant height under salt stress; λ denotes the genomic inflation factor. (c) Heatmap showing SNP markers in an LD block within the region of the GmLRR1 gene. (d) Gene structure and mutation information of the GmLRR1 gene. Candidate functional variation is indicated by a black arrow. (e) Box plot showing the distribution of salt tolerance across two haplotypes.
In addition to salt-stress-related traits, we further investigated the genetic basis of seed coat bloom. Zhang et al.[46] previously discovered that the Bloom1 (B1) gene on chromosome 13, which encodes a transmembrane transporter-like protein involved in the biosynthesis of bloom in the pod endocarp, regulates seed shininess and high oil content in soybean. In our study, a heat shock protein 90 (GmHSP90) gene located on chromosome 8 was identified through GWAS as being significantly associated with seed coat bloom (Supplementary Fig. S3a). A significant signal (Chr8: 8,585,121, p-value = 2.80 × 10⁻¹³) was detected in the sixth exon of GmHSP90, strongly associating it with the presence of seed coat bloom (Supplementary Fig. S3c). This signal corresponded to a nonsynonymous nucleotide mutation from adenine (A) to thymine (T), causing an amino acid change from leucine (Leu) to Glutamine (Gln) (Supplementary Fig. S3d). Haplotype analysis indicated a significant increase in the proportion of seed coat bloom in the mutated haplotype (GG) (Supplementary Fig. S3e). Interestingly, a recent soybean genomic study[47] identified a major seed coat color-associated region on chromosome 8, with an LD block located near 8.37–8.50 Mb. This region is close to the GmHSP90-associated signal identified in our study, suggesting that this region of chromosome 8 may contain genetic variation related to seed coat-associated traits. Together, these results suggest GmLRR1 and GmHSP90 as promising candidate genes associated with salt stress tolerance and seed coat bloom, respectively, providing new insights into the genetic regulation of stress adaptation and seed traits in soybean.
-
Germplasm resources constitute the fundamental basis for innovation in agricultural science and technology and underpin the development of modern seed industries. However, during the breeding of modern cultivars, the pursuit of higher productivity has often resulted in the erosion of genetic diversity derived from landraces. This loss frequently includes valuable alleles conferring regional adaptation, particularly those associated with tolerance to specific environmental stresses.
Soybeans originated from wild progenitors in Southern China and subsequently spread to central and northern regions. Although wild soybeans are native to subtropical Asia, domestication predominantly occurred in the temperate regions of China[34]. Zhejiang Province, known for its historical significance in soybean cultivation, stands as a crucial production area for high-protein and vegetable soybeans. In this study, the 295 Zhejiang soybean accessions served as the core panel for phenotypic evaluation and GWAS, whereas the additional 678 publicly available accessions were incorporated to provide a broader genetic background for population genetic analysis. By analyzing these 973 accessions, we assessed the genetic diversity and regional characteristics of soybean germplasm in Zhejiang. Population structure analyses incorporating these accessions revealed substantial genetic diversity and clear differentiation between soybean populations from Zhejiang and those from surrounding regions. In particular, the analysis of nucleotide diversity (π) and population fixation index (FST) revealed clear genetic differentiation, providing deep insights into the genetic richness of Zhejiang's soybean populations. While these results provide important insights into the genetic landscape of regional soybean resources, further studies are needed to clarify how natural environmental conditions and long-term artificial selection have jointly shaped the unique characteristics of vegetable soybeans in this region. In addition, field validation across multiple locations would further support the assessment of environmental stability and breeding applicability of the association signals identified in this study.
Phenotypic diversity within germplasm populations directly reflects the extent of genetic variation present within a species. Soybean landraces, characterized by diverse genetic backgrounds, therefore represent invaluable resources for breeding programs aimed at trait improvement. Interestingly, our population structure analysis indicated that soybean groupings did not strictly correspond to geographical origin, suggesting that factors beyond geographic separation, such as historical germplasm exchange and human-mediated selection, have played important roles in shaping genetic diversity. The extensive phenotypic and genetic variation observed among soybean accessions from Zhejiang underscores the region's agricultural potential and adaptive capacity. Notably, the pronounced morphological diversity identified in this study likely reflects adaptation to the unique environmental conditions of Zhejiang and provides a valuable reservoir of alleles for improving stress tolerance, yield, and quality in future breeding efforts.
Gene mining of agronomic traits of soybeans in Zhejiang
-
Synthetic associations arising from genetic heterogeneity represent a major limitation of GWAS. To mitigate this issue, we employed a mixed linear model that accounts for both population structure and kinship, thereby substantially reducing false-positive associations relative to simpler models. Using this approach, we conducted GWAS on 28 agronomic traits in 295 soybean accessions from Zhejiang Province. The results revealed a rich and diverse genetic architecture underlying these traits, emphasizing the importance of conserving local soybean germplasm. In total, 81 significant association signals encompassing 422 genes were identified.
Identifying precise candidate genes responsible for agronomic traits is a significant challenge in genetic research. Among the identified genes, further analysis, including LD and haplotype analysis, led to the discovery of candidate genes involved in regulating soybean cotyledon color, flowering time, and stress tolerance. Notably, the SGR gene, previously linked to plant chlorophyll metabolism, was identified in soybean, along with its two homologous genes, D1 and D2. The presence of these genes in our study confirmed the reliability of our GWAS results. Furthermore, we identified a 1 bp deletion in the D1 gene, which had been previously reported. But for the D2 gene, the key variants were not known until this study. We hypothesized that the observed variations in the D2 gene may be due to an SNP variant in its promoter region, leading to subsequent differences in gene expression. Flowering time in soybean, a short-day plant, is regulated by multiple factors, including photoperiod, temperature, and plant hormone signaling[48]. In this study, GmATPAF1 was identified as a putative candidate gene associated with flowering time variation. However, further functional validation is required to confirm its potential role in flowering regulation. For salt stress tolerance, the GmLRR1 gene, an LRR family gene potentially involved in plant stress responses[44], was also identified. Nonsynonymous SNPs were detected within the coding region of GmLRR1, suggesting that these variants may affect the predicted protein sequence and potential protein function. However, whether these variants influence the transcriptional level, translational efficiency, or protein abundance of GmLRR1 remains unclear based on the present data. Therefore, further physiological measurements, such as ion accumulation, Na+/K+ ratio, electrolyte leakage, and electrical conductivity, together with expression and functional validation, will be required to more rigorously evaluate salt tolerance and confirm the potential role of GmLRR1 in salt-stress response. While the findings from this study are promising, preliminary functional validation of these genes is necessary to confirm their role in regulating these traits. Collectively, the genetic variants identified in this study provide valuable targets for soybean improvement, with potential applications in enhancing stress resistance, yield, and nutritional quality. The integration of genetic and phenotypic information into breeding programs is expected to accelerate the development of improved soybean cultivars and contribute to sustainable agricultural production.
Future plan
-
The expansion of vegetable soybean cultivation presents a significant opportunity to enhance Zhejiang's agricultural identity and economic development by tapping into growing consumer demand for fresh, locally sourced produce. GWAS identified association signals for key agronomic traits, which provide potential targets for functional validation, marker development, and future breeding applications. After confirmation in independent populations and multi-location trials, the associated SNPs may be used in marker-assisted selection or genomic breeding. Future research should prioritize optimizing cultivation practices to improve both yield and quality while maintaining sustainability and ecological balance. Additionally, integrating advanced breeding techniques, such as genomic selection and CRISPR-Cas9 technology, holds promise for accelerating the development of high-quality vegetable soybean varieties. In conclusion, focused research and development (R&D) on vegetable soybean production in Zhejiang can boost regional sustainability and provide a competitive advantage, showcasing the unique agricultural landscape of the region. Through targeted improvements in the genetic foundation and farming practices, the local soybean industry can evolve to meet consumer needs and market demands effectively.
-
In this study, we systematically characterized the phenotypic diversity and genomic variation of 295 soybean accessions from Zhejiang Province and integrated them with 678 accessions from other regions of China to provide a comprehensive view of population structure and genetic diversity. Genome-wide association analyses identified 81 significant loci associated with 28 agronomic traits. GmATPAF1 (Glyma.12G114600) was found to be associated with flowering time, while GmLRR1 (Glyma.15G246100) and GmHSP90 were implicated in salt stress tolerance and seed coat bloom, respectively. Overall, this study provides a high-resolution genomic and phenotypic resource for Zhejiang soybean germplasm and identifies candidate genes with potential applications in molecular breeding.
-
The authors confirm their contributions to the paper as follows: conceptualization, resources: Liu N; methodology: Shi W, Zhao T; investigation: Liu N, Zhang G, Feng Z, Bu Y, Wang B, Xu Y, Li Y; formal analysis, writing - original draft: Shi W; writing - review & editing: Liu N, Shi W, Zhao T; funding acquisition: Liu N, Gong Y; supervision: Gong Y. All authors reviewed the results and approved the final version of the manuscript.
-
The whole-genome sequencing of 295 soybean accessions has also been deposited at NCBI under the BioProject PRJNA1182549. Additional information is available upon reasonable request.
-
The authors declare that they have no conflict of interest.
-
accompanies this paper online at: https://doi.org/10.48130/seedbio-0026-0018.
- Supplementary Fig. S1 Genetic diversity and differentiation among soybean populations.
- Supplementary Fig. S2 Tissue-specific expression patterns of candidate genes.
- Supplementary Fig. S3 GWAS analysis of the seed coat bloom trait.
- Supplementary Table S1 Information of 295 soybean accessions analysed in this study.
- Supplementary Table S2 Summary statistic on the re-sequencing dataset of the 295 accessions selected in this study.
- Supplementary Table S3 A summary of the phenotypic records across the entire soybean diversity panel in this study.
- Supplementary Table S4 SNP variants summary of Glycine max.
- Supplementary Table S5 SNP variants of Glycine max in high level.
- Supplementary Table S6 GO annotation of high level effects related genes.
- Supplementary Table S7 Information of 678 soybean accessions from published data.
- Supplementary Table S8 Candidate genes and SNPs mined by GWAS and LD analysis.
- Copyright: © 2026 by the author(s). Published by Maximum Academic Press on behalf of Hainan Yazhou Bay Seed Laboratory. This article is an open access article distributed under Creative Commons Attribution License (CC BY 4.0), visit https://creativecommons.org/licenses/by/4.0/.
-
About this article
Cite this article
Shi W, Zhang G, Feng Z, Bu Y, Wang B, et al. 2026. Large-scale genomic analysis of 973 soybean accessions reveals the genetic architecture of agronomic traits in Zhejiang soybean landraces from China. Seed Biology 5: e022 doi: 10.48130/seedbio-0026-0018 

Large-scale genomic analysis of 973 soybean accessions reveals the genetic architecture of agronomic traits in Zhejiang soybean landraces from China
- Received: 03 April 2026
- Revised: 13 July 2026
- Accepted: 15 July 2026
- Published online: 27 August 2026
Abstract: Soybean (Glycine max [L.]) is a crucial agricultural crop that provides essential edible oil and protein and serves as a major component of animal feed. Zhejiang Province, with its long history of soybean cultivation, harbors rich and diverse soybean landrace germplasm in China. However, the genetic diversity and agronomic traits of soybean germplasm from Zhejiang have not been comprehensively characterized. In this study, we performed whole-genome sequencing of 295 soybean accessions collected from Zhejiang Province and integrated them with 678 publicly available accessions from diverse geographic regions, generating a panel of 973 accessions for population genetic analyses, which resolved the soybean germplasm into five distinct subgroups. A total of 28 agronomic traits were evaluated across a 2-year field evaluation, and a genome-wide association study was conducted using the 295 Zhejiang accessions. We identified 81 significant association signals across 11 traits, highlighting the complex genetic architecture underlying soybean agronomic performance. Notably, a locus on chromosome 12 (Chr12: 11,377,431–11,380,821) showed a strong association with flowering time, with GmATPAF1 proposed as a candidate gene. In addition, a locus on chromosome 15 (Chr15: 48,884,892–48,897,351) was associated with plant height under salt stress, implicating GmLRR1 as a gene involved in stress response. Overall, these results provide new insights into the genetic diversity, population structure, and genetic basis of key agronomic traits in Zhejiang soybean landraces and establish a valuable genomic resource for future soybean breeding and genetic improvement.
-
Key words:
- Soybean /
- Agronomic traits /
- GWAS /
- QTL