-
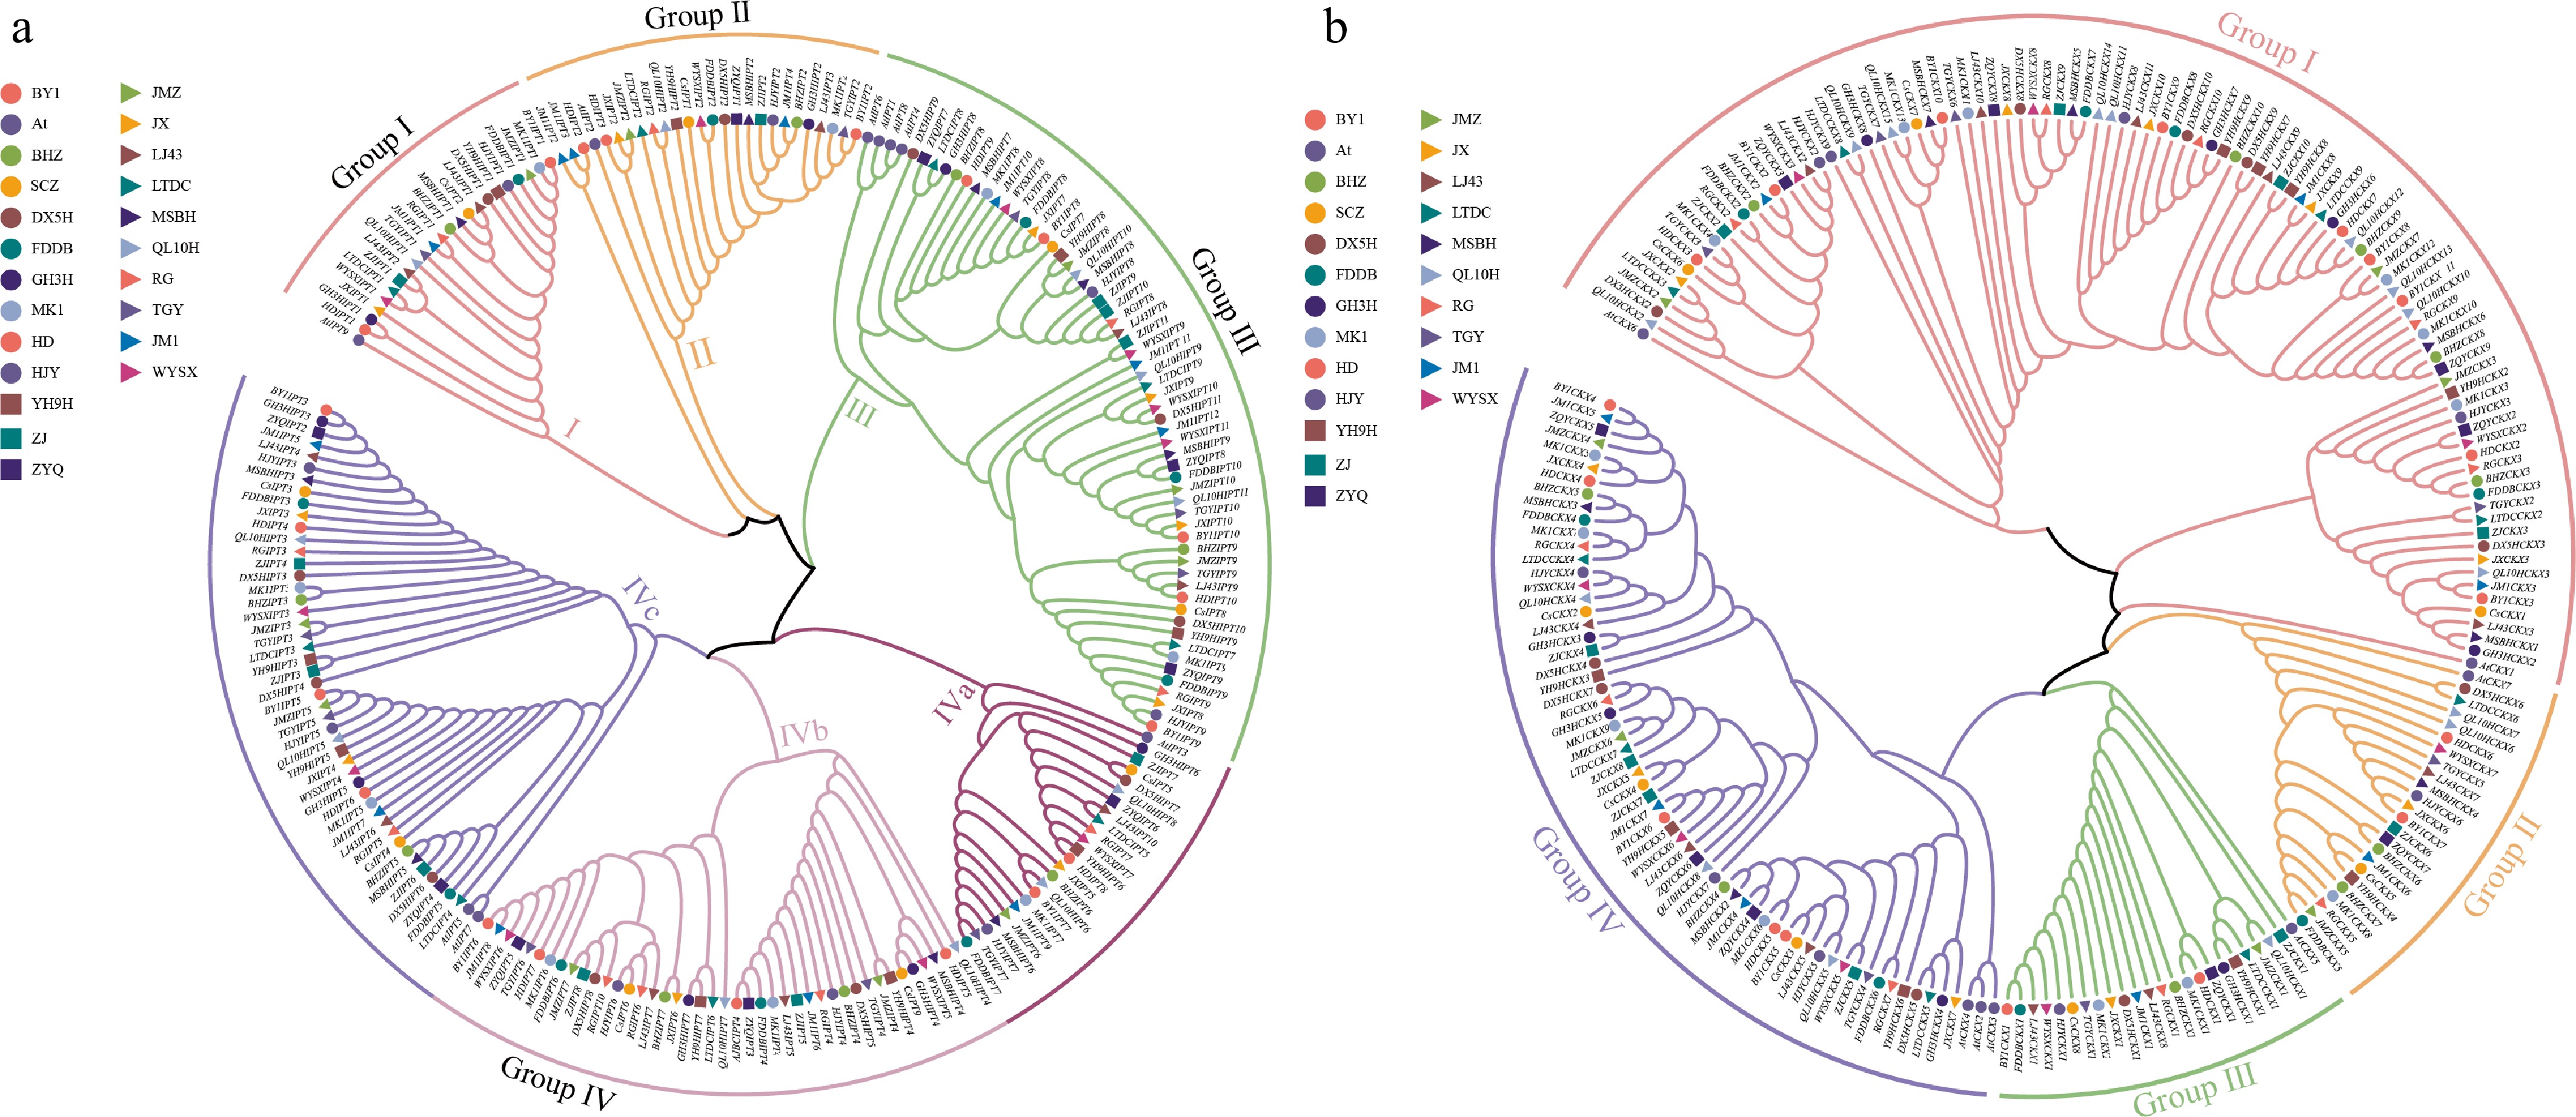
Figure 1.
Phylogenetic relationship of IPT and CKX family genes from 22 tea cultivars. (a) Phylogenetic analysis of IPT family genes from 22 tea cultivars. (b) Phylogenetic analysis of CKX family genes from 22 tea cultivars. Different shapes in various colors are used to denote distinct species. Different colored arcs represent distinct groups. The unrooted maximum-likelihood trees were inferred using IQ-TREE with 1,000 bootstrap replicates and visualized using iTOL.
-
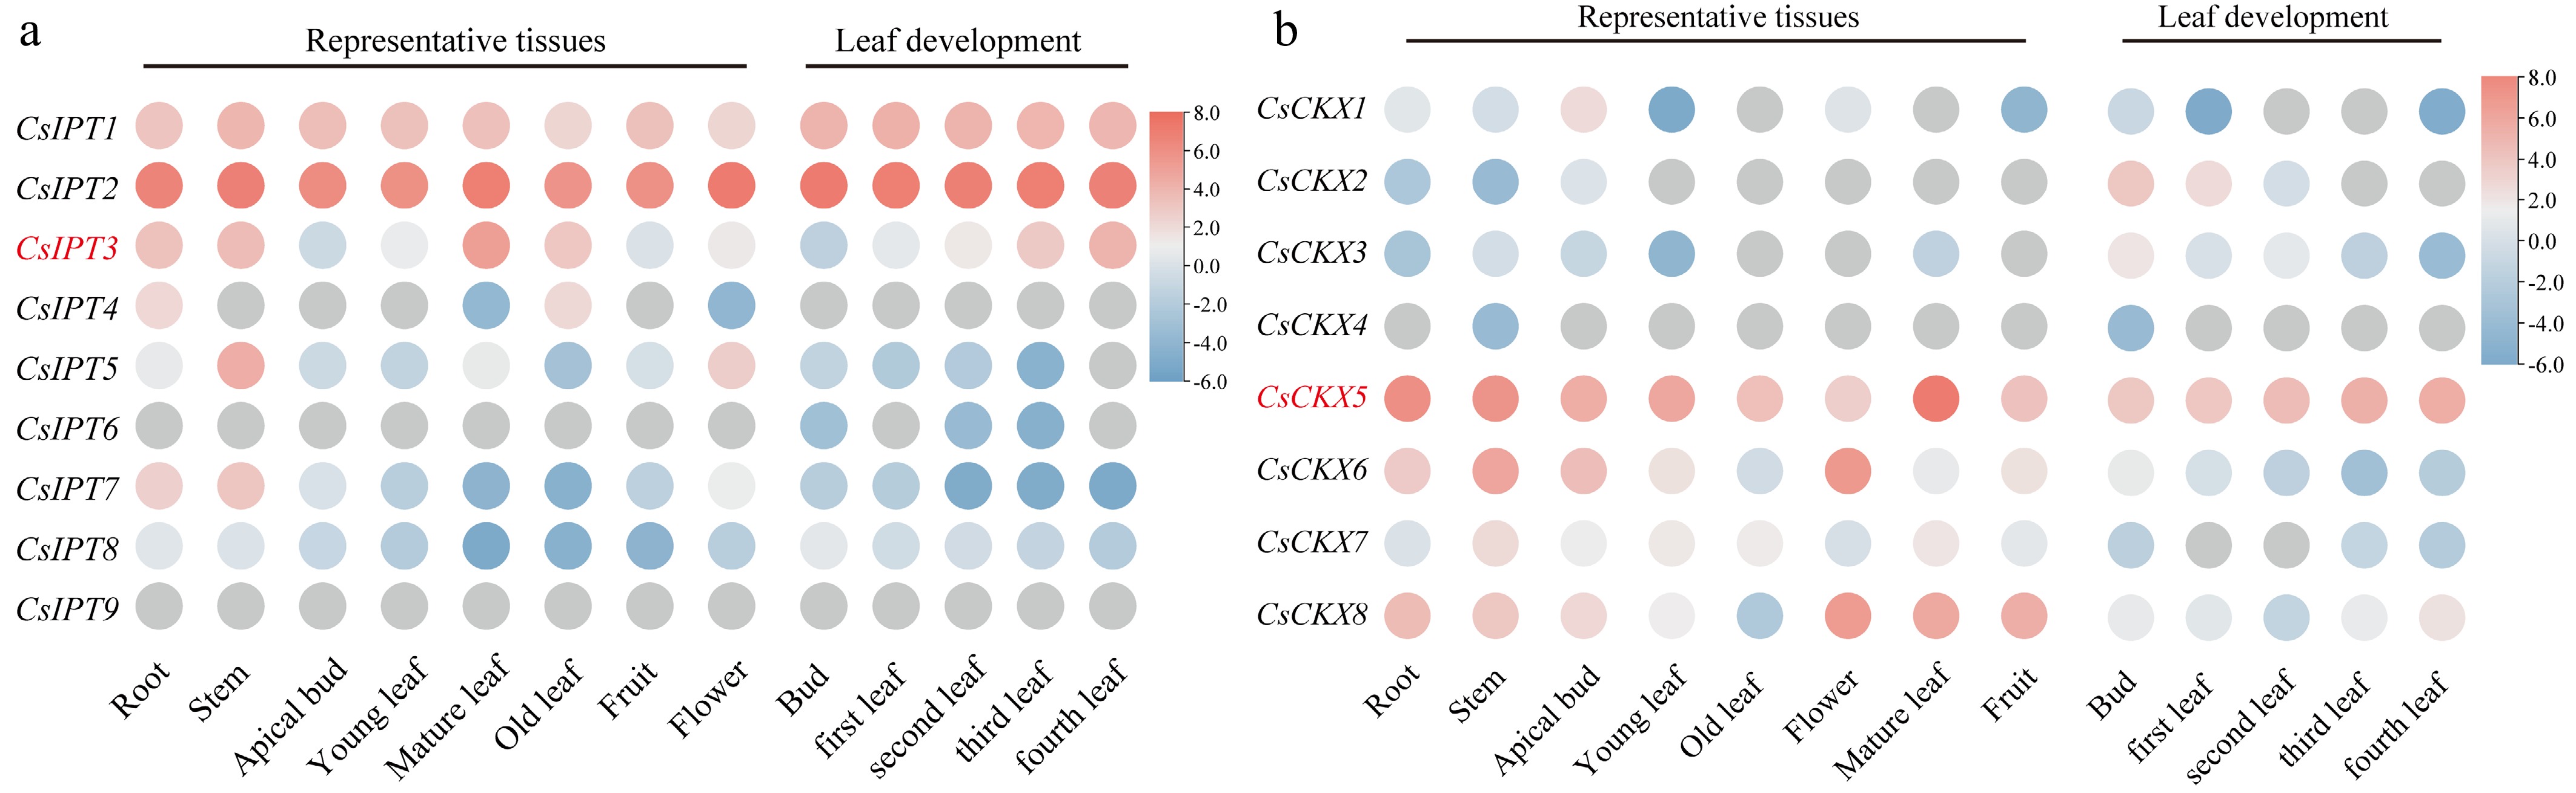
Figure 2.
Transcript levels of (a) CsIPTs, and (b) CsCKXs in various organs and different leaf stages of 'Shuchazao'. The color gradient denotes log2-converted FPKM values, and blue and red colors respectively represent low and high expression levels.
-
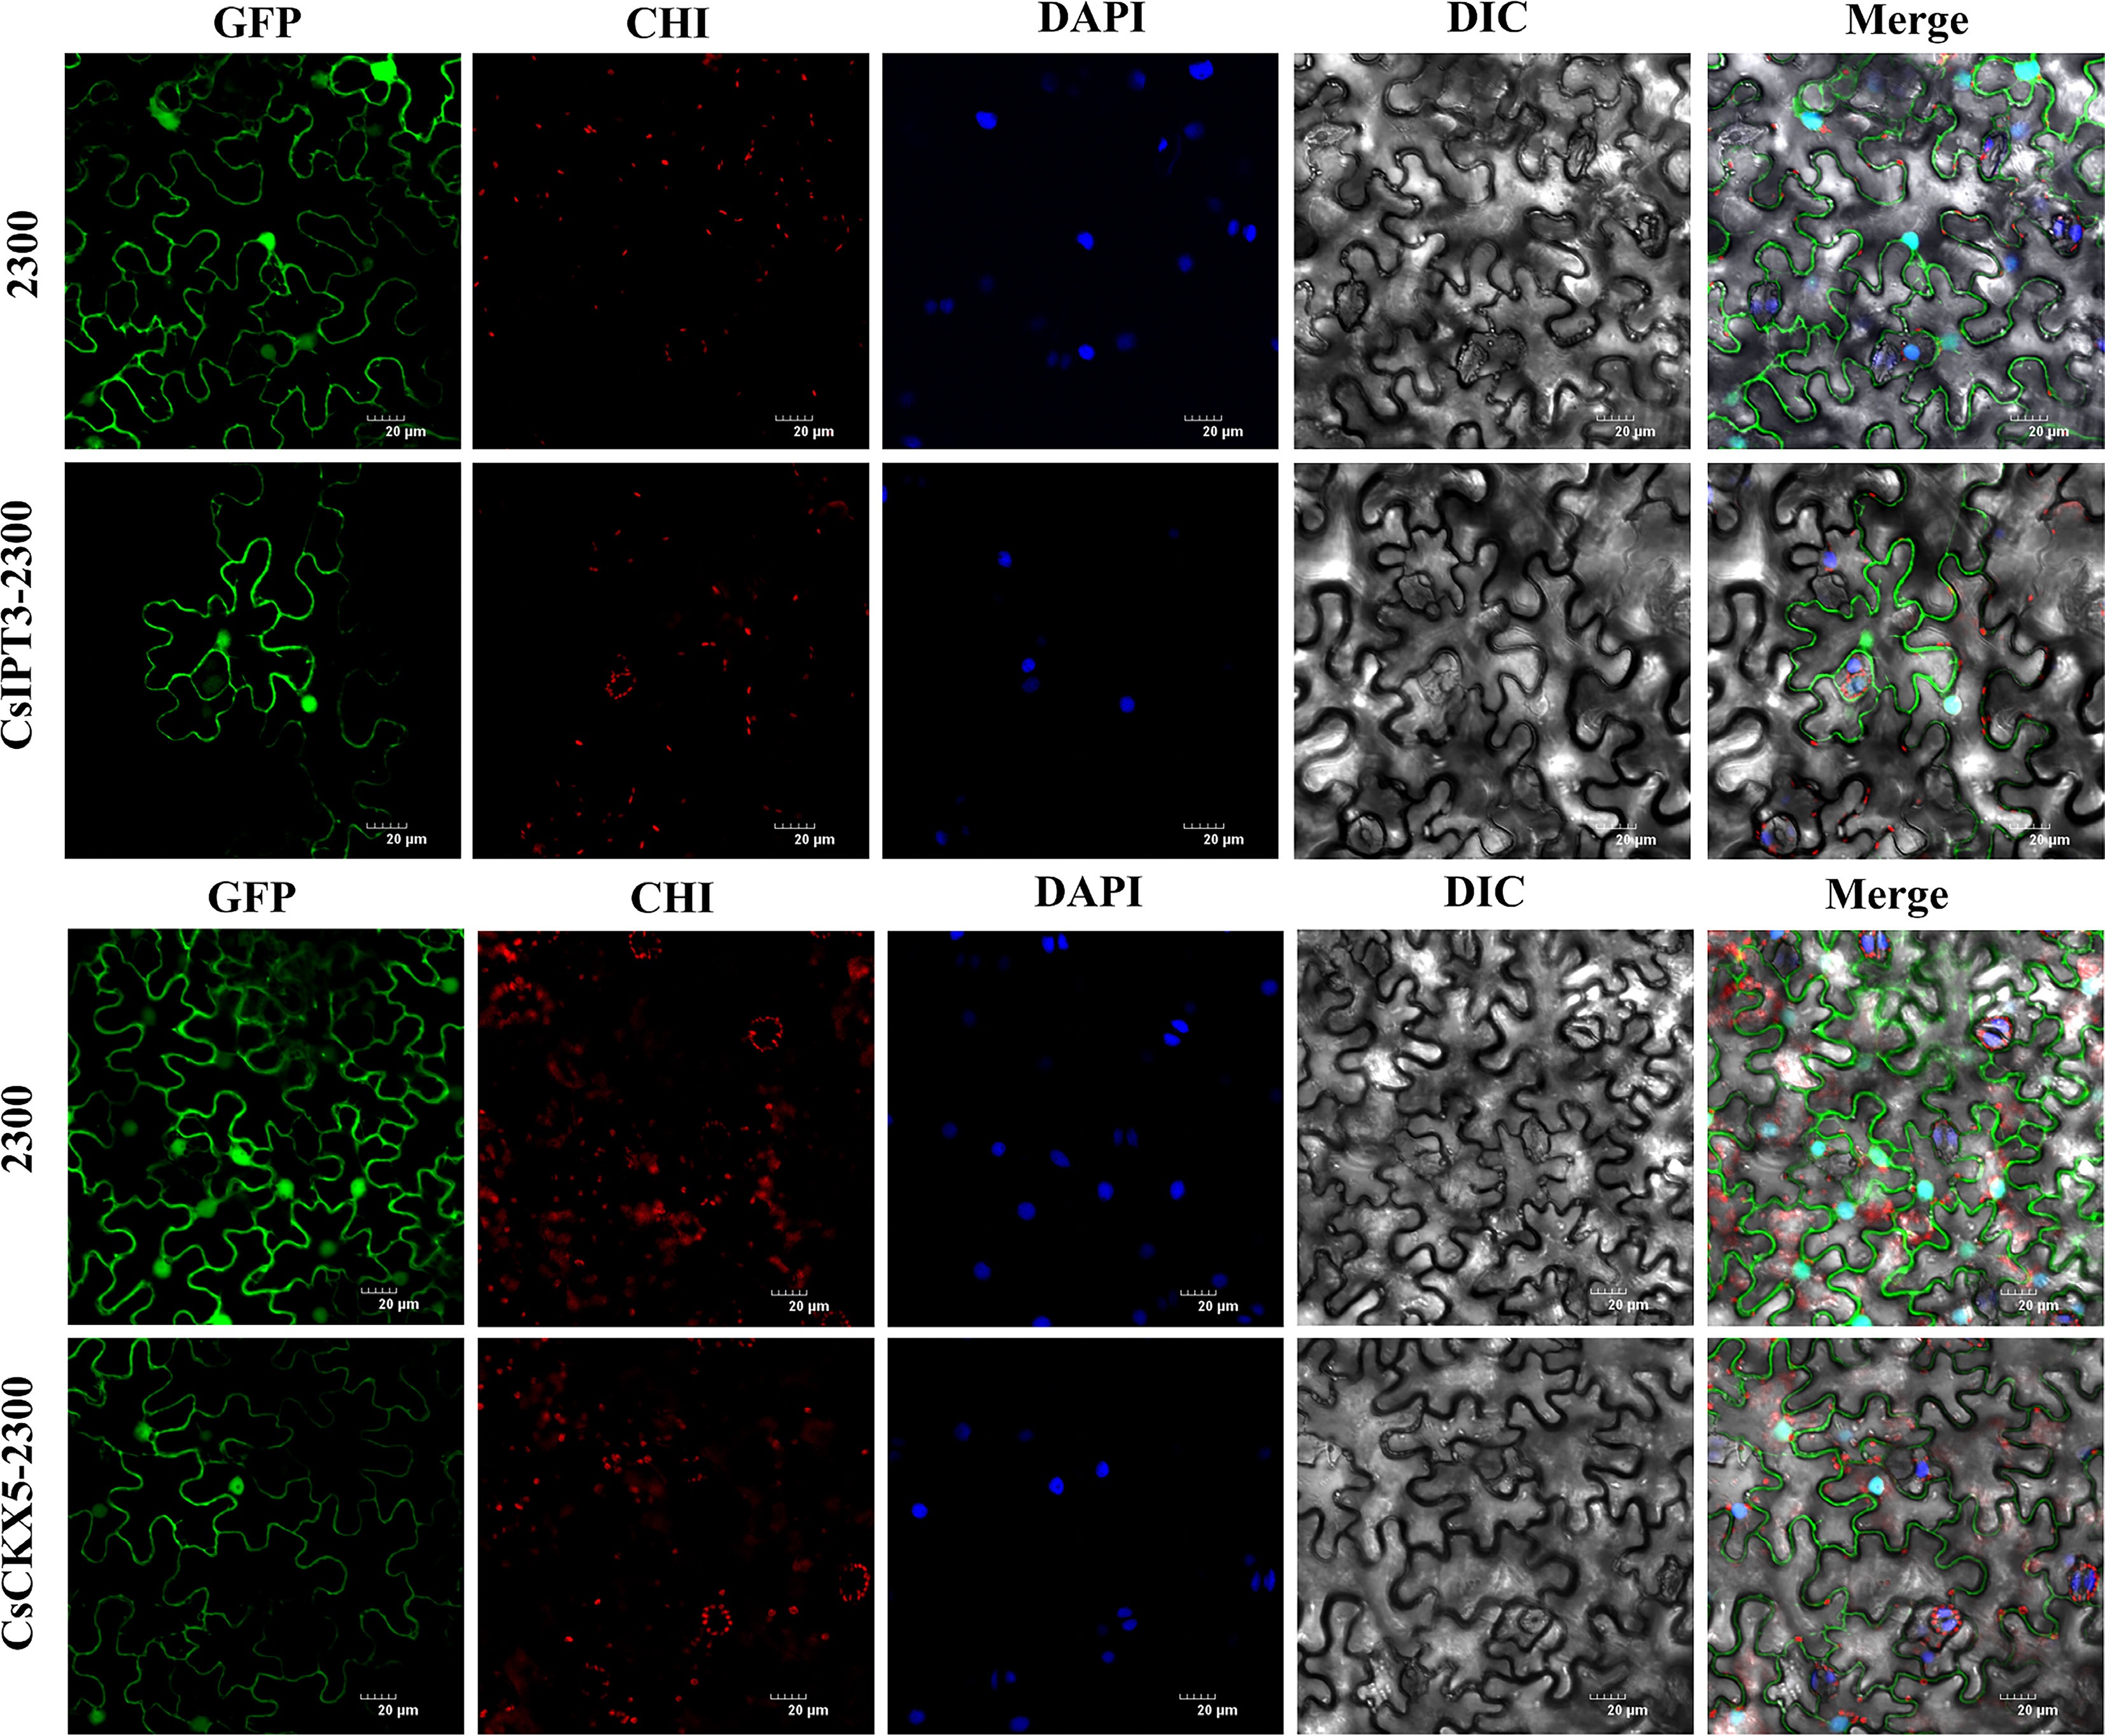
Figure 3.
Subcellular distribution of CsIPT3 and CsCKX5 proteins. Transient expression assays were performed in tobacco leaf epidermal cells, where free GFP and the 35S promoter-driven GFP-CsIPT3 and GFP-CsCKX5 fusion proteins were expressed. Laser scanning confocal microscopy was employed to detect the subcellular localization of these fusion proteins, with the scale bar set at 20 µm. Herein, the GFP channel shows the fluorescent signal of the protein-GFP fusions; the CHI channel exhibits red autofluorescence from chloroplasts, acting as a reference marker for chloroplast localization; the DAPI channel stains cell nuclei to produce blue fluorescence; the DIC channel offers differential interference contrast images that reveal cellular morphological structures; and the Merge channel is a composite of all channels, which is used to illustrate the co-localization status of the target proteins, chloroplasts, and nuclei.
-
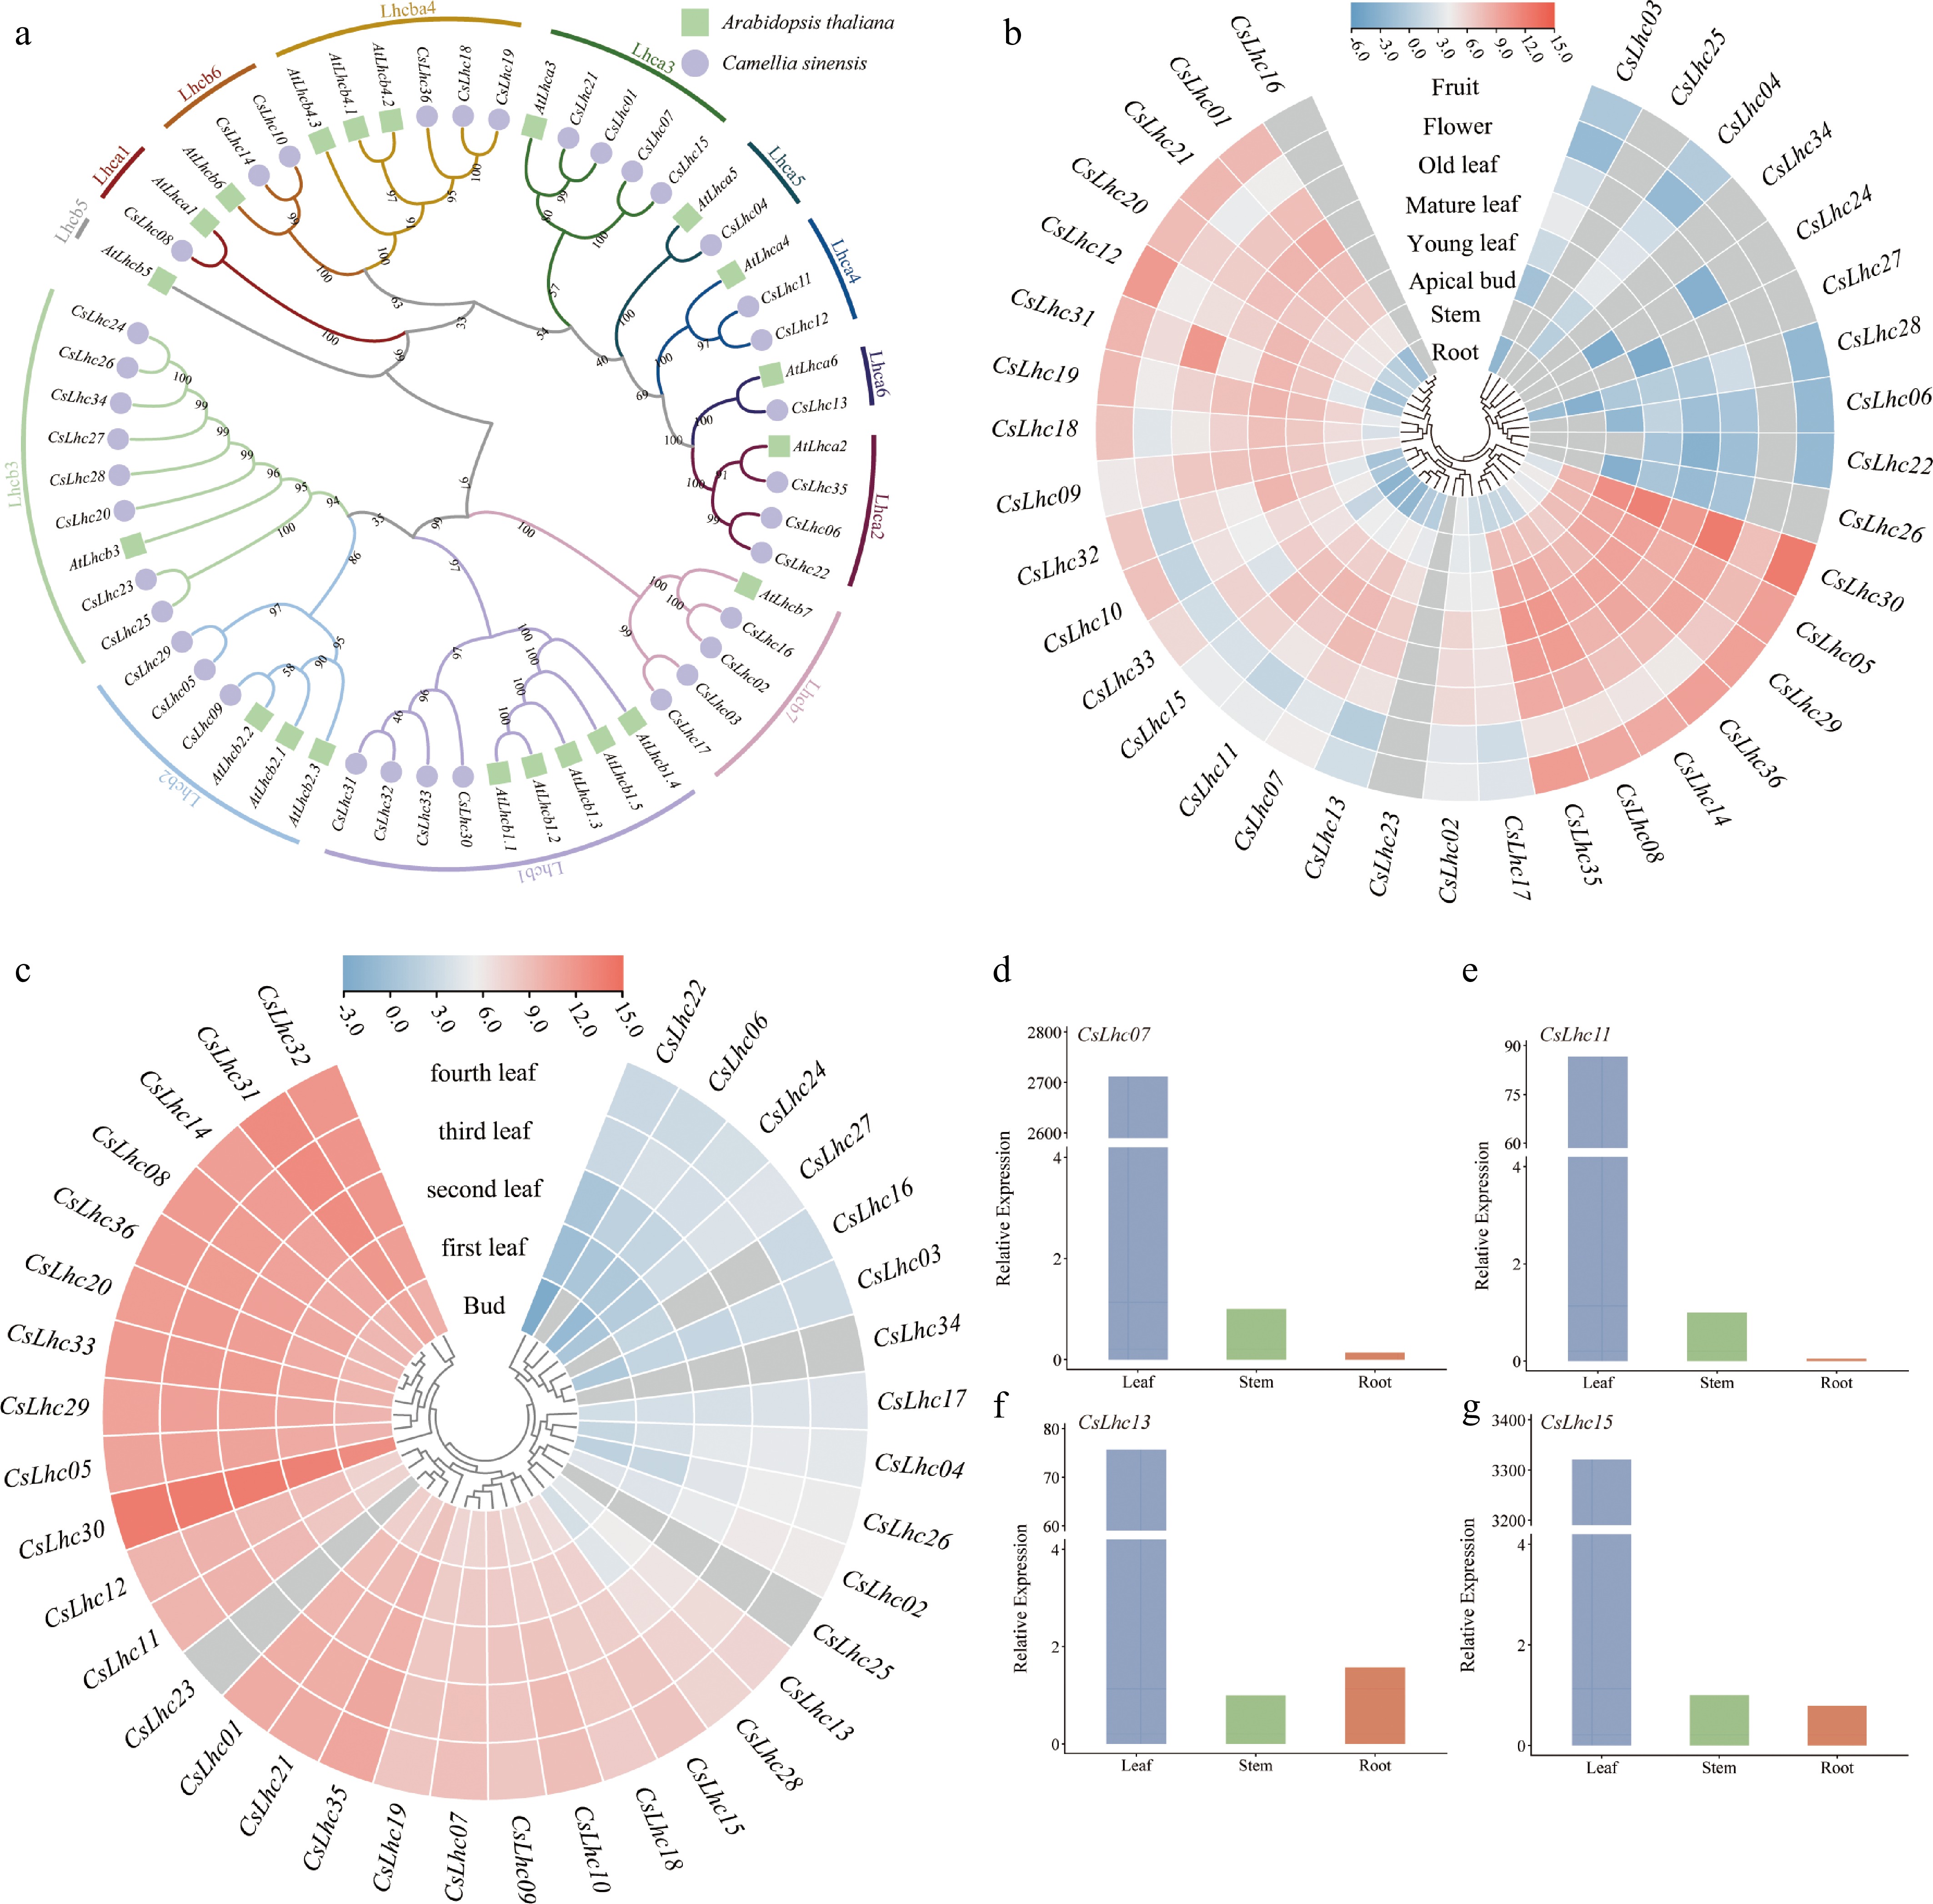
Figure 4.
Phylogenetic analysis and expression profiles of CsLhcs in various organs and leaf stages of 'Shuchazao'. (a) Phylogenetic analysis of CsLhc family genes from 'Shuchazao'; Different shapes in various colors are used to denote distinct species. Different colored arcs represent distinct groups. The un-rooted phylogenetic trees were constructed and visualized using iQtree and iTOL, respectively. (b) Transcription levels of CsLhc family genes in various organs of 'Shuchazao'. (c) Transcription levels of CsLhc family genes in different leaf development stages of 'Shuchazao'. The color scale represents log2-transformed FPKM values. Light blue- and pink-color indicated low to high expression, respectively. (d)–(g) The expression levels of four CsLhc genes with CsGAPDH used as reference gene. The 2−ΔΔCᴛ method was applied for calculating the transcription levels of each gene. Lowercase letters are used to denote notable distinctions between transgenic Arabidopsis and WT plants (p < 0.05).
-
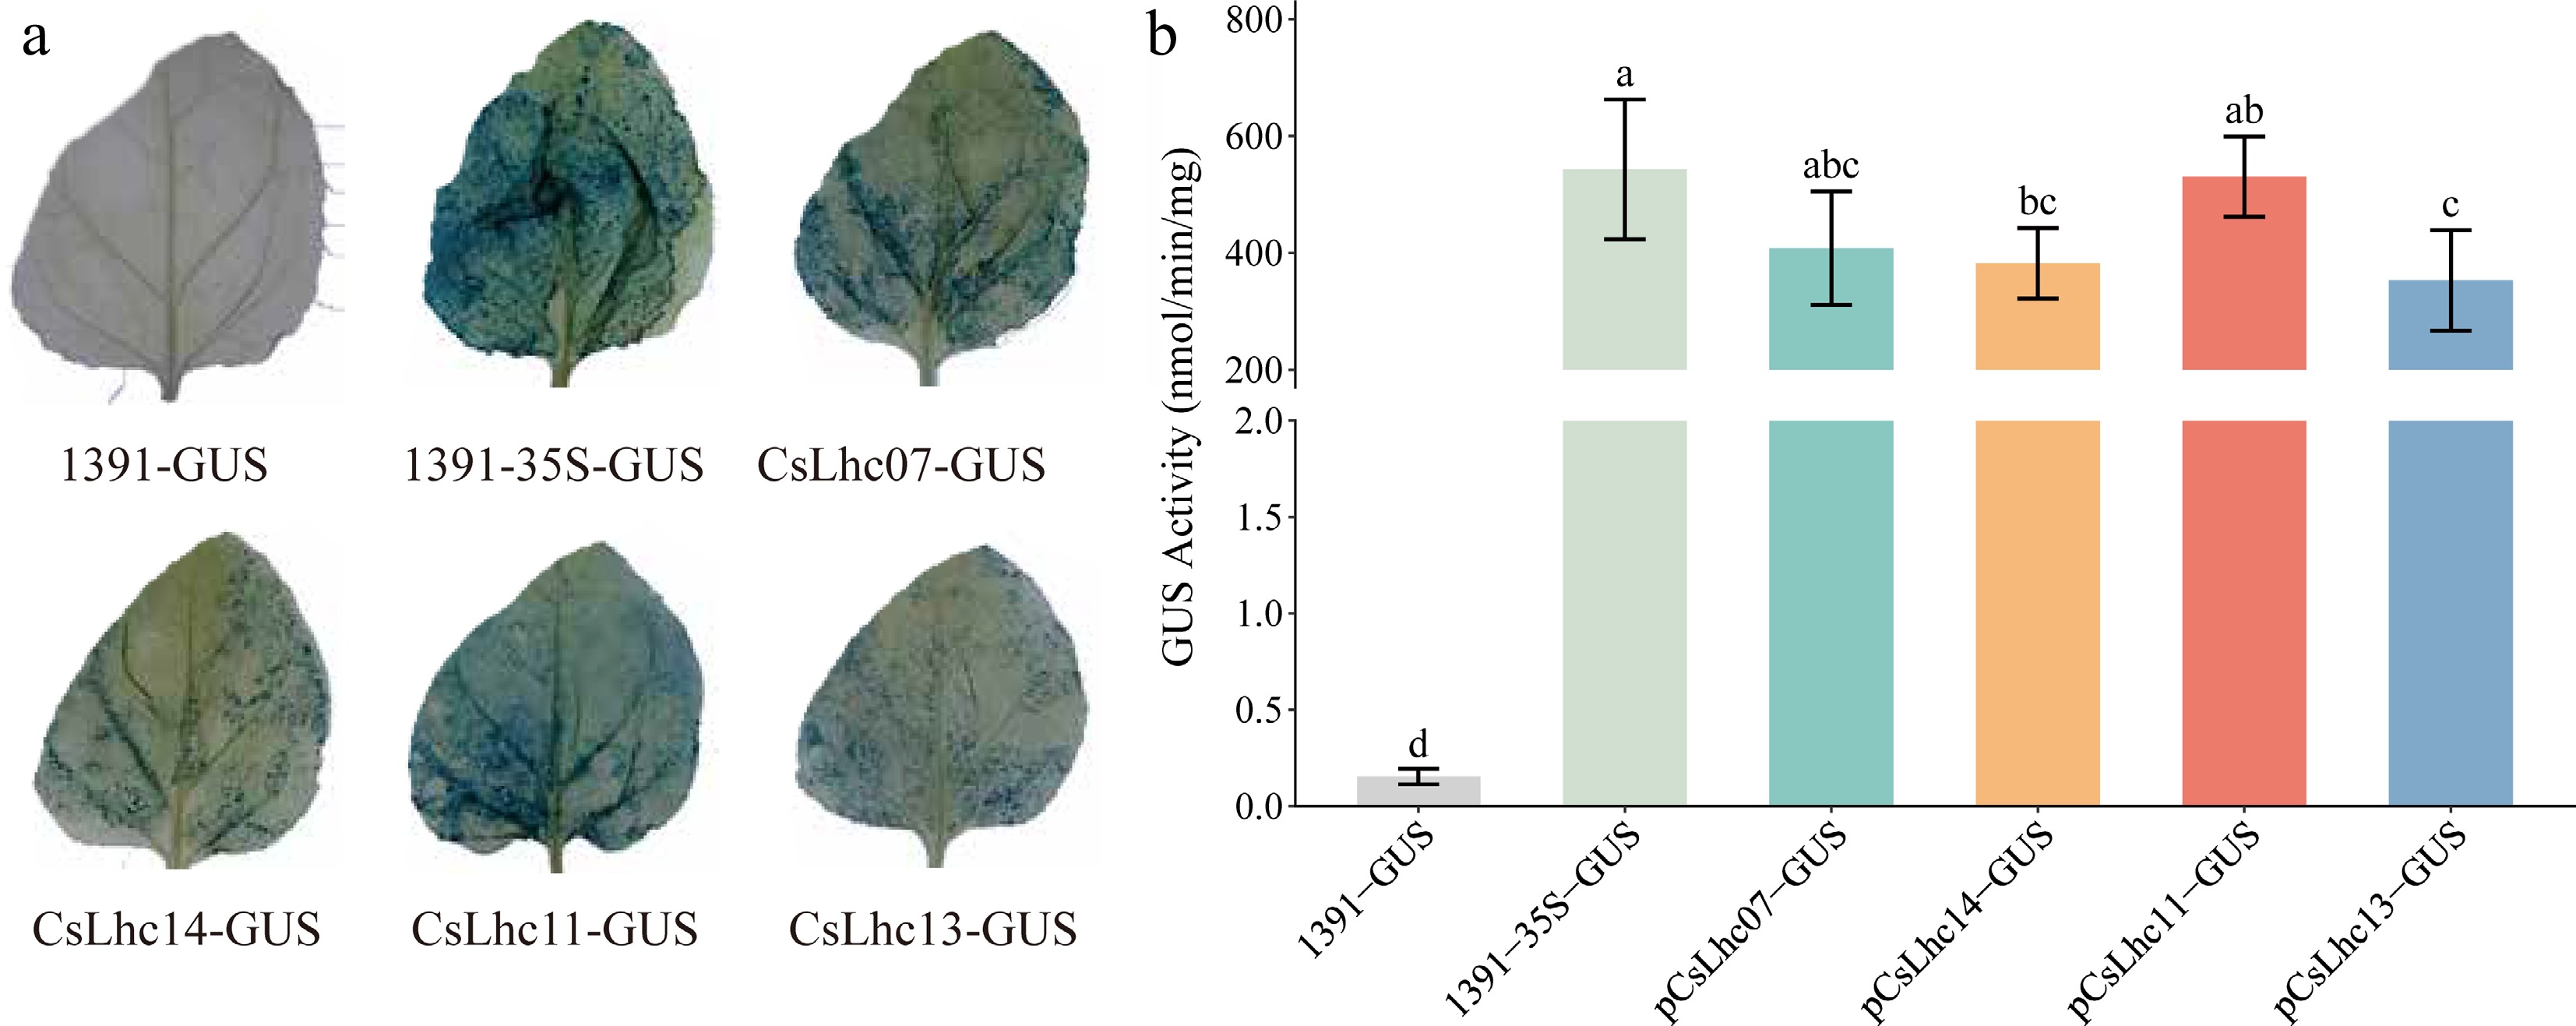
Figure 5.
The promoter activities of four CsLhc genes. (a) GUS staining for the transient overexpression of the GUS gene derived by four different CsLhc promoters. (b) GUS activity assay. Lowercase letters are used to denote notable distinctions between transgenic Arabidopsis plants and WT plants (p < 0.05).
-
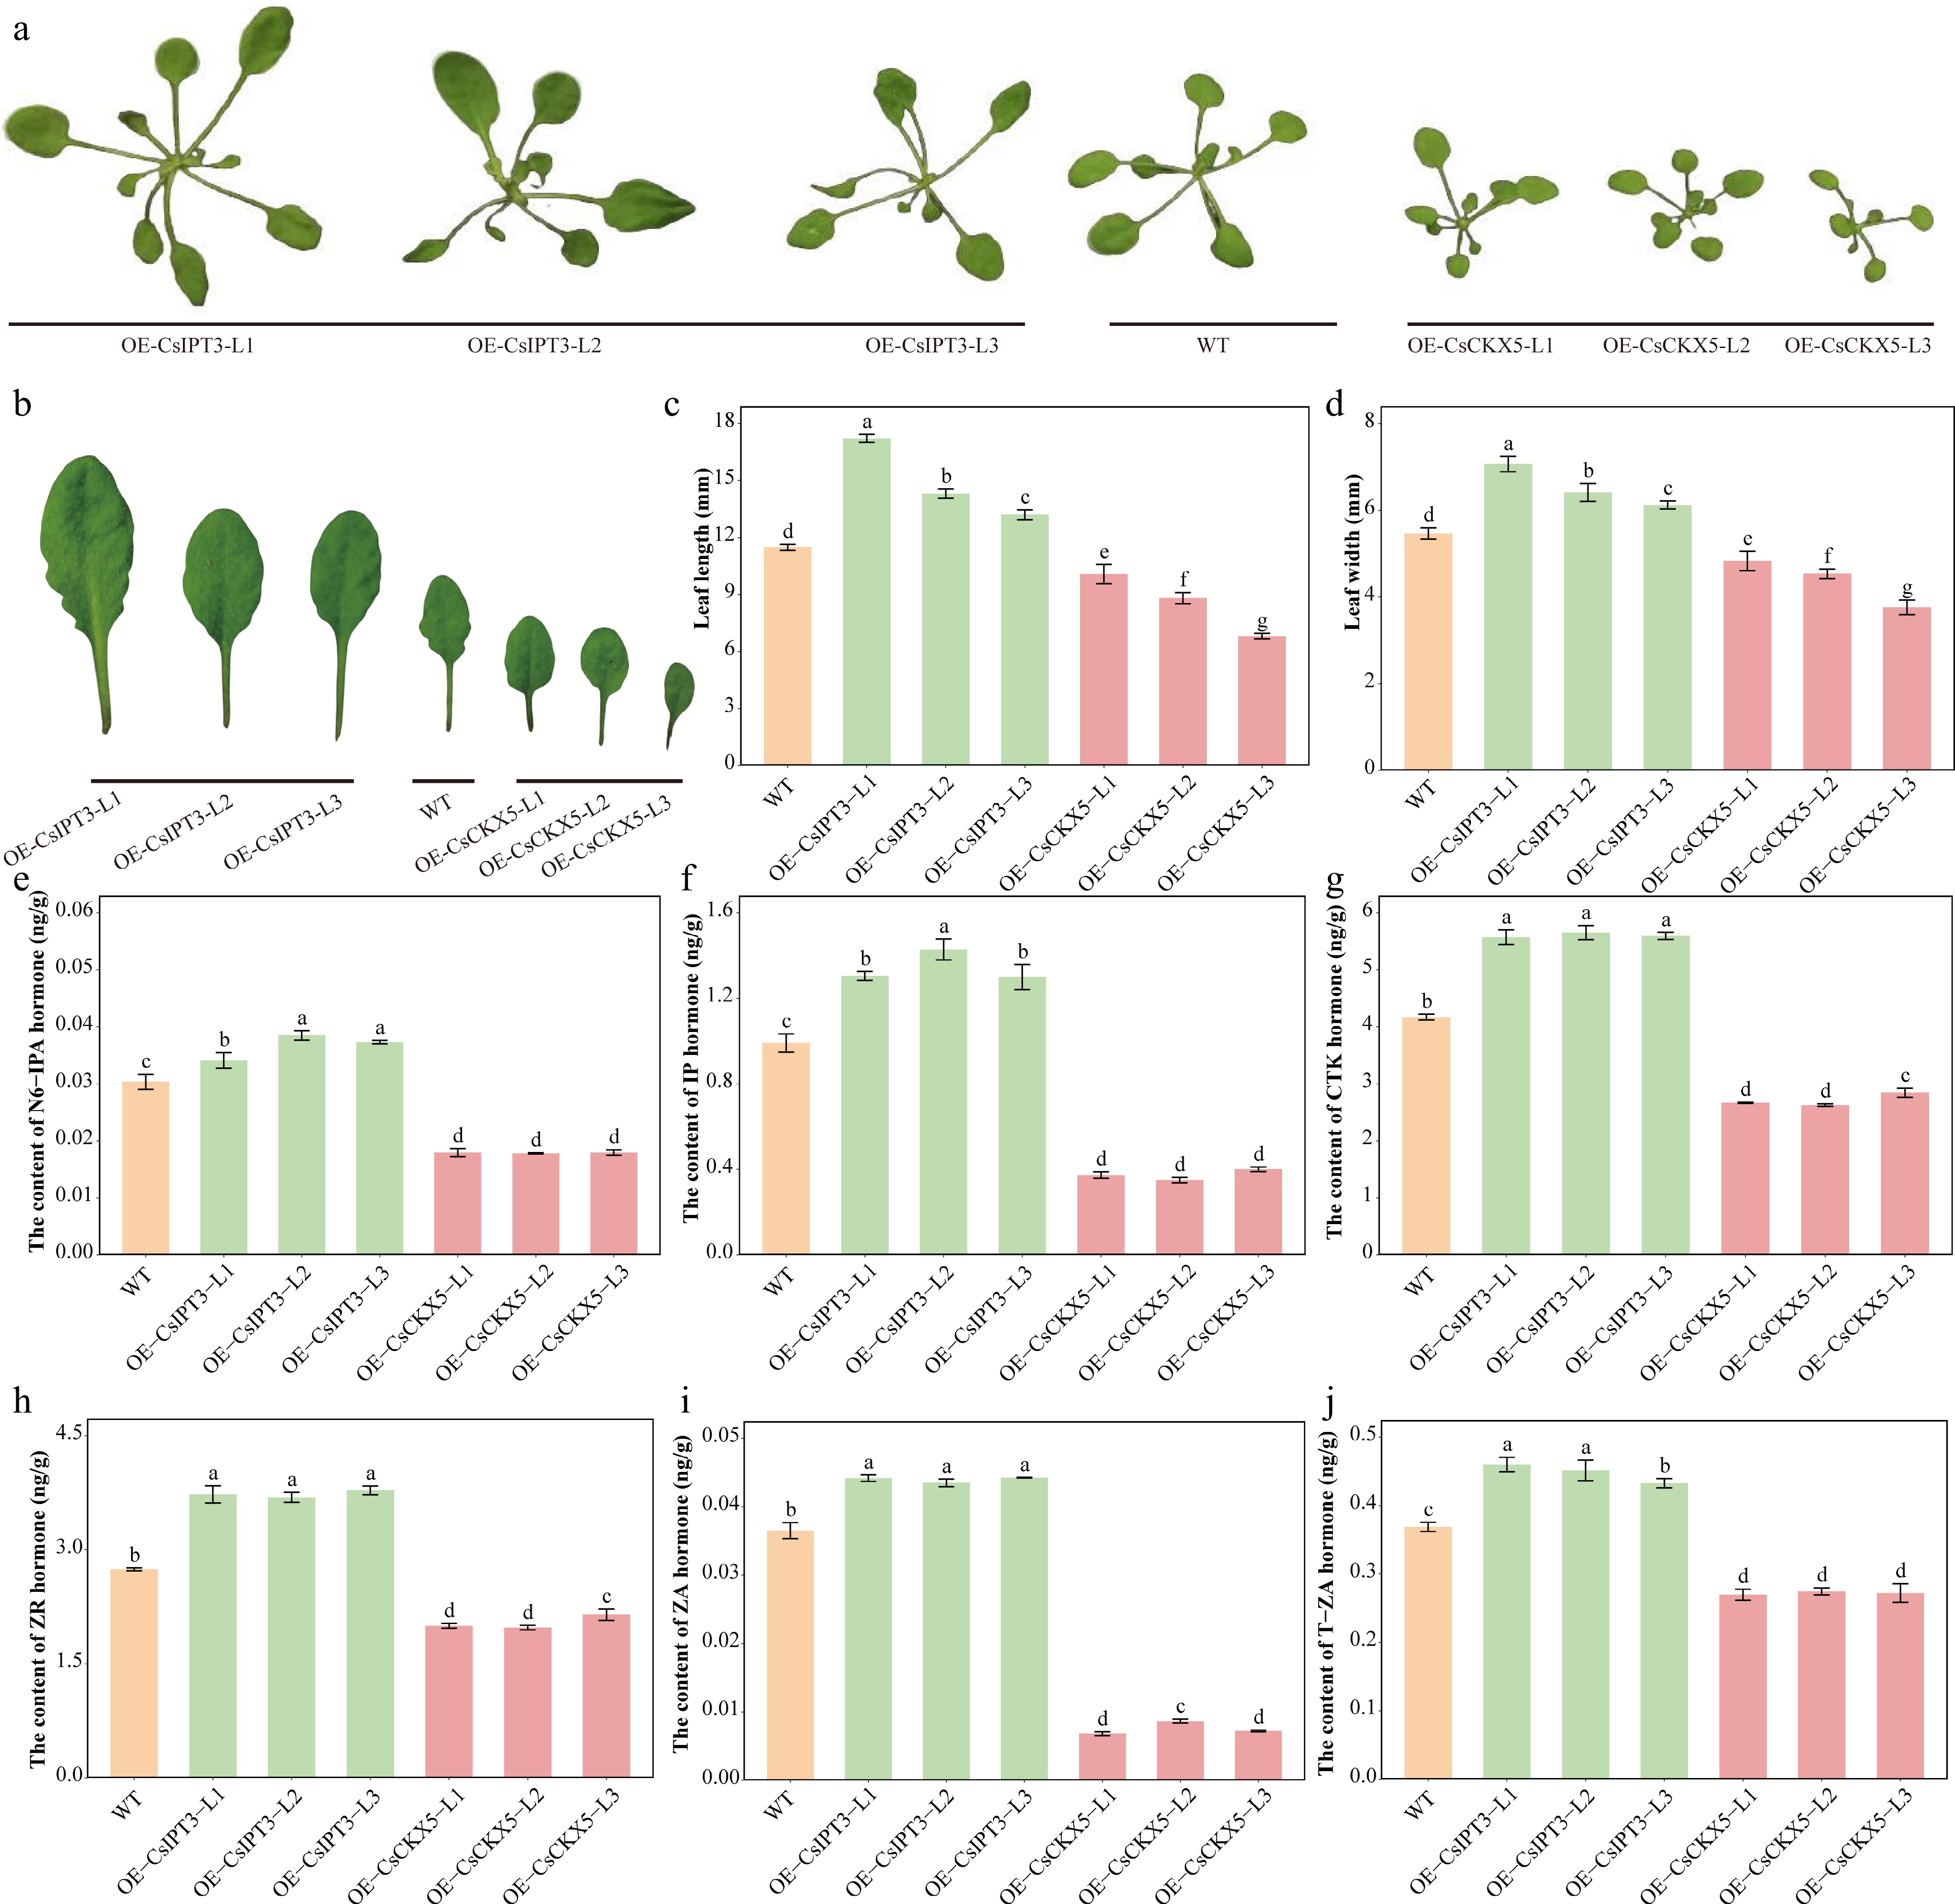
Figure 6.
Phenotype of transgenic Arabidopsis plants overexpressing CsIPT3 or CsCKX5 genes derived by the CsLhc11 promoter. (a) The rosette size in transgenic Arabidopsis lines overexpressing CsIPT3 or CsCKX5; (b) The leaf size in transgenic Arabidopsis lines overexpressing CsIPT3 or CsCKX5; (c)–(h) The contents of CTK, ZA, ZR, T-ZA, iP, and N6-IPA in transgenic Arabidopsis lines overexpressing CsIPT3 or CsCKX5. Lowercase letters are used to denote notable distinctions between transgenic Arabidopsis plants and WT plants (p < 0.05). CTK, total cytokinin; ZA, Zeatin adenine; ZR, Zeatin riboside; T-ZA, trans-zeatin adenine; iP, isopentenyl adenine, N6-IPA, N6-Isopentenyl Adenosine.
-
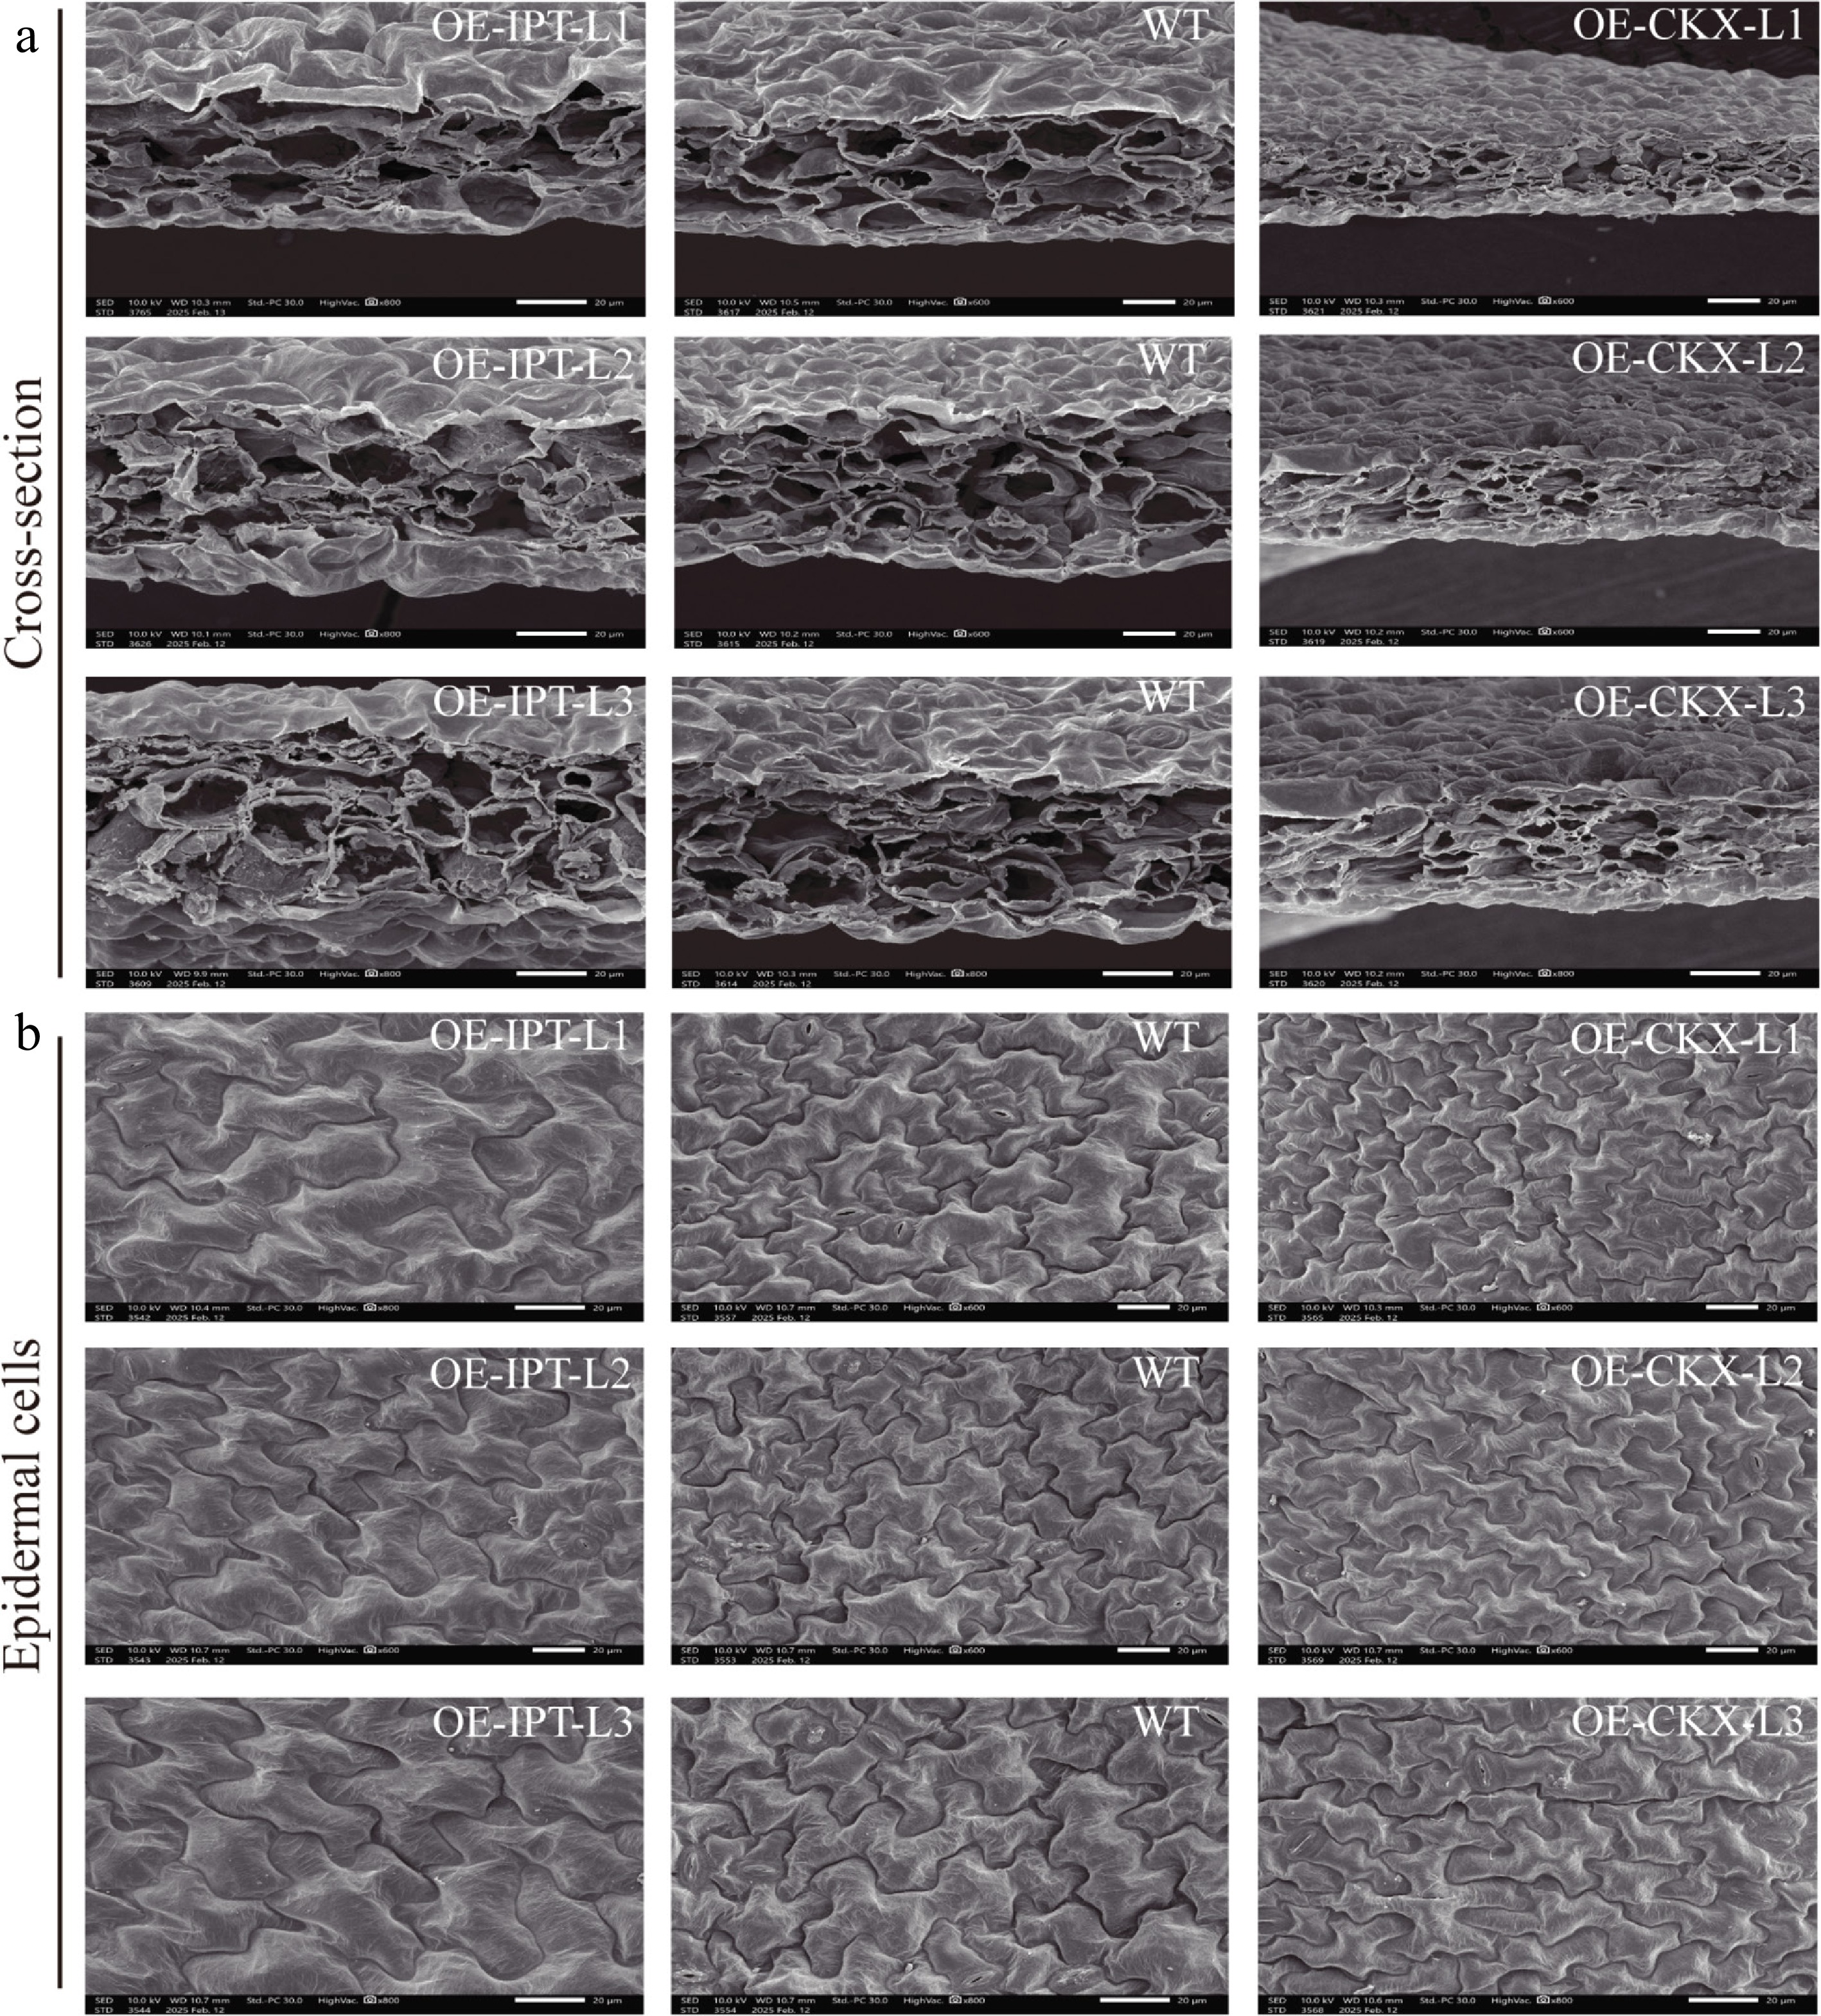
Figure 7.
The epidermal cells and cross-section of young leaf in transgenic Arabidopsis overexpressing CsIPT3/CsCKX5. (a) Epidermal cells in young leaf of transgenic Arabidopsis overexpressing CsIPT3/CsCKX5 compared to WT plants; (b) Cross-section in young leaf of transgenic Arabidopsis overexpressing CsIPT3/CsCKX5 compared to WT plants. WT, wild plants. OE-CsIPT3, transgenic Arabidopsis overexpressing CsIPT3 driven by CsLhc11 promoter; OE-CsCKX5, transgenic Arabidopsis overexpressing CsCKX5 driven by CsLhc11 promoter.
-
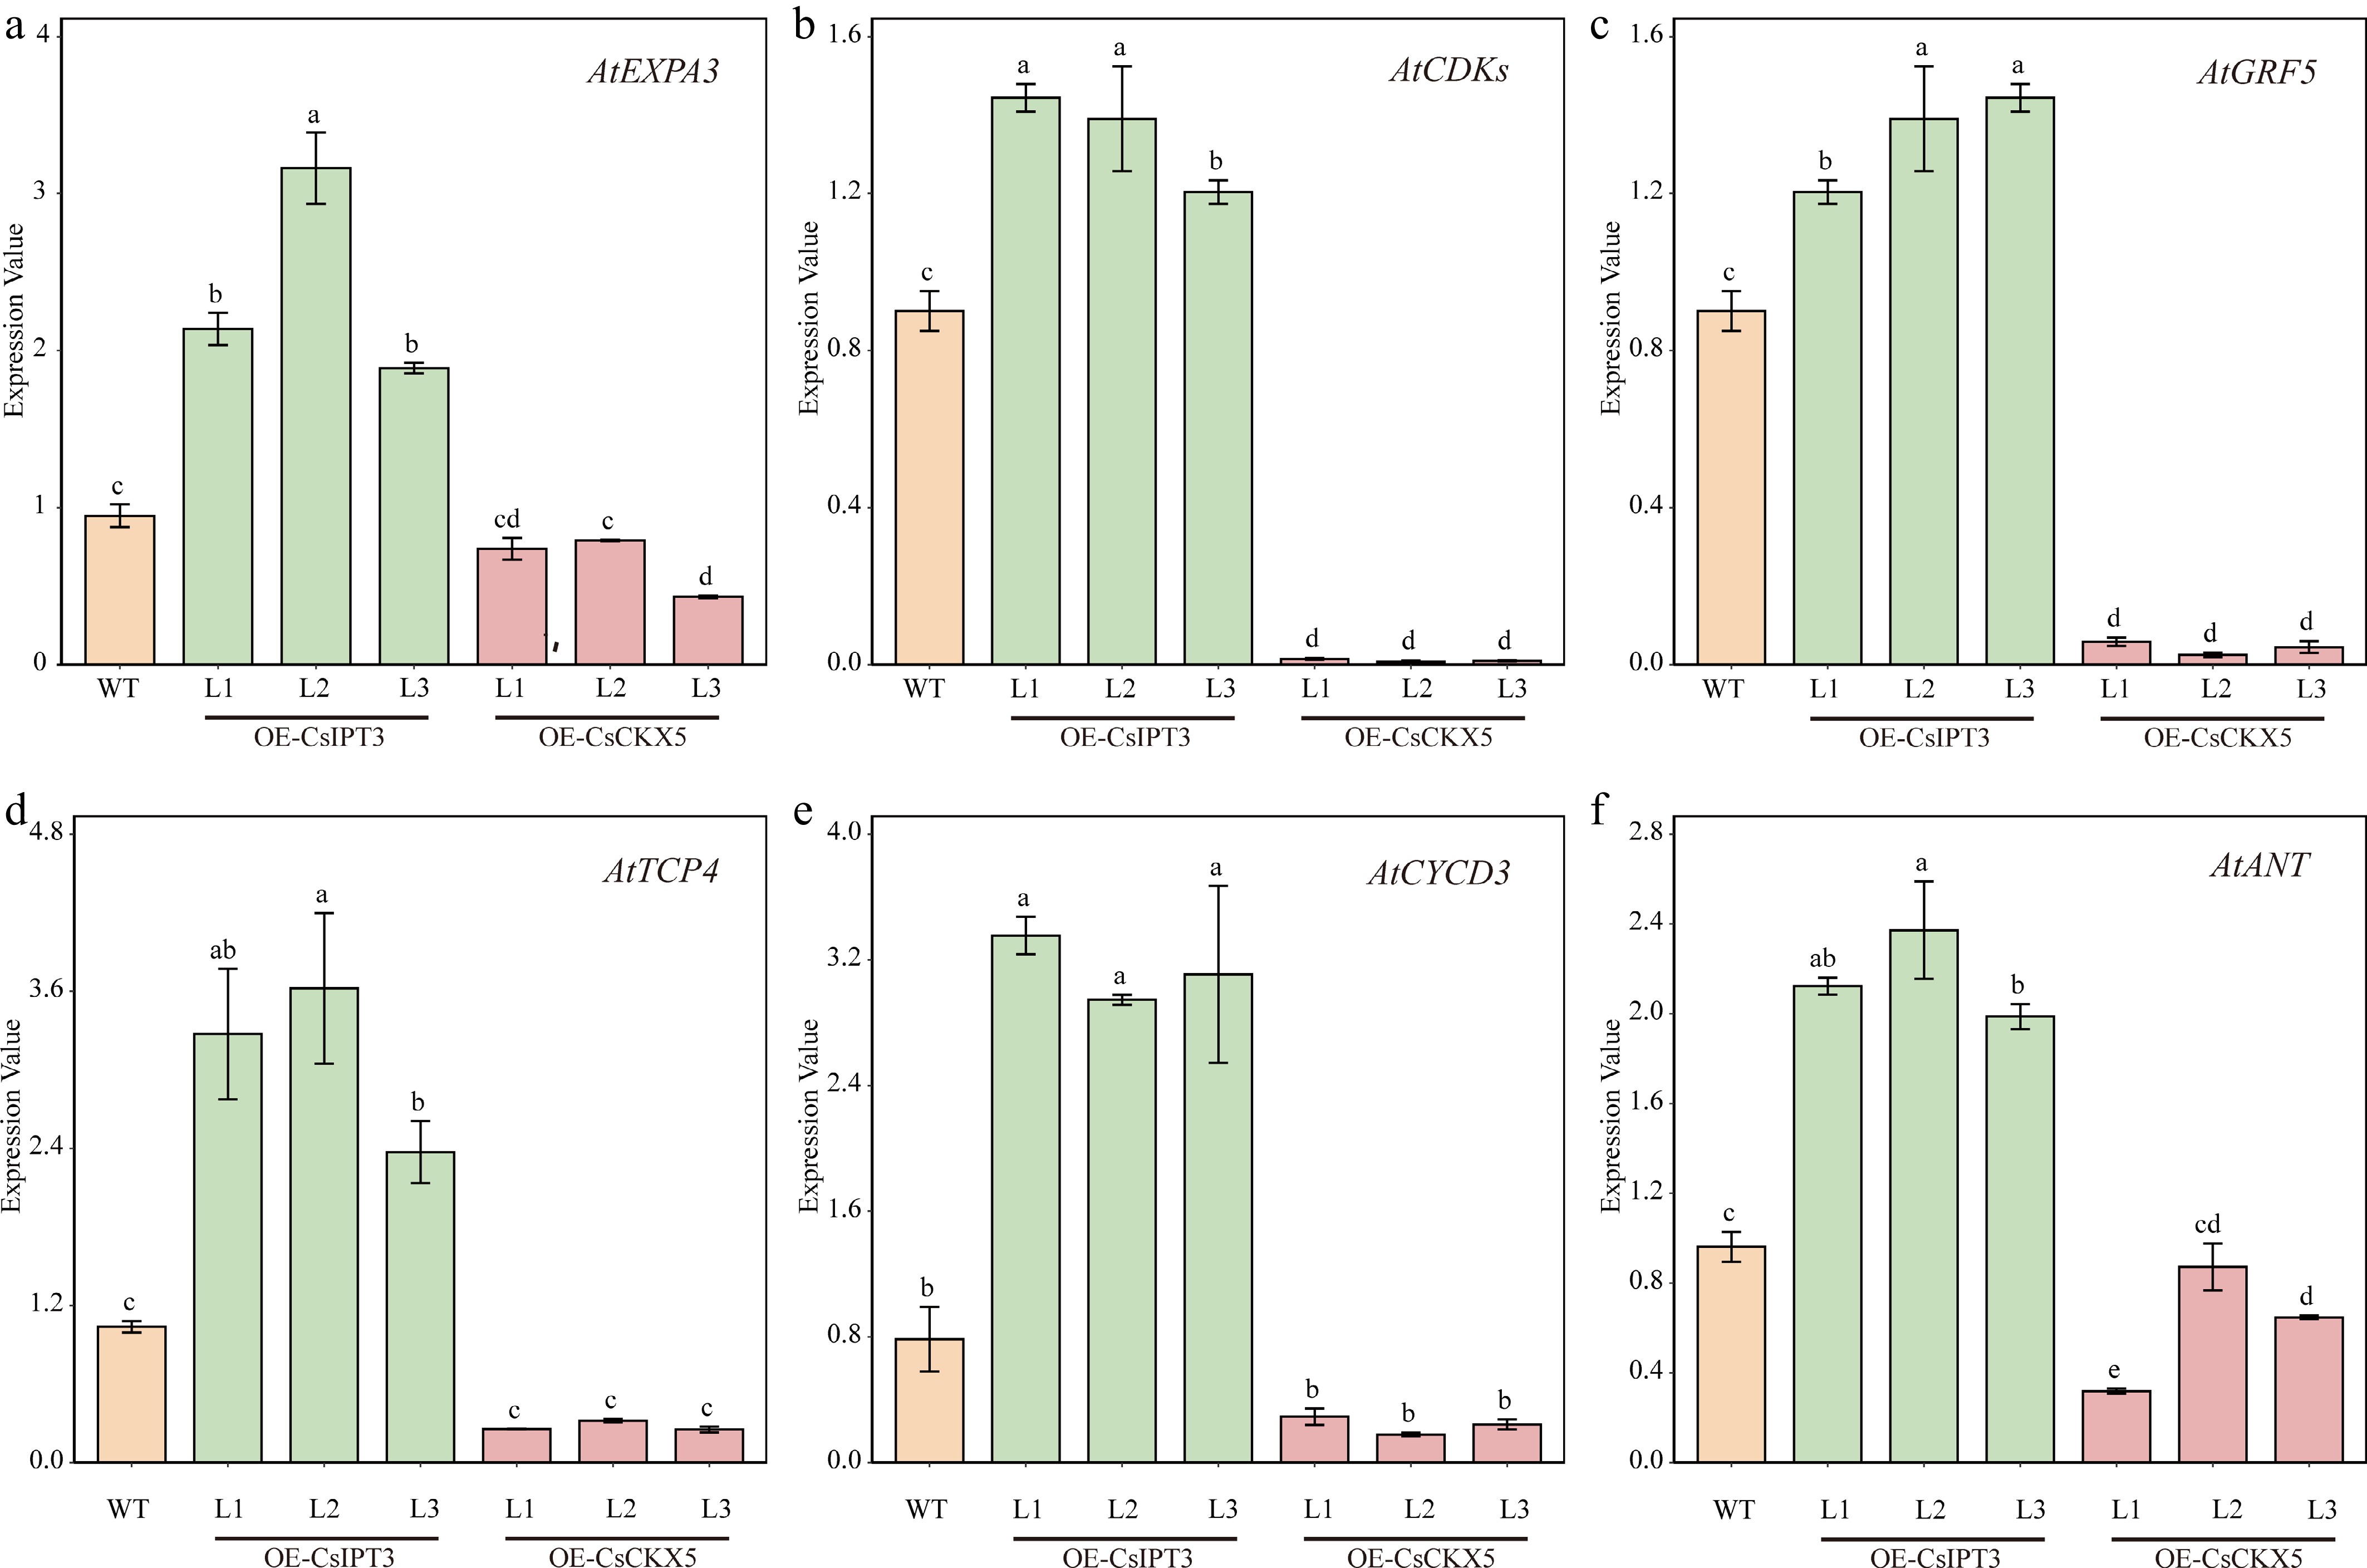
Figure 8.
Transcript abundance of six cytokinin responsive genes in transgenic Arabidopsis overexpressing CsIPT3/CsCKX5 derived by the CsLhc11 promoter. The expression levels of six candidate genes in transgenic Arabidsopsis lines: (a) The expression levels of AtEXPA3 in transgenic Arabidsopsis lines; (b) The expression levels of AtCDK in transgenic Arabidsopsis lines; (c) The expression levels of AtGRF5 in transgenic Arabidsopsis lines; (d) The expression levels of AtTCP4 in transgenic Arabidsopsis lines; (e) The expression levels of AtCYCD3 in transgenic Arabidsopsis lines; (f) The expression levels of AtANT in transgenic Arabidsopsis lines. Lowercase letters are used to denote notable distinctions between the control group and treatment group (p < 0.05).
Figures
(8)
Tables
(0)