-
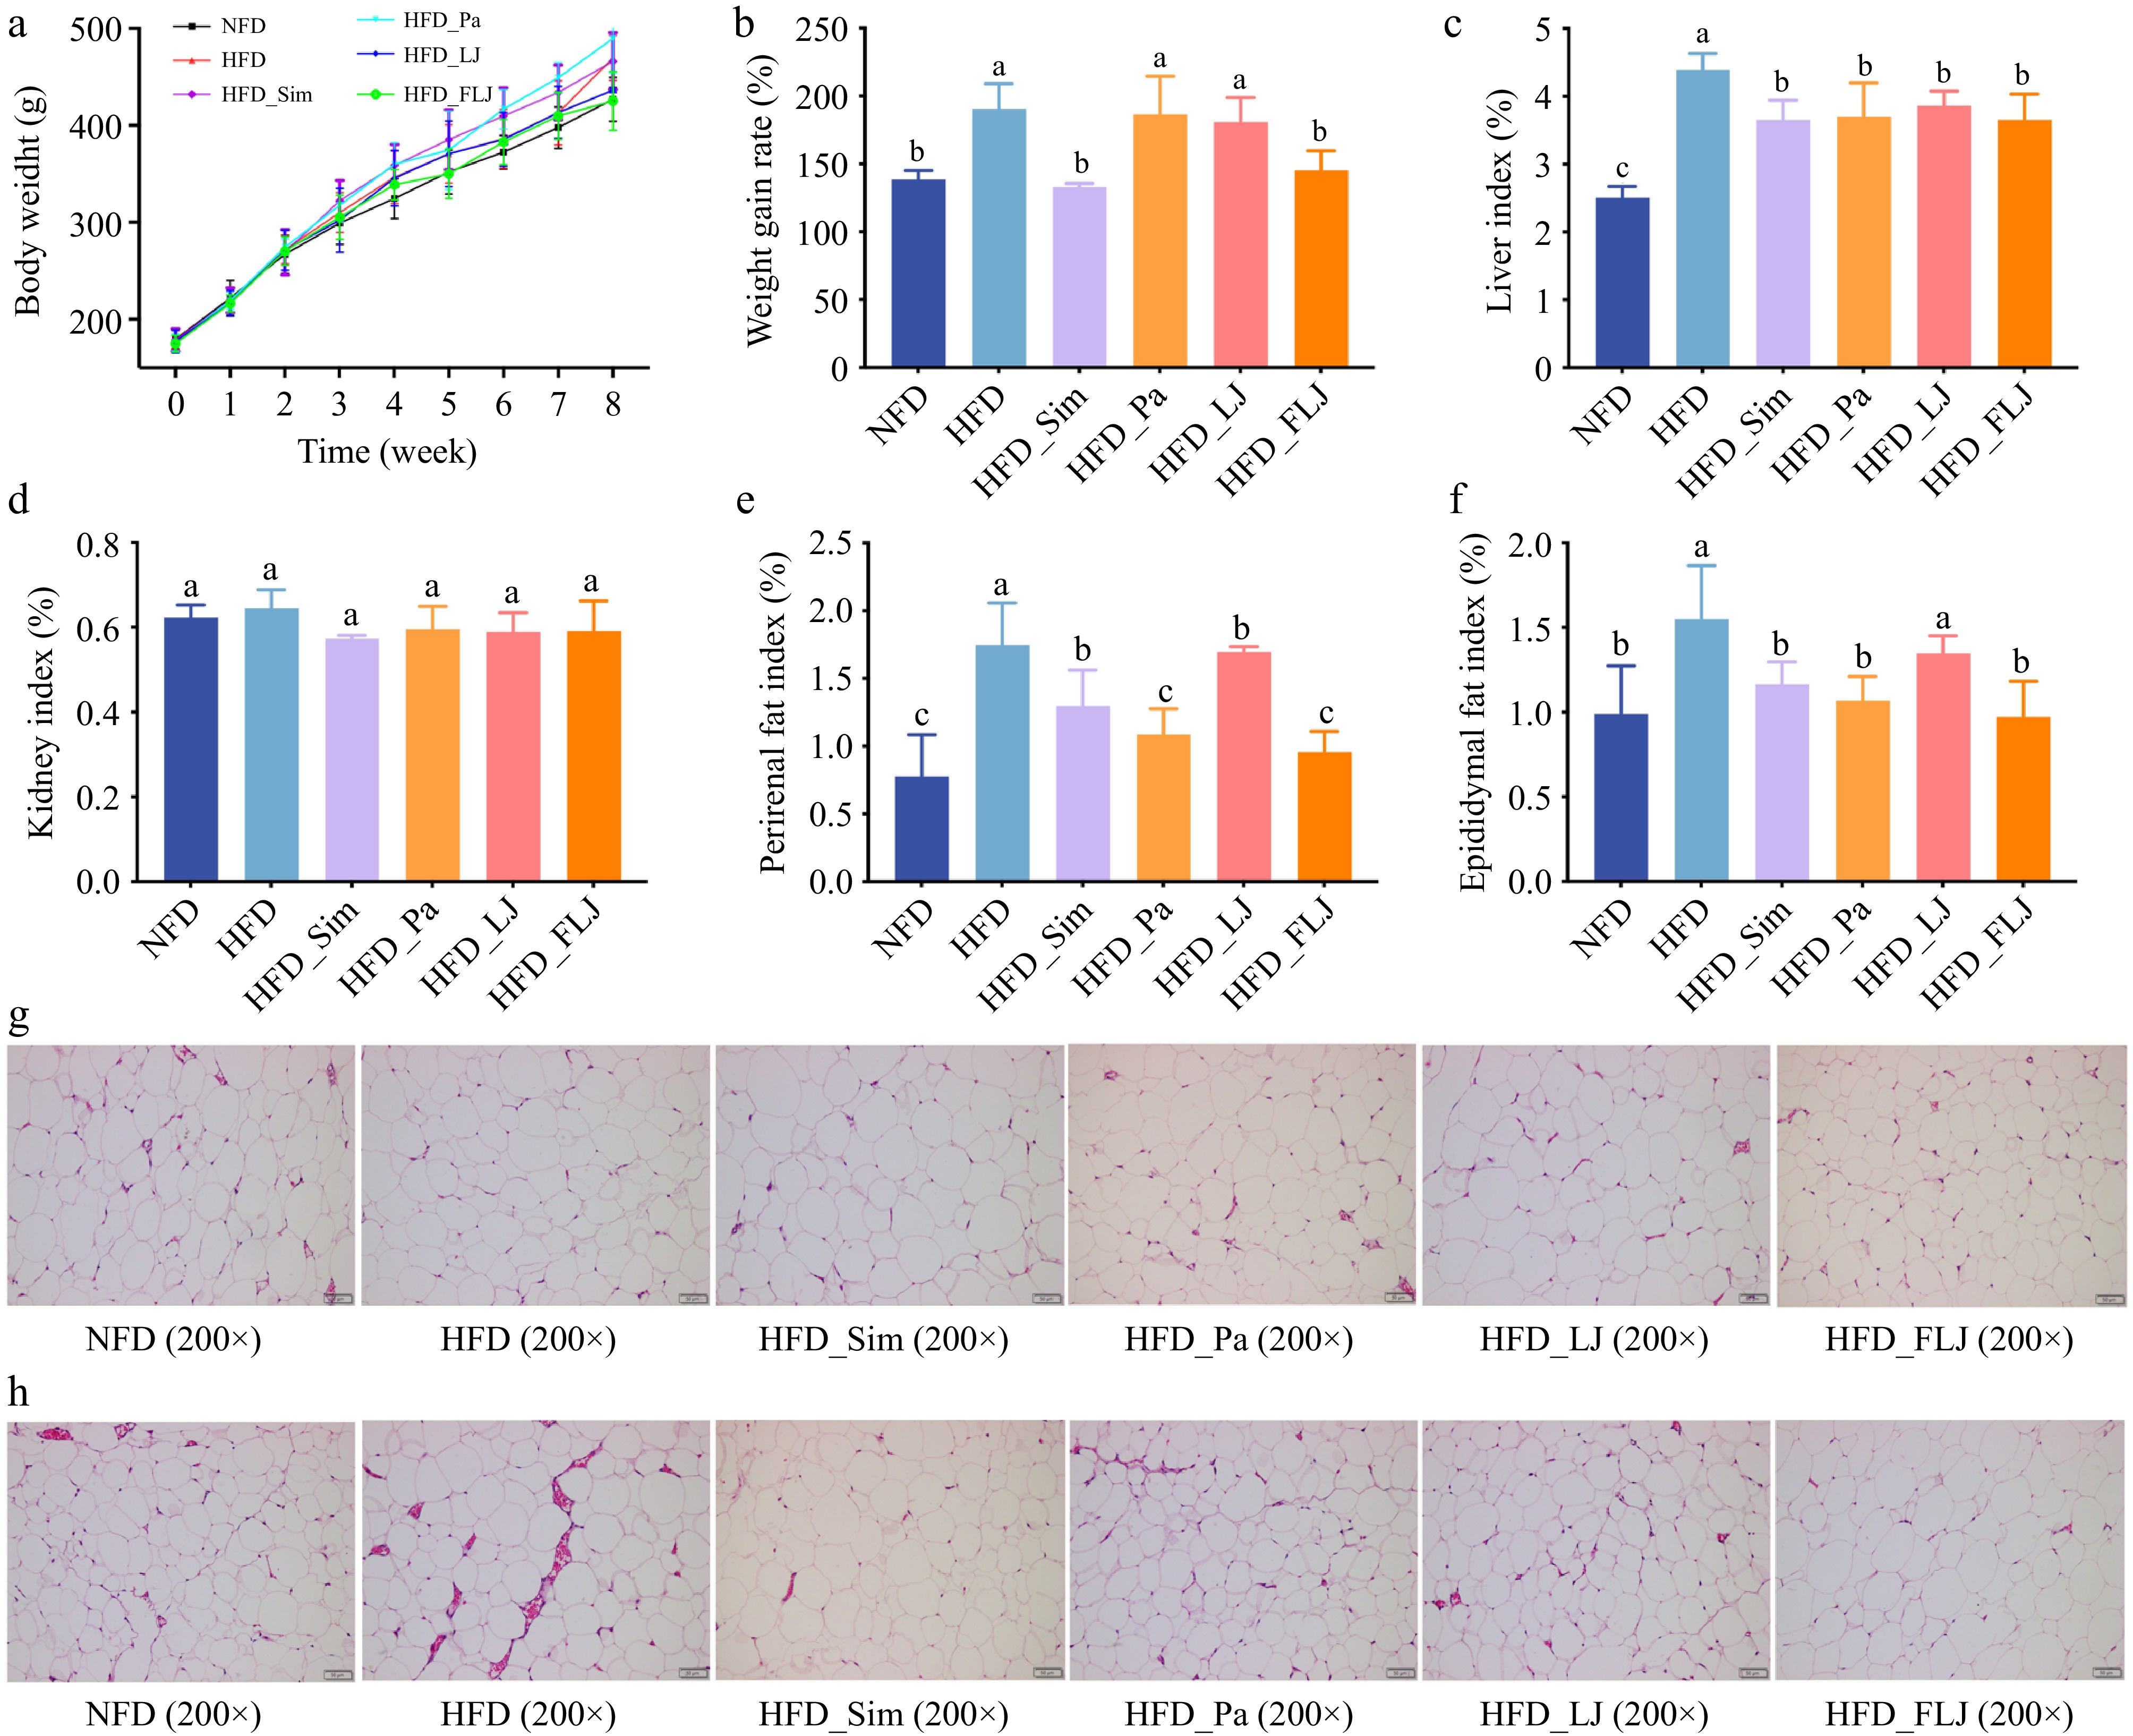
Figure 1.
The effect of the P. acidilactici FZU106-fermented L. japonica intervention on the physiological index and fat accumulation in NAFLD rats (n = 6). (a) Body weight growth, (b) rate of weight gain, (c) liver index, (d) kidney index, (e) perirenal fat index, (f) epididymal fat index, (g) H&E staining of perirenal adipocytes, and (h) epididymal adipocytes. Values are expressed as the mean ± SEM in each group. Different letters indicate significant differences among experimental groups (p < 0.05).
-
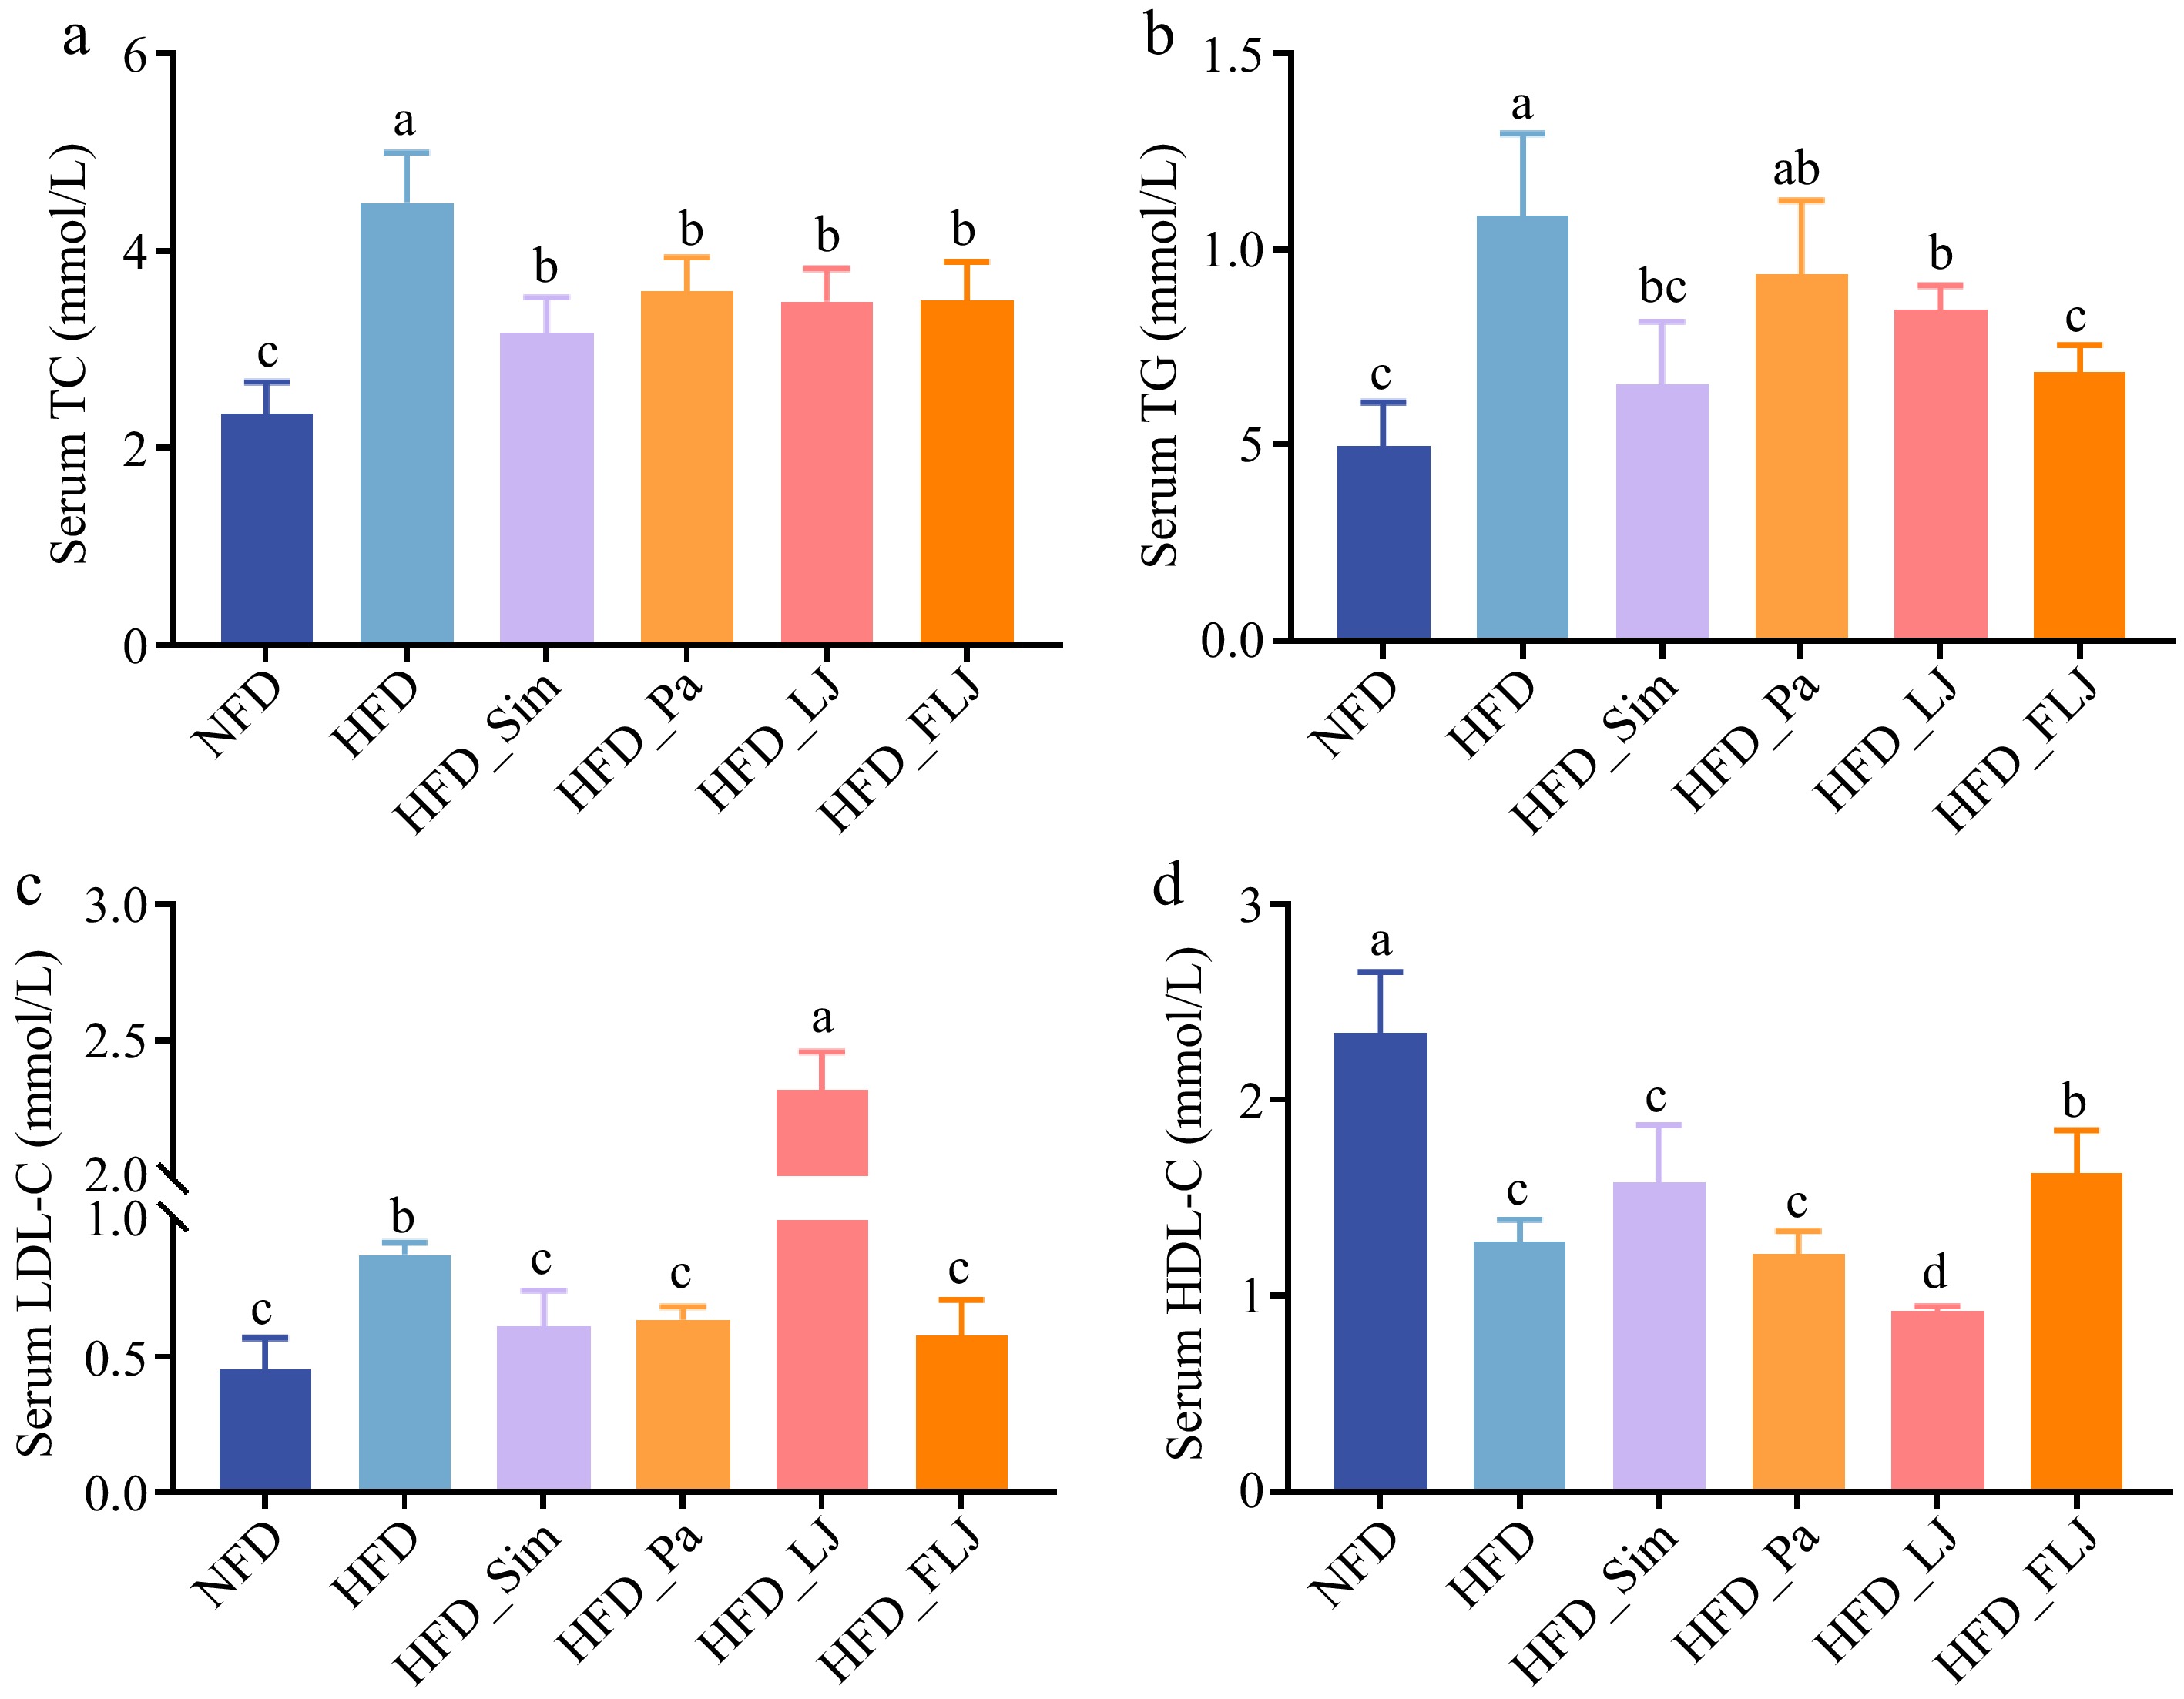
Figure 2.
The effect of the FLJ intervention on serum parameters in NAFLD rats (n = 6). (a) Serum TC, (b) serum TG, (c) serum LDL-C, and (d) serum HDL-C. Values are expressed as the mean ± SEM in each group. Different letters indicate significant differences among experimental groups (p < 0.05).
-
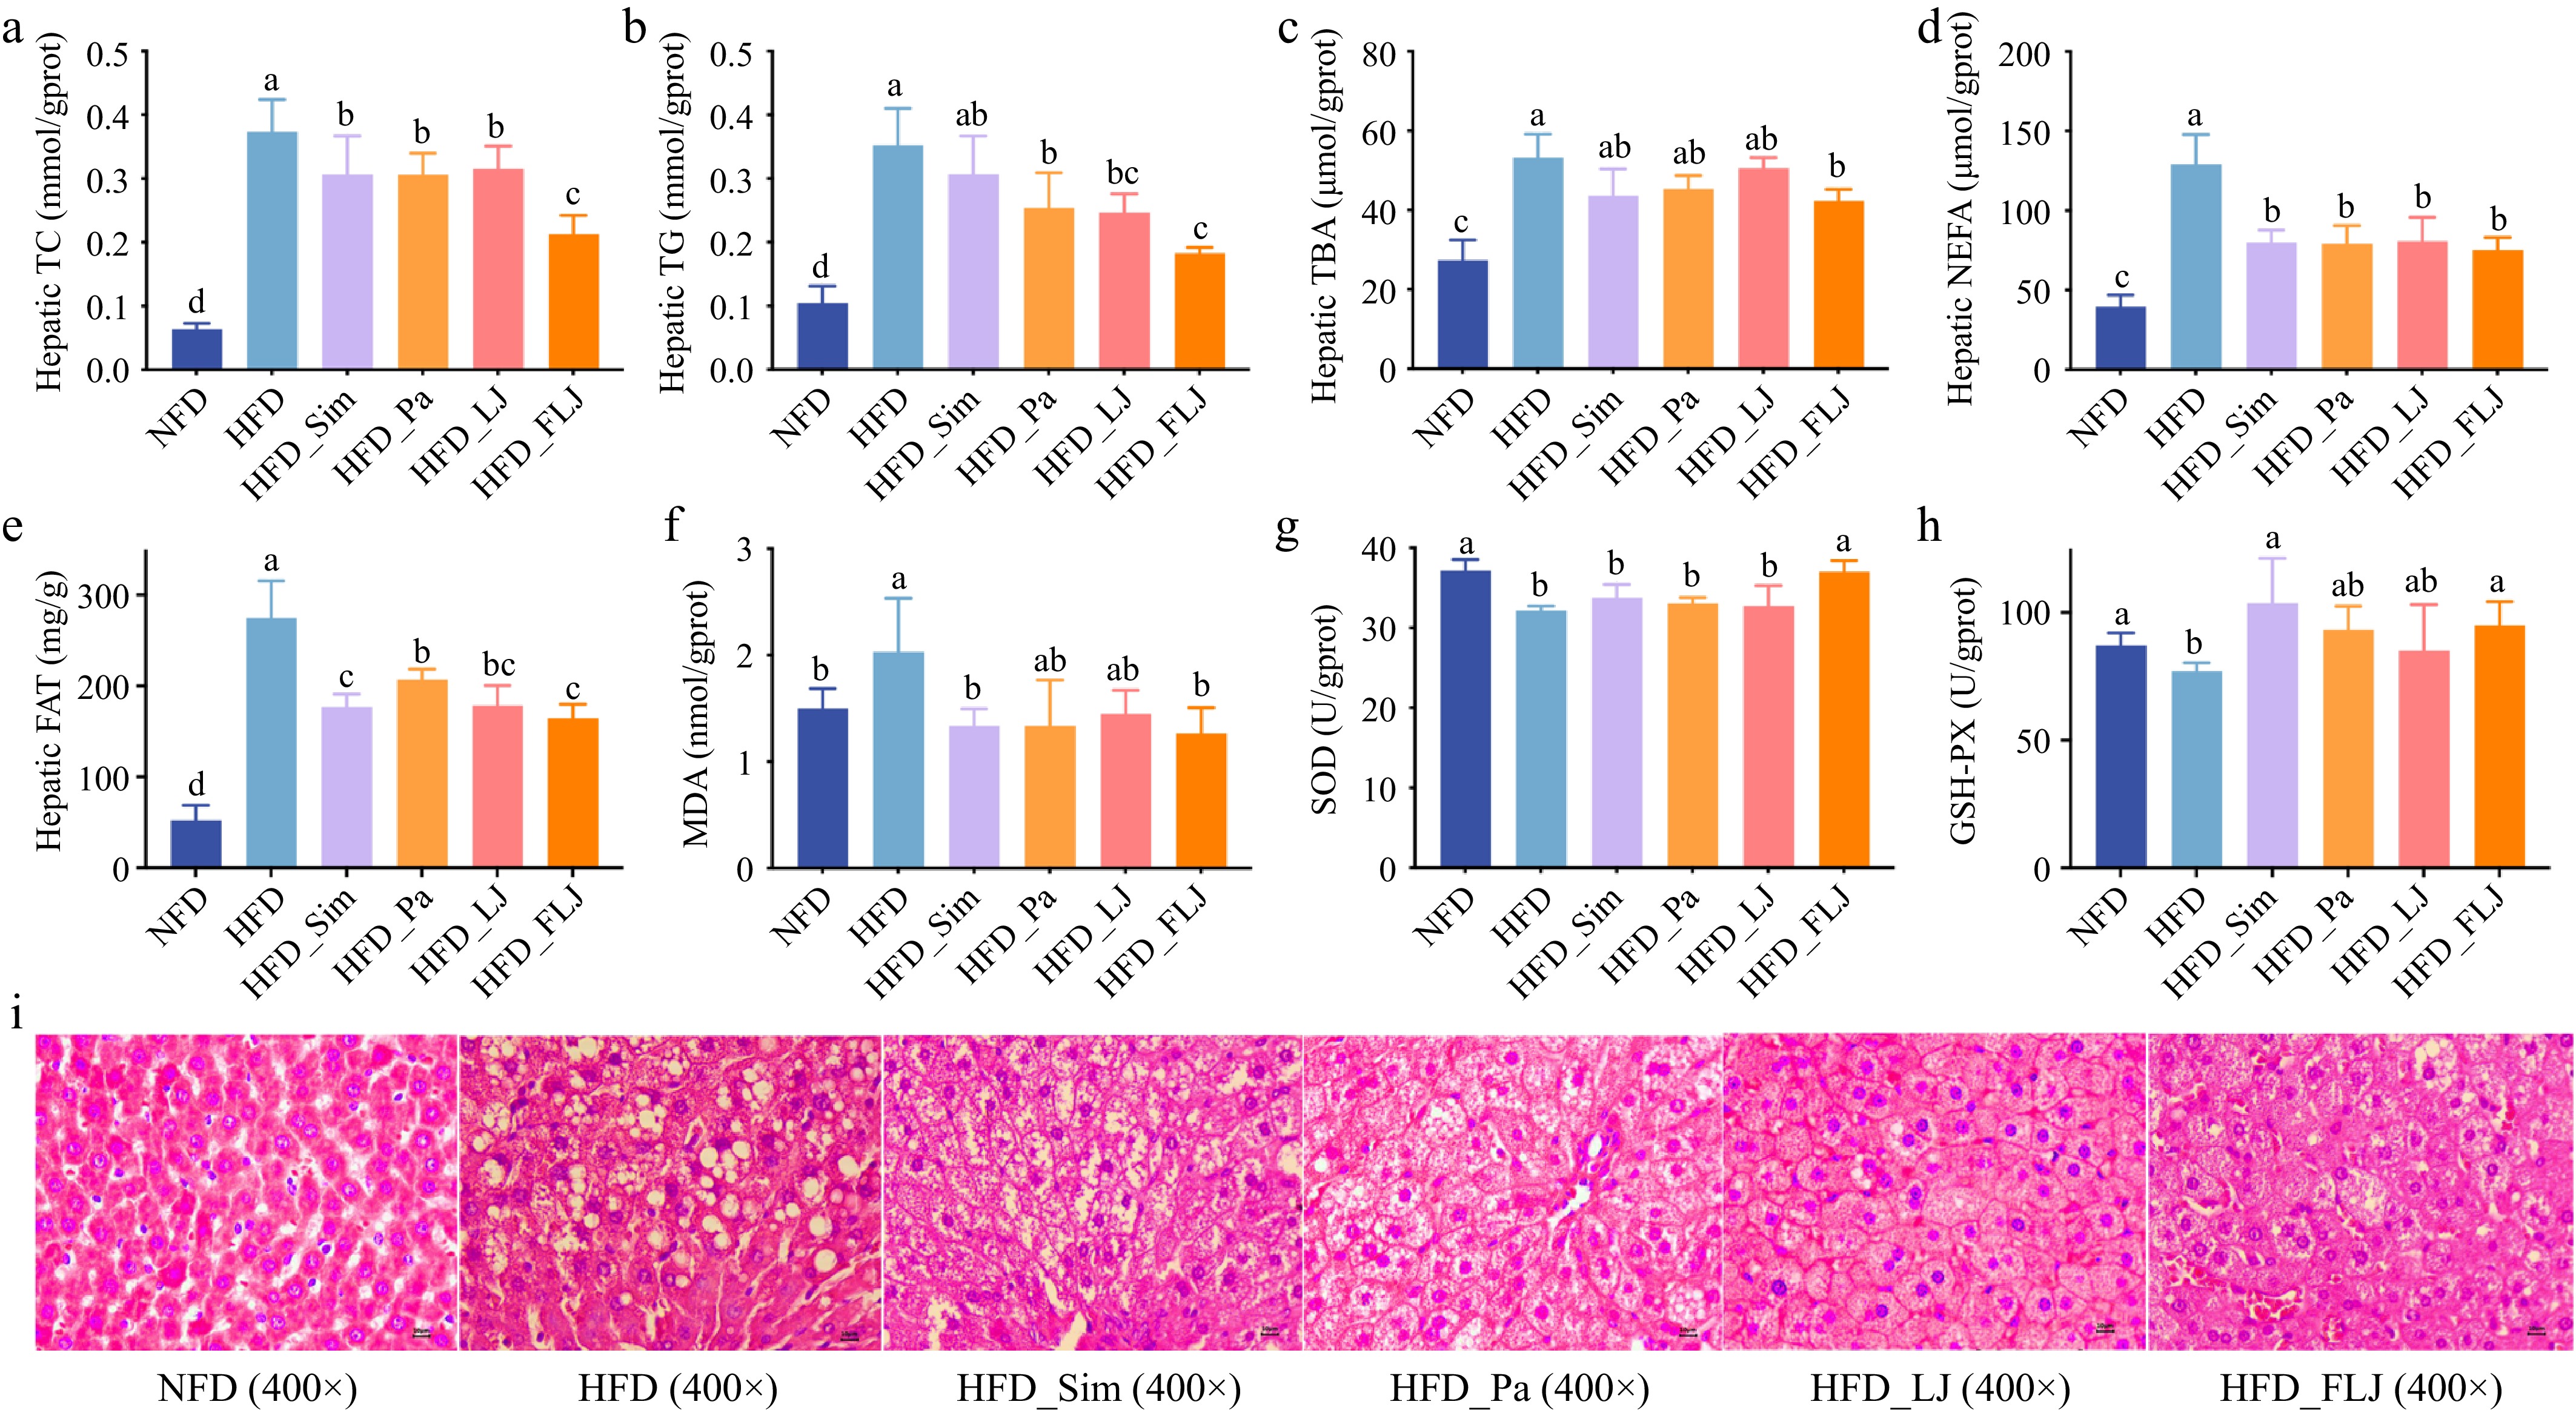
Figure 3.
The effect of the FLJ intervention on the liver parameters in NAFLD rats (n = 6). (a) Hepatic TC, (b) hepatic TG, (c) hepatic TBA, (d) hepatic NEFA, (e) hepatic FAT, (f) MDA, (g) SOD, (h) GSH-PX, and (i) H&E staining of liver tissues. Values are expressed as the mean ± SEM in each group. Different letters indicate significant differences among experimental groups (p < 0.05).
-
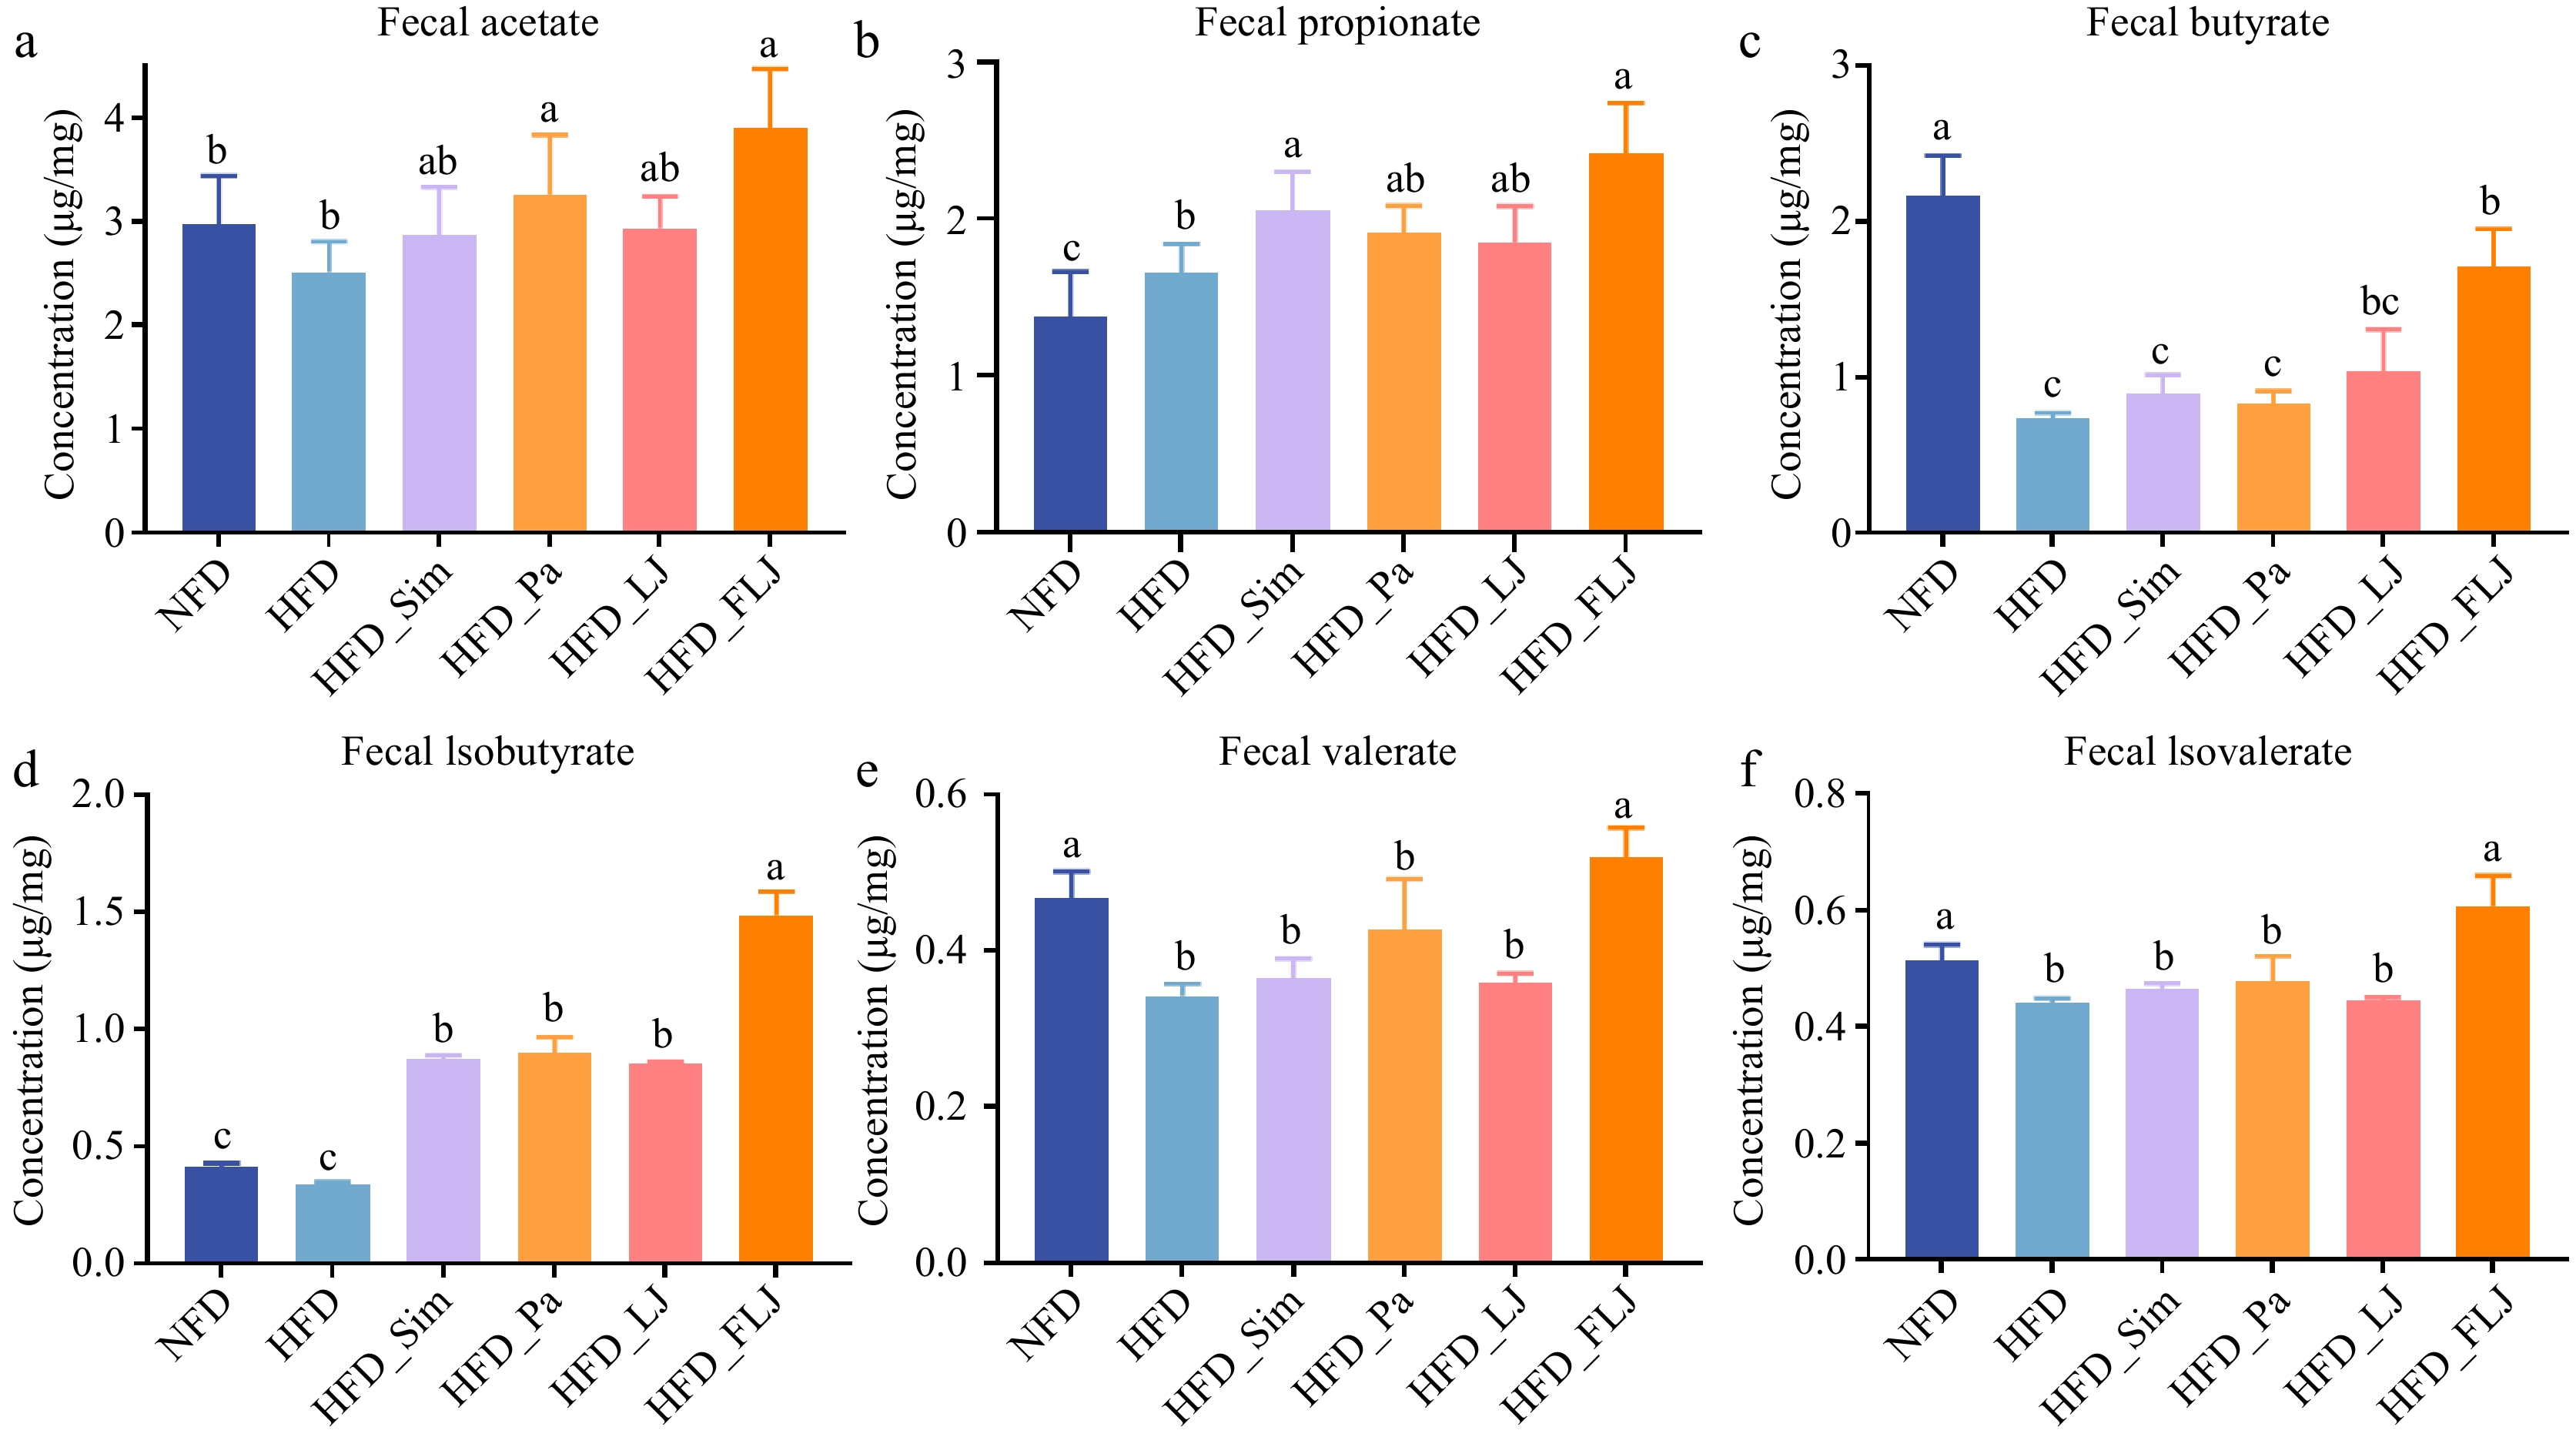
Figure 4.
The effect of the FLJ intervention on fecal SCFAs in NAFLD rats (n = 6). (a) Fecal acetate, (b) fecal propionate, (c) fecal butyrate, (d) fecal isobutyrate, (e) fecal valerate, and (f) fecal isovalerate. The values are expressed as the mean ± SEM in each group. Different letters indicate significant differences among experimental groups (p < 0.05).
-
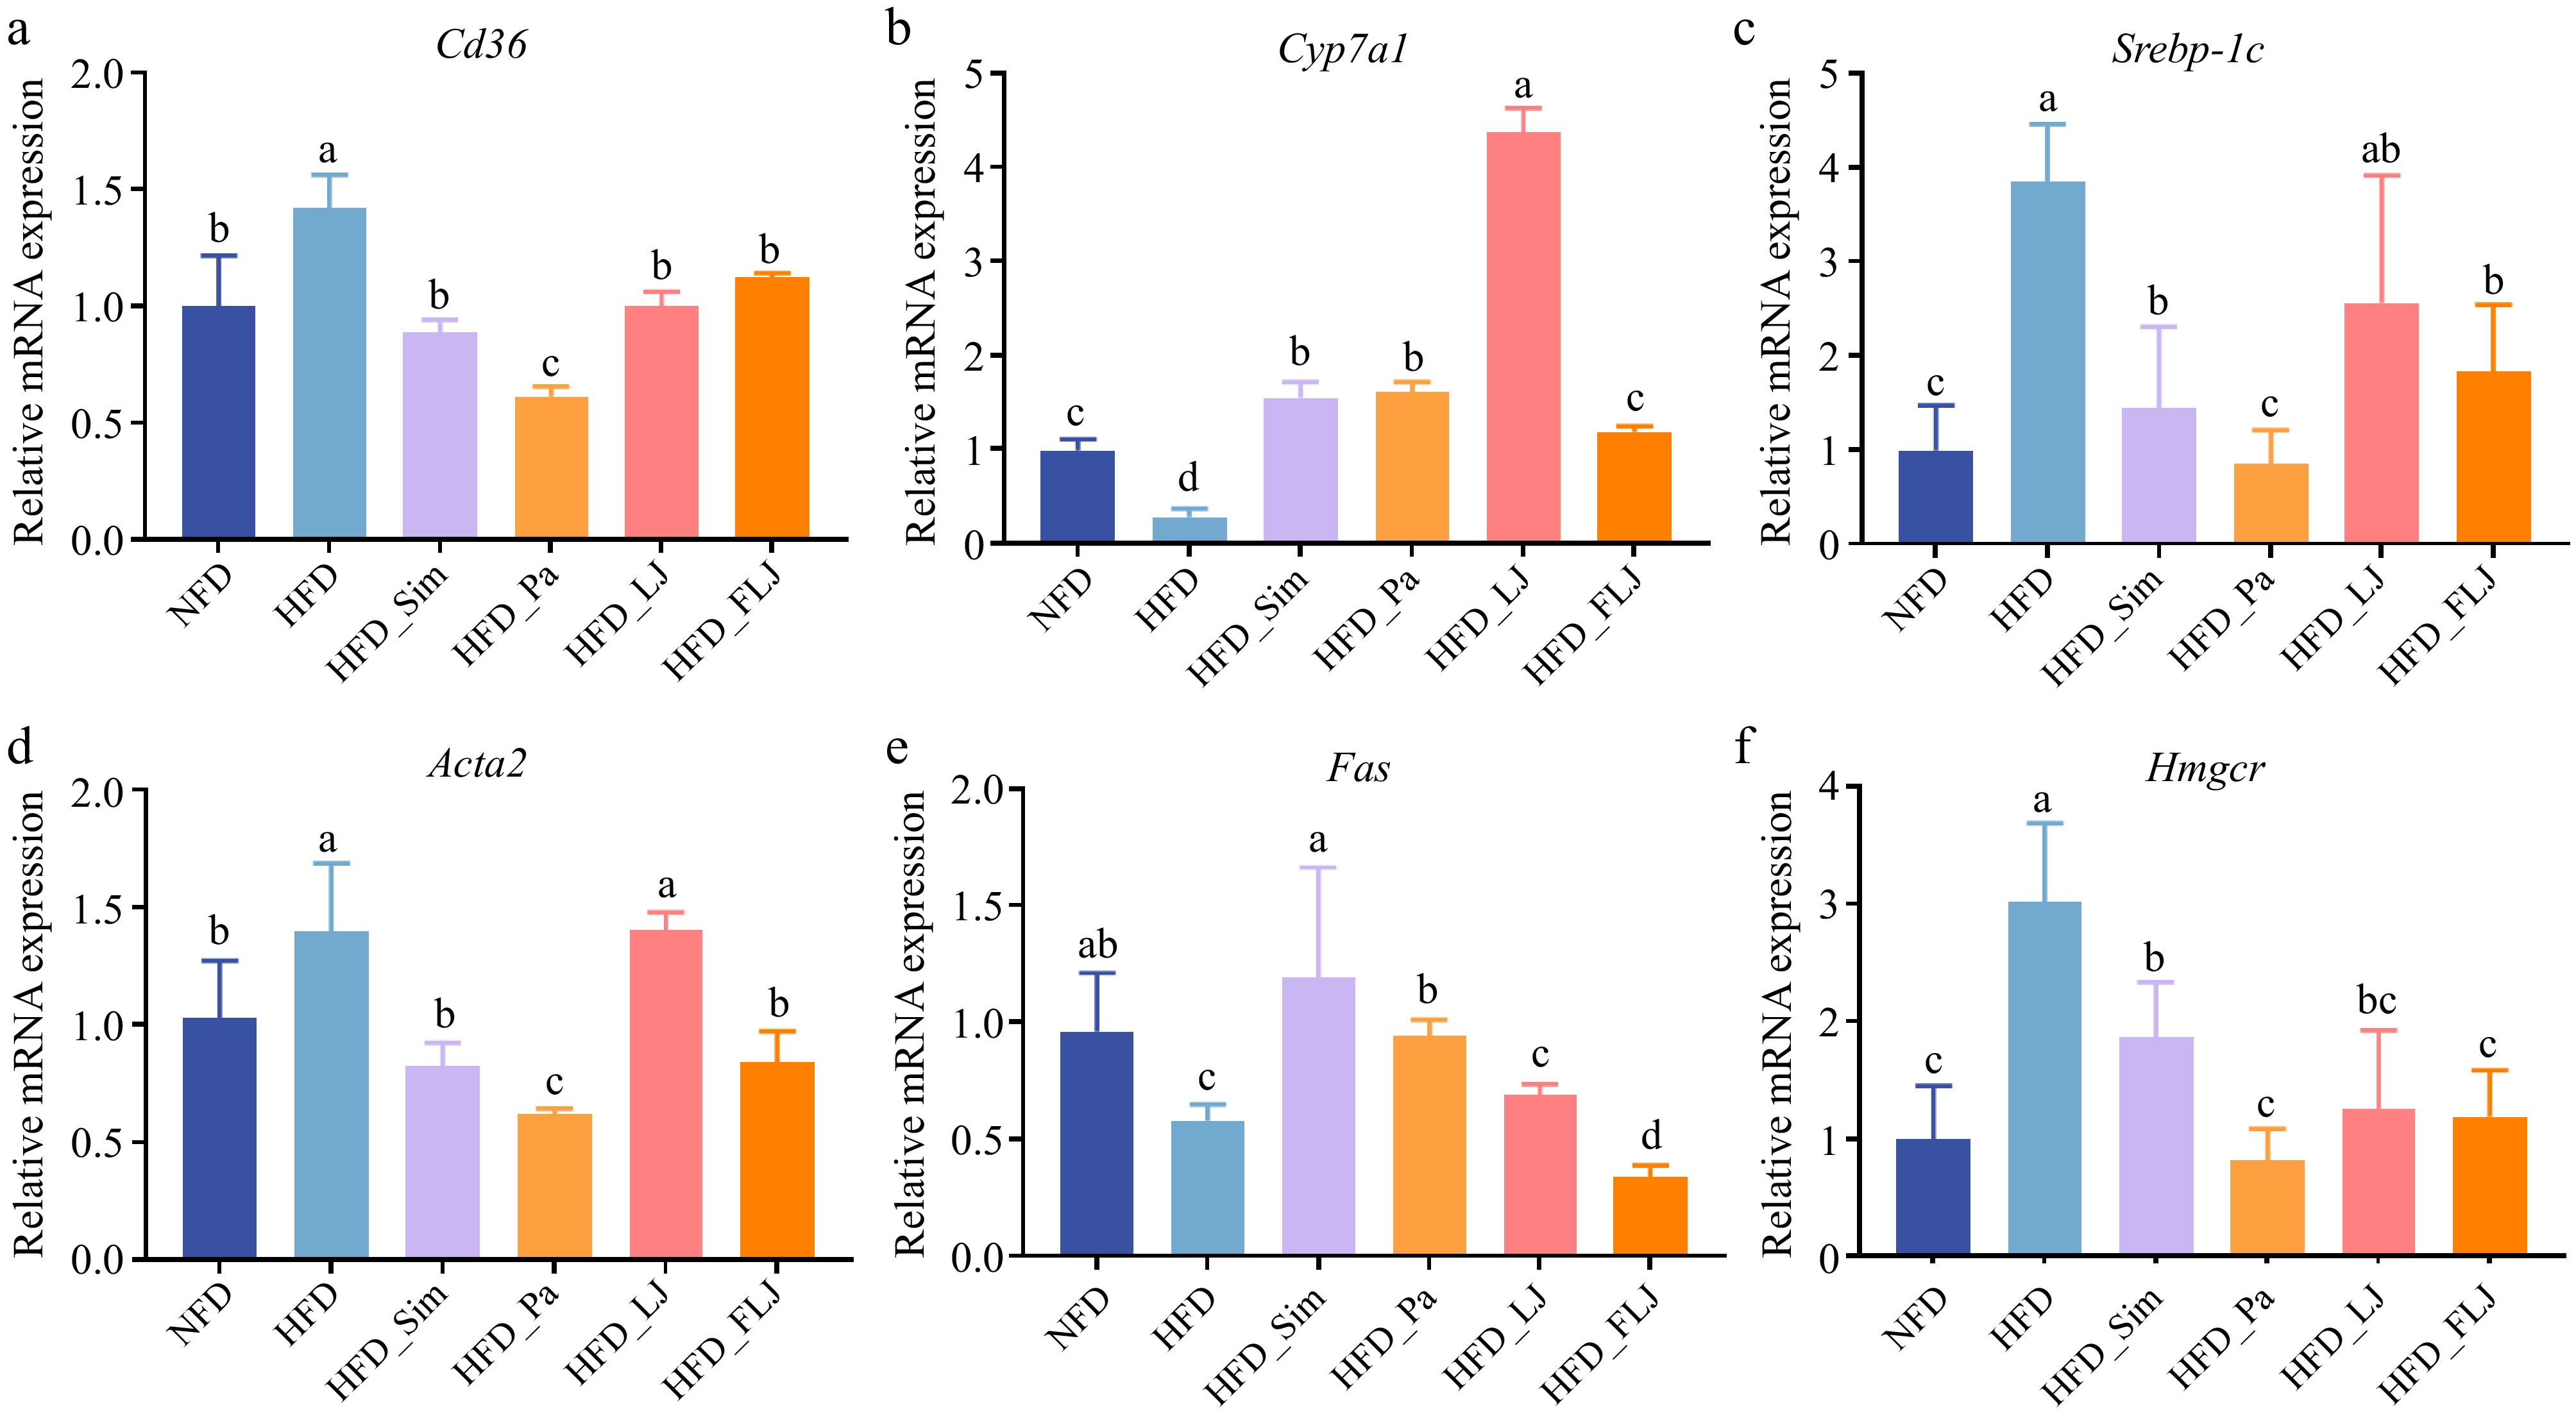
Figure 5.
The effect of the FLJ intervention on the mRNA expression levels of (a) Cd36, (b) Cyp7a1, (c) Srebp-1c, (d) Acat2, (e) Fas, and (f) Hmgcr in NAFLD rats (n = 3). Values are expressed as the mean ± SEM in each group. Different letters indicate significant differences among experimental groups (p < 0.05).
-
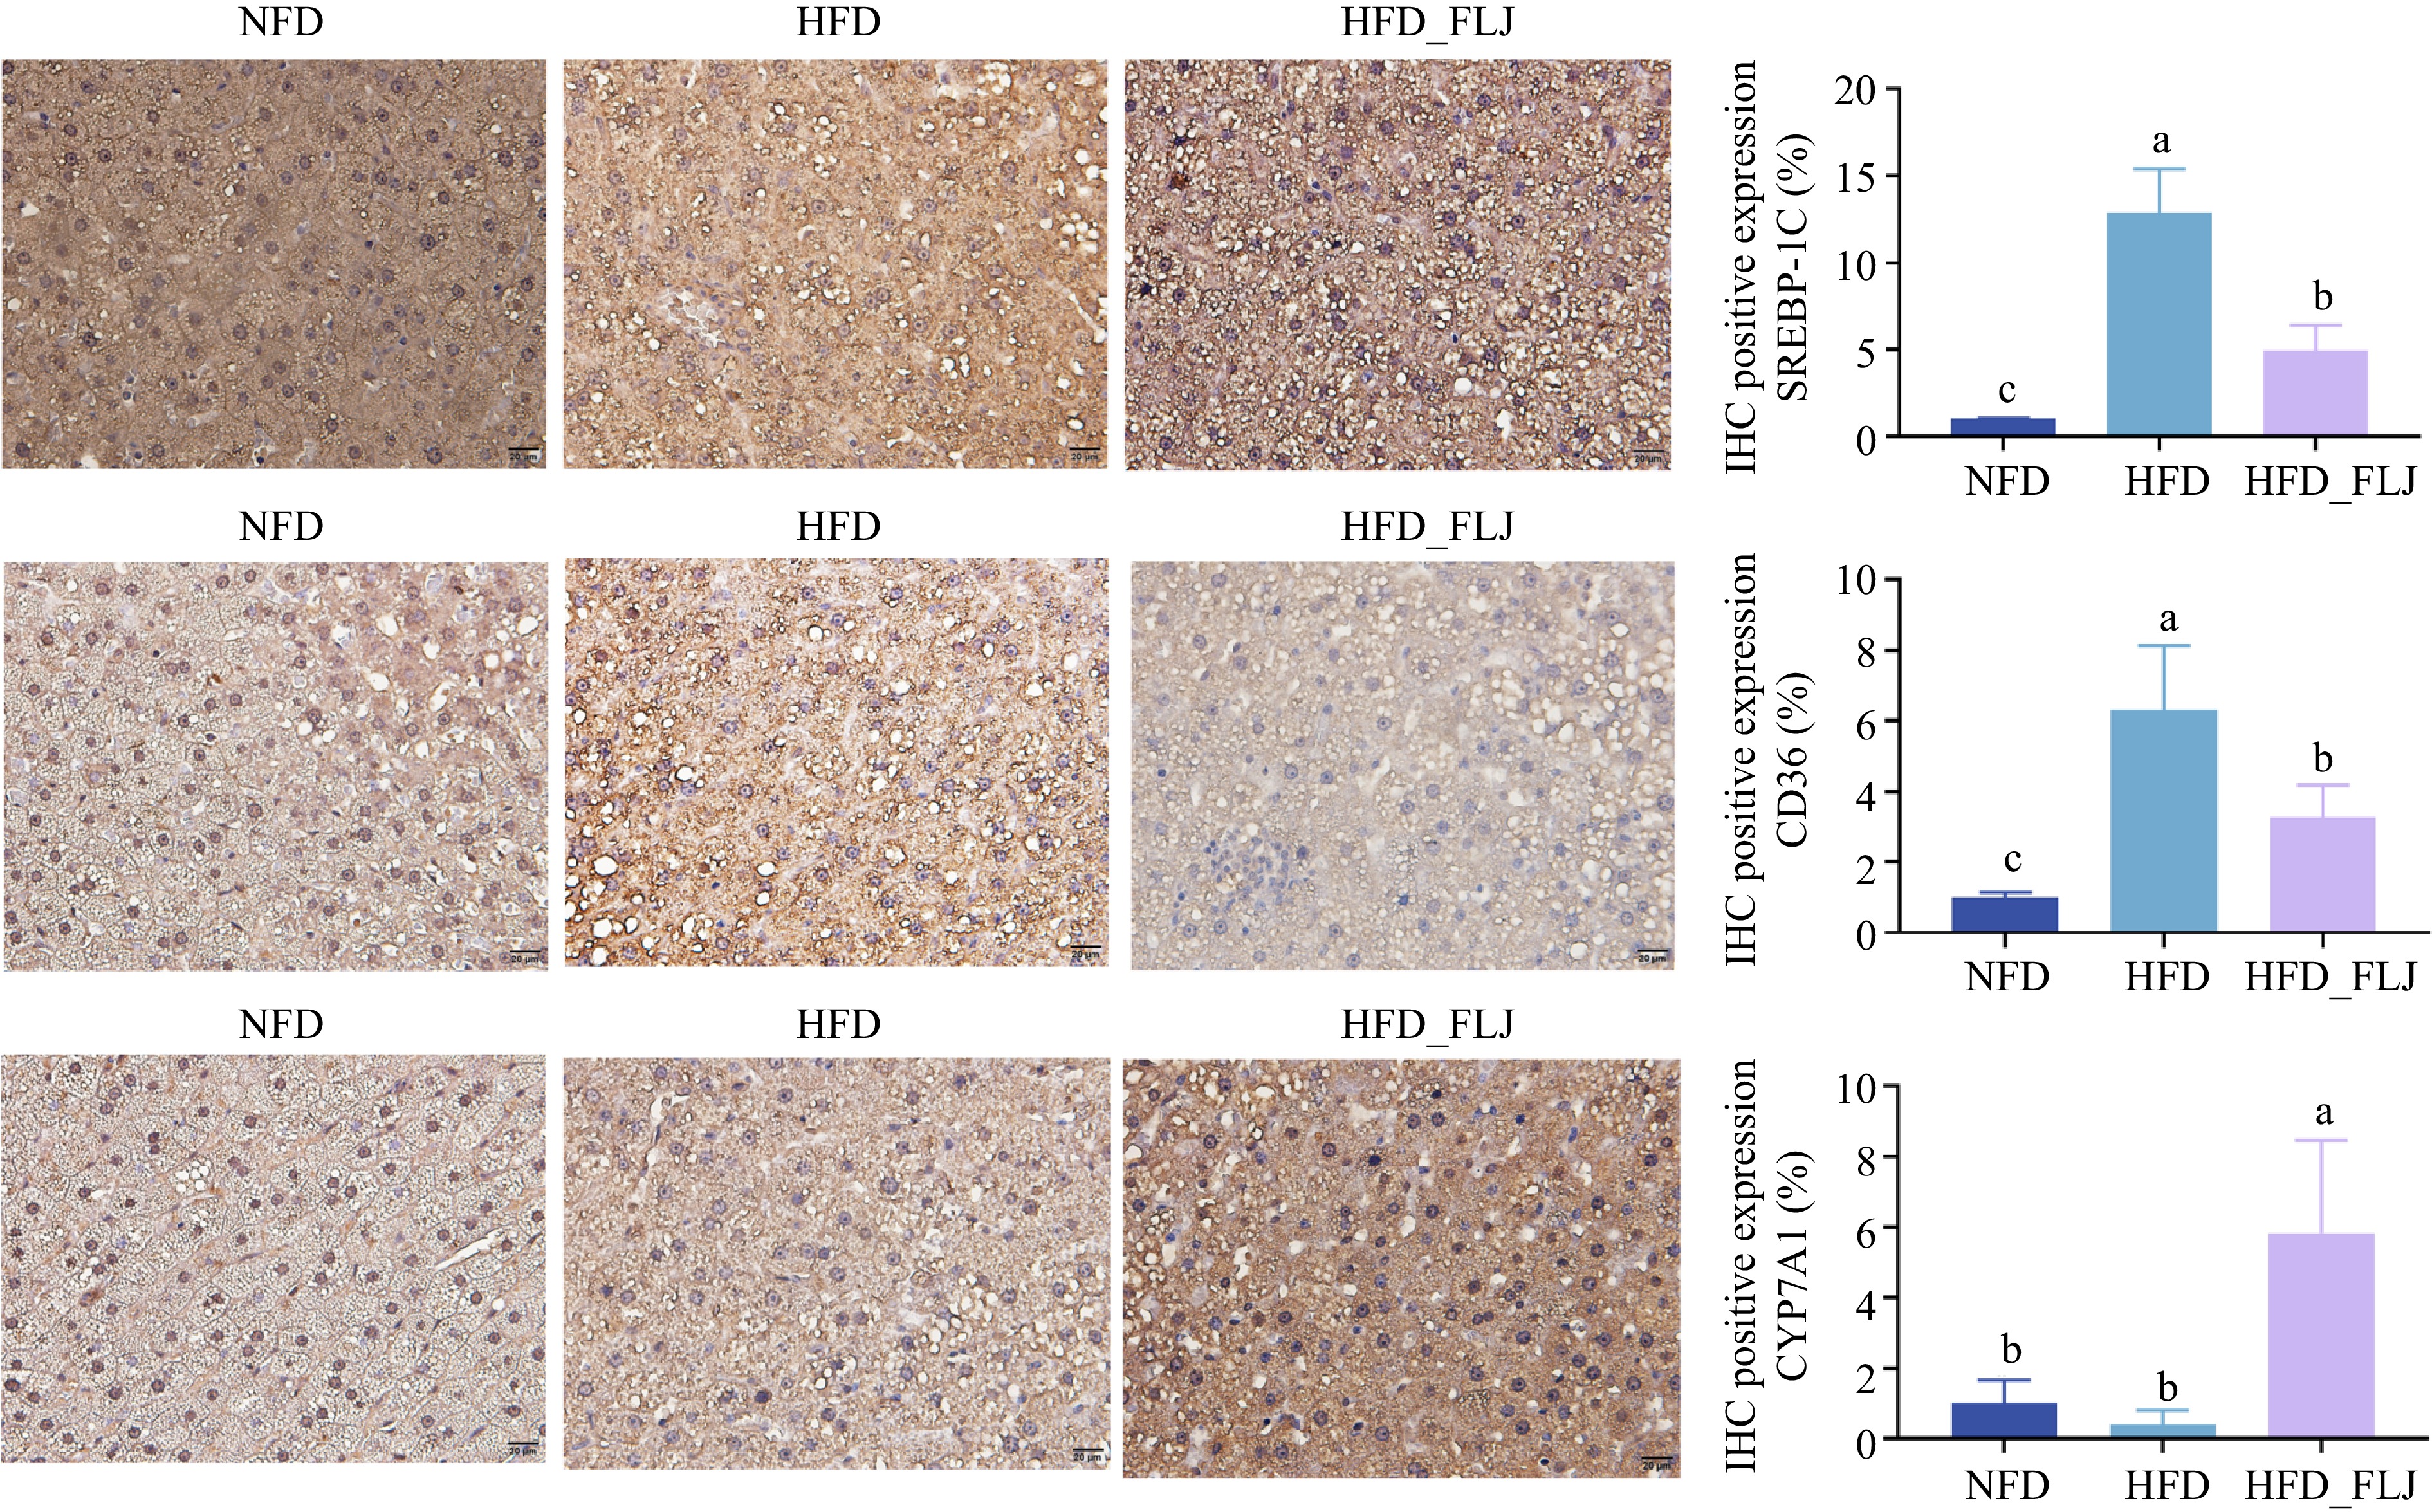
Figure 6.
Immunohistochemical staining for key proteins: (a) SREBP-1C, (b) CD36, and (c) CYP7A1 expression levels in the liver. Brown color (positive) shows the expression of the proteins SREBP-1C, CD36, and CYP7A1 in the cells. Quantification of the expression levels of SREBP-1C, CD36, and CYP7A1 by IHC are also shown on the right (n = 3). Values are expressed as the mean ± SEM in each group. Different letters indicate significant differences among experimental groups (p < 0.05).
-
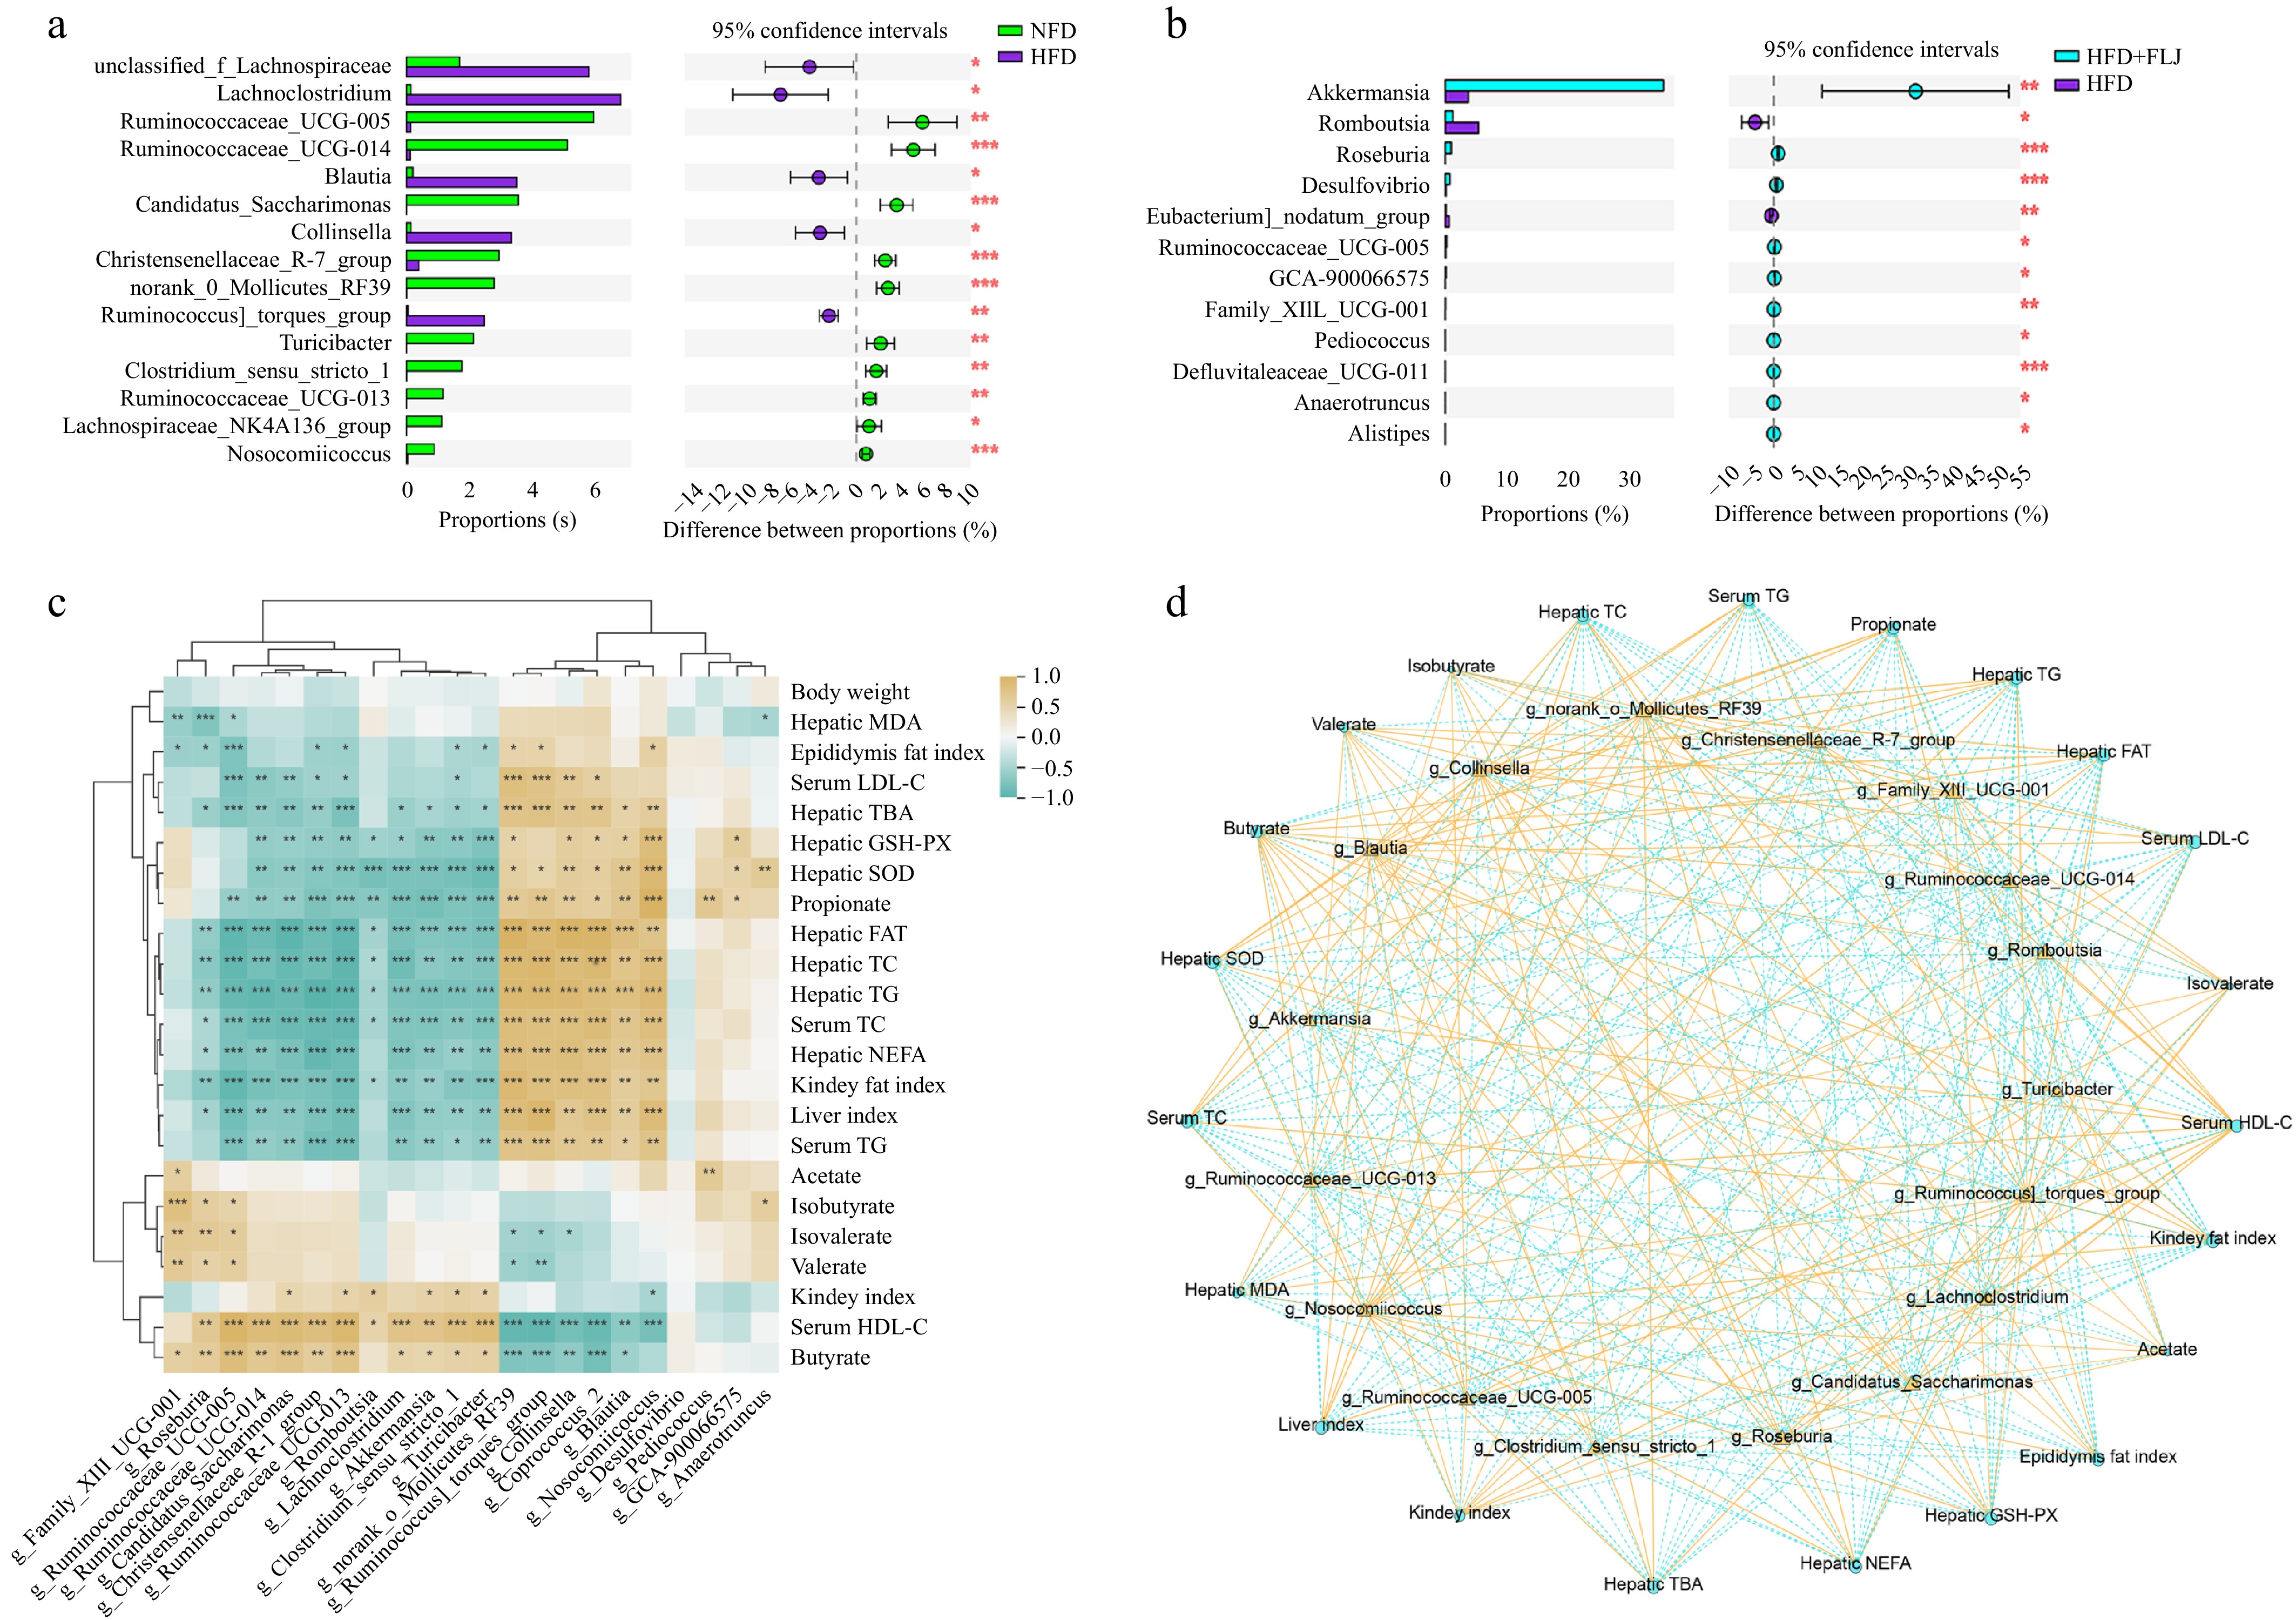
Figure 7.
Extended error bar plot showing differences in the mean proportions of significantly altered genera (Student's t-test) and Spearman correlations between altered fecal microbial phylotypes and lipid metabolic parameters. (a) NFD group vs. HFD group; (b) HFD group vs. HFD_FLJ group. (c) Spearman's correlation heatmap. (d) Visualization of the correlation network between the key intestinal microbial species and lipid metabolism-related parameters. Values are expressed as the mean ± SEM (n = 6). * p < 0.05, ** p < 0.01 and *** p < 0.001.
-
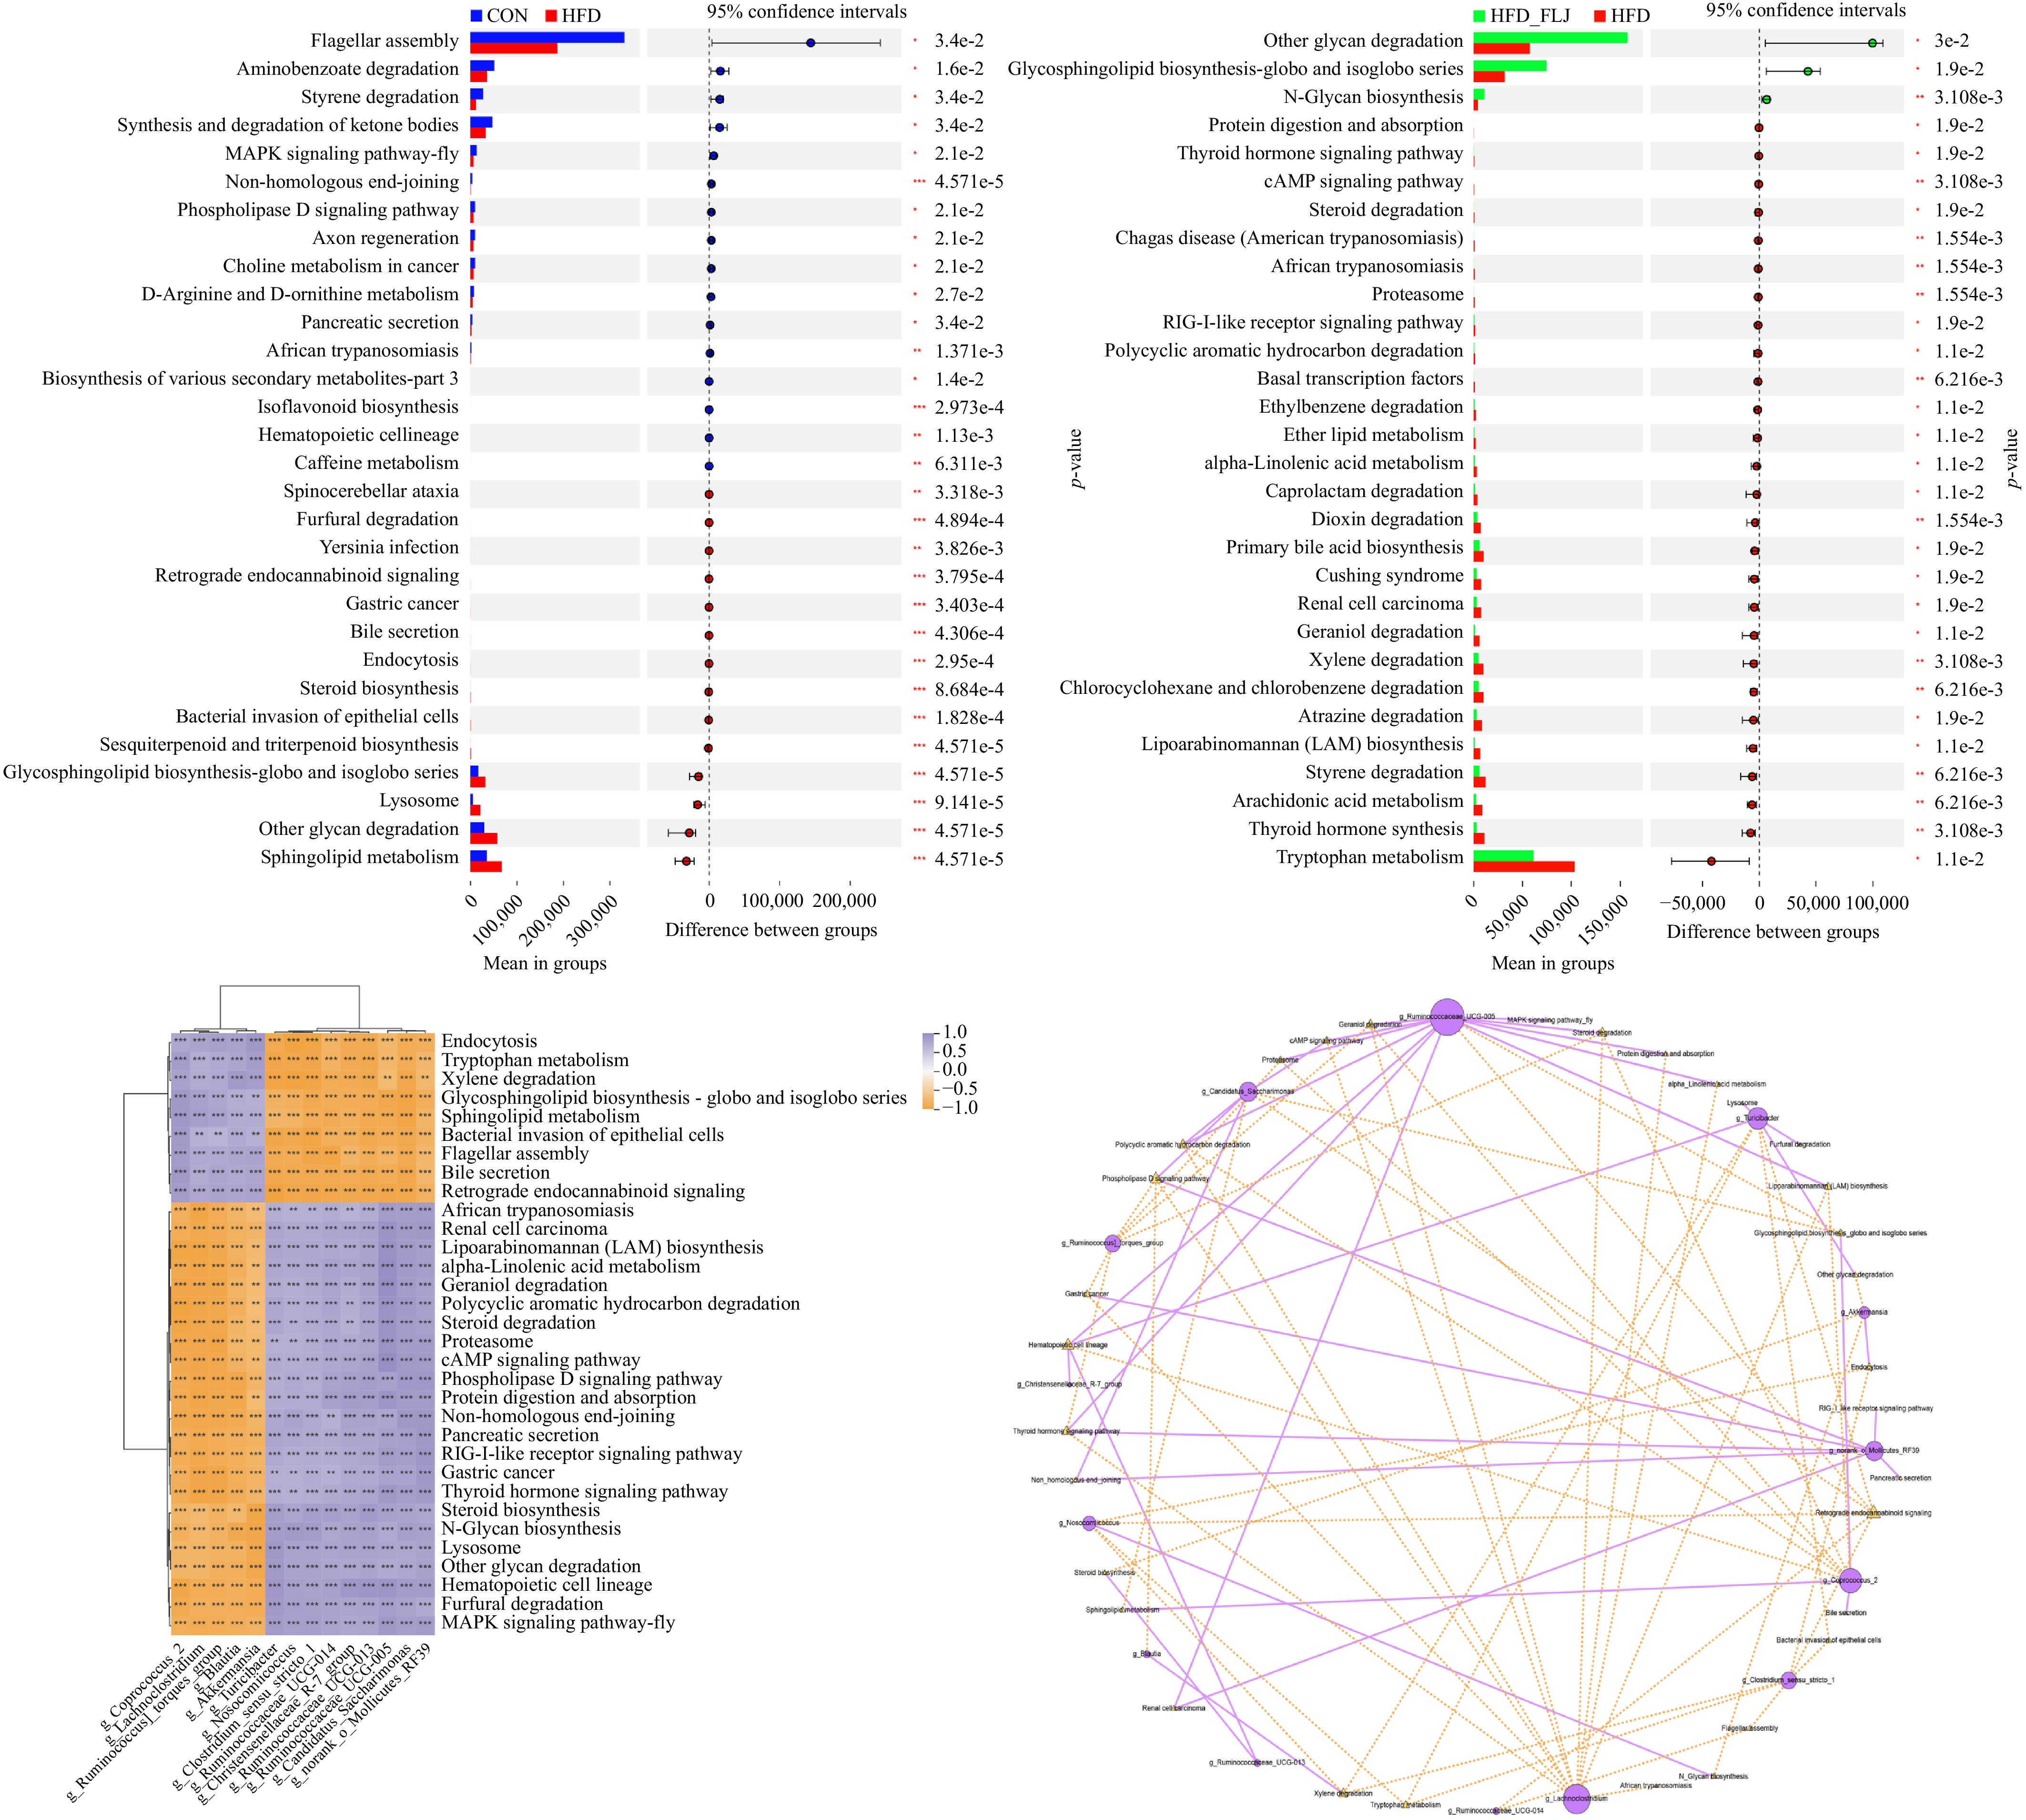
Figure 8.
Extended error bar plot showing differences in significantly and potentially altered metabolic functions of the gut microbia predicted by PICRUSt 3 (Student's t-test) and Spearman correlations between altered fecal microbial phylotypes and predicted metabolic pathways. (a) NFD group vs. HFD group; (b) HFD group vs. HFD_FLJ group. (c) Spearman’s correlation heatmap. (d) Co-occurrence network between the key intestinal microbial species and potentially predicted metabolic pathways. Values are expressed as the mean ± SEM in each group. * p < 0.05, ** p < 0.01 and *** p < 0.001.
Figures
(8)
Tables
(0)