-
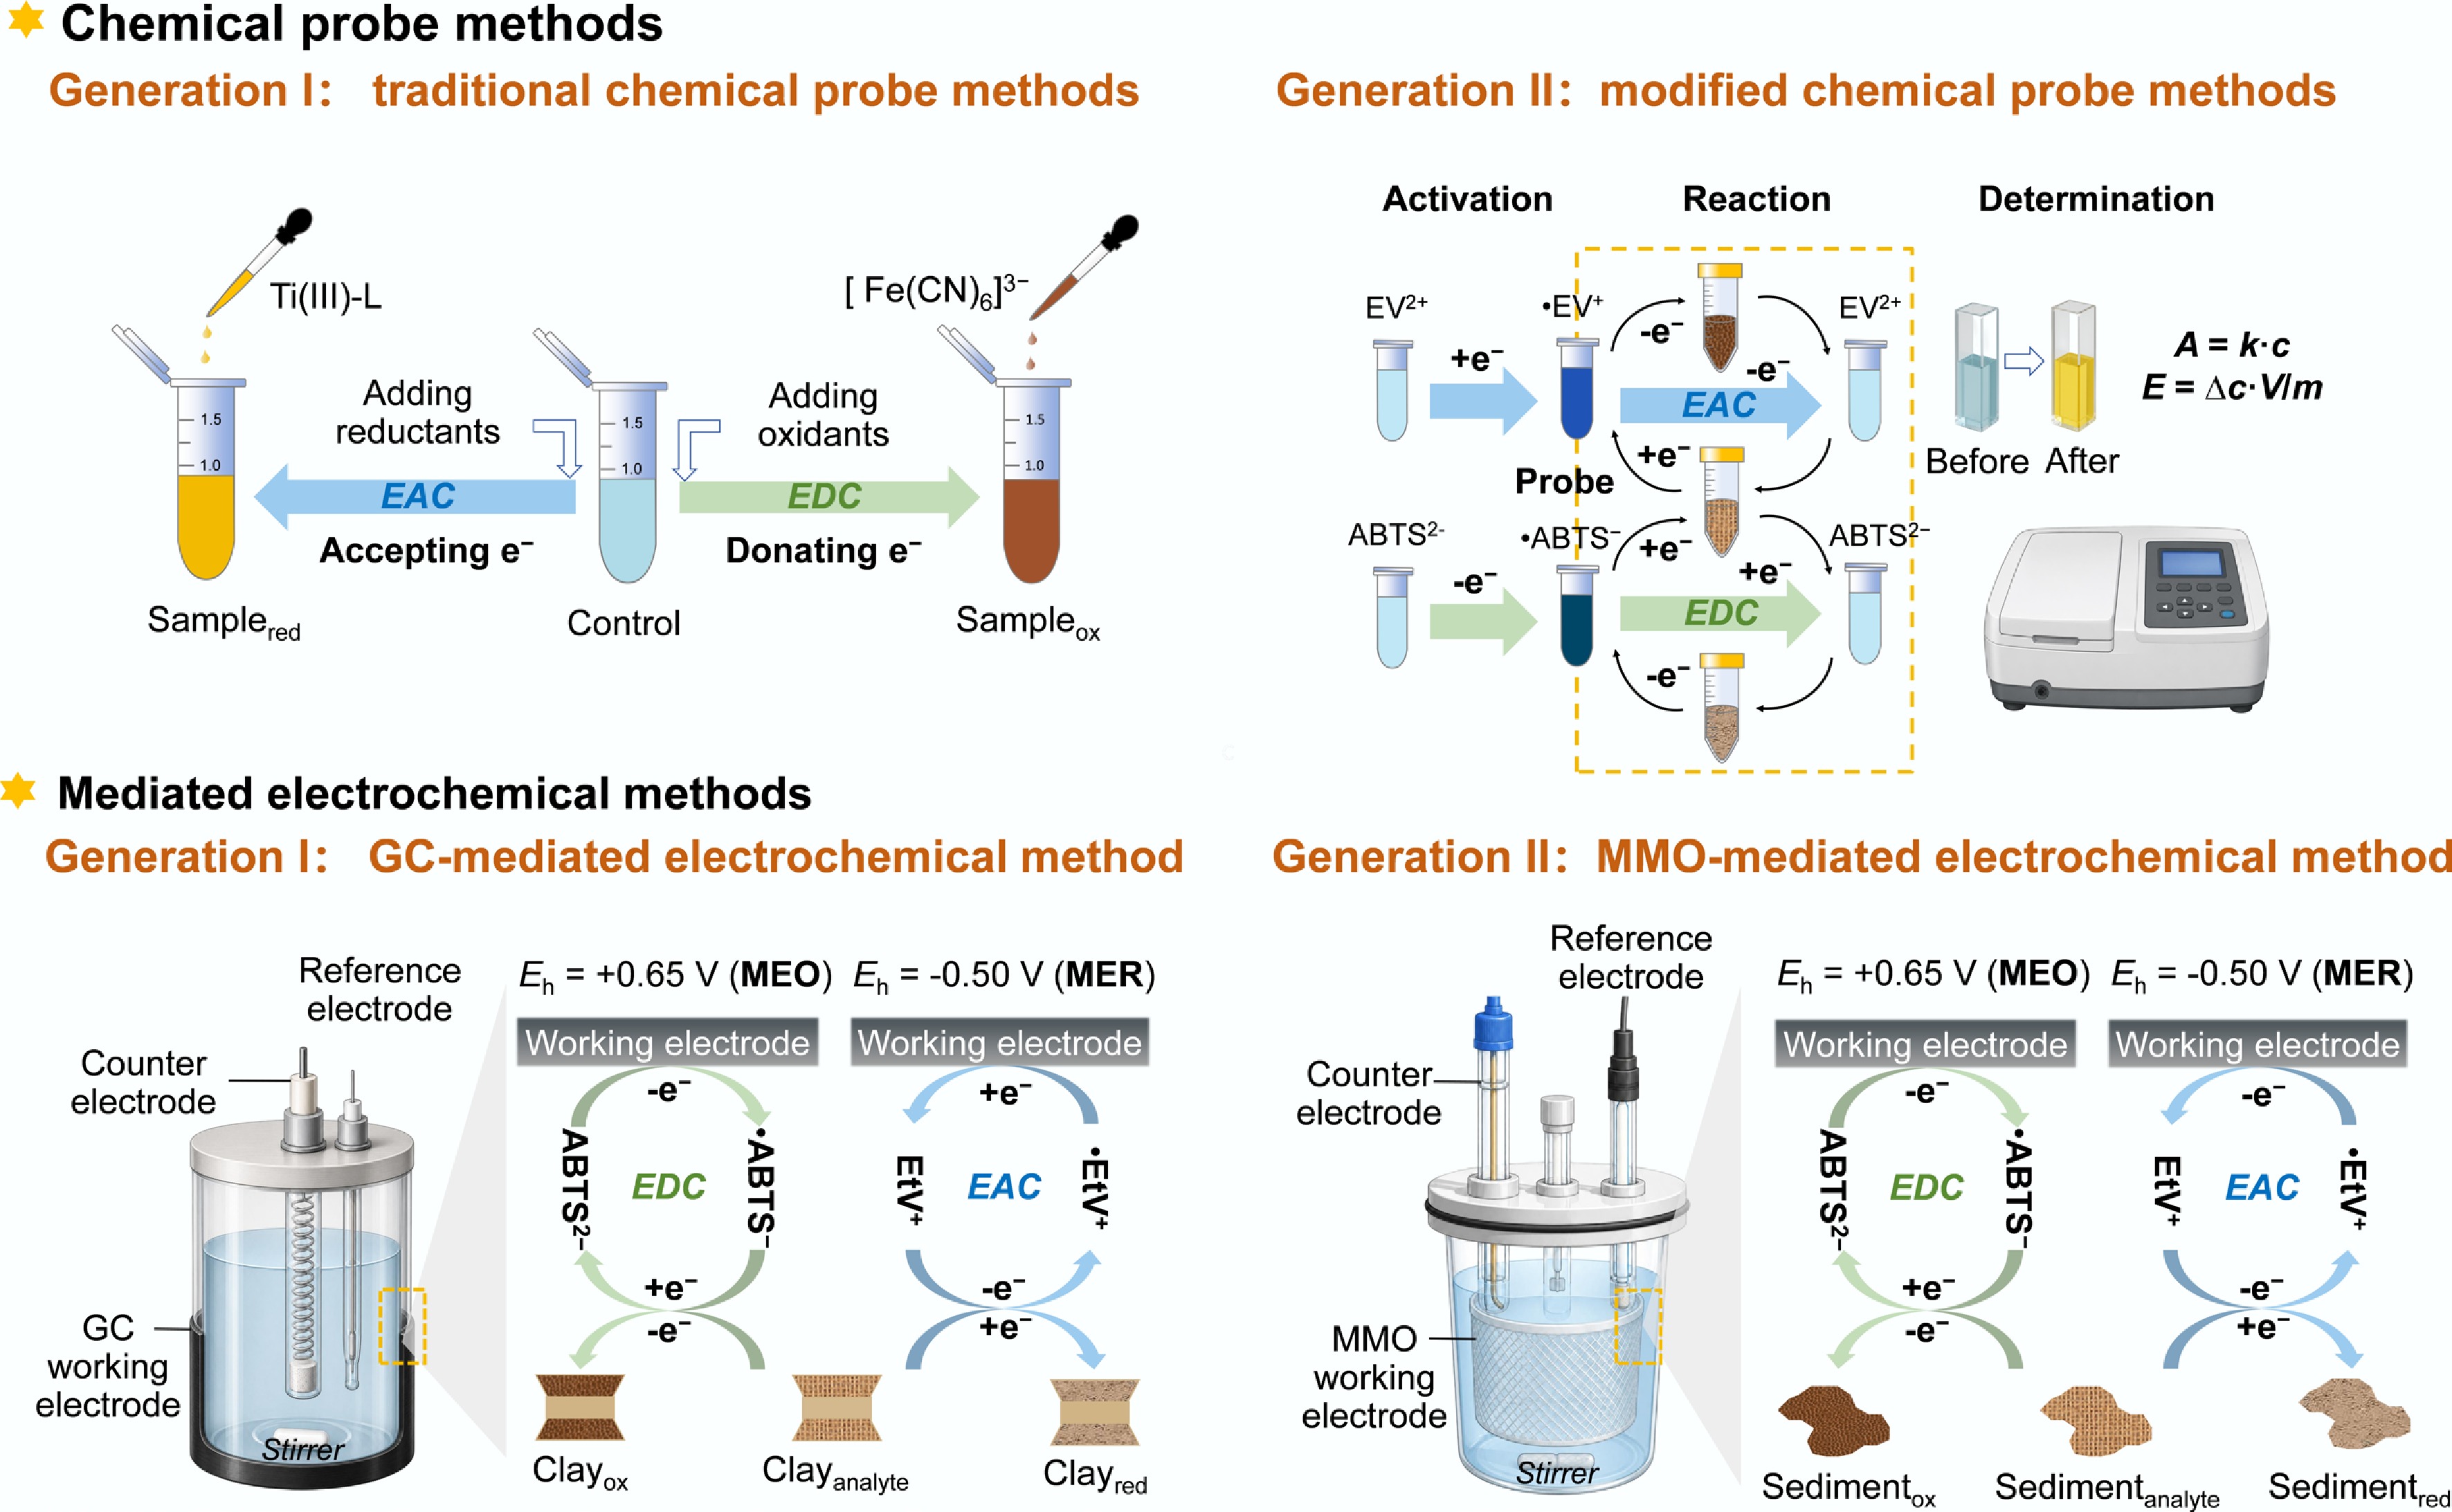
Figure 1.
EEC analysis by chemical probe methods and mediated electrochemical methods.
-
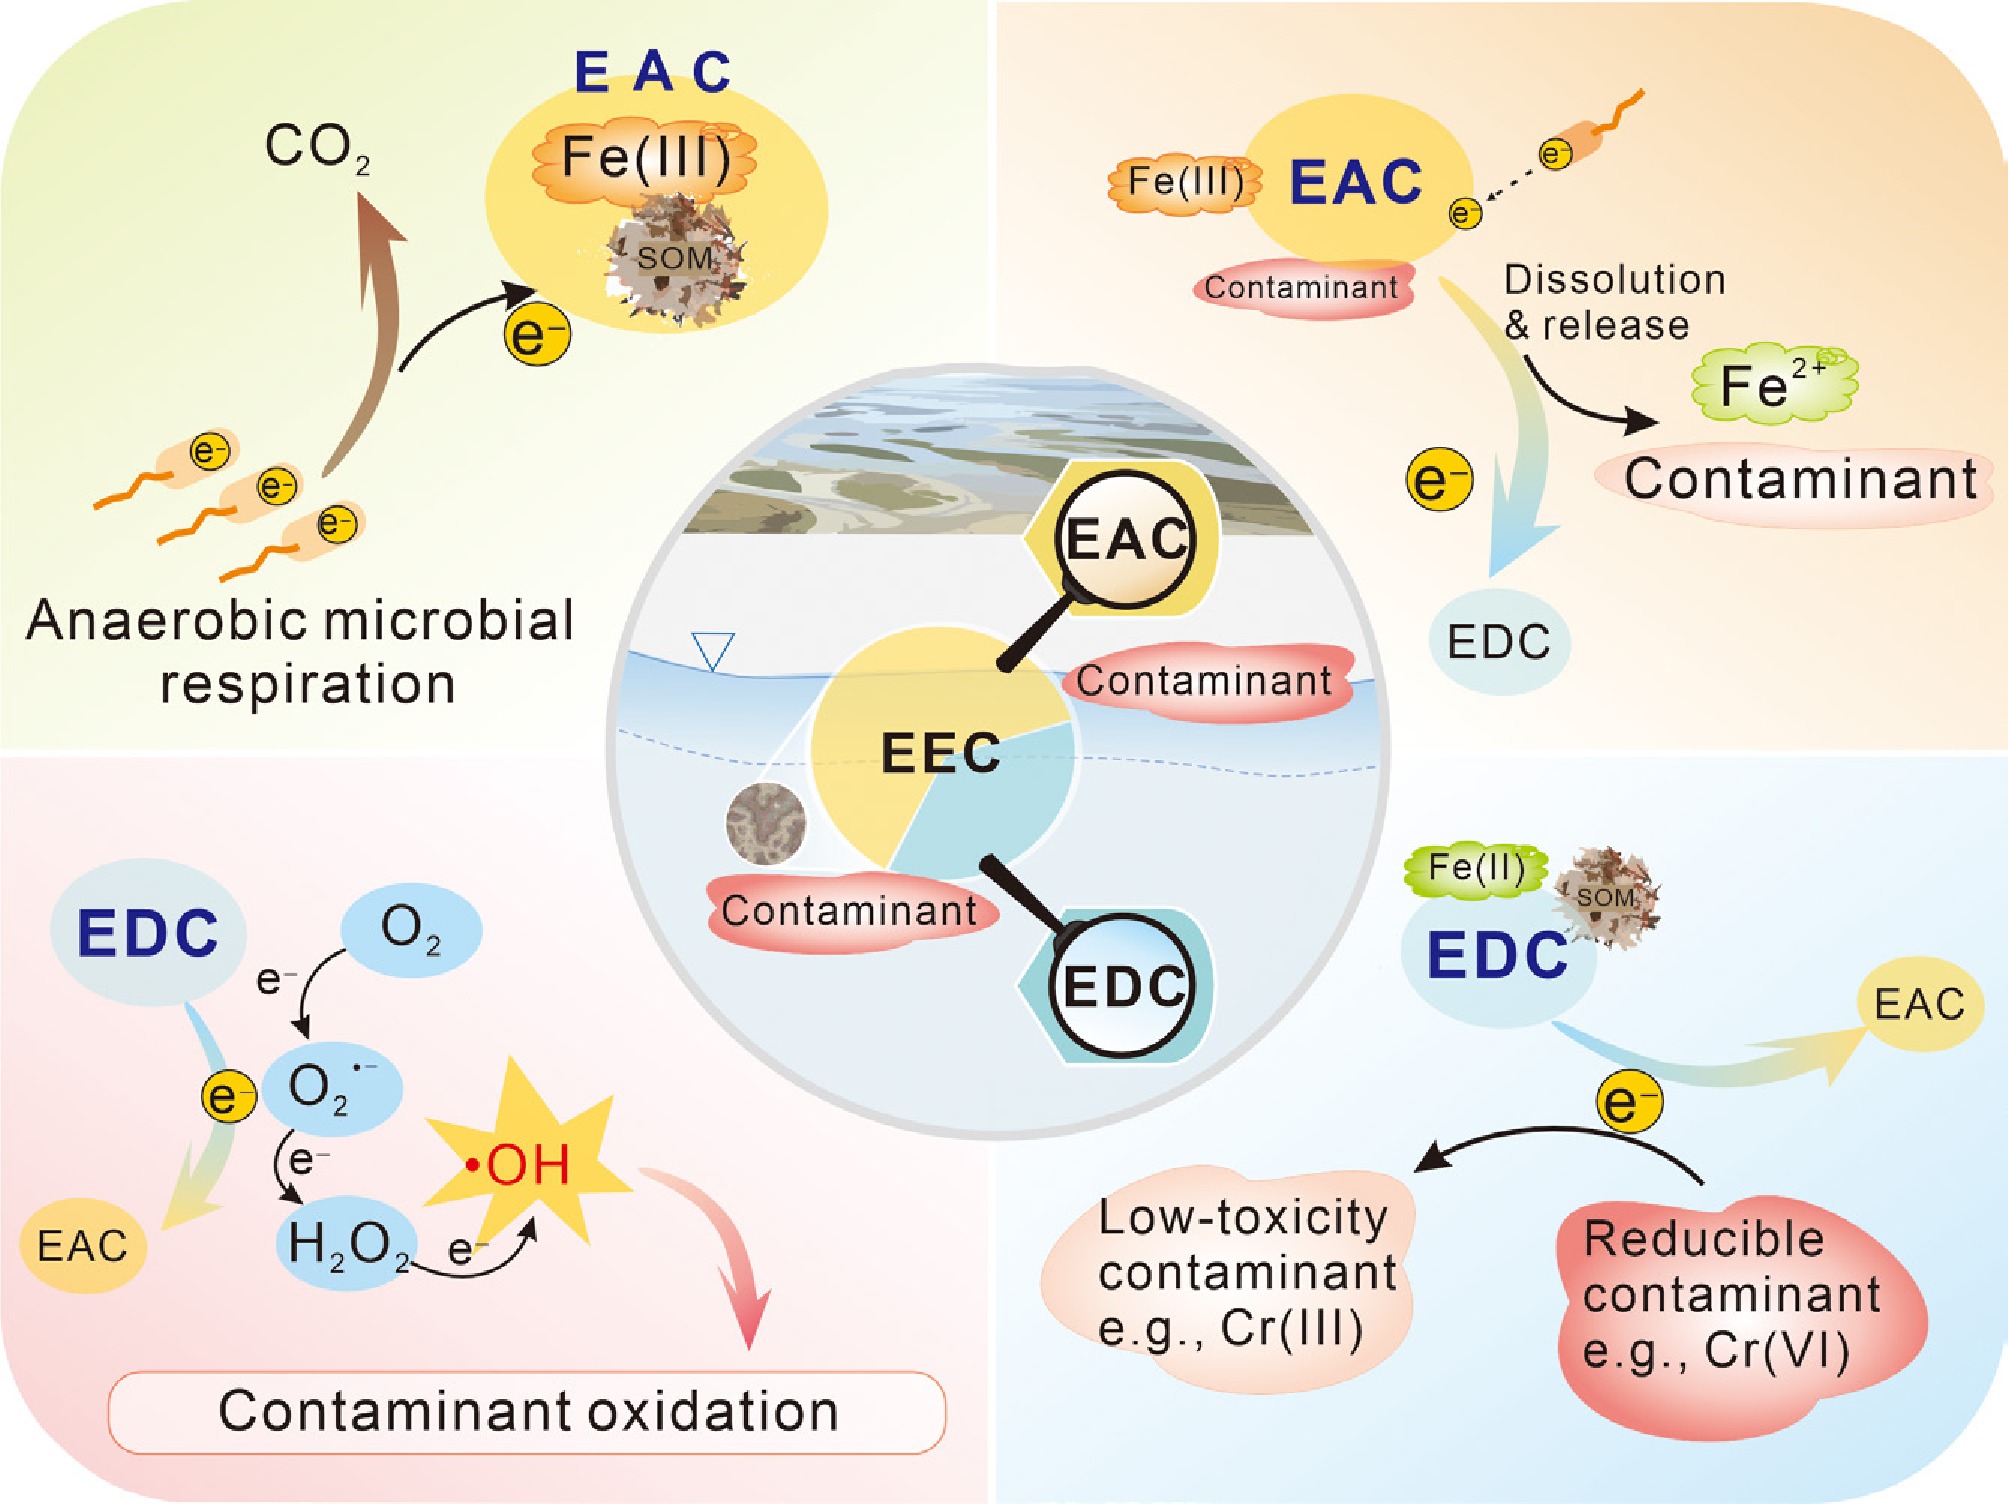
Figure 2.
Contaminant transport and transformation driven by EEC reactions in aquifers.
-
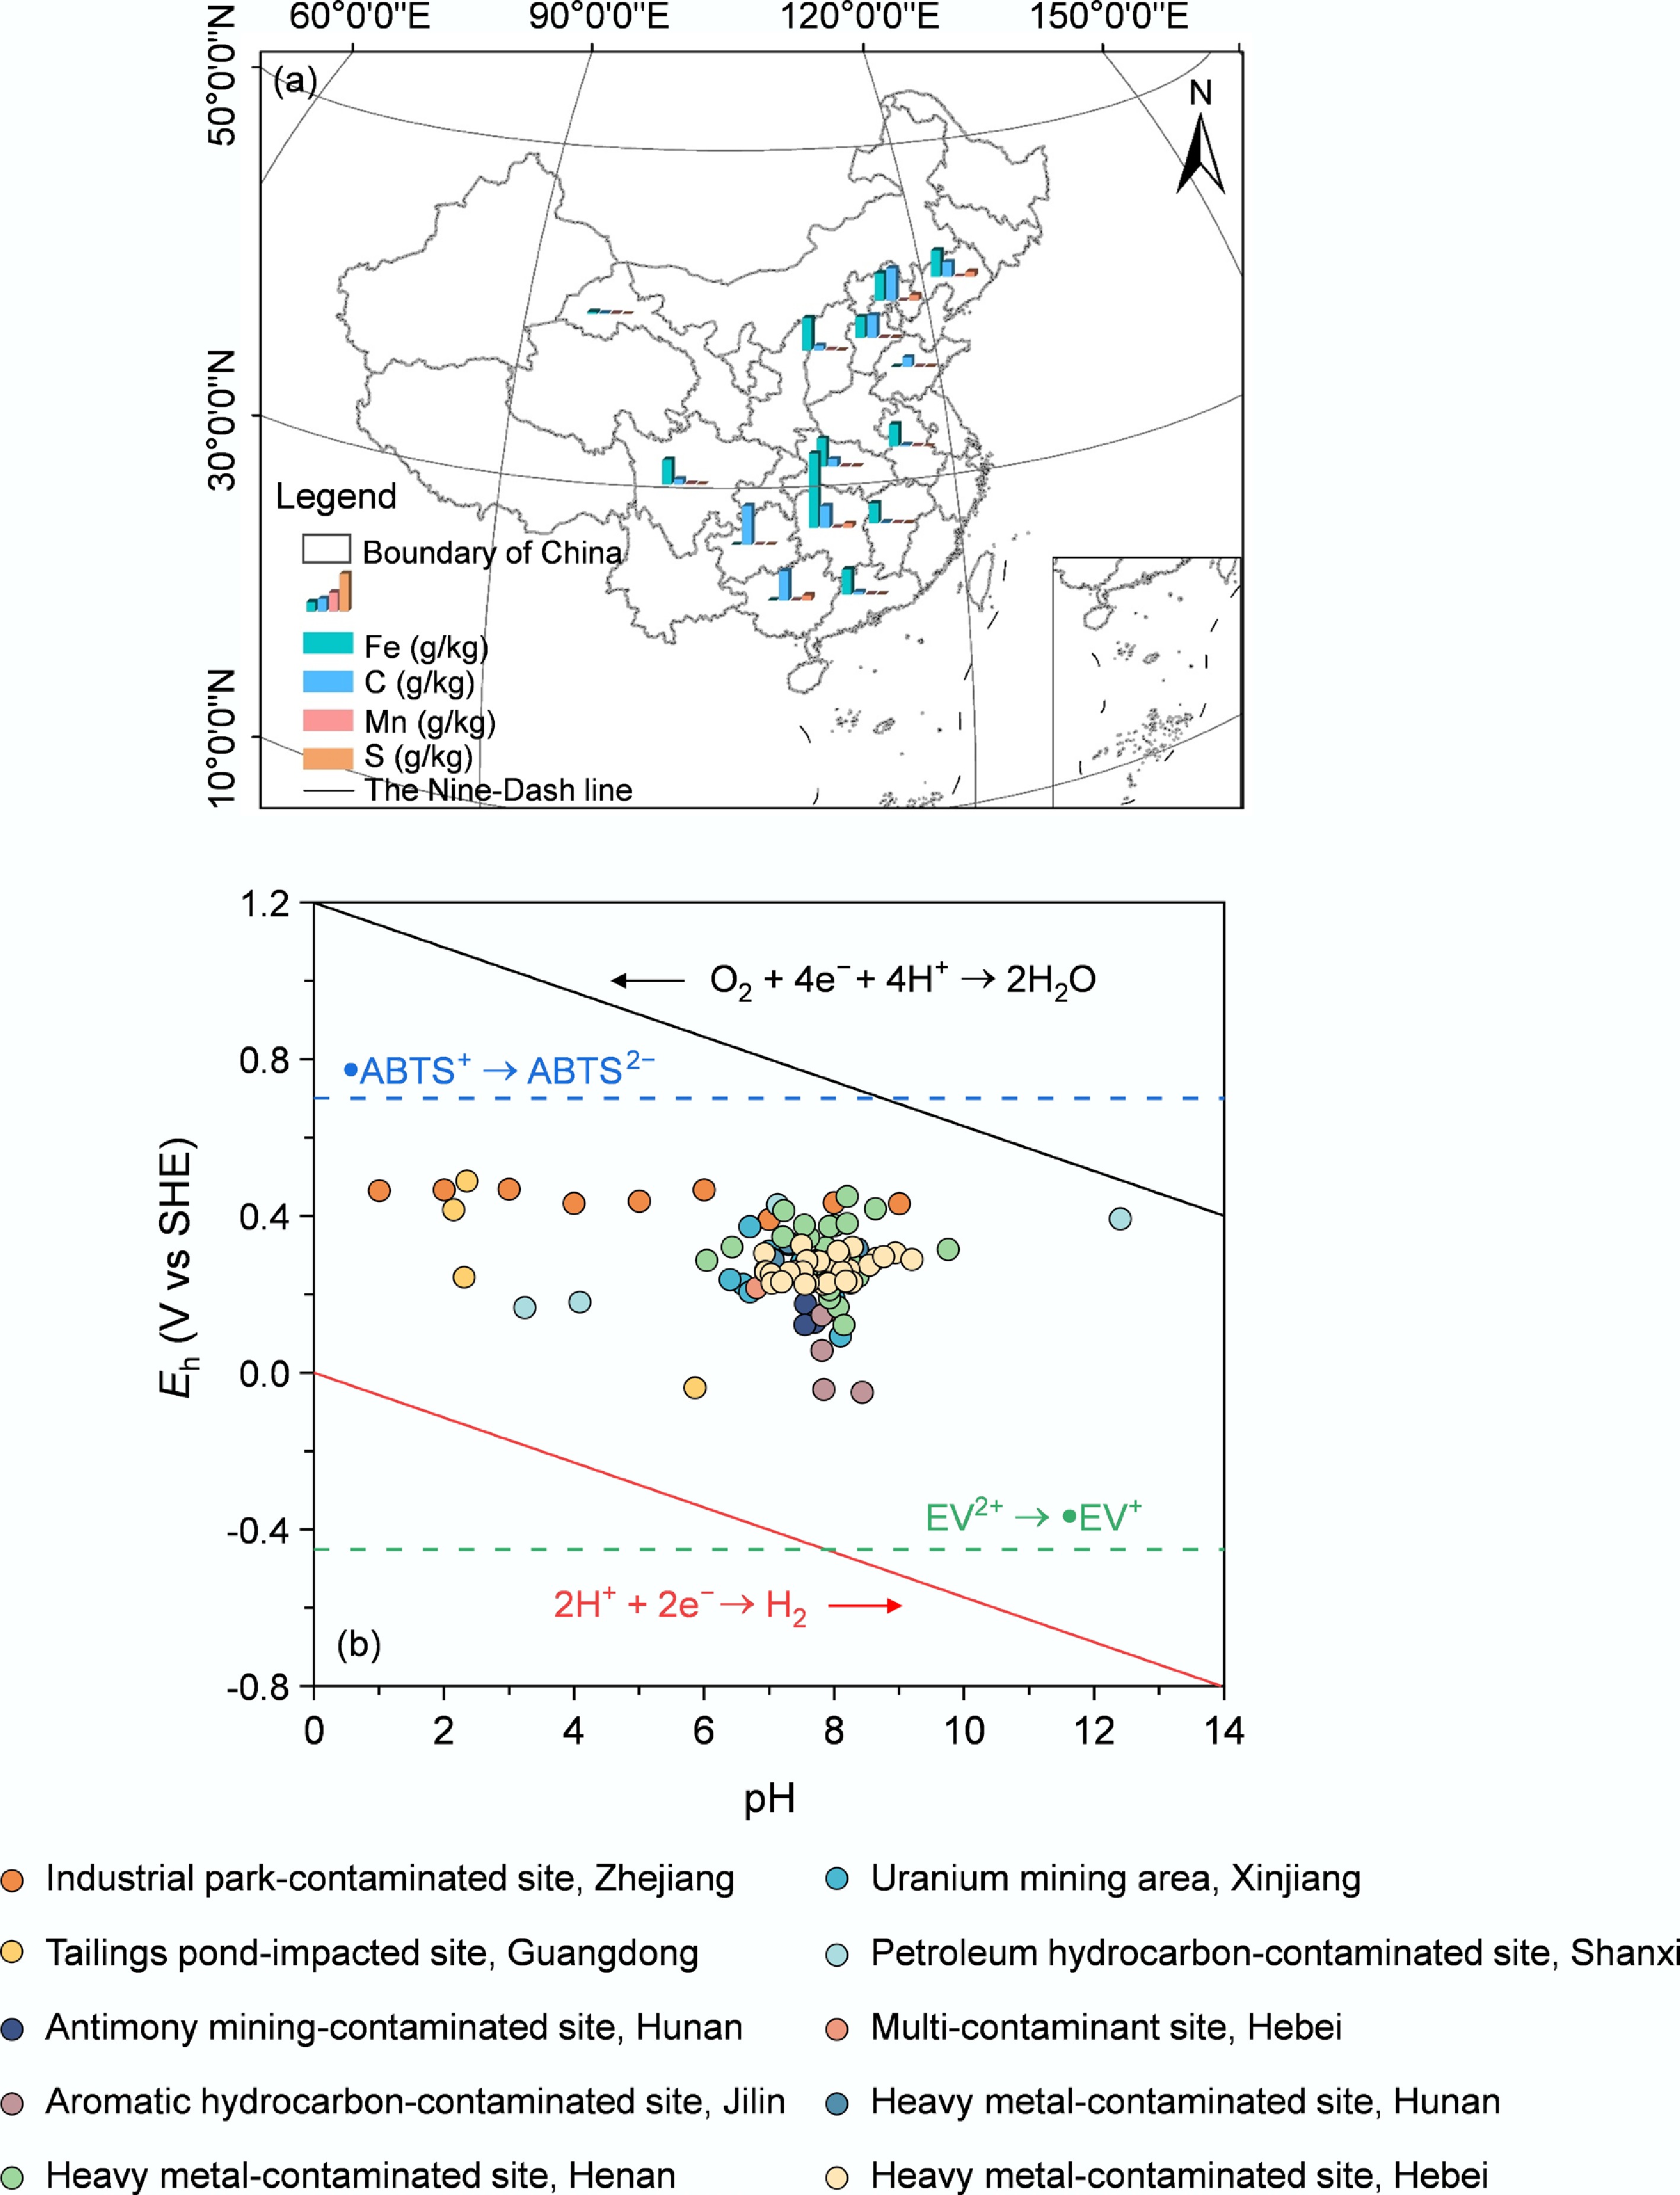
Figure 3.
EEC-related compositions in contaminated aquifers in China. (a) Contents of redox-active elements in contaminated aquifers. (b) Eh values of groundwater in contaminated aquifers. The basemap of China was obtained from the Ministry of Natural Resources CNR2024), China (GS 2024 0650).
-
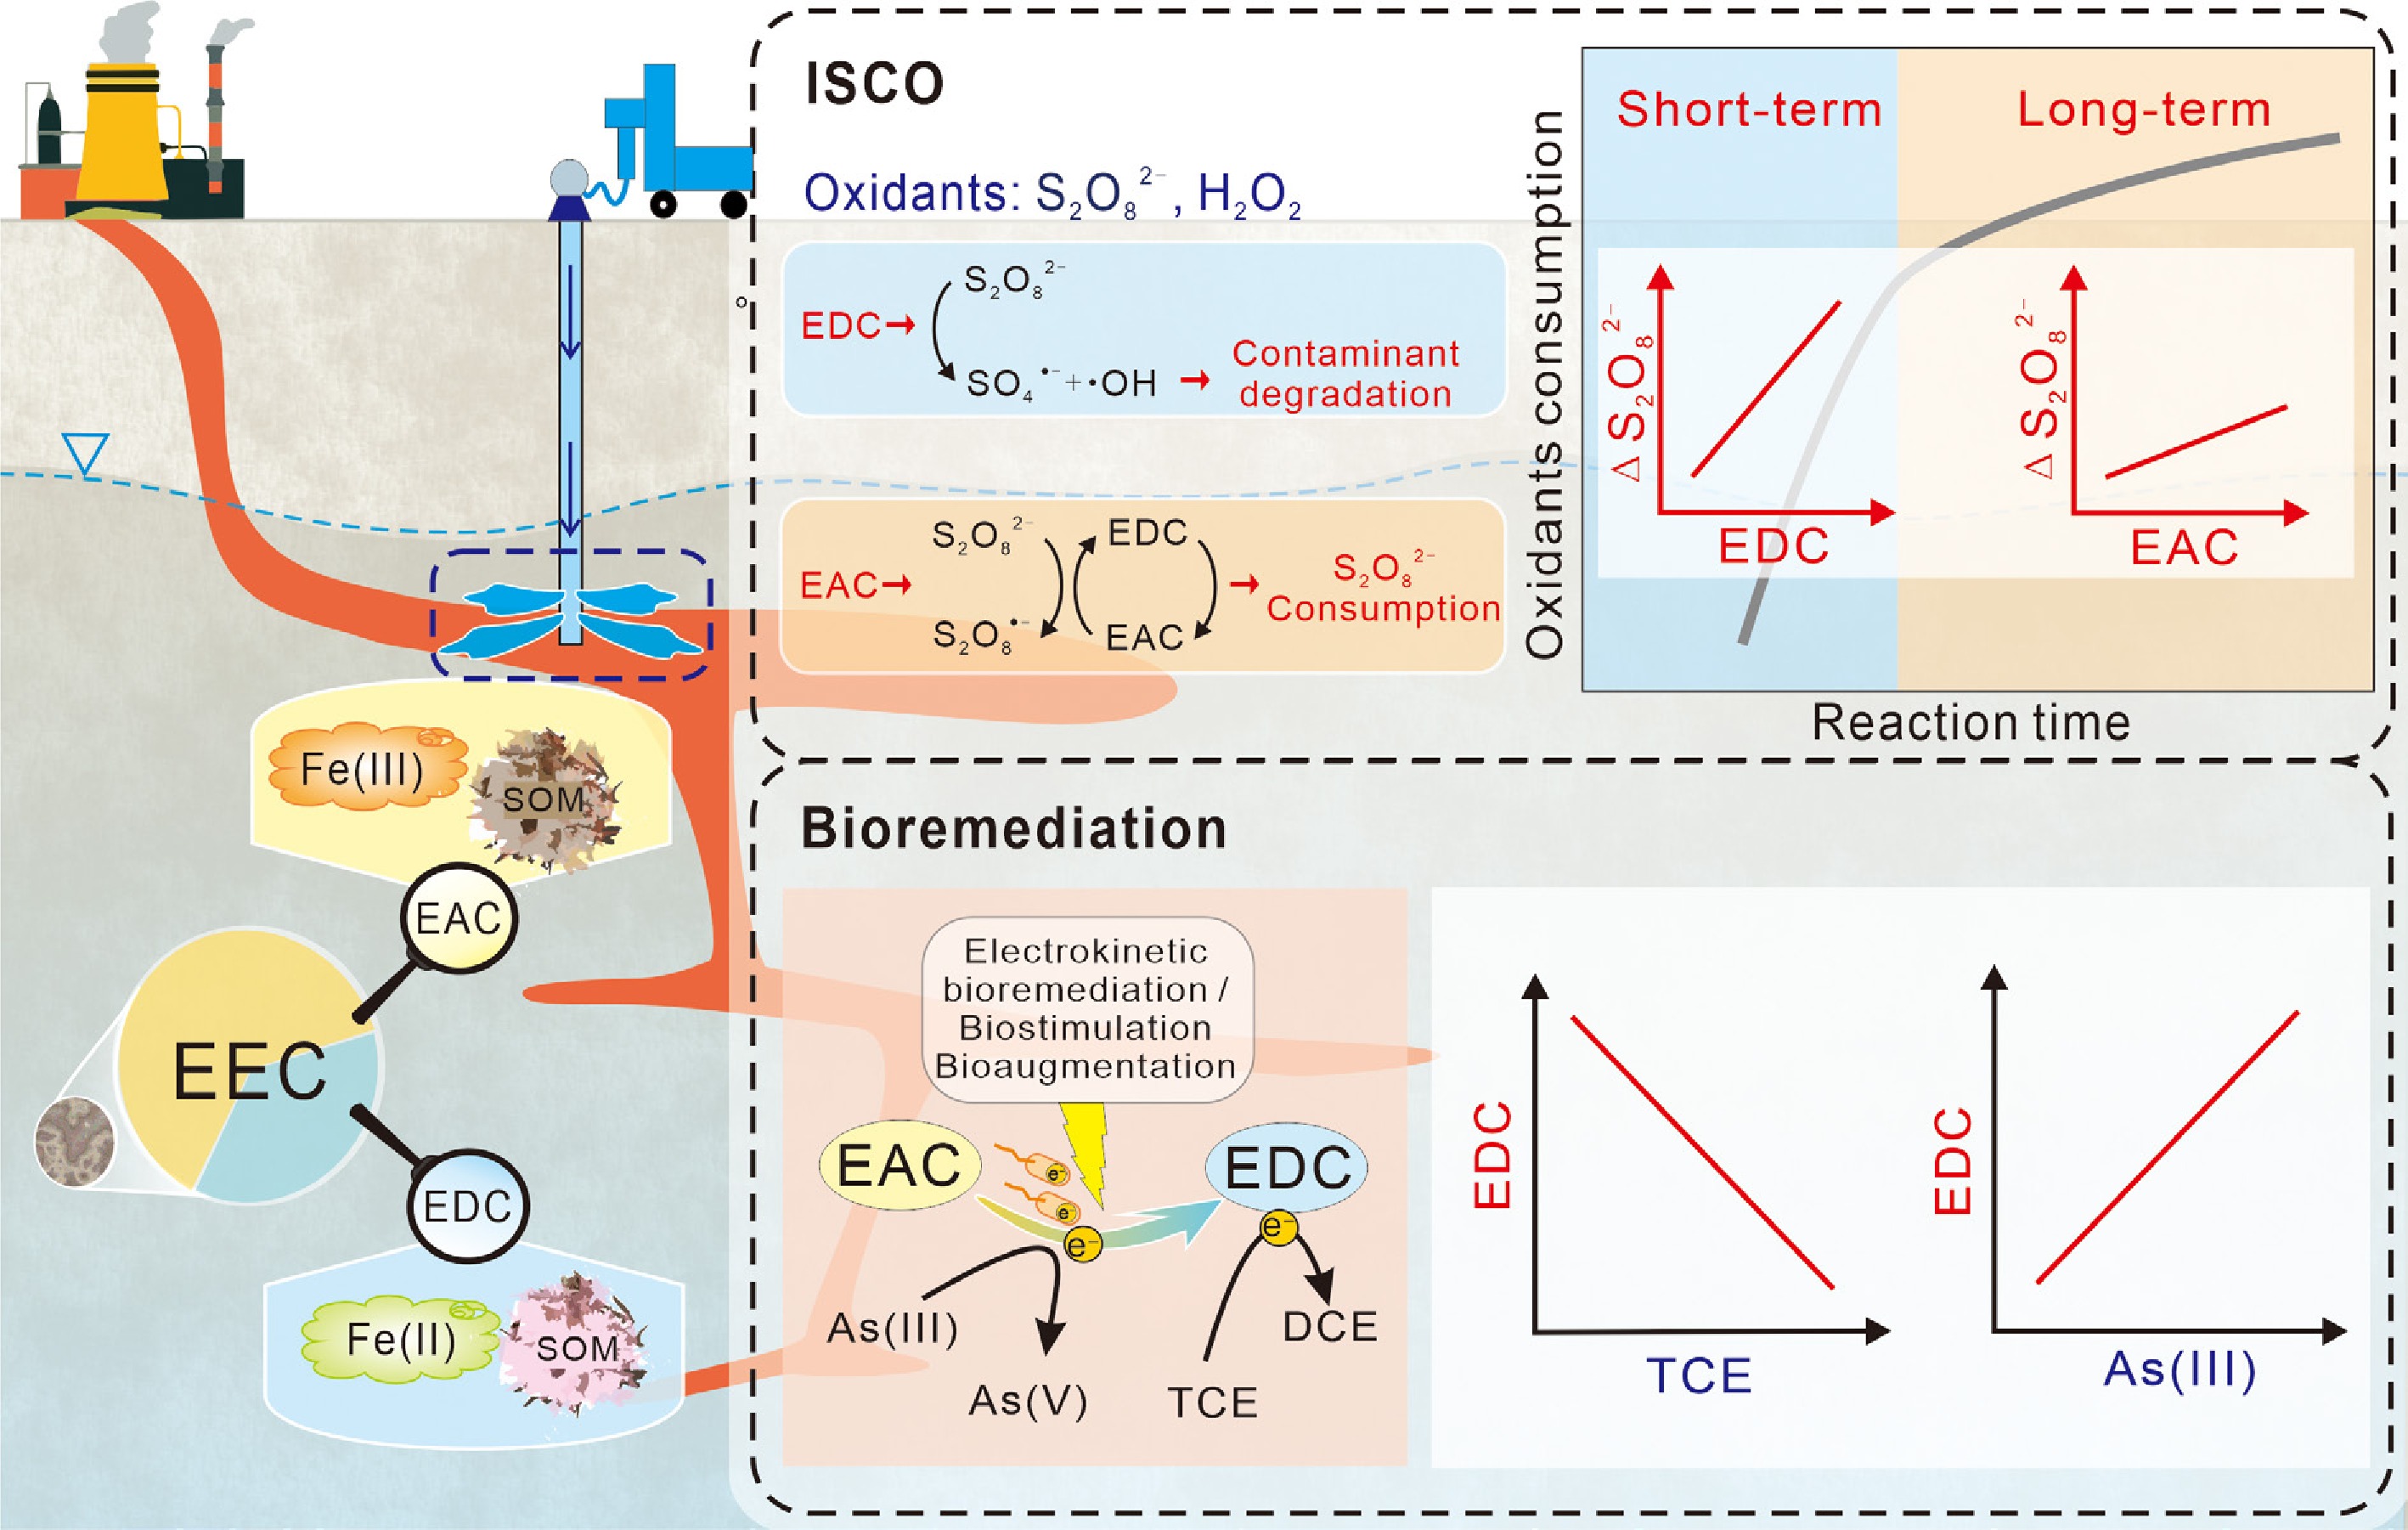
Figure 4.
Chemical controls of sediment EEC on contaminant remediation.
Figures
(4)
Tables
(0)