-
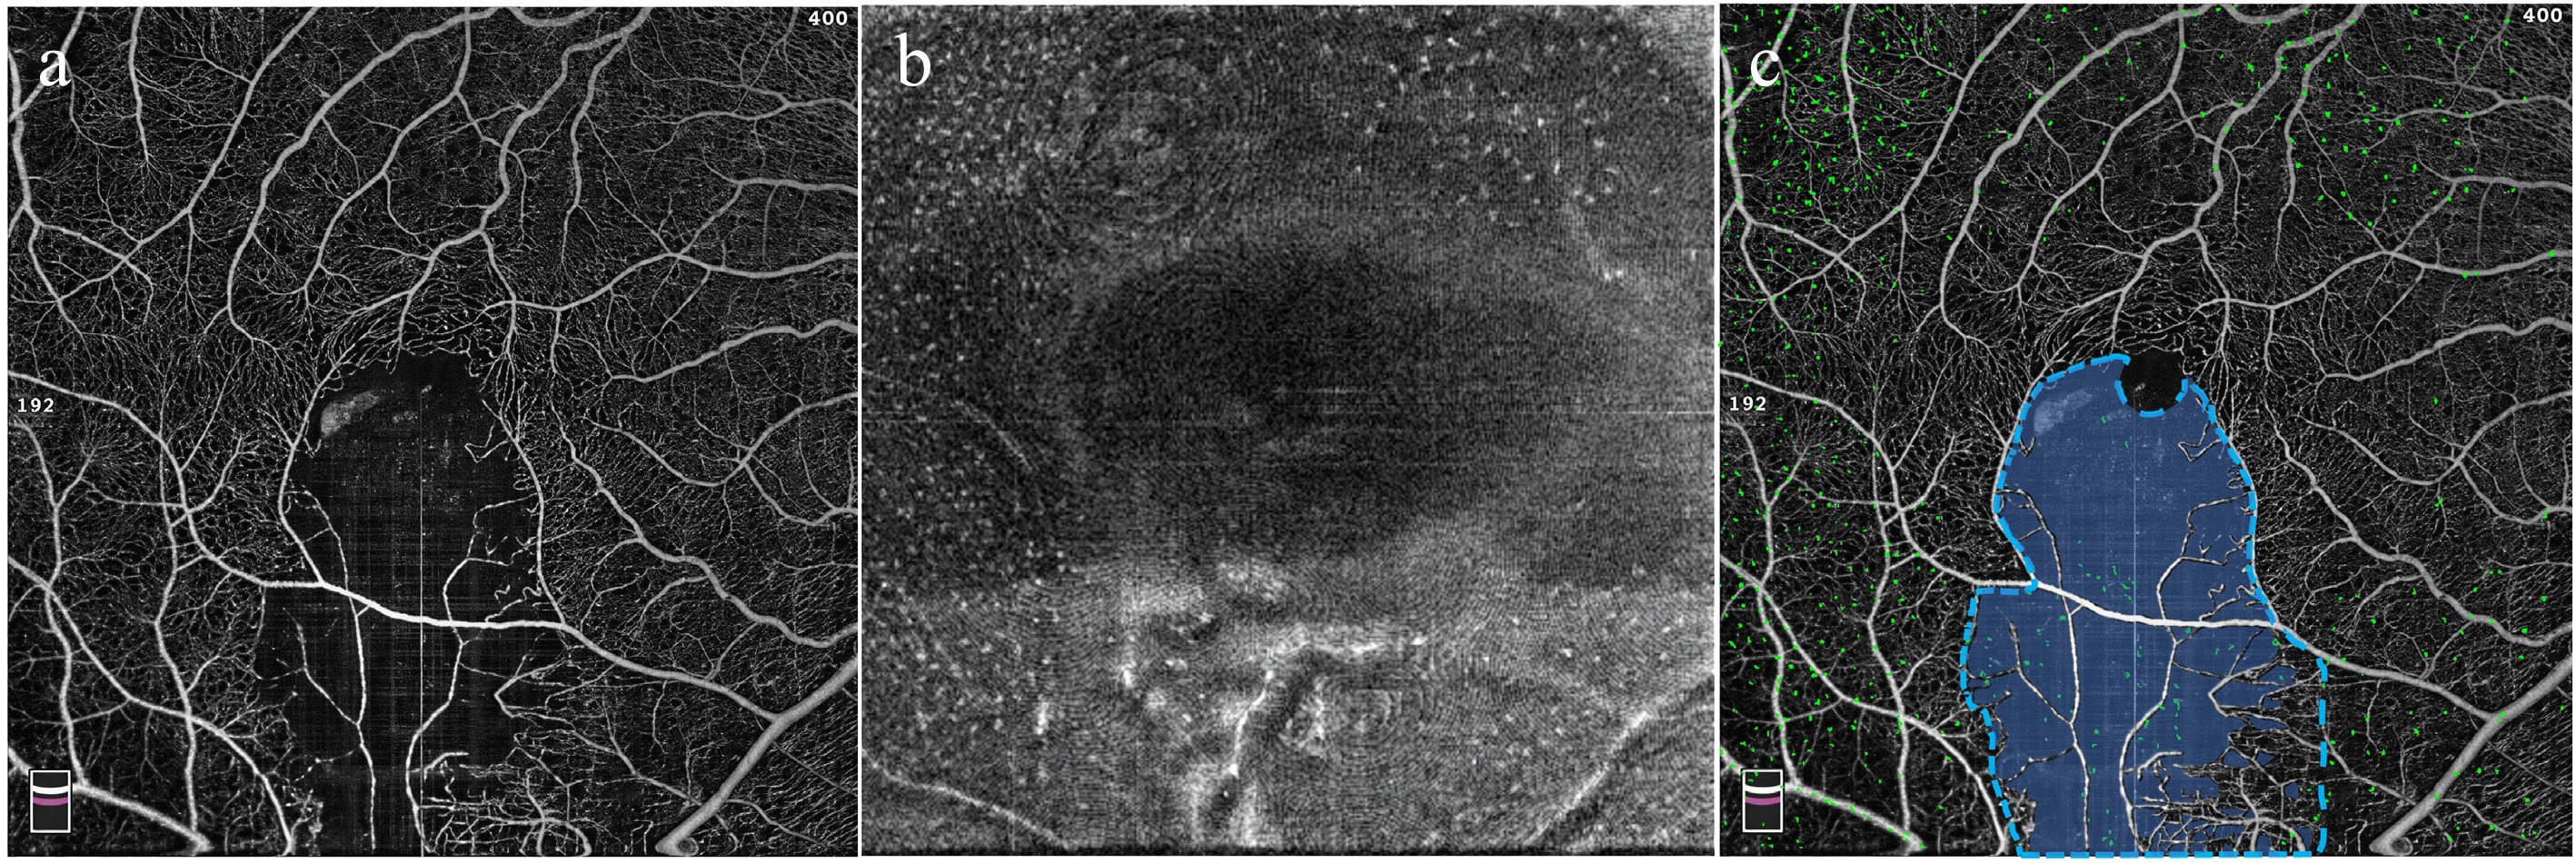
Figure 1.
Schematic illustration of regional definitions and eMLC quantification. (a) Representative OCTA image showing the macular vasculature. (b) En face structural OCT image at the level of the inner limiting membrane showing eMLCs as hyperreflective dots. (c) OCTA image showing the delineation of the affected area (blue dashed line) and non-perfused area (semi-transparent blue overlay). The eMLCs are isolated and overlaid as green dots, showing the topographic distribution of eMLCs.
-
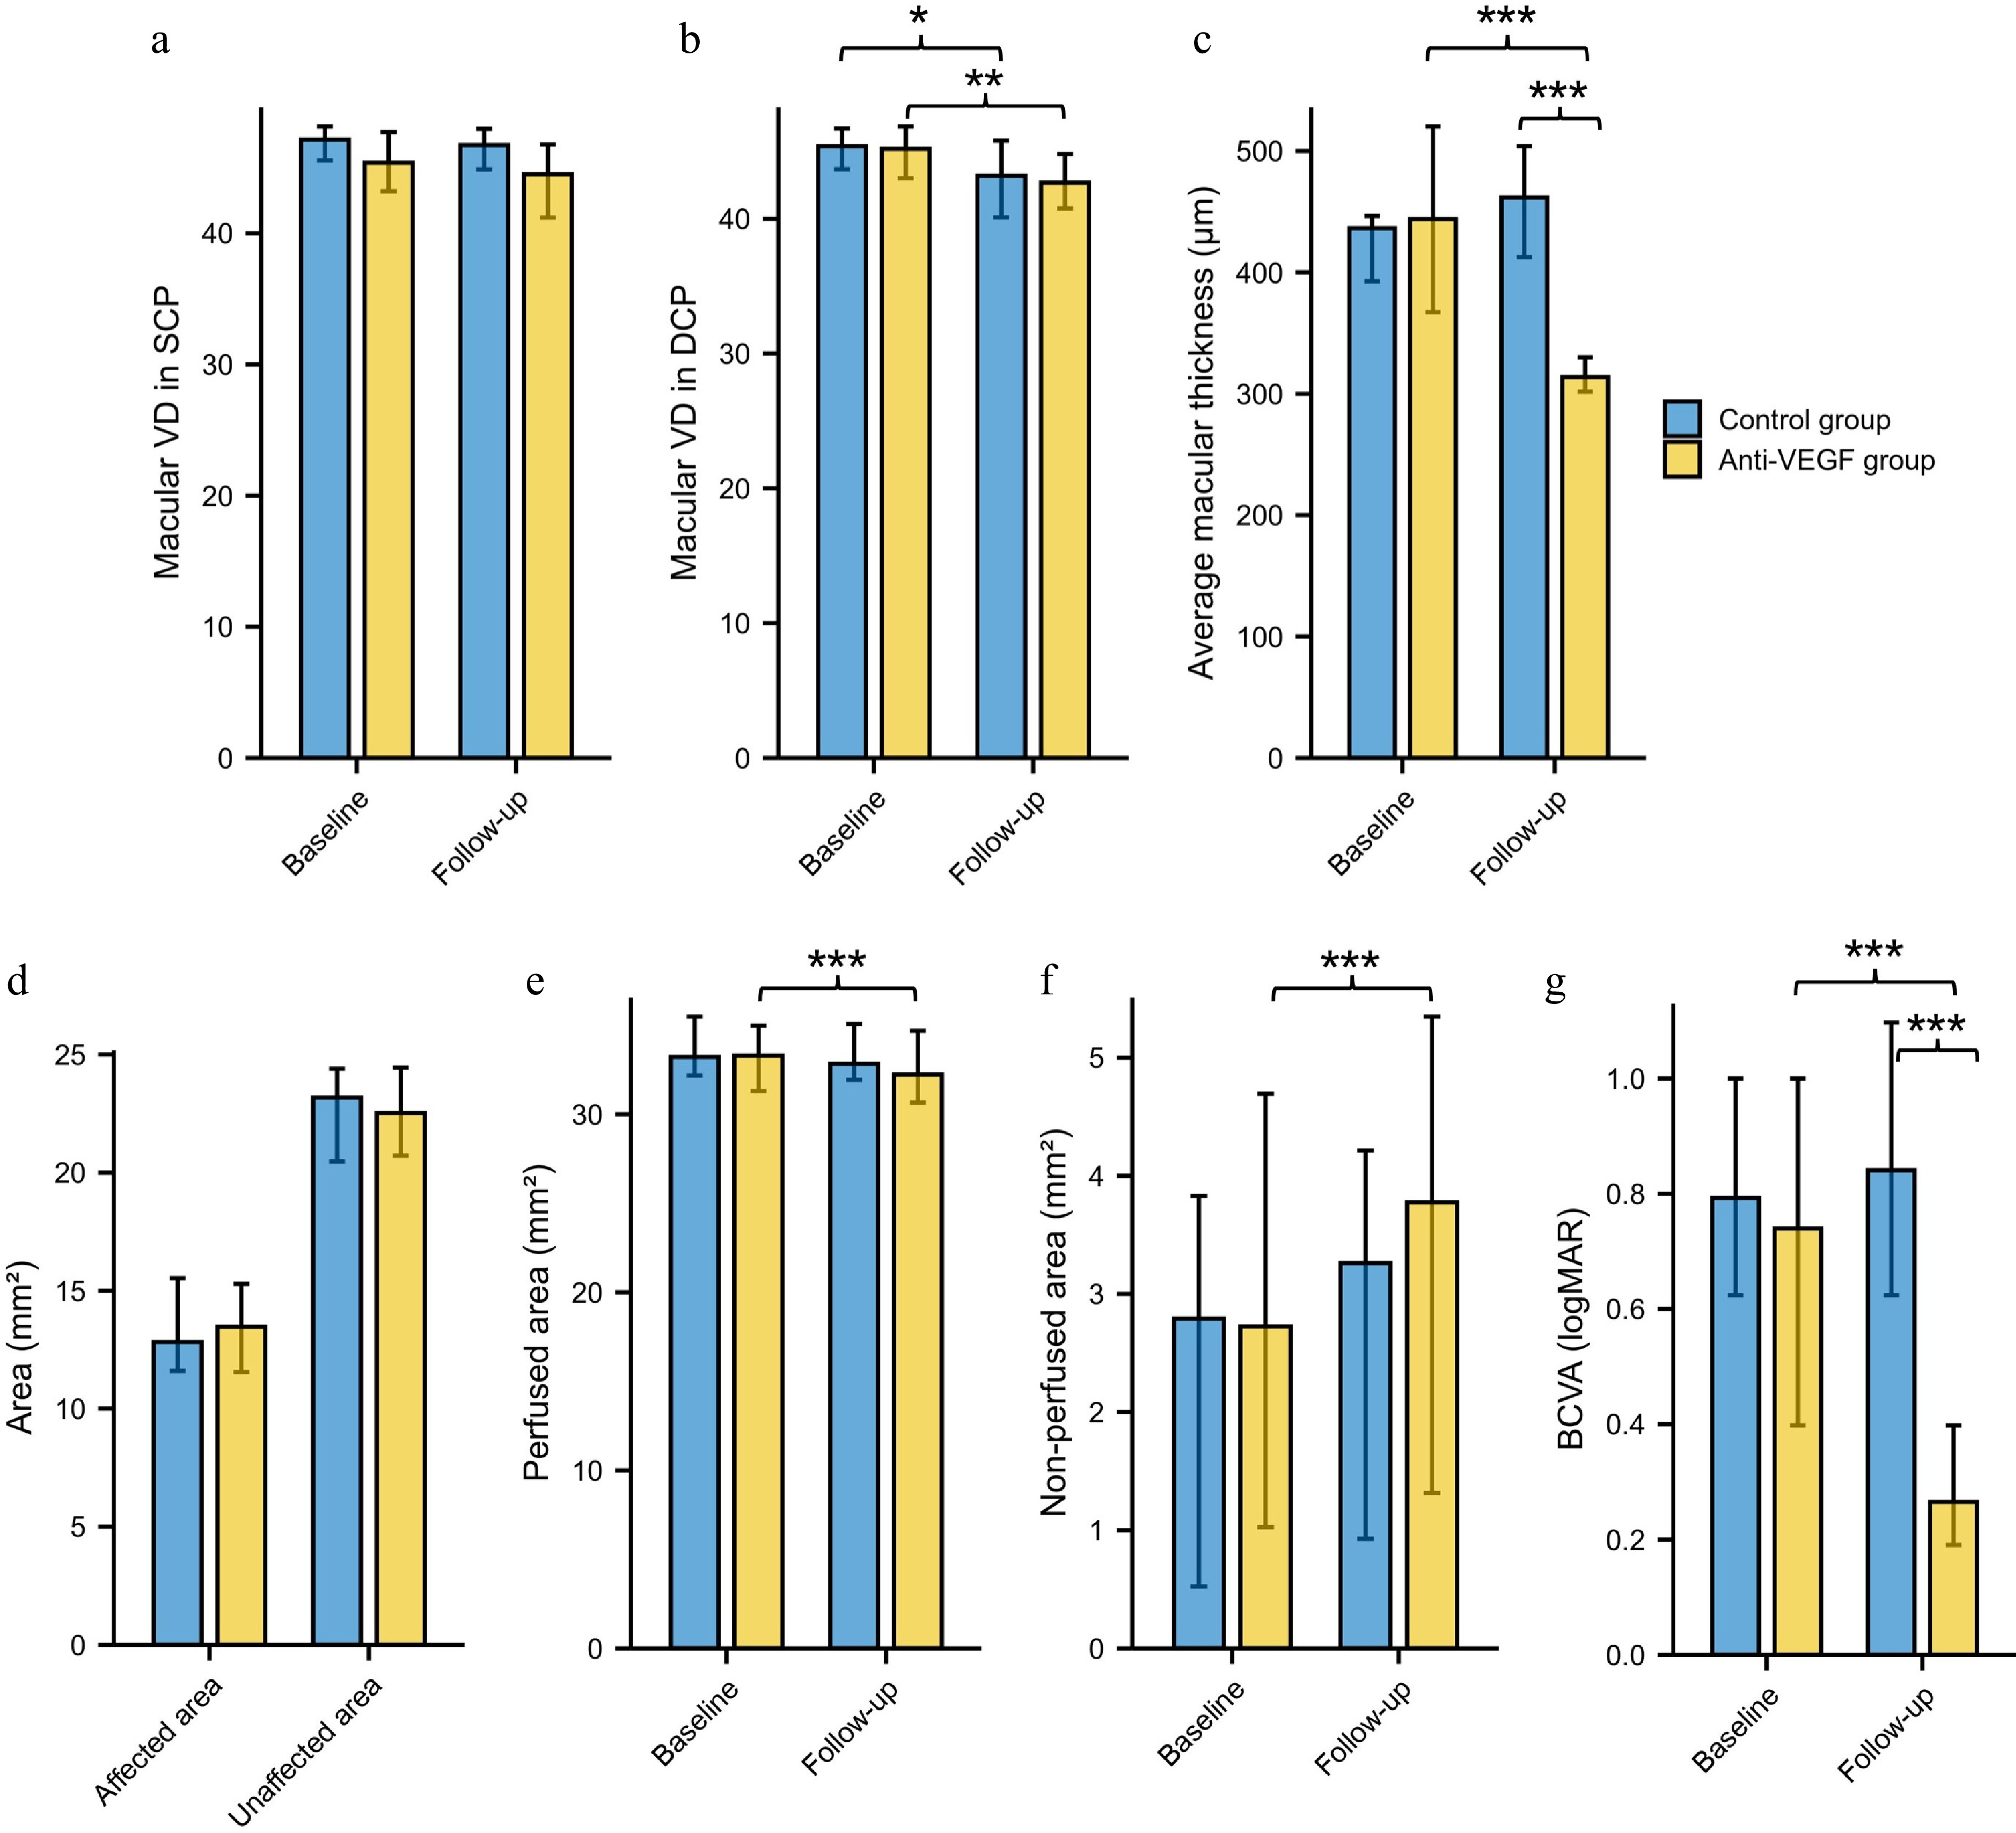
Figure 2.
Longitudinal changes and comparisons of ocular parameters in the control and anti-VEGF groups. Macular vessel density in the (a) SCP and (b) DCP. (c) Average macular thickness. (d) Affected and unaffected area. (e) Perfused area. (f) Non-perfused area. (g) BCVA. BCVA = best-corrected visual acuity; VEGF = vascular endothelial growth factor; VD = vessel density; SCP = superficial capillary plexus; DCP = deep capillary plexus; * p < 0.05, ** p < 0.01, *** p < 0.001.
-
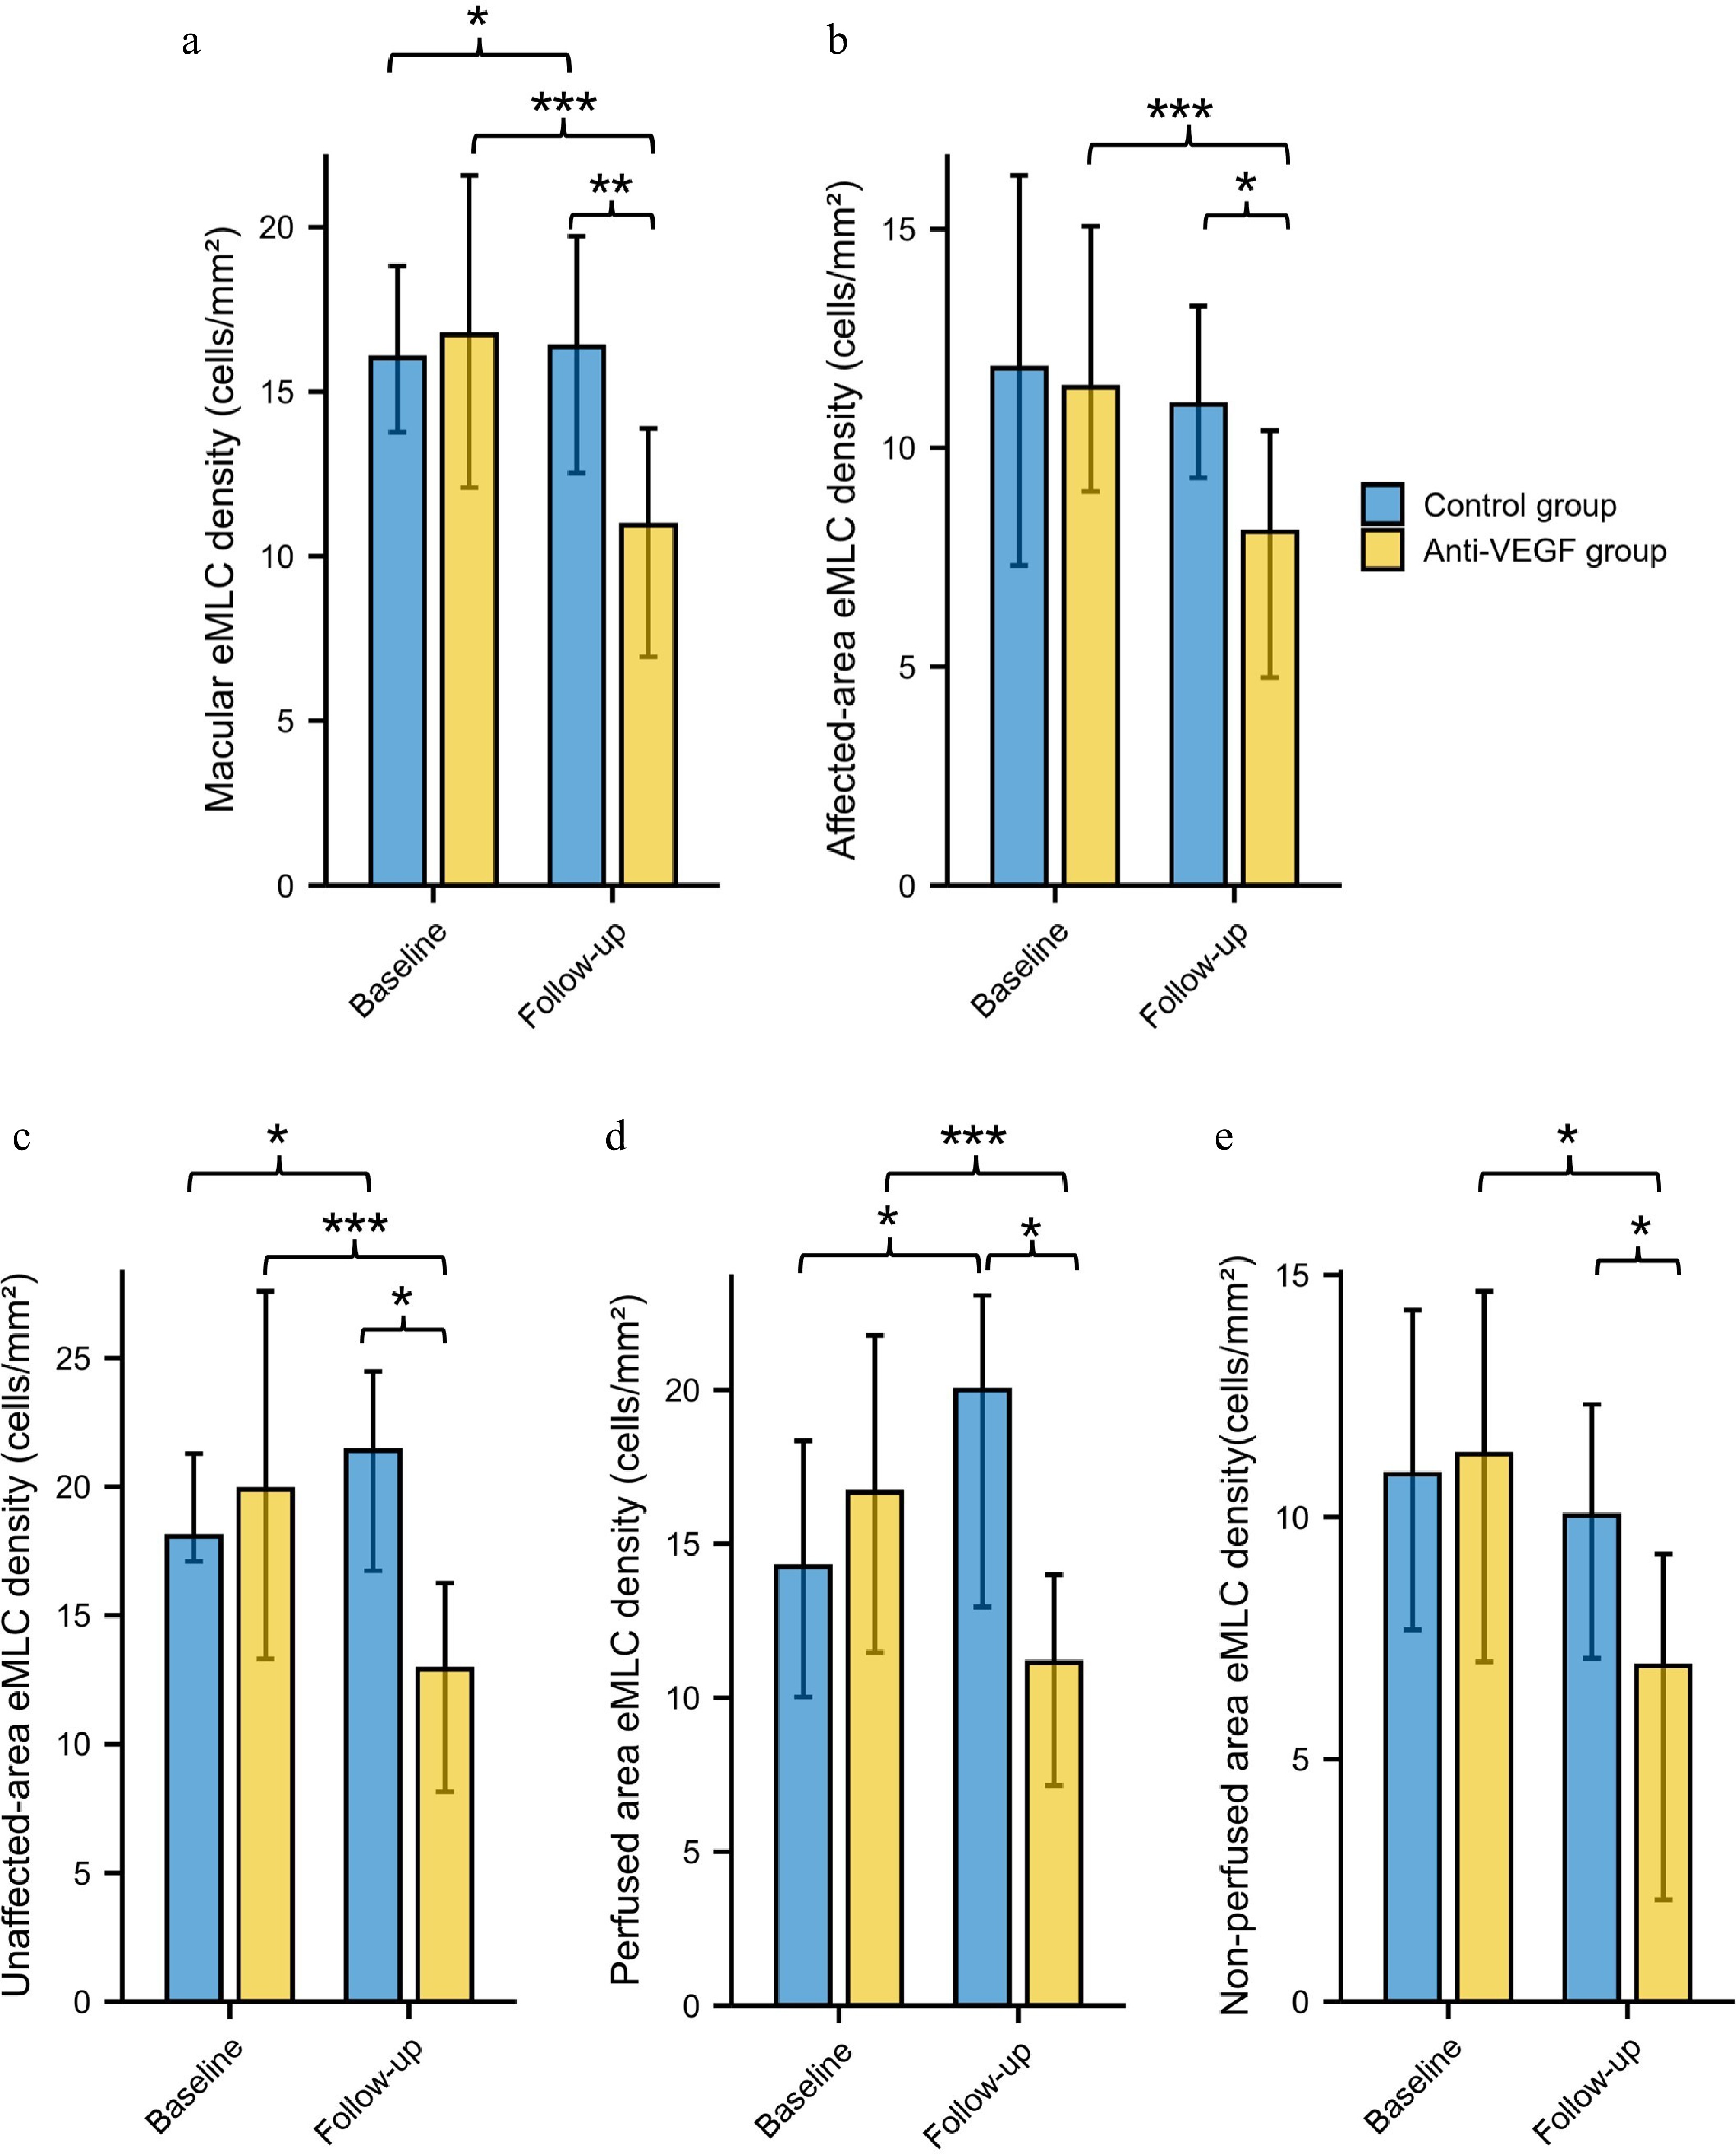
Figure 3.
Longitudinal changes and comparisons of eMLC parameters in the control and anti-VEGF groups. (a) Global macular eMLC density. (b) eMLC density in the affected area. (c) eMLC density in the unaffected area. (d) eMLC density in perfused area. (e) eMLC density in non-perfused area. VEGF = vascular endothelial growth factor; eMLC = epiretinal macrophage-like cell. * p < 0.05, ** p < 0.01, *** p < 0.001.
-
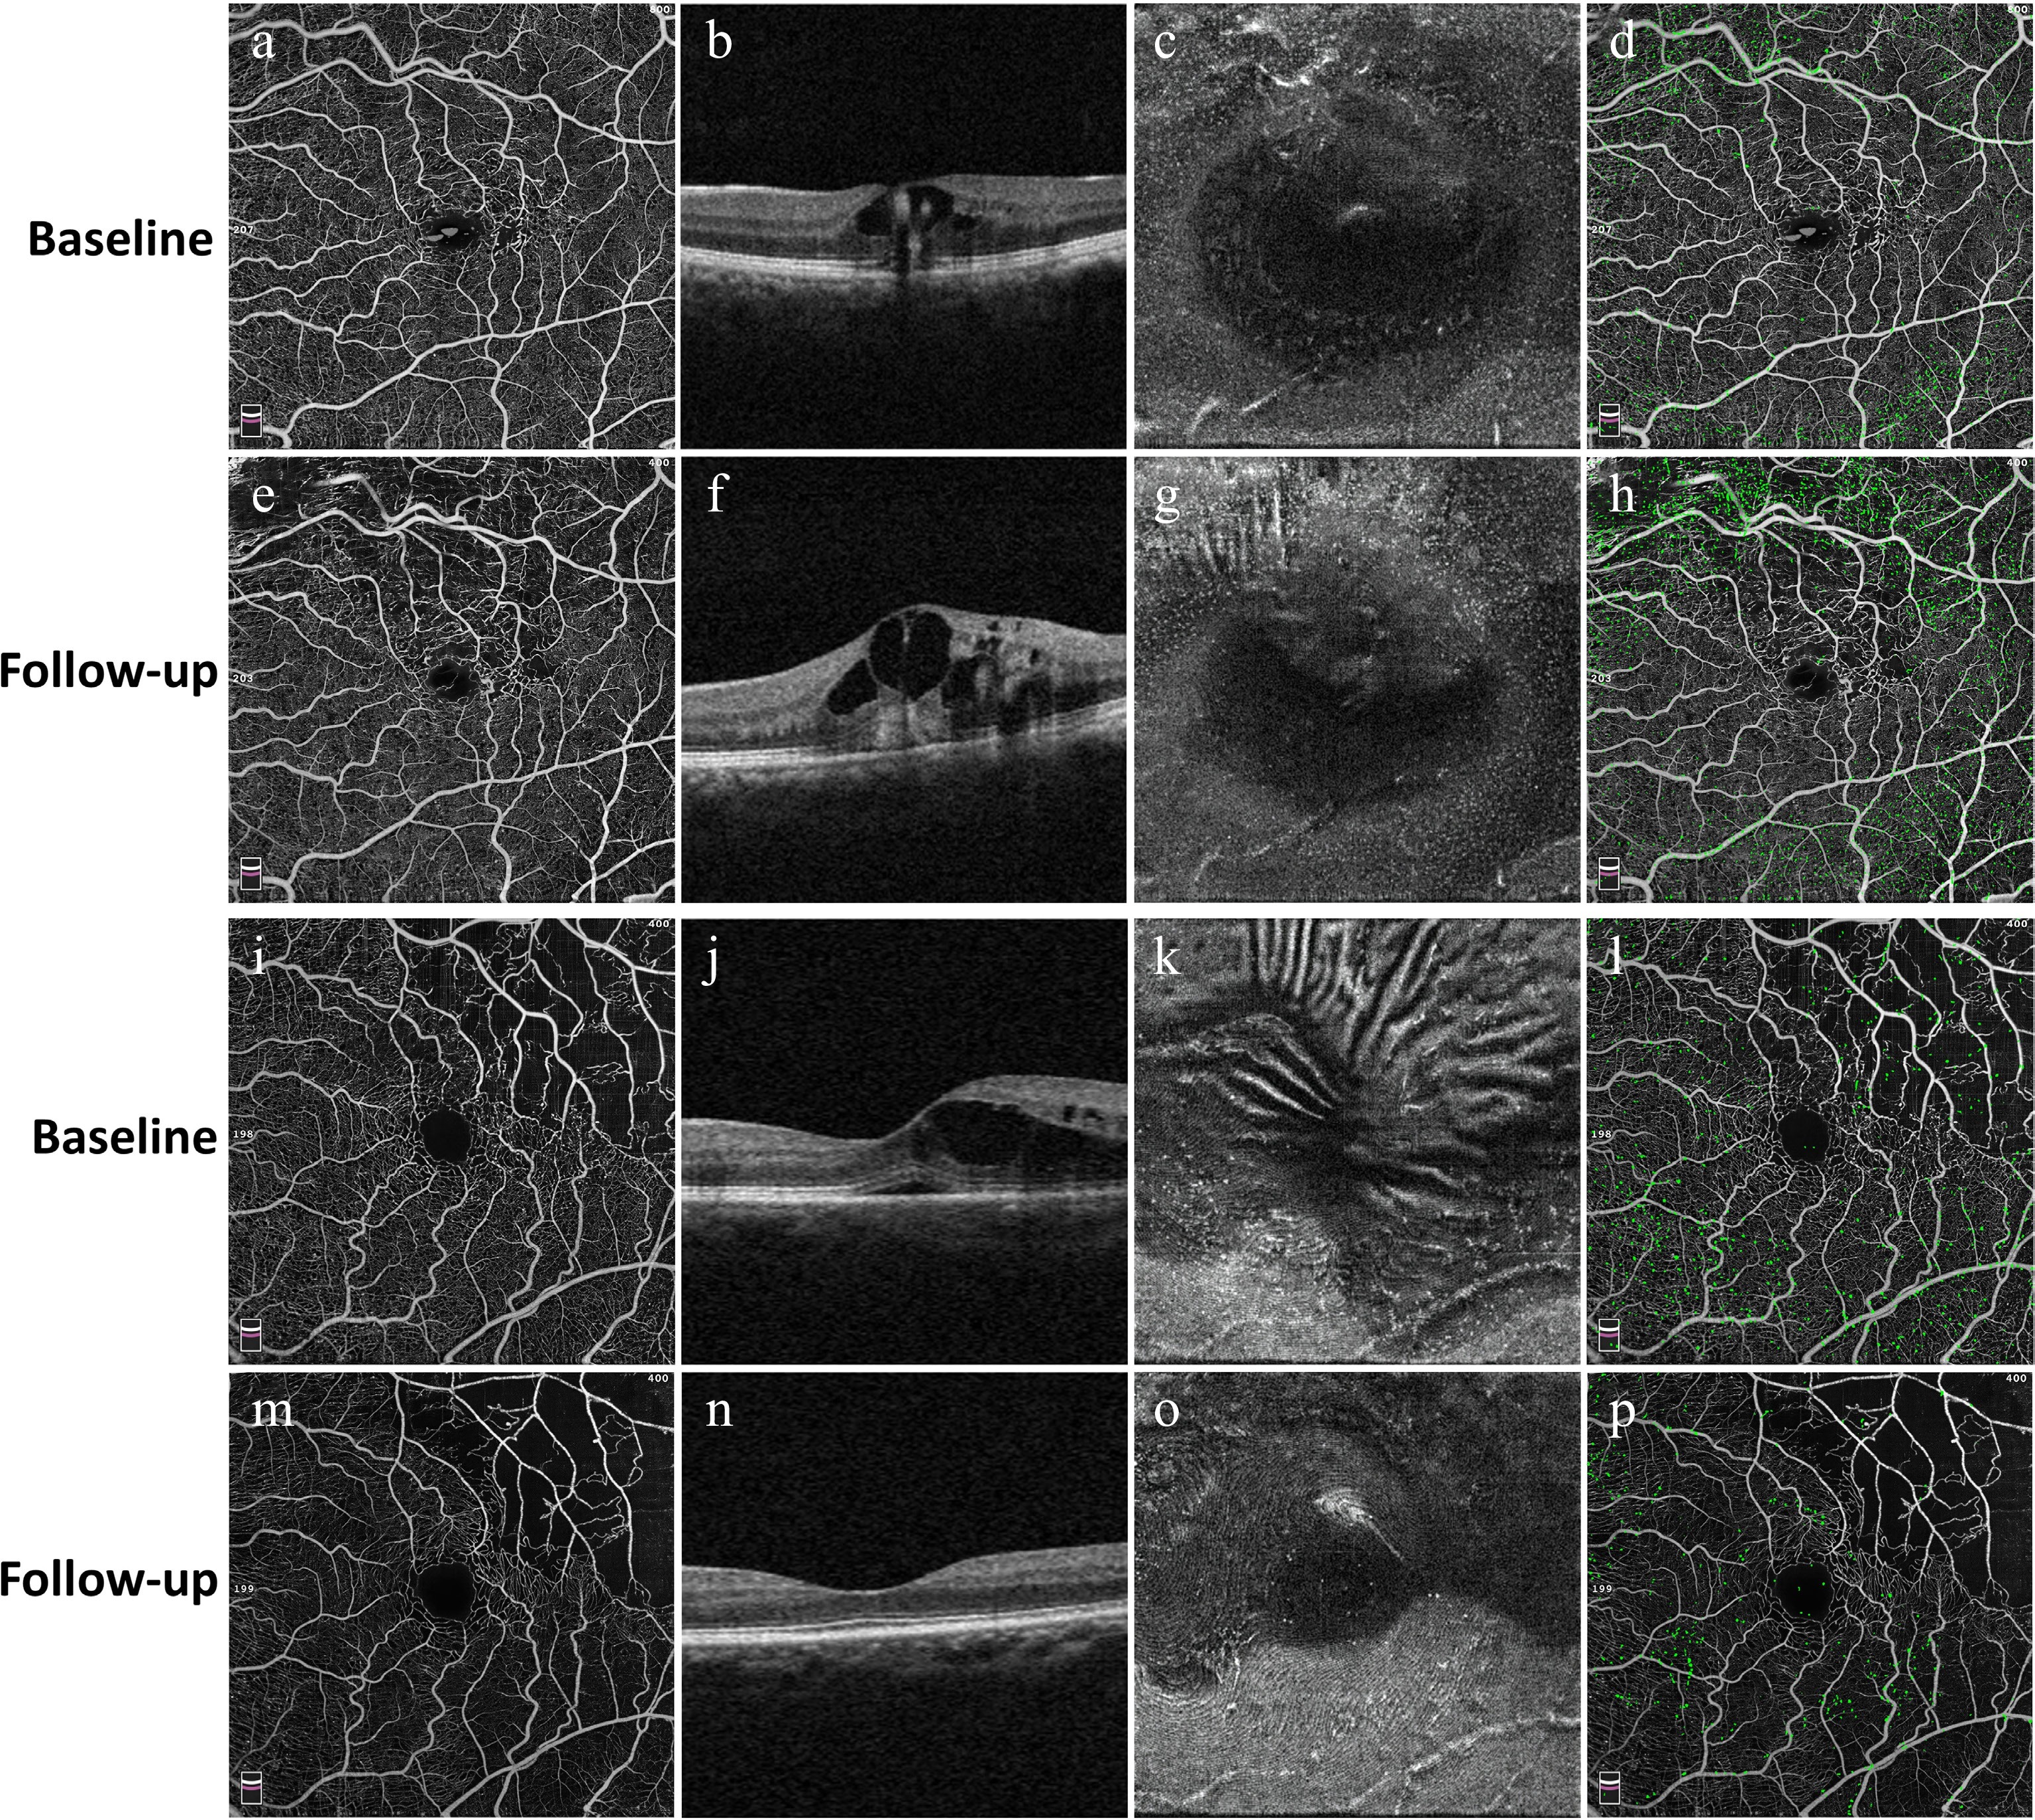
Figure 4.
Representative cases illustrating longitudinal changes in structural and eMLC parameters in the control group (a)–(h) and the anti-VEGF group (i)–(p). For each group, the first column (a), (e), (i), and (m) shows en face OCT angiography images of the macular region at baseline and follow-up. The second column (b), (f), (j), and (n) presents corresponding B-scan OCT images demonstrating changes in macular edema. The third column (c), (g), (k), and (o) displays en face OCT images at the 3-μm slab above the ILM, visualizing eMLCs as hyperreflective dots. The fourth column (d), (h), (l), and (p) shows overlays of the retinal vascular network and detected eMLCs (green), illustrating the spatial distribution of eMLCs in relation to the underlying vasculature. In the control group, eMLC density increased, and macular edema worsened after untreated follow-up, whereas the anti-VEGF group exhibited marked resolution of macular edema accompanied by a significant reduction in eMLC density.
-
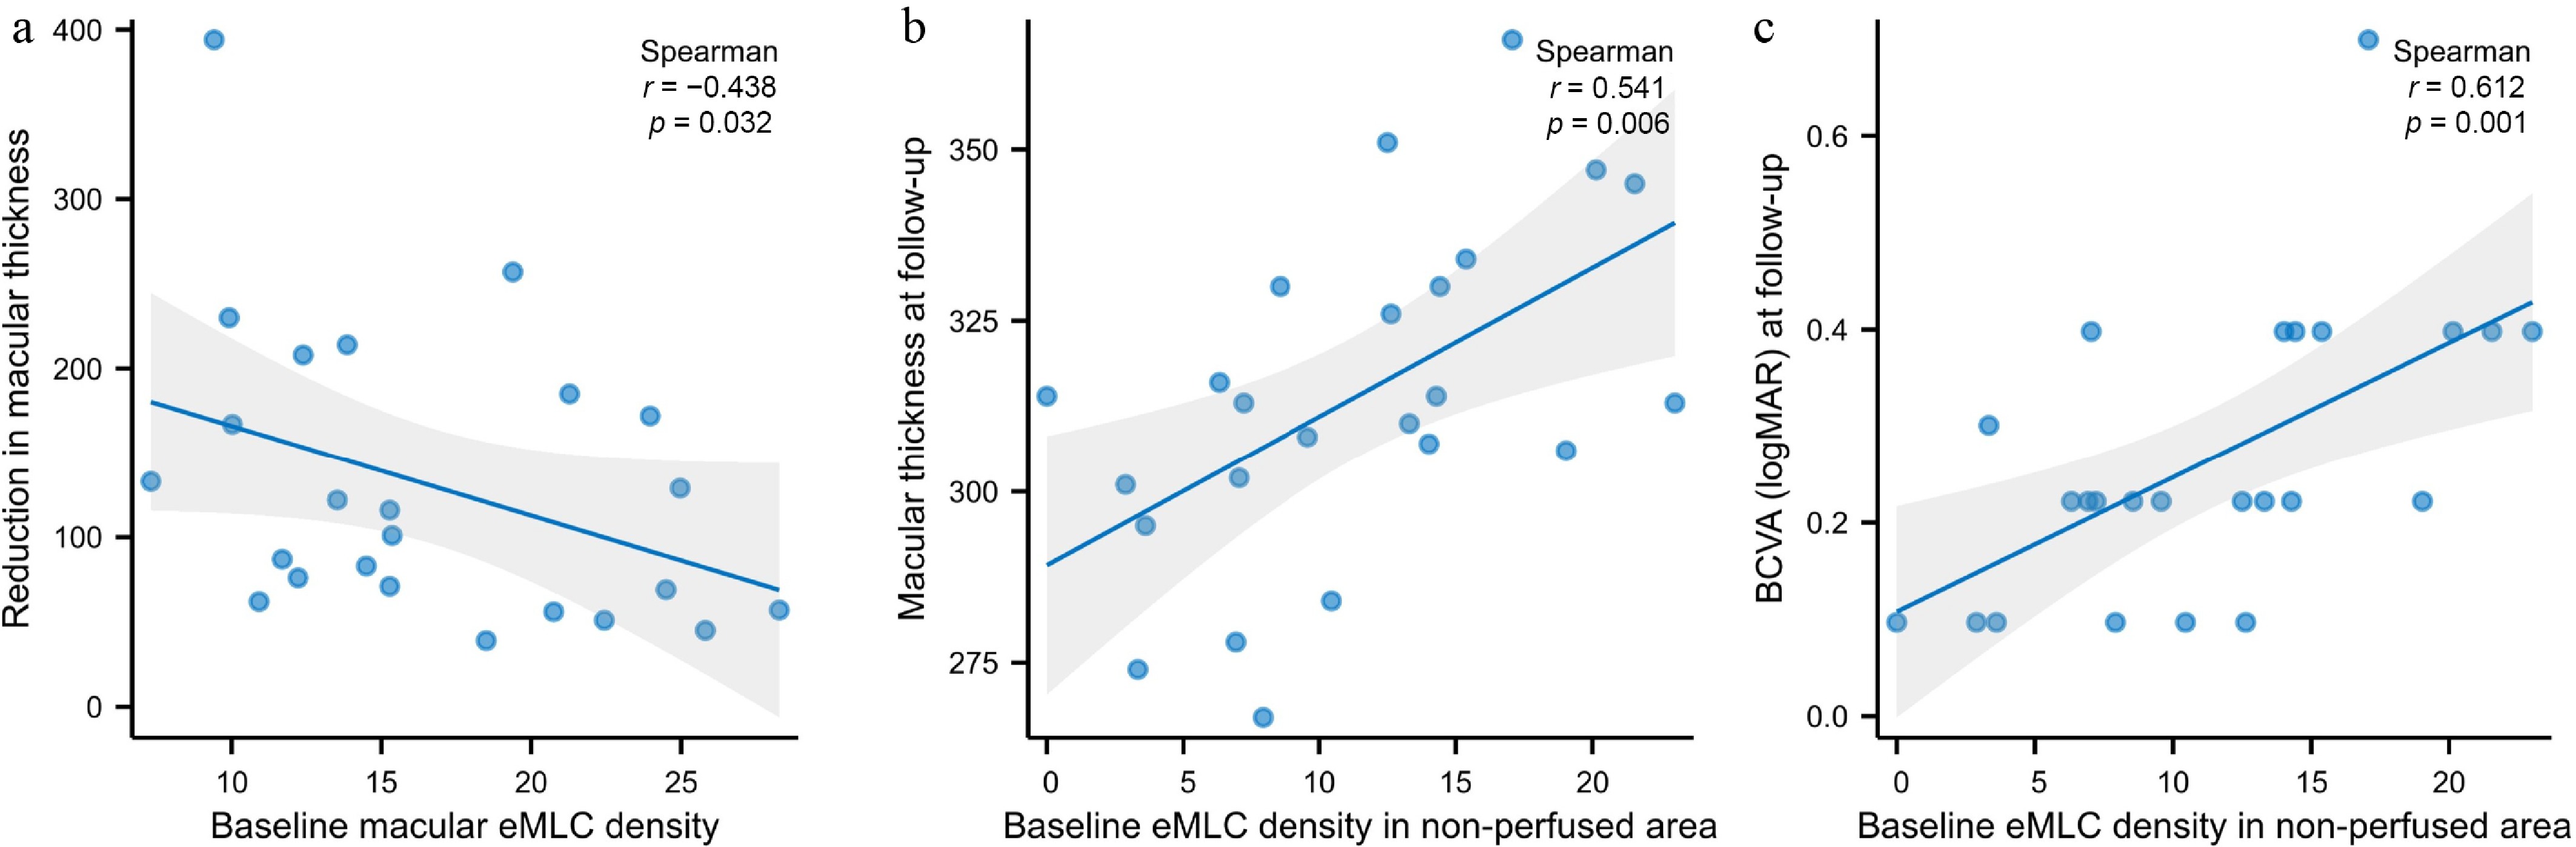
Figure 5.
Scatter plots showing correlations between eMLC density and treatment outcomes. (a) Baseline global macular eMLC density showed a significant negative correlation with the reduction in macular thickness from baseline to follow-up (r = −0.438, p = 0.032). (b) Baseline eMLC density in the non-perfused area was positively correlated with macular thickness at the 1-month follow-up visit (r = 0.541, p = 0.006). (c) Baseline eMLC density in the non-perfused area was positively correlated with logMAR BCVA at the 1-month follow-up visit (r = 0.612, p = 0.001).
-
Baseline Follow-up p value BCVA (logMAR) 0.70 (0.40, 0.98) 0.85 (0.47, 1.10) 0.069 Macular VD in SCP 46.50 (45.25, 48.25) 47.20 (44.43, 48.13) 0.410* Macular VD in DCP 45.60 (43.63, 47.10) 43.70 (39.50, 46.00) 0.018* Average macular thickness (μm) 411.0 (390.25, 473.5) 437.0 (403.5, 522.0) 0.003* Affected area (mm2) 12.80 (10.93, 15.92) 12.80 (10.93, 15.92) n/a Unaffected area (mm2) 23.20 (20.08, 25.07) 23.20 (20.08, 25.07) n/a Perfused area (mm2) 33.90 (31.85, 35.63) 33.15 (31.71, 35.08) 0.271* Non-perfused area (mm2) 2.10 (0.37, 4.15) 2.85 (0.92, 4.72) 0.116* eMLC density (cells/mm2) Global macular 16.93 (12.83, 18.96) 17.63 (14.12, 20.17) 0.023* Affected area 9.27 (6.82, 17.65) 10.84 (8.86, 13.27) 0.657* Unaffected area 18.40 (15.89, 21.29) 20.10 (15.49, 25.77) 0.028* Perfused area 13.30 (9.44, 18.98) 18.25 (11.83, 28.60) 0.003* Non-perfused area 12.41 (5.57, 14.99) 9.65 (6.81, 17.88) 1.000* BCVA = best-corrected visual acuity; eMLC = epiretinal macrophage-like cell; VD = vessel density; SCP = superficial capillary plexus; DCP = deep capillary plexus; * = Data were presented as the median with interquartile range (IQR) and compared by the Wilcoxon signed-rank test. Bold values indicate statistical significance (p < 0.05). Table 1.
Longitudinal changes in BCVA, retinal structural parameters, and eMLC parameters in the control group.
-
Baseline Follow-up p value BCVA (logMAR) 0.70 (0.40, 1.00) 0.22 (0.13, 0.40) < 0.001* Macular VD in SCP 46.30 (42.40, 47.78) 44.80 (41.00, 47.13) 0.219* Macular VD in DCP 44.55 (42.80, 46.95) 42.50 (40.53, 44.80) 0.001* Average macular thickness (μm) 415.0 (365.75, 522.75) 313.5 (303.00, 333.00) < 0.001* Affected area (mm2) 13.16 (11.38, 15.48) 13.16 (11.38, 15.48) n/a Unaffected area (mm2) 22.85 (20.52, 24.62) 22.85 (20.52, 24.62) n/a Perfused area (mm2) 34.09 (31.24, 35.00) 32.55 (30.36, 34.76) < 0.001* Non-perfused area (mm2) 1.91 (1.00, 4.77) 3.46 (1.25, 5.64) < 0.001* eMLC density (cells/mm2) Global macular 15.28 (11.83, 22.15) 10.07 (6.89, 14.28) < 0.001* Affected area 10.63 (8.76, 15.30) 7.59 (4.24, 11.08) < 0.001* Unaffected area 17.19 (12.69, 27.83) 13.08 (7.68, 17.73) < 0.001* Perfused area 15.30 (11.17, 22.37) 10.84 (7.01, 14.46) < 0.001* Non-perfused area 11.48 (6.95, 15.14) 5.87 (1.80, 9.35) 0.002* BCVA = best-corrected visual acuity; eMLC = epiretinal macrophage-like cell; VEGF = vascular endothelial growth factor; VD = vessel density; SCP = superficial capillary plexus; DCP=deep capillary plexus; * = Data were presented as median with interquartile range (IQR) and compared by the Wilcoxon signed-rank test. Bold values indicate statistical significance (p < 0.05). Table 2.
Longitudinal changes in BCVA, retinal structural parameters and eMLC parameters in the anti-VEGF group.
Figures
(5)
Tables
(2)