













-
Retinal vein occlusion (RVO) is the second most common retinal vascular disease after diabetic retinopathy and a leading cause of visual impairment[1]. It has been traditionally subdivided into central retinal vein occlusion (CRVO) and branch retinal vein occlusion (BRVO)[2]. With an estimated prevalence of 0.6%–1.2%, BRVO is regarded as the most common type of RVO[1,3]. Macular edema is the most common complication of BRVO and is a key contributor to severe visual impairment[1]. Prolonged macular edema may lead to persistent structural retinal damage and irreversible visual impairment[4]. Therefore, prompt and effective treatment is essential to minimize retinal damage and preserve visual function.
At present, intravitreal injection of anti-vascular endothelial growth factor (VEGF) agents represents the standard first-line treatment for macular edema secondary to RVO (RVO-ME). Multiple randomized controlled trials have provided evidence that intravitreal anti-VEGF injections lead to significant visual and anatomical improvements[5]. However, the pathogenesis of macular edema is complex, involving multiple inflammatory cytokines that contribute to the disruption of the blood-retinal barrier and increased vascular permeability[6]. Despite the efficacy of anti-VEGF agents, a significant proportion of patients with RVO-ME do not achieve satisfactory anatomical improvement and optimal visual outcomes[7−9]. Indeed, even after years of treatment, persistent or recurrent macular edema has been reported in up to 52%–56% of patients with CRVO and 31%–50% of those with BRVO[3,10]. This variable response manifests as either primary resistance to treatment initiation or secondary tolerance following an initial response, underscoring an urgent need for biomarkers to predict and monitor therapeutic efficacy.
Macrophage-like cells (MLC) represent a heterogeneous group of inflammatory cells that actively participate in the pathogenesis of macular edema[11−13]. Currently, en face optical coherence tomography (OCT) allows non-invasive visualization of epiretinal macrophage-like cells (eMLC) adjacent to the inner limiting membrane[14]. Our previous study demonstrated that eMLC density may reflect the severity of retinal inflammation and the degree of vascular permeability[14,15]. Moreover, we found that eyes with acute RVO exhibited a generalized increase in eMLC density along with morphological changes, indicating aggregation and activation of those inflammatory cells after vascular occlusion[13]. In addition, higher eMLC density was associated with greater macular thickness in RVO patients. These findings suggested that eMLCs may play a role in the pathogenesis of macular edema and may serve as potential biomarkers to predict and monitor therapeutic efficacy. However, whether regional changes in eMLC density can serve as a biomarker for treatment response remains unclear. Therefore, the present study aimed to evaluate whether regional changes in eMLC density after initial anti-VEGF therapy in patients with BRVO could serve as biomarkers for treatment response.
-
This retrospective longitudinal study included treatment-naïve patients with unilateral BRVO who presented to at Zhongshan Ophthalmic Center, China, between June 2021 and June 2023. All participants underwent comprehensive ophthalmic examinations, including assessment of refractive error (autorefractometry), best-corrected visual acuity (BCVA, logMAR), intraocular pressure, fundus photography, and optical coherence tomography angiography (OCTA) examination. Exclusion criteria were as follows: (1) age < 18 years; (2) refractive error > 3 diopters; (3) presence of any other ocular conditions affecting retinal structures (e.g., epiretinal membrane, glaucoma, diabetic retinopathy, uveitis); (4) history of intraocular surgery, ocular trauma, laser photocoagulation, or prior anti-VEGF or corticosteroid treatment; (5) poor-quality OCTA images (scan quality < 6 or significant motion artifacts). Patients who declined any treatment for BRVO but returned for follow-up after 4−5 weeks were assigned to the control group, while those who received anti-VEGF therapy constituted the anti-VEGF group. In the anti-VEGF group, all patients received a single intravitreal injection of ranibizumab (0.05 mL, 0.5 mg; Lucentis, Novartis) at baseline. The standard 3 + PRN regimen was recommended, but due to economic constraints and limited follow-up adherence, the present study focuses on the anatomical and cellular changes following the first injection. Similarly, the control group returned for follow-up at approximately 4 weeks, so the analysis is also limited to short-term changes after the initial visit. The study adhered to the tenets of the Declaration of Helsinki and was approved by the Institutional Review Board of Zhongshan Ophthalmic Center (No. 2022KYPJ096; dated 19 November 2024). The requirement for informed consent was waived by the same ethics committee because of the retrospective nature of the study and the use of anonymized data.
OCTA and en face OCT imaging
-
Macular parameters were obtained using the AngioVue OCTA system (RTVue-XR Avanti; Optovue, Fremont, CA, USA). The high-density 6 mm × 6 mm macular scan protocol was used to measure average macular thickness and vessel density (VD) in both the superficial capillary plexus (SCP) and deep capillary plexus (DCP). Following image acquisition, en face OCT and OCTA images were generated. Vessel density in the macular region was automatically calculated by the AngioVue software, and macular thickness values within the 6 mm × 6 mm region were also exported. Both parameters were used in subsequent analyses. Only OCTA scans with a signal strength index ≥ 6 and free of significant artifacts were included in the analysis. Scans with poor quality were excluded at the time of enrollment. After automated segmentation by the AngioVue software, all B-scan images were visually inspected by a trained grader. If the automated segmentation lines deviated from the correct anatomical boundaries, manual adjustments were performed using the software's built-in semi-automatic correction tool. The grader adjusted the segmentation point-by-point on each B-scan where necessary, ensuring that the en face slabs were precisely positioned. OCTA examinations were performed at baseline and at 4 weeks after treatment in the anti-VEGF group. In the control group, follow-up examinations were performed at a median of 4 weeks, with 10 patients returning at 4 weeks and two at 5 weeks.
eMLC isolation and quantification
-
eMLCs were visualized and quantified using a previously described method[14,16]. Briefly, a manually adjusted 3-μm slab above the inner limiting membrane (ILM) was used to capture eMLCs on en face OCT images, as this layer provides optimal structural contrast. The retinal nerve fiber layer (RNFL), located 0–28 μm below the ILM, was also segmented for reference. Using these two slabs, eMLCs were isolated and subsequently quantified via a semiautomated binarization process in ImageJ (National Institutes of Health, Bethesda, MD, USA)[16]. The binarization procedure included noise reduction to remove background irregularities and vessel artifacts, signal enhancement to improve cell identification, and thresholding to delineate distinct cell profiles. The 'Analyze Particles' function in ImageJ was then applied to count the number of eMLCs based on the binarized images. All quantifications were performed by a single masked grader who was blinded to clinical and imaging data. To assess intra-observer reproducibility, 20 randomly selected baseline global macular images were re-analyzed by the same observer after a 1-week interval. The intraclass correlation coefficient for eMLC density was 0.82 (95% CI: 0.65–0.92), and the mean coefficient of variation was 10.7% (range 3.5%–18.2%), indicating good repeatability of the semi-automated quantification method.
Regional definitions and eMLC density calculation
-
Based on our previously established methods[13], the affected, unaffected, perfused, and non-perfused areas were manually delineated and measured using ImageJ. The affected area was defined as the retinal region originally supplied by the occluded branch retinal vein, identified based on fundus photography and OCTA angiography maps. The unaffected area referred to the remaining macular region within the 6 mm × 6 mm scan area that was not supplied by the occluded vessel. The non-perfusion area was defined as the region with no visible capillary signal on OCT angiography within the affected area. The perfused area referred to the remaining macular region within the 6 mm × 6 mm scan area that was supplied by other vessels (Fig. 1). For each region, eMLC density was calculated as the number of eMLCs divided by the corresponding regional area.
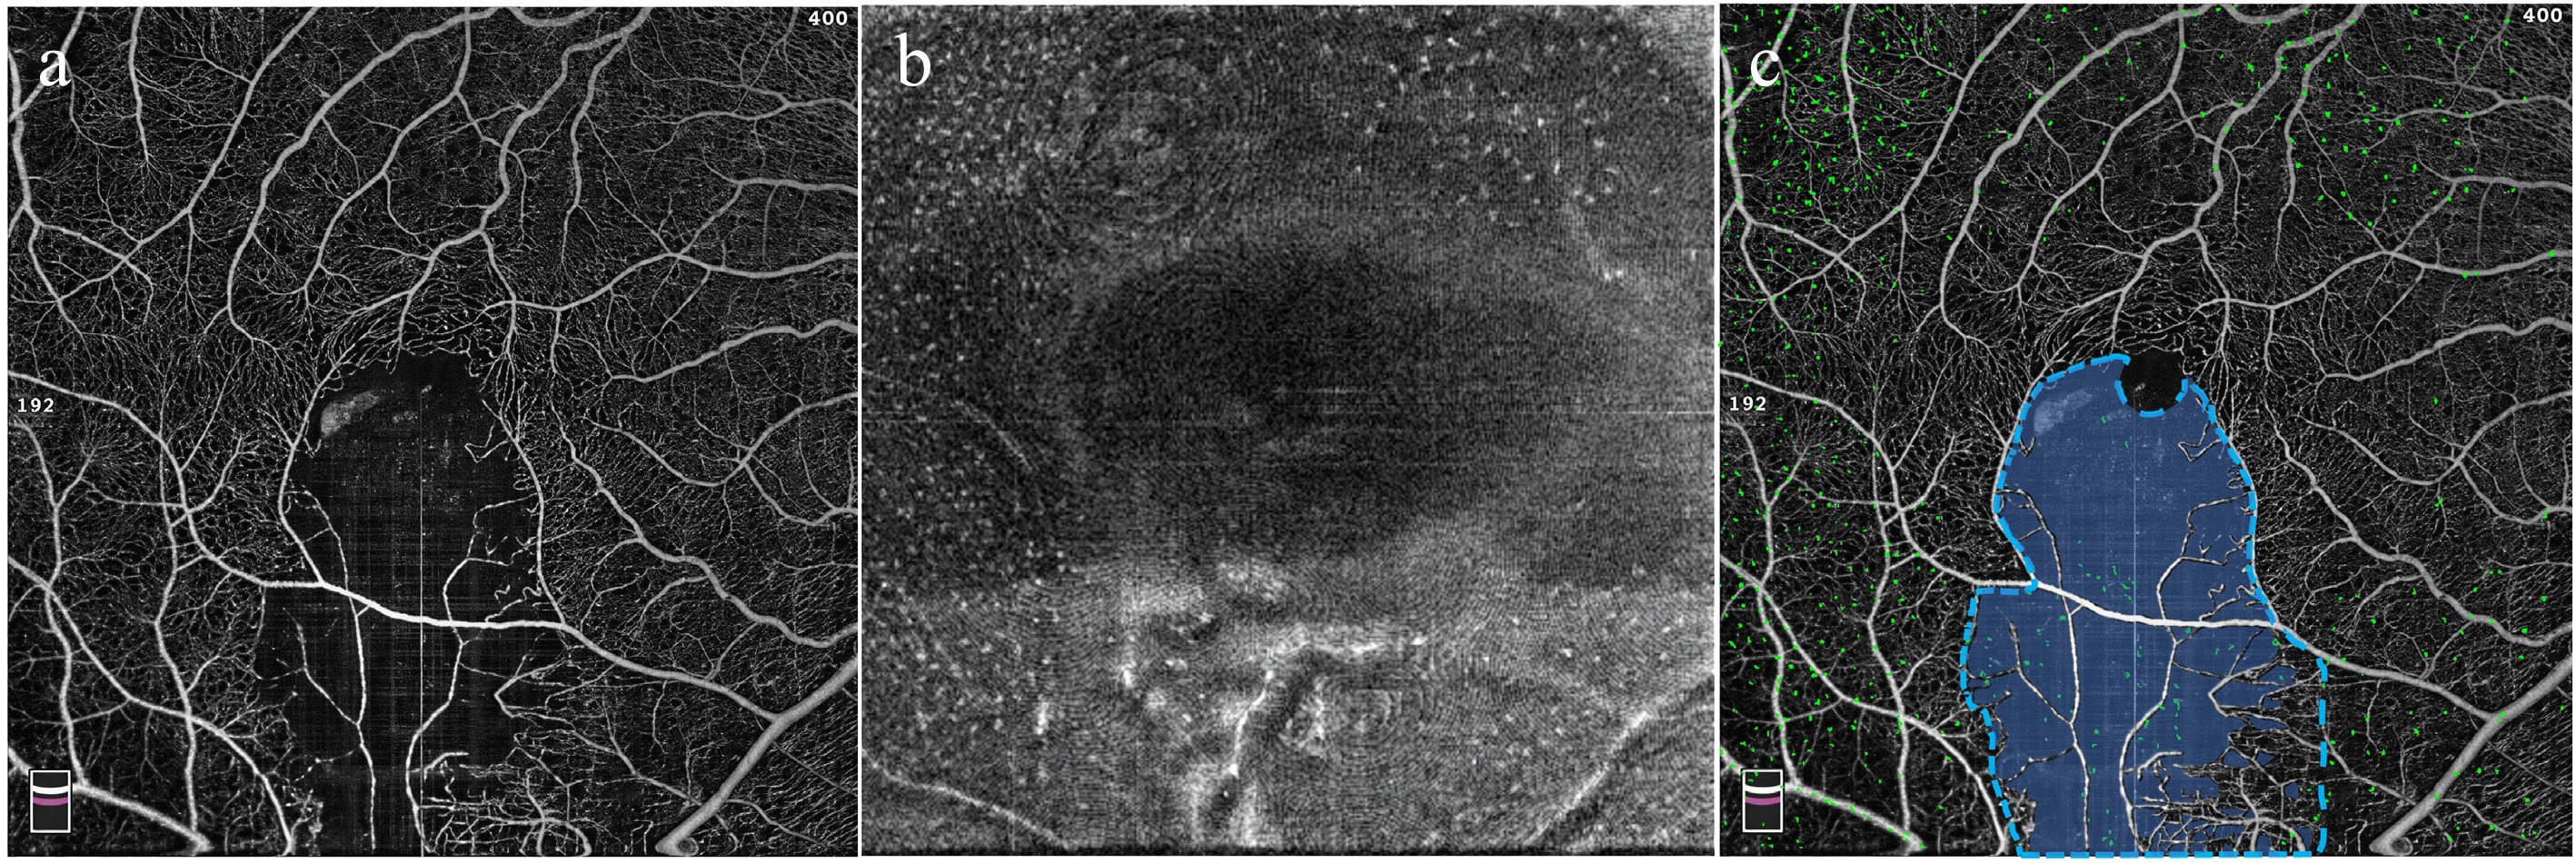
Figure 1.
Schematic illustration of regional definitions and eMLC quantification. (a) Representative OCTA image showing the macular vasculature. (b) En face structural OCT image at the level of the inner limiting membrane showing eMLCs as hyperreflective dots. (c) OCTA image showing the delineation of the affected area (blue dashed line) and non-perfused area (semi-transparent blue overlay). The eMLCs are isolated and overlaid as green dots, showing the topographic distribution of eMLCs.
Statistical analysis
-
Statistical analyses were performed using R software. Demographic and baseline characteristics were summarized as frequencies and percentages for categorical variables and as mean ± standard deviation or median with interquartile range (IQR) for continuous variables. The Shapiro–Wilk test was used to assess the normality of the data distribution. Comparisons of BCVA, vessel density, macular thickness, and eMLC density across different regions between the anti-VEGF and control groups were performed using the Mann–Whitney U test. Spearman's rank correlation coefficient was used to assess the correlation between eMLC density, BCVA, and macular thickness. Variables with a p value < 0.05 in the univariate analysis were then included as candidates in a multivariate stepwise regression analysis to determine the independent factors associated with treatment outcomes. A two-tailed p value < 0.05 was considered statistically significant.
-
A total of 36 treatment-naïve patients with unilateral BRVO were included in this study, comprising 12 patients in the control group and 24 in the anti-VEGF group. The baseline ocular anatomical, functional, and eMLC parameters in the control group and anti-VEGF group were summarized in Tables 1 and 2, respectively. There were no significant differences between the two groups in terms of age (53.25 ± 6.59 vs 52.88 ± 7.84 years, p = 0.856) or gender distribution (p = 0.483). Regarding baseline ocular parameters, no significant differences were observed in baseline BCVA (p = 0.540), the sizes of the affected area (p = 0.856), unaffected area (p = 0.856), perfused area (p = 0.728), or non-perfused area (p = 0.704). Macular vessel density was also comparable between the two groups in both the SCP (p = 0.416) and the DCP (p = 0.728). Similarly, baseline average macular thickness (p = 0.882), global macular eMLC density (p = 0.804), and eMLC density in the affected (p = 0.856), unaffected (p = 0.960), perfused (p = 0.295), and non-perfused area (p = 1.00) were comparable between the two groups.
Table 1. Longitudinal changes in BCVA, retinal structural parameters, and eMLC parameters in the control group.
Baseline Follow-up p value BCVA (logMAR) 0.70 (0.40, 0.98) 0.85 (0.47, 1.10) 0.069 Macular VD in SCP 46.50 (45.25, 48.25) 47.20 (44.43, 48.13) 0.410* Macular VD in DCP 45.60 (43.63, 47.10) 43.70 (39.50, 46.00) 0.018* Average macular thickness (μm) 411.0 (390.25, 473.5) 437.0 (403.5, 522.0) 0.003* Affected area (mm2) 12.80 (10.93, 15.92) 12.80 (10.93, 15.92) n/a Unaffected area (mm2) 23.20 (20.08, 25.07) 23.20 (20.08, 25.07) n/a Perfused area (mm2) 33.90 (31.85, 35.63) 33.15 (31.71, 35.08) 0.271* Non-perfused area (mm2) 2.10 (0.37, 4.15) 2.85 (0.92, 4.72) 0.116* eMLC density (cells/mm2) Global macular 16.93 (12.83, 18.96) 17.63 (14.12, 20.17) 0.023* Affected area 9.27 (6.82, 17.65) 10.84 (8.86, 13.27) 0.657* Unaffected area 18.40 (15.89, 21.29) 20.10 (15.49, 25.77) 0.028* Perfused area 13.30 (9.44, 18.98) 18.25 (11.83, 28.60) 0.003* Non-perfused area 12.41 (5.57, 14.99) 9.65 (6.81, 17.88) 1.000* BCVA = best-corrected visual acuity; eMLC = epiretinal macrophage-like cell; VD = vessel density; SCP = superficial capillary plexus; DCP = deep capillary plexus; * = Data were presented as the median with interquartile range (IQR) and compared by the Wilcoxon signed-rank test. Bold values indicate statistical significance (p < 0.05). Table 2. Longitudinal changes in BCVA, retinal structural parameters and eMLC parameters in the anti-VEGF group.
Baseline Follow-up p value BCVA (logMAR) 0.70 (0.40, 1.00) 0.22 (0.13, 0.40) < 0.001* Macular VD in SCP 46.30 (42.40, 47.78) 44.80 (41.00, 47.13) 0.219* Macular VD in DCP 44.55 (42.80, 46.95) 42.50 (40.53, 44.80) 0.001* Average macular thickness (μm) 415.0 (365.75, 522.75) 313.5 (303.00, 333.00) < 0.001* Affected area (mm2) 13.16 (11.38, 15.48) 13.16 (11.38, 15.48) n/a Unaffected area (mm2) 22.85 (20.52, 24.62) 22.85 (20.52, 24.62) n/a Perfused area (mm2) 34.09 (31.24, 35.00) 32.55 (30.36, 34.76) < 0.001* Non-perfused area (mm2) 1.91 (1.00, 4.77) 3.46 (1.25, 5.64) < 0.001* eMLC density (cells/mm2) Global macular 15.28 (11.83, 22.15) 10.07 (6.89, 14.28) < 0.001* Affected area 10.63 (8.76, 15.30) 7.59 (4.24, 11.08) < 0.001* Unaffected area 17.19 (12.69, 27.83) 13.08 (7.68, 17.73) < 0.001* Perfused area 15.30 (11.17, 22.37) 10.84 (7.01, 14.46) < 0.001* Non-perfused area 11.48 (6.95, 15.14) 5.87 (1.80, 9.35) 0.002* BCVA = best-corrected visual acuity; eMLC = epiretinal macrophage-like cell; VEGF = vascular endothelial growth factor; VD = vessel density; SCP = superficial capillary plexus; DCP=deep capillary plexus; * = Data were presented as median with interquartile range (IQR) and compared by the Wilcoxon signed-rank test. Bold values indicate statistical significance (p < 0.05). Longitudinal changes in ocular parameters in the control group
-
Table 1 summarizes the longitudinal changes in BCVA, retinal structural parameters, and eMLC metrics in the control group over the follow-up period. Most parameters remained stable between baseline and follow-up, including BCVA (p = 0.069), macular vessel density in SCP (p = 0.410), and the areas of affected, unaffected, perfused, and non-perfused areas (all p > 0.05). However, a significant decrease was observed in macular vessel density in DCP from 45.60 (43.63, 47.10) to 43.70 (39.50, 46.00) (p = 0.018). The average macular thickness at the follow-up visit was higher than baseline (p = 0.003).
Significant increases in eMLC density were observed globally (p = 0.023), as well as in the unaffected area (p = 0.028) and the perfused area (p = 0.003). In contrast, eMLC density in the affected area and non-perfused area remained comparable between the two time points (all p > 0.05).
Longitudinal changes in ocular parameters in the anti-VEGF group
-
Longitudinal changes in BCVA, retinal structural parameters, and eMLC metrics in the anti-VEGF group are shown in Table 2. In contrast to the control group, marked improvements were observed across most parameters after treatment. The BCVA significantly improved after anti-VEGF therapy (p < 0.001). Regarding vascular parameters, macular vessel density in DCP decreased significantly from 44.55 (42.80, 46.95) at baseline to 42.50 (40.53, 44.80) at follow-up (p = 0.001), while no significant change was noted in the SCP (p = 0.219). Average macular thickness showed a substantial reduction from 415.0 (365.75, 522.75) μm at baseline to 313.5 (303.00, 333.00) μm at follow-up (p < 0.001). Regional analysis revealed a significant decrease in perfused area from 34.09 (31.24, 35.00) mm2 to 32.55 (30.36, 34.76) mm2 (p < 0.001), accompanied by a corresponding expansion of non-perfused area from 1.91 (1.00, 4.77) mm2 to 3.46 (1.25, 5.64) mm2 (p < 0.001).
For eMLC parameters, global macular eMLC density decreased significantly from 15.28 (11.83, 22.15) cells/mm2 at baseline to 10.07 (6.89, 14.28) cells/mm2 at follow-up (p < 0.001). This reduction was consistently observed across all four regions examined: affected area (p < 0.001), unaffected area (p < 0.001), perfused area (p < 0.001), and non-perfused area (p = 0.002).
Comparison of ocular parameters between the control and anti-VEGF groups at follow-up
-
At the follow-up visit, significant differences were observed between the control and anti-VEGF groups in several ocular parameters (Fig. 2). No significant differences were observed between the two groups in macular vessel density of either SCP (p = 0.097, Fig. 2a) or DCP (p = 0.856, Fig. 2b), affected area (p = 0.856, Fig. 2d), unaffected area (p = 0.856, Fig. 2d), perfused area (p = 0.311, Fig. 2e), and non-perfused area (p = 0.398, Fig. 2f). Additionally, average macular thickness was markedly lower in the anti-VEGF group compared with controls (p < 0.001, Fig. 2c). The BCVA was better in the anti-VEGF group than the control group at follow-up (p < 0.001, Fig. 2g).
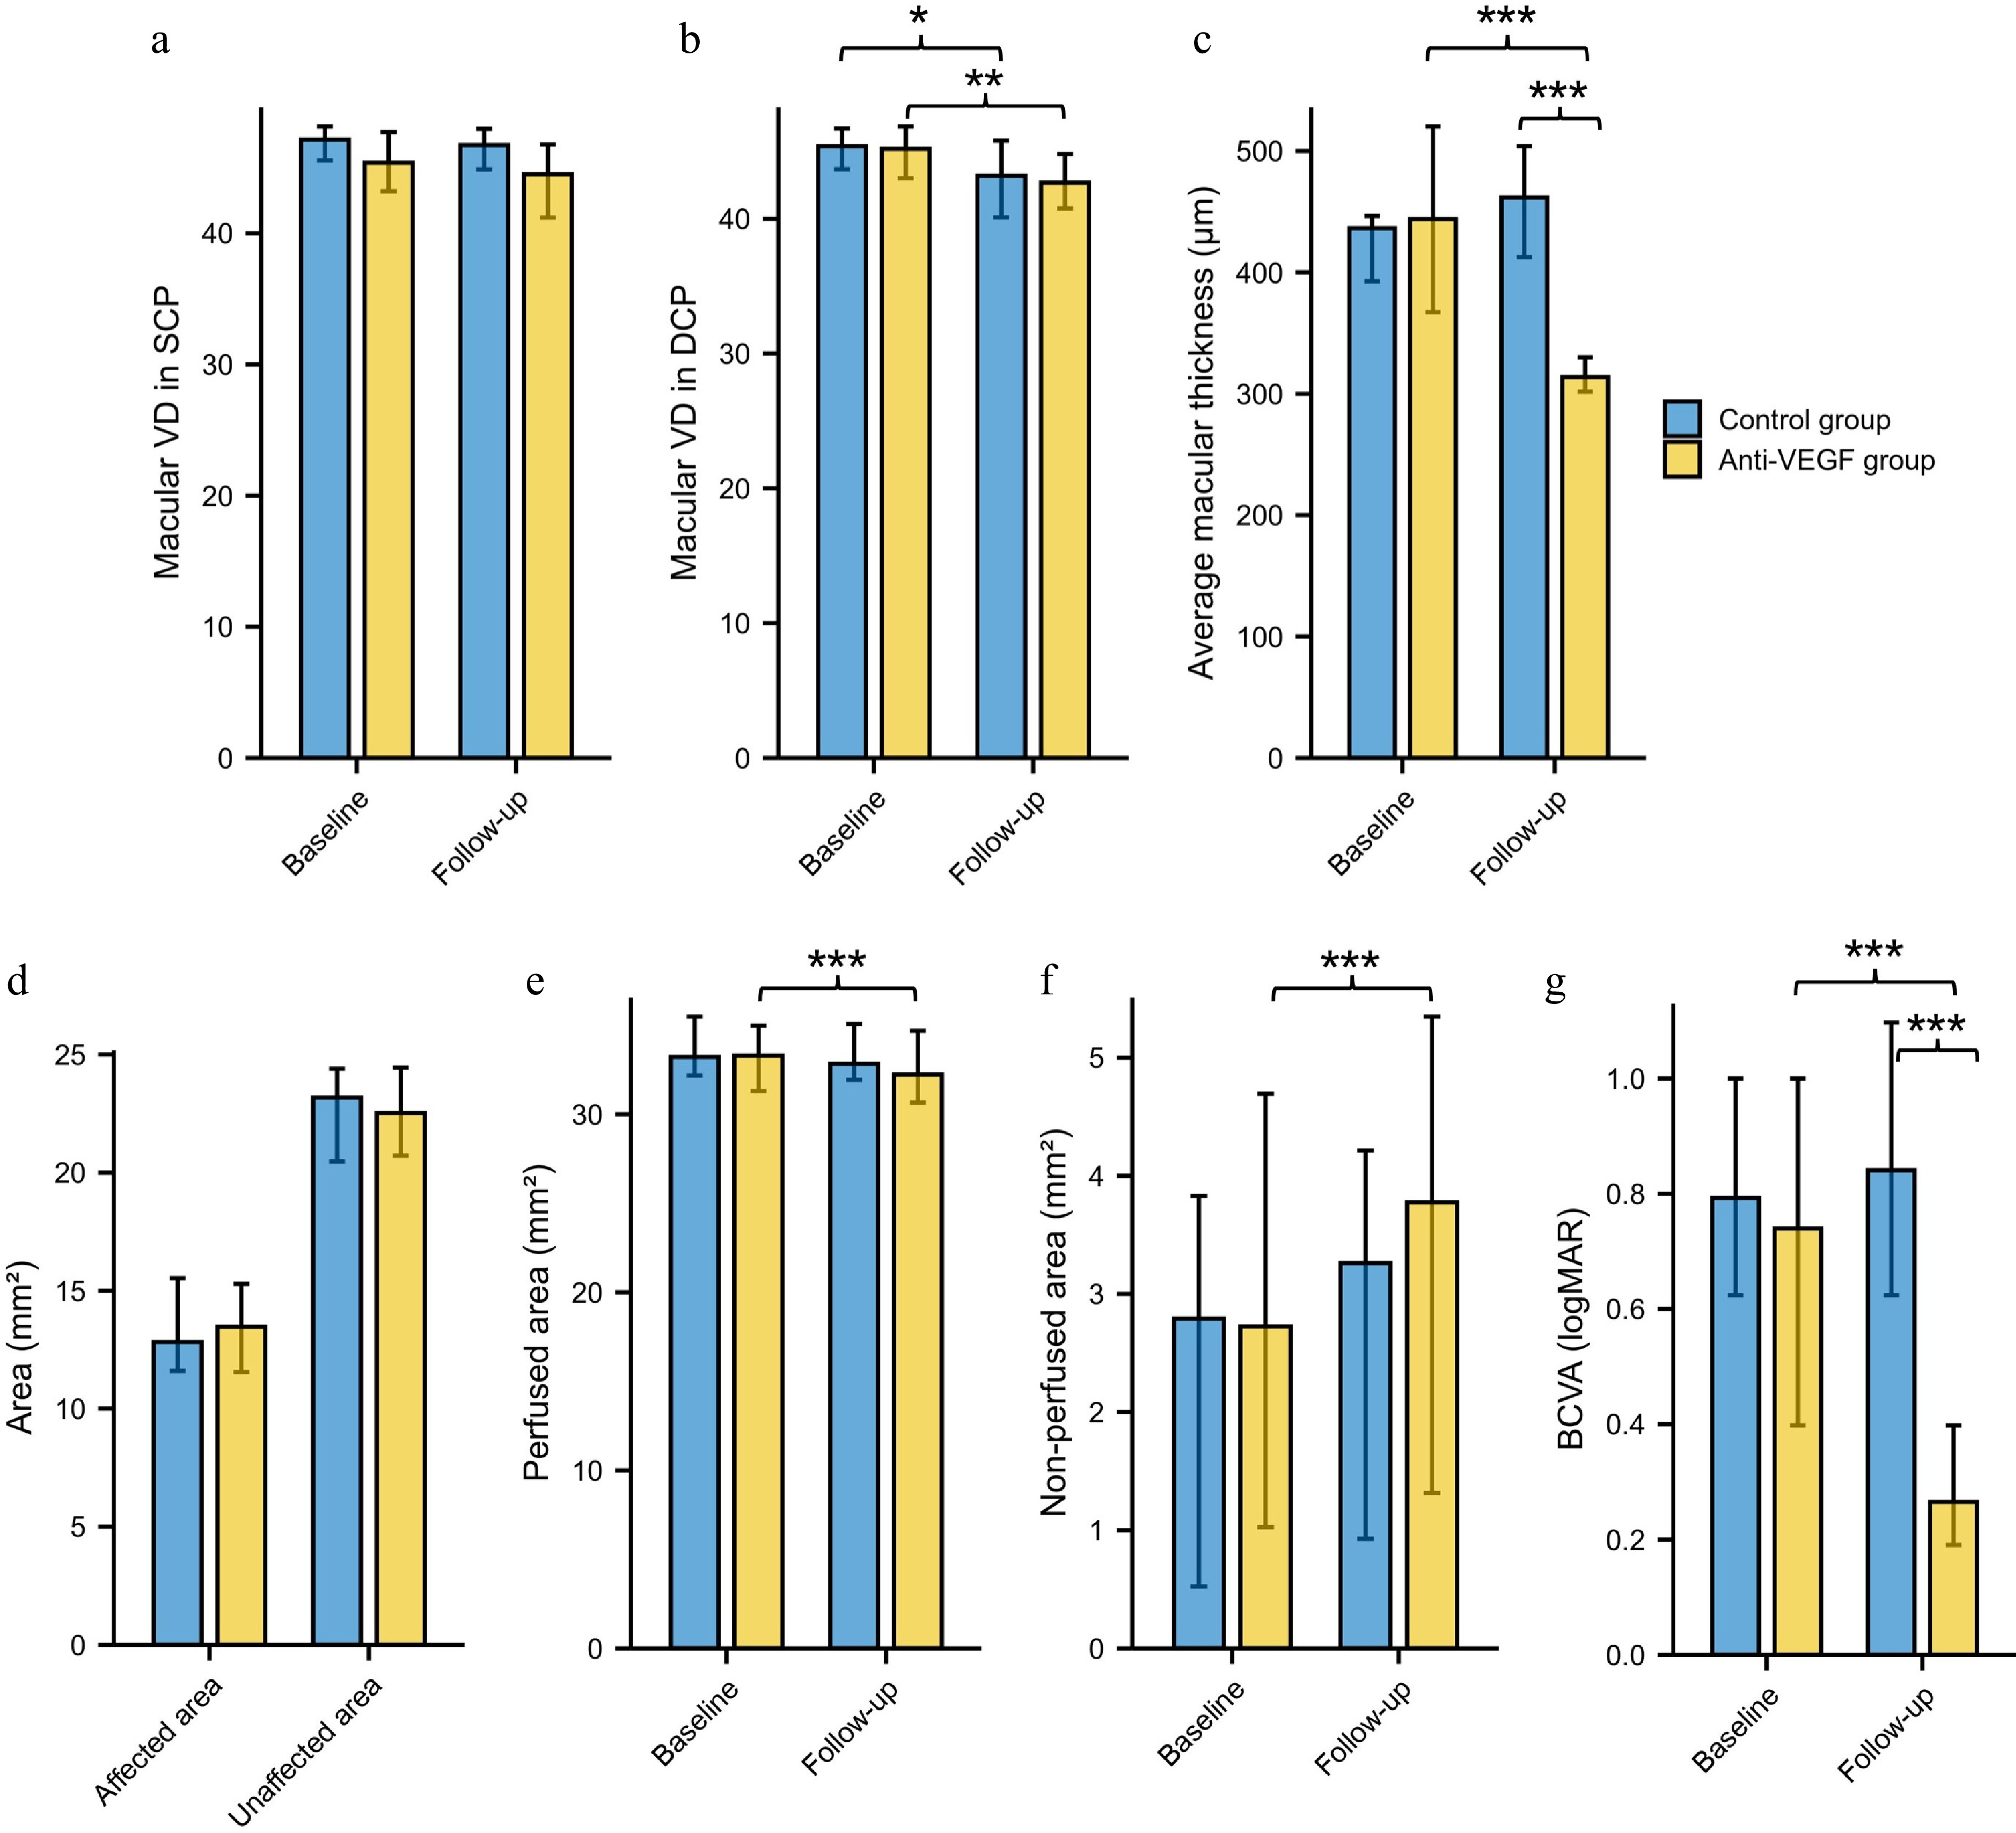
Figure 2.
Longitudinal changes and comparisons of ocular parameters in the control and anti-VEGF groups. Macular vessel density in the (a) SCP and (b) DCP. (c) Average macular thickness. (d) Affected and unaffected area. (e) Perfused area. (f) Non-perfused area. (g) BCVA. BCVA = best-corrected visual acuity; VEGF = vascular endothelial growth factor; VD = vessel density; SCP = superficial capillary plexus; DCP = deep capillary plexus; * p < 0.05, ** p < 0.01, *** p < 0.001.
Global macular eMLC density was significantly lower in the anti-VEGF group compared with the control group at follow-up visit (p = 0.001, Fig. 3a). Regional analysis of eMLC density revealed that the anti-VEGF group exhibited significantly lower values in the affected area (p = 0.032, Fig. 3b), unaffected area (p = 0.002, Fig. 3c), perfused area (p = 0.004, Fig. 3d), and non-perfused area (p = 0.013, Fig. 3e). Representative cases from the control group and the anti-VEGF group are presented in Fig. 4.
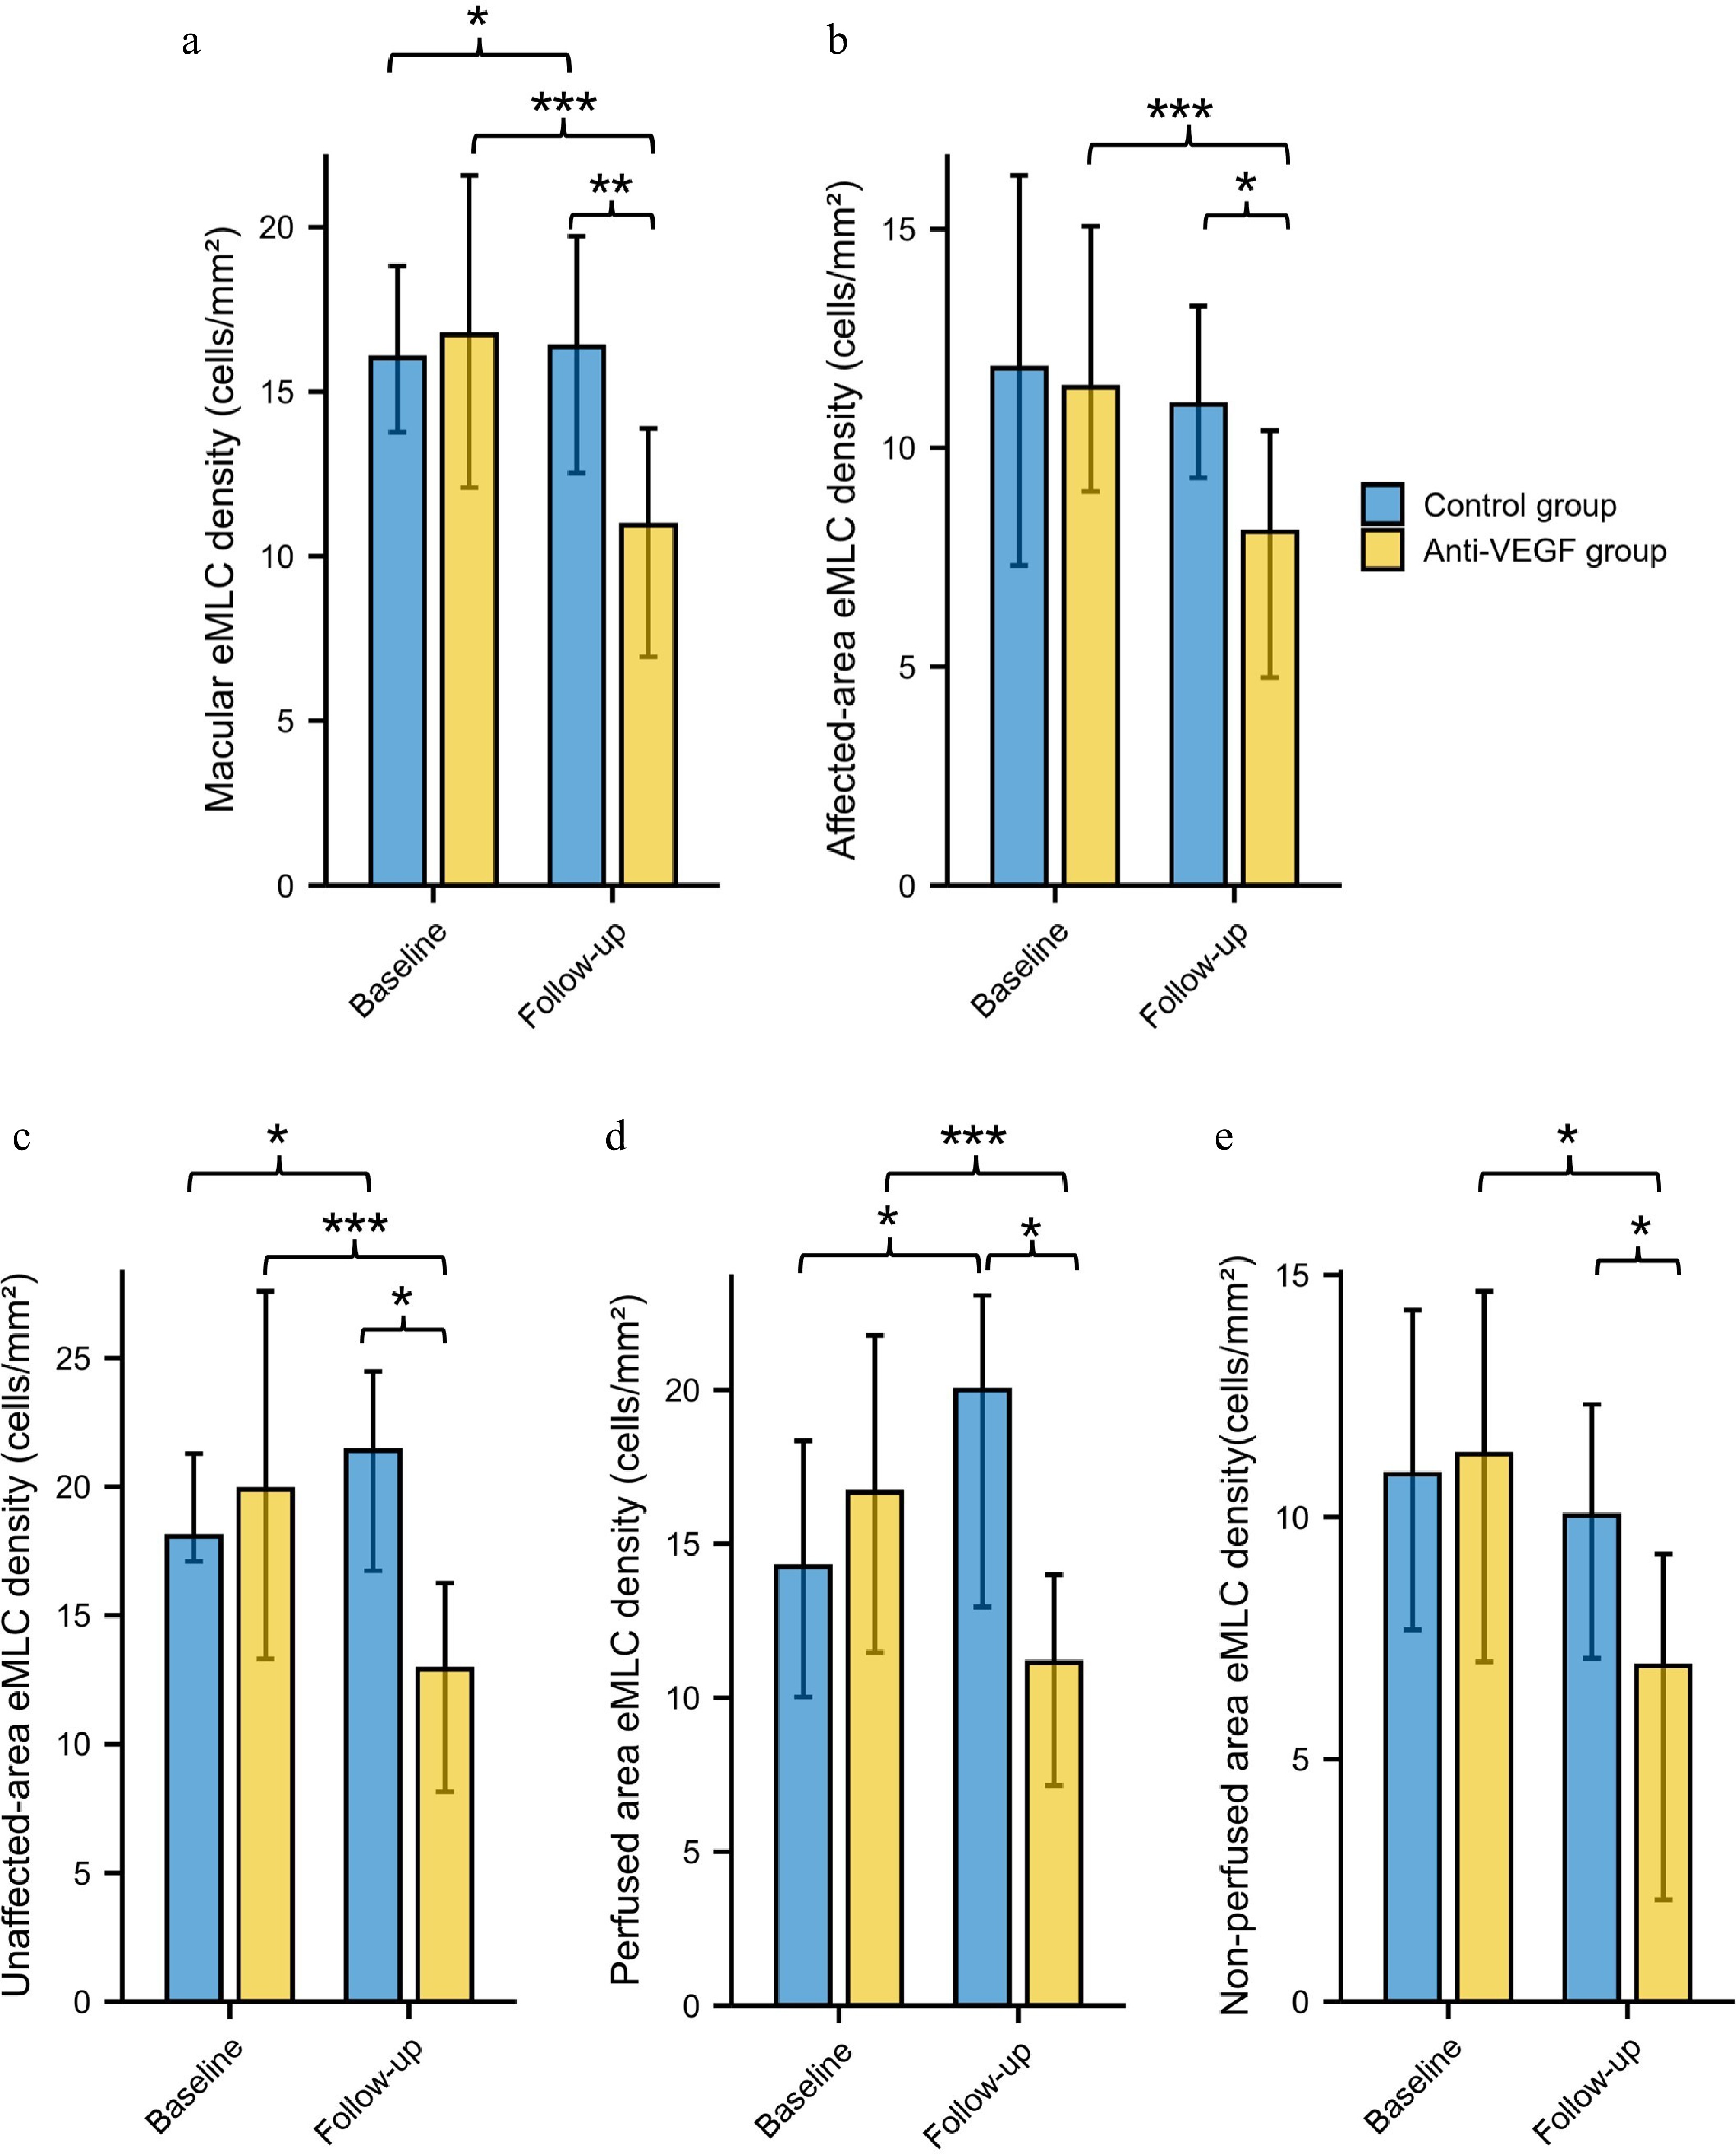
Figure 3.
Longitudinal changes and comparisons of eMLC parameters in the control and anti-VEGF groups. (a) Global macular eMLC density. (b) eMLC density in the affected area. (c) eMLC density in the unaffected area. (d) eMLC density in perfused area. (e) eMLC density in non-perfused area. VEGF = vascular endothelial growth factor; eMLC = epiretinal macrophage-like cell. * p < 0.05, ** p < 0.01, *** p < 0.001.
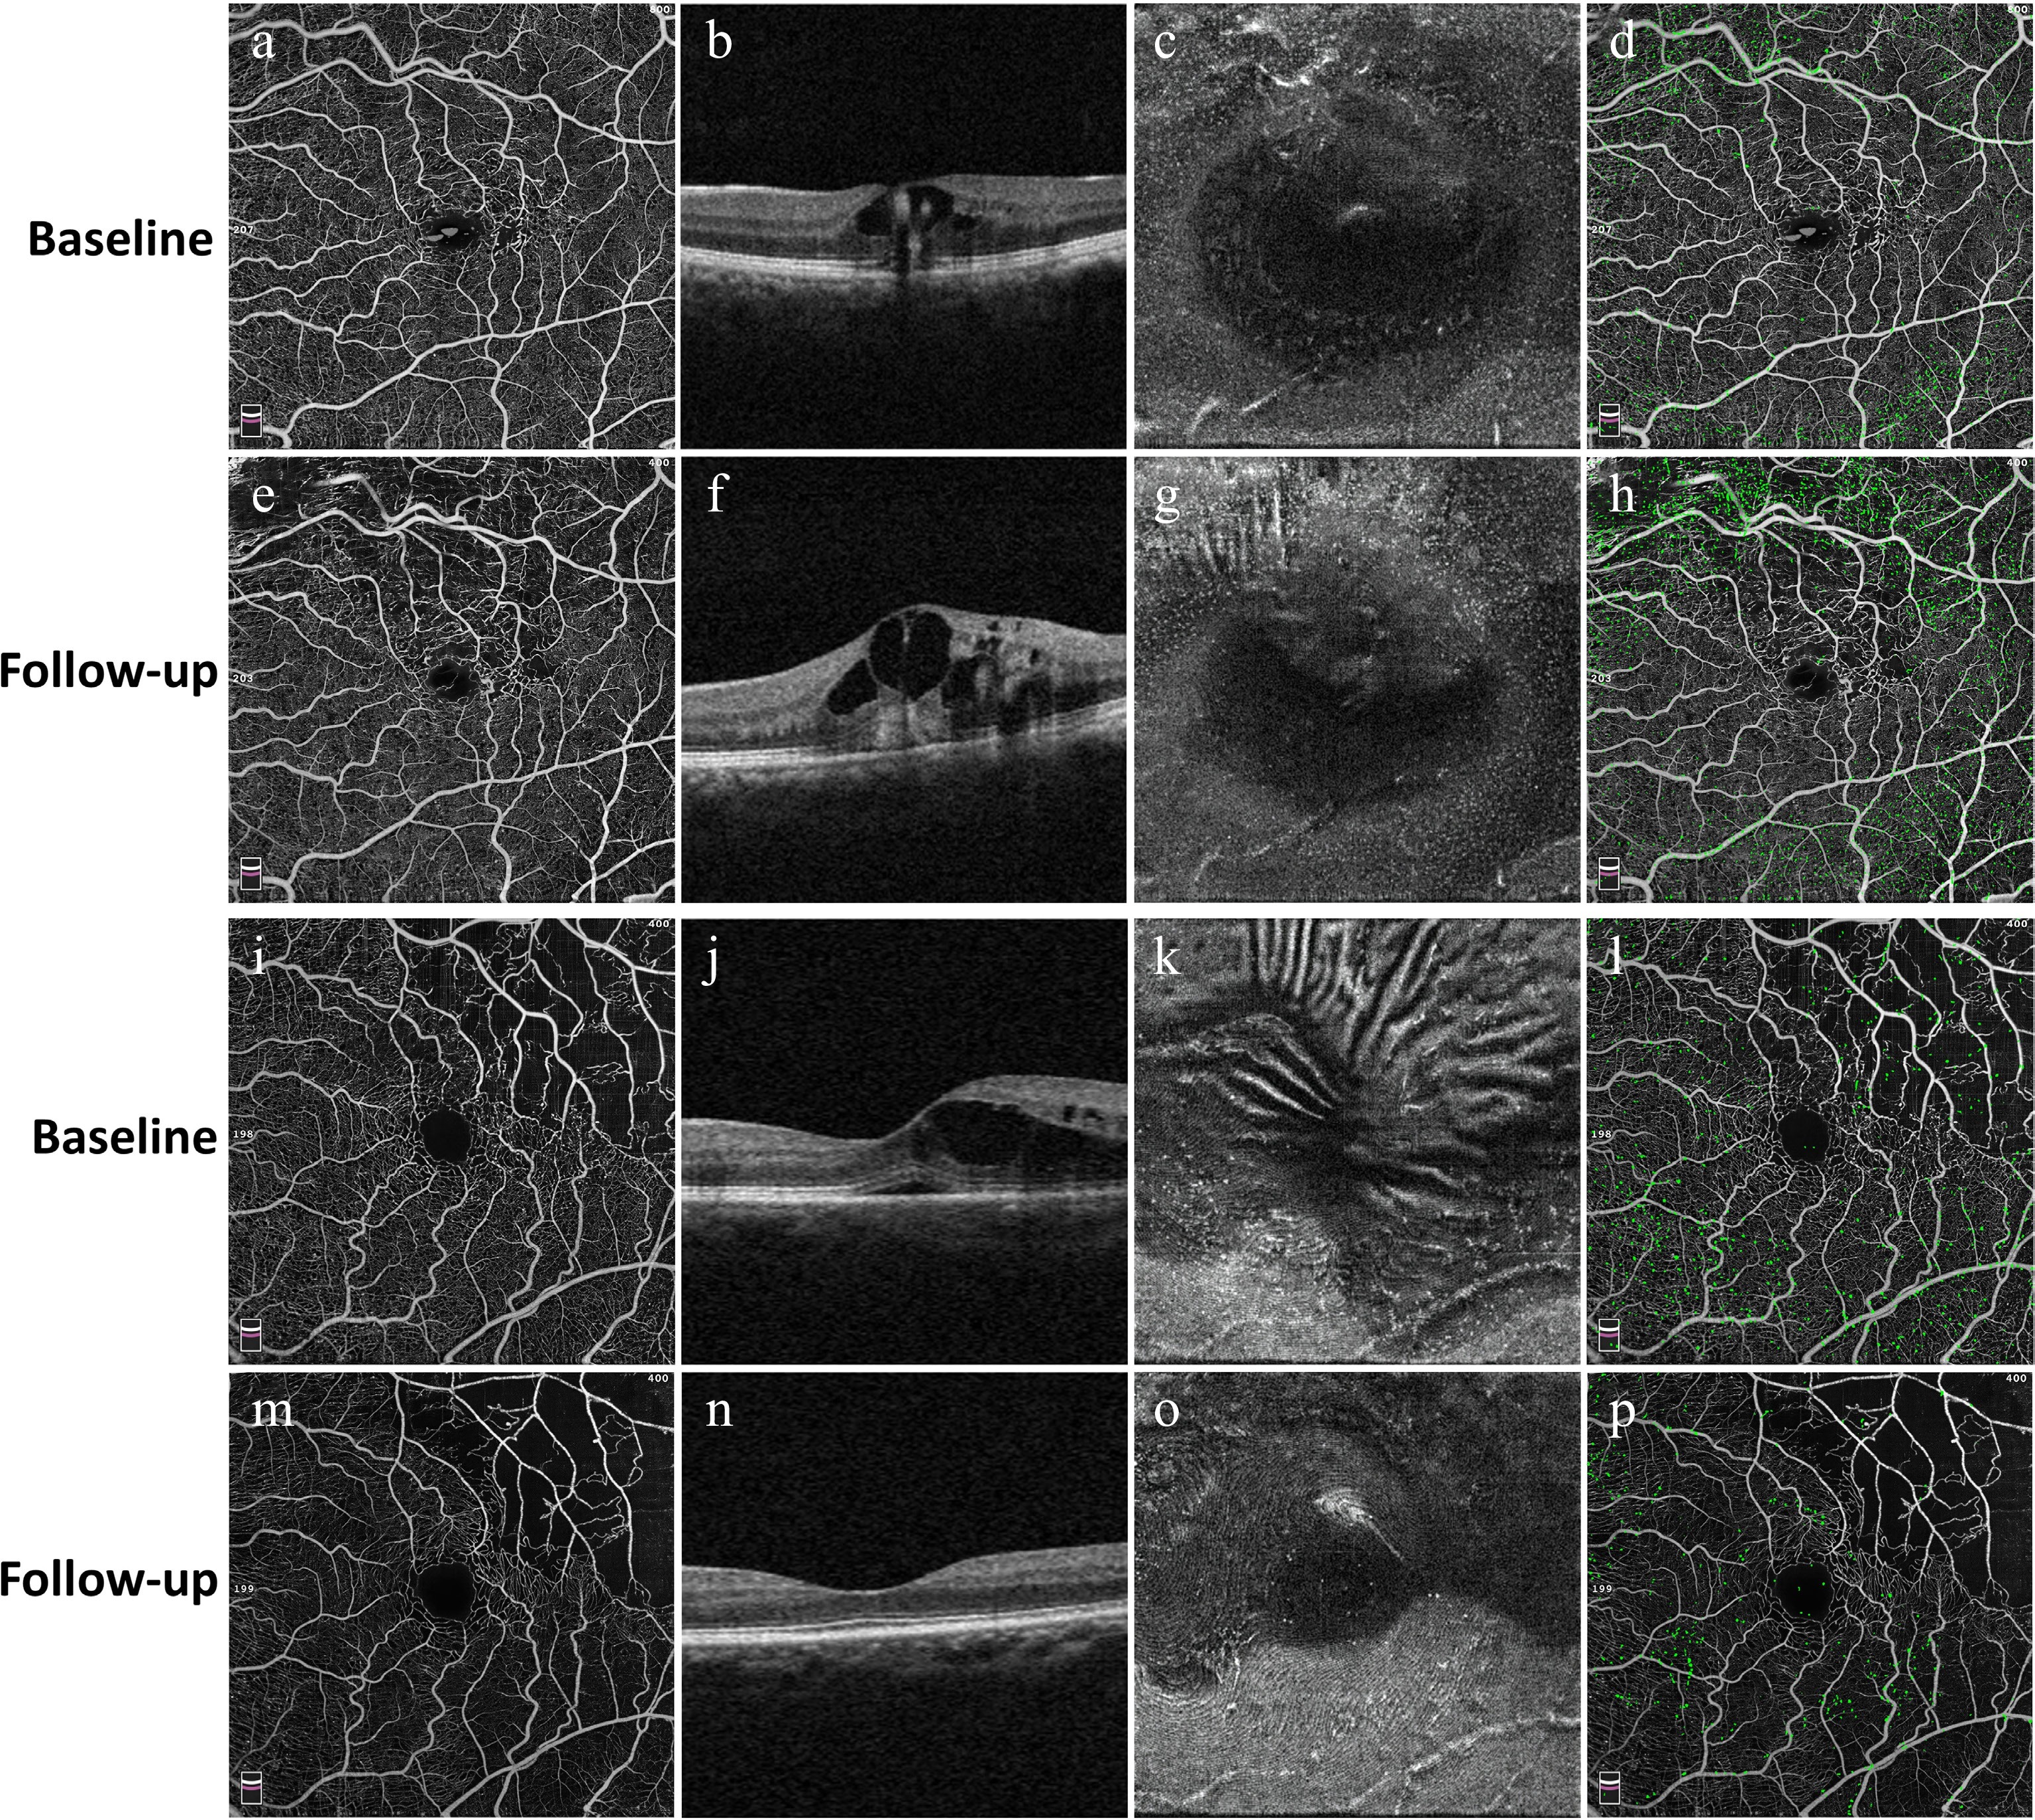
Figure 4.
Representative cases illustrating longitudinal changes in structural and eMLC parameters in the control group (a)–(h) and the anti-VEGF group (i)–(p). For each group, the first column (a), (e), (i), and (m) shows en face OCT angiography images of the macular region at baseline and follow-up. The second column (b), (f), (j), and (n) presents corresponding B-scan OCT images demonstrating changes in macular edema. The third column (c), (g), (k), and (o) displays en face OCT images at the 3-μm slab above the ILM, visualizing eMLCs as hyperreflective dots. The fourth column (d), (h), (l), and (p) shows overlays of the retinal vascular network and detected eMLCs (green), illustrating the spatial distribution of eMLCs in relation to the underlying vasculature. In the control group, eMLC density increased, and macular edema worsened after untreated follow-up, whereas the anti-VEGF group exhibited marked resolution of macular edema accompanied by a significant reduction in eMLC density.
Correlation between eMLC density and macular thickness outcomes
-
Spearman correlation analysis was first performed to evaluate the relationship between baseline eMLC density, follow-up macular thickness, and BCVA in the anti-VEGF group. Baseline global macular eMLC density showed a significant negative correlation with the reduction in macular thickness from baseline to follow-up (r = −0.438, p = 0.032) (Fig. 5a). Regarding regional analysis, the average macular thickness at the 1-month follow-up visit was positively correlated with baseline eMLC density in the unaffected area (r = 0.480, p = 0.018) and baseline eMLC density in the non-perfused area (r = 0.541, p = 0.006) (Fig. 5b). Multivariate stepwise linear regression analysis, adjusted for age and gender, showed that baseline eMLC density in the non-perfused area was the only independent factor associated with the average macular thickness at the 1-month follow-up visit (standardized β = 0.547, p = 0.006, adjusted R2 = 0.267).
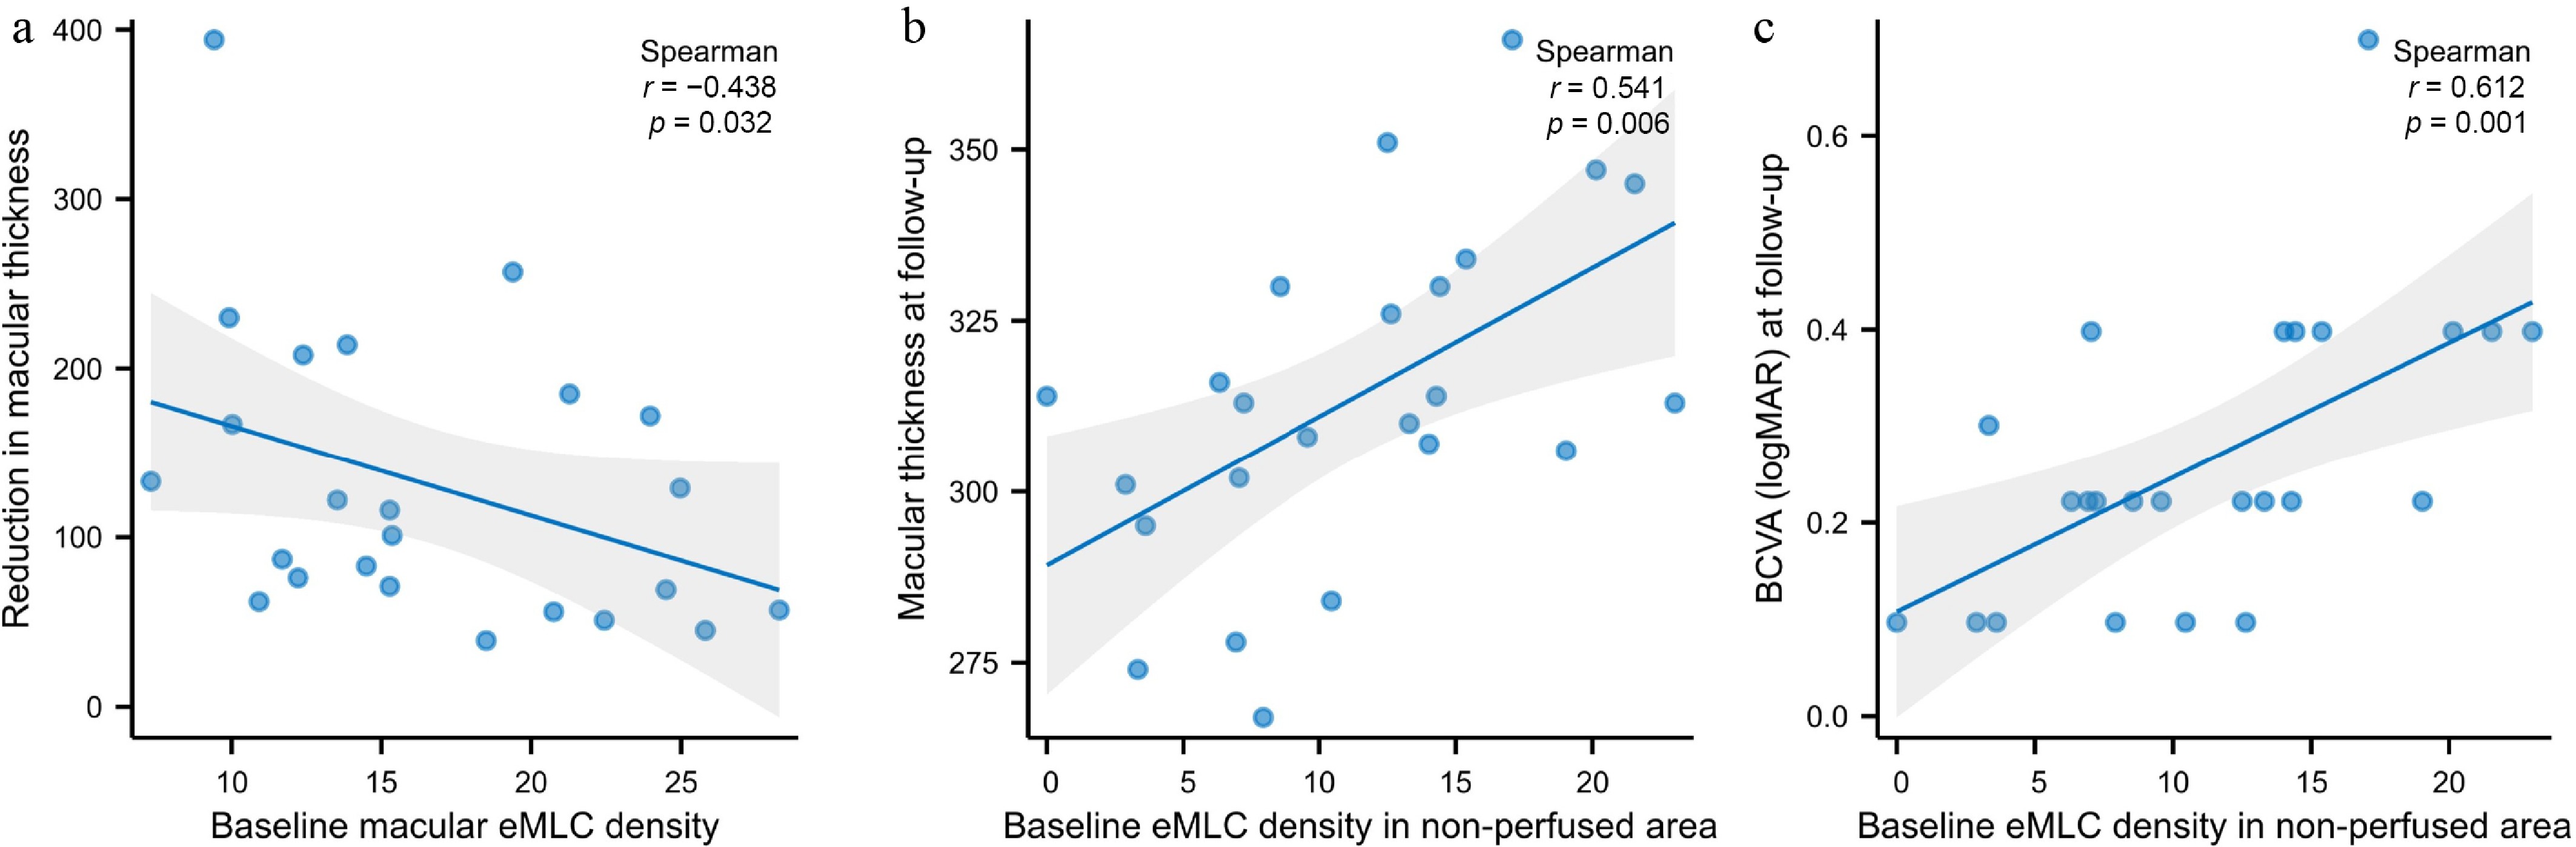
Figure 5.
Scatter plots showing correlations between eMLC density and treatment outcomes. (a) Baseline global macular eMLC density showed a significant negative correlation with the reduction in macular thickness from baseline to follow-up (r = −0.438, p = 0.032). (b) Baseline eMLC density in the non-perfused area was positively correlated with macular thickness at the 1-month follow-up visit (r = 0.541, p = 0.006). (c) Baseline eMLC density in the non-perfused area was positively correlated with logMAR BCVA at the 1-month follow-up visit (r = 0.612, p = 0.001).
In terms of factors associated with BCVA after treatment, Spearman correlation analysis showed that BCVA was associated with baseline global macular eMLC density (r = 0.439, p = 0.032), baseline eMLC density in the unaffected area (r = 0.412, p = 0.045), and baseline eMLC density in the non-perfused area (r = 0.612, p = 0.001) (Fig. 5c). Multivariate stepwise linear regression analysis, adjusted for age and gender, showed that baseline eMLC density in the non-perfused area was the only independent factor associated with BCVA at the 1-month follow-up visit (standardized β = 0.586, p = 0.003, adjusted R2 = 0.314).
-
In this retrospective longitudinal study, we investigated the changes in macular structural parameters, BCVA, and eMLC density following a single anti-VEGF injection in patients with treatment-naïve BRVO. Anti-VEGF therapy induced a significant and widespread reduction in eMLC density across all macular regions, concomitant with a marked decrease in average macular thickness as well as an improvement in BCVA. Baseline global macular eMLC density showed a significant negative correlation with the reduction in macular thickness, indicating that higher baseline eMLC density was associated with less anatomical improvement. Regional analysis further revealed that higher baseline eMLC density in the non-perfused area was associated with greater residual macular edema and worse BCVA after treatment.
The eMLC density decreased significantly across all macular regions after anti-VEGF treatment. Retinal tissue ischemia and hypoxia are key events that trigger dysfunction of the blood-retinal barrier, contributing to the development of macular edema[11]. Macrophage-like cells, including microglia, play essential roles in the local immune response and immune surveillance[4]. Under normal conditions, microglia help stabilize tight junctions between vascular endothelial cells and contribute to the formation and maintenance of the inner blood-retinal barrier[4]. Following retinal vein occlusion, microglia and other macrophage-like cells become activated and migrate, altering blood-retinal barrier function by releasing pro-inflammatory cytokines while reducing the production of anti-inflammatory mediators[4,17−19]. Ultimately, these events contribute to the development of macular edema. Although eMLCs are not the primary target of anti-VEGF agents, these drugs exert broad anti-inflammatory effects through multiple pathways, including inhibition of vascular permeability, reduction of inflammatory cell infiltration, modulation of the retinal neurovascular unit, and regulation of inflammatory mediators[20,21]. The observed reduction in eMLC density following anti-VEGF therapy may therefore reflect the subsidence of retinal inflammation and restoration of blood-retinal barrier integrity.
eMLC may be a biomarker for treatment response in patients with macular edema secondary to BRVO. The general decrease in eMLC density after anti-VEGF treatment in our study is inconsistent with another study[21]. Bai et al. investigated a cohort of patients with BRVO who received at least one anti-VEGF injection and found that macular eMLC density significantly decreased after three consecutive injections[21]. Although macular eMLC density in patients who received one or two injections appeared lower than at baseline, the difference did not reach statistical significance. However, the macular eMLC density significantly decreased after a single injection in our cohort. This discrepancy may be attributed to differences in the timing of follow-up assessments. In the study by Bai et al.[21], eMLC density was measured at 3 months after treatment initiation, regardless of the number of injections received. For patients who received only one or two injections, macular edema may have already recurred by the 3-month time point, potentially leading to a rebound in eMLC density and thus diluting the observed treatment effect. In addition, their study found that the change in central macular thickness was positively correlated with the change in eMLC density, suggesting that a greater reduction in inflammation was accompanied by greater improvement in macular edema. We did not find a significant association between the change in macular thickness and the change in eMLC density (data not shown). Instead, our study revealed that higher baseline eMLC density was associated with a smaller reduction in macular thickness, indicating that elevated baseline eMLC levels may predict poorer treatment response. This conclusion is consistent with Rangwani et al., who reported that higher global macular eMLC density was associated with an increased number of subsequent intravitreal injections[22]. Therefore, baseline eMLC density may serve as a clinically useful biomarker for identifying treatment-resistant BRVO.
The finding that higher baseline eMLC density predicts poorer treatment response to anti-VEGF therapy may be explained by the role of eMLCs as indicators of baseline inflammatory burden and the extent of blood-retinal barrier disruption. Our previous study found that eMLC density is positively associated with the degree of vascular leakage in Behçet's Uveitis[15]. Another study reported a nonlinear relationship between eMLC and macular leakage in diabetic retinopathy[23]. Specifically, eMLC density peaked at moderate levels of leakage and declined as leakage became more severe in diabetic retinopathy, a pattern that may reflect a functional shift in MLC activity or their migration to deeper retinal layers in response to advanced leakage[23]. These findings underscore the potential of eMLC density as a biomarker for identifying 'inflammatory-dominant' edema that may benefit from adjunctive anti-inflammatory strategies.
Another interesting finding of our study is that baseline eMLC density in the non-perfused area positively correlated with residual macular thickness and logMAR BCVA after anti-VEGF treatment. This may reflect the extent of irreversible retinal damage and sustained inflammation within ischemic regions. Although eMLCs were less abundant in non-perfused areas at baseline compared with perfused regions, likely due to impaired vascular delivery of monocyte-derived macrophages and a preference for metabolically active environments[4,13,24], higher eMLC density within the non-perfused area, when present, may indicate more intense local inflammation and greater disruption of the blood-retinal barrier prior to treatment. Such regions may already have substantial structural damage, limiting their capacity for full anatomical and functional recovery despite anti-VEGF therapy. Taken together, these findings suggest that eMLC density in non-perfused areas may serve as a marker for identifying eyes with limited treatment response, which may require more intensive or adjunctive anti-inflammatory strategies.
This study has several strengths. First, it is among the few to investigate longitudinal changes in eMLC density after anti-VEGF therapy in BRVO. Second, unlike previous studies with only before-and-after comparisons, we included a treatment-naïve control group, allowing differentiation of treatment-specific effects from the natural disease course. Third, regional analysis across affected, unaffected, perfused, and non-perfused areas provided comprehensive insights into eMLC dynamics. Several limitations should be acknowledged. First, the sample size was relatively small, particularly in the control group, which may limit the statistical power and generalizability of our findings. The imbalance in group sizes is an inherent limitation, as the control group consisted of patients who voluntarily declined treatment, which is rare. Second, the follow-up period was relatively short, and there was slight variability in the exact follow-up intervals among control patients, which may have introduced bias. Future studies with larger cohorts and extended follow-up are warranted to validate our findings and elucidate the long-term predictive value of eMLC density for treatment response and disease recurrence. Moreover, studies comparing the longitudinal changes of eMLC density between different anti-VEGF agents or between anti-VEGF and dexamethasone implants are warranted to further validate its utility as a biomarker for treatment selection. Additionally, although intra-observer reproducibility was good, all eMLC quantifications were performed by a single observer, and inter-observer reliability was not formally assessed. This may limit the generalizability of the measurement.
-
In conclusion, this study demonstrates that a single anti-VEGF injection induces significant reductions in macular eMLC density in patients with BRVO, accompanied by marked improvement in macular thickness and BCVA. Higher baseline global macular eMLC density was associated with less anatomical improvement, and higher baseline eMLC density in the non-perfused area was associated with greater residual macular edema and worse BCVA after treatment. These findings suggest that eMLC density may serve as a potential imaging biomarker for predicting treatment response in BRVO-related macular edema.
-
The Institutional Review Board of the Zhongshan Ophthalmic Center approved this retrospective study (No. 2022KYPJ096) on 19 November 2024 and waived the requirement for informed consent due to its retrospective nature and the use of anonymized data. During the preparation of this manuscript, the authors used DeepSeek-V3.2 (DeepSeek AI, China) for language editing and grammar correction. The AI-generated content was reviewed and revised by the authors, who take full responsibility for the final version of the manuscript.
-
The authors contributed to this study as follows: study conception and design: Zeng Y, Wen F, Zeng M; data collection: Zeng Y, Chen X, Yin X; analysis and interpretation of results: Zeng Y, Qiu Y, Liang X, Chen W, Long F; draft manuscript preparation: Zeng Y, Zhang X, Zeng M. All authors reviewed the results and approved the final version of the manuscript.
-
The datasets generated and analyzed in this study are available from the corresponding author upon reasonable request.
-
The authors declare no conflicts of interest.
- Copyright: © 2026 by the author(s). Published by Maximum Academic Press, Fayetteville, GA. This article is an open access article distributed under Creative Commons Attribution License (CC BY 4.0), visit https://creativecommons.org/licenses/by/4.0/.
-
About this article
Cite this article
Zeng Y, Wen F, Yin X, Qiu Y, Liang X, et al. 2026. Changes in epiretinal macrophage-like cells correlate with treatment outcomes following anti-VEGF therapy in branch retinal vein occlusion. Visual Neuroscience 43: e042 doi: 10.48130/vns-0026-0037 

Changes in epiretinal macrophage-like cells correlate with treatment outcomes following anti-VEGF therapy in branch retinal vein occlusion
- Received: 03 April 2026
- Revised: 02 June 2026
- Accepted: 15 July 2026
- Published online: 09 September 2026
Abstract: This retrospective longitudinal study investigated the changes in epiretinal macrophage-like cells (eMLC) density following anti-vascular endothelial growth factor (VEGF) therapy for macular edema secondary to branch retinal vein occlusion (BRVO). Twelve patients who declined any treatment served as the control group, while 24 patients who received anti-VEGF therapy served as the treatment group. All participants underwent ophthalmic examinations at baseline and follow-up. Optical coherence tomography angiography (OCTA) with a 6 mm × 6 mm protocol was used to obtain macular structural parameters. eMLCs on the inner limiting membrane were visualized on en face OCT and quantified using a semi-automated binarization method in ImageJ. In the anti-VEGF group, average macular thickness and eMLC density decreased significantly across all regions after treatment (all p < 0.01). Best-corrected visual acuity (BCVA) improved in the anti-VEGF group (p < 0.001) but remained stable in controls (p = 0.069). In the control group, average macular thickness (p = 0.003), global eMLC density (p = 0.023), and eMLC density in the unaffected (p = 0.028) and perfused areas (p = 0.003) increased significantly. Spearman analysis revealed that baseline global eMLC density was negatively correlated with the reduction in macular thickness in the anti-VEGF group (r = −0.438, p = 0.032). Multivariate analysis showed that baseline eMLC density in the non-perfused area was positively correlated with average macular thickness and BCVA (logMAR) at follow-up (standardized β = 0.547, p = 0.006 and standardized β = 0.586, p = 0.003, respectively). Higher baseline macular eMLC density was associated with smaller reductions in macular thickness and BCVA after anti-VEGF therapy. Baseline eMLC density, especially in non-perfused areas, may serve as an imaging biomarker for treatment outcomes in BRVO.
-
Key words:
- Macrophage-like cells /
- Branch retinal vein occlusion /
- Macular edema /
- Anti-VEGF therapy