-
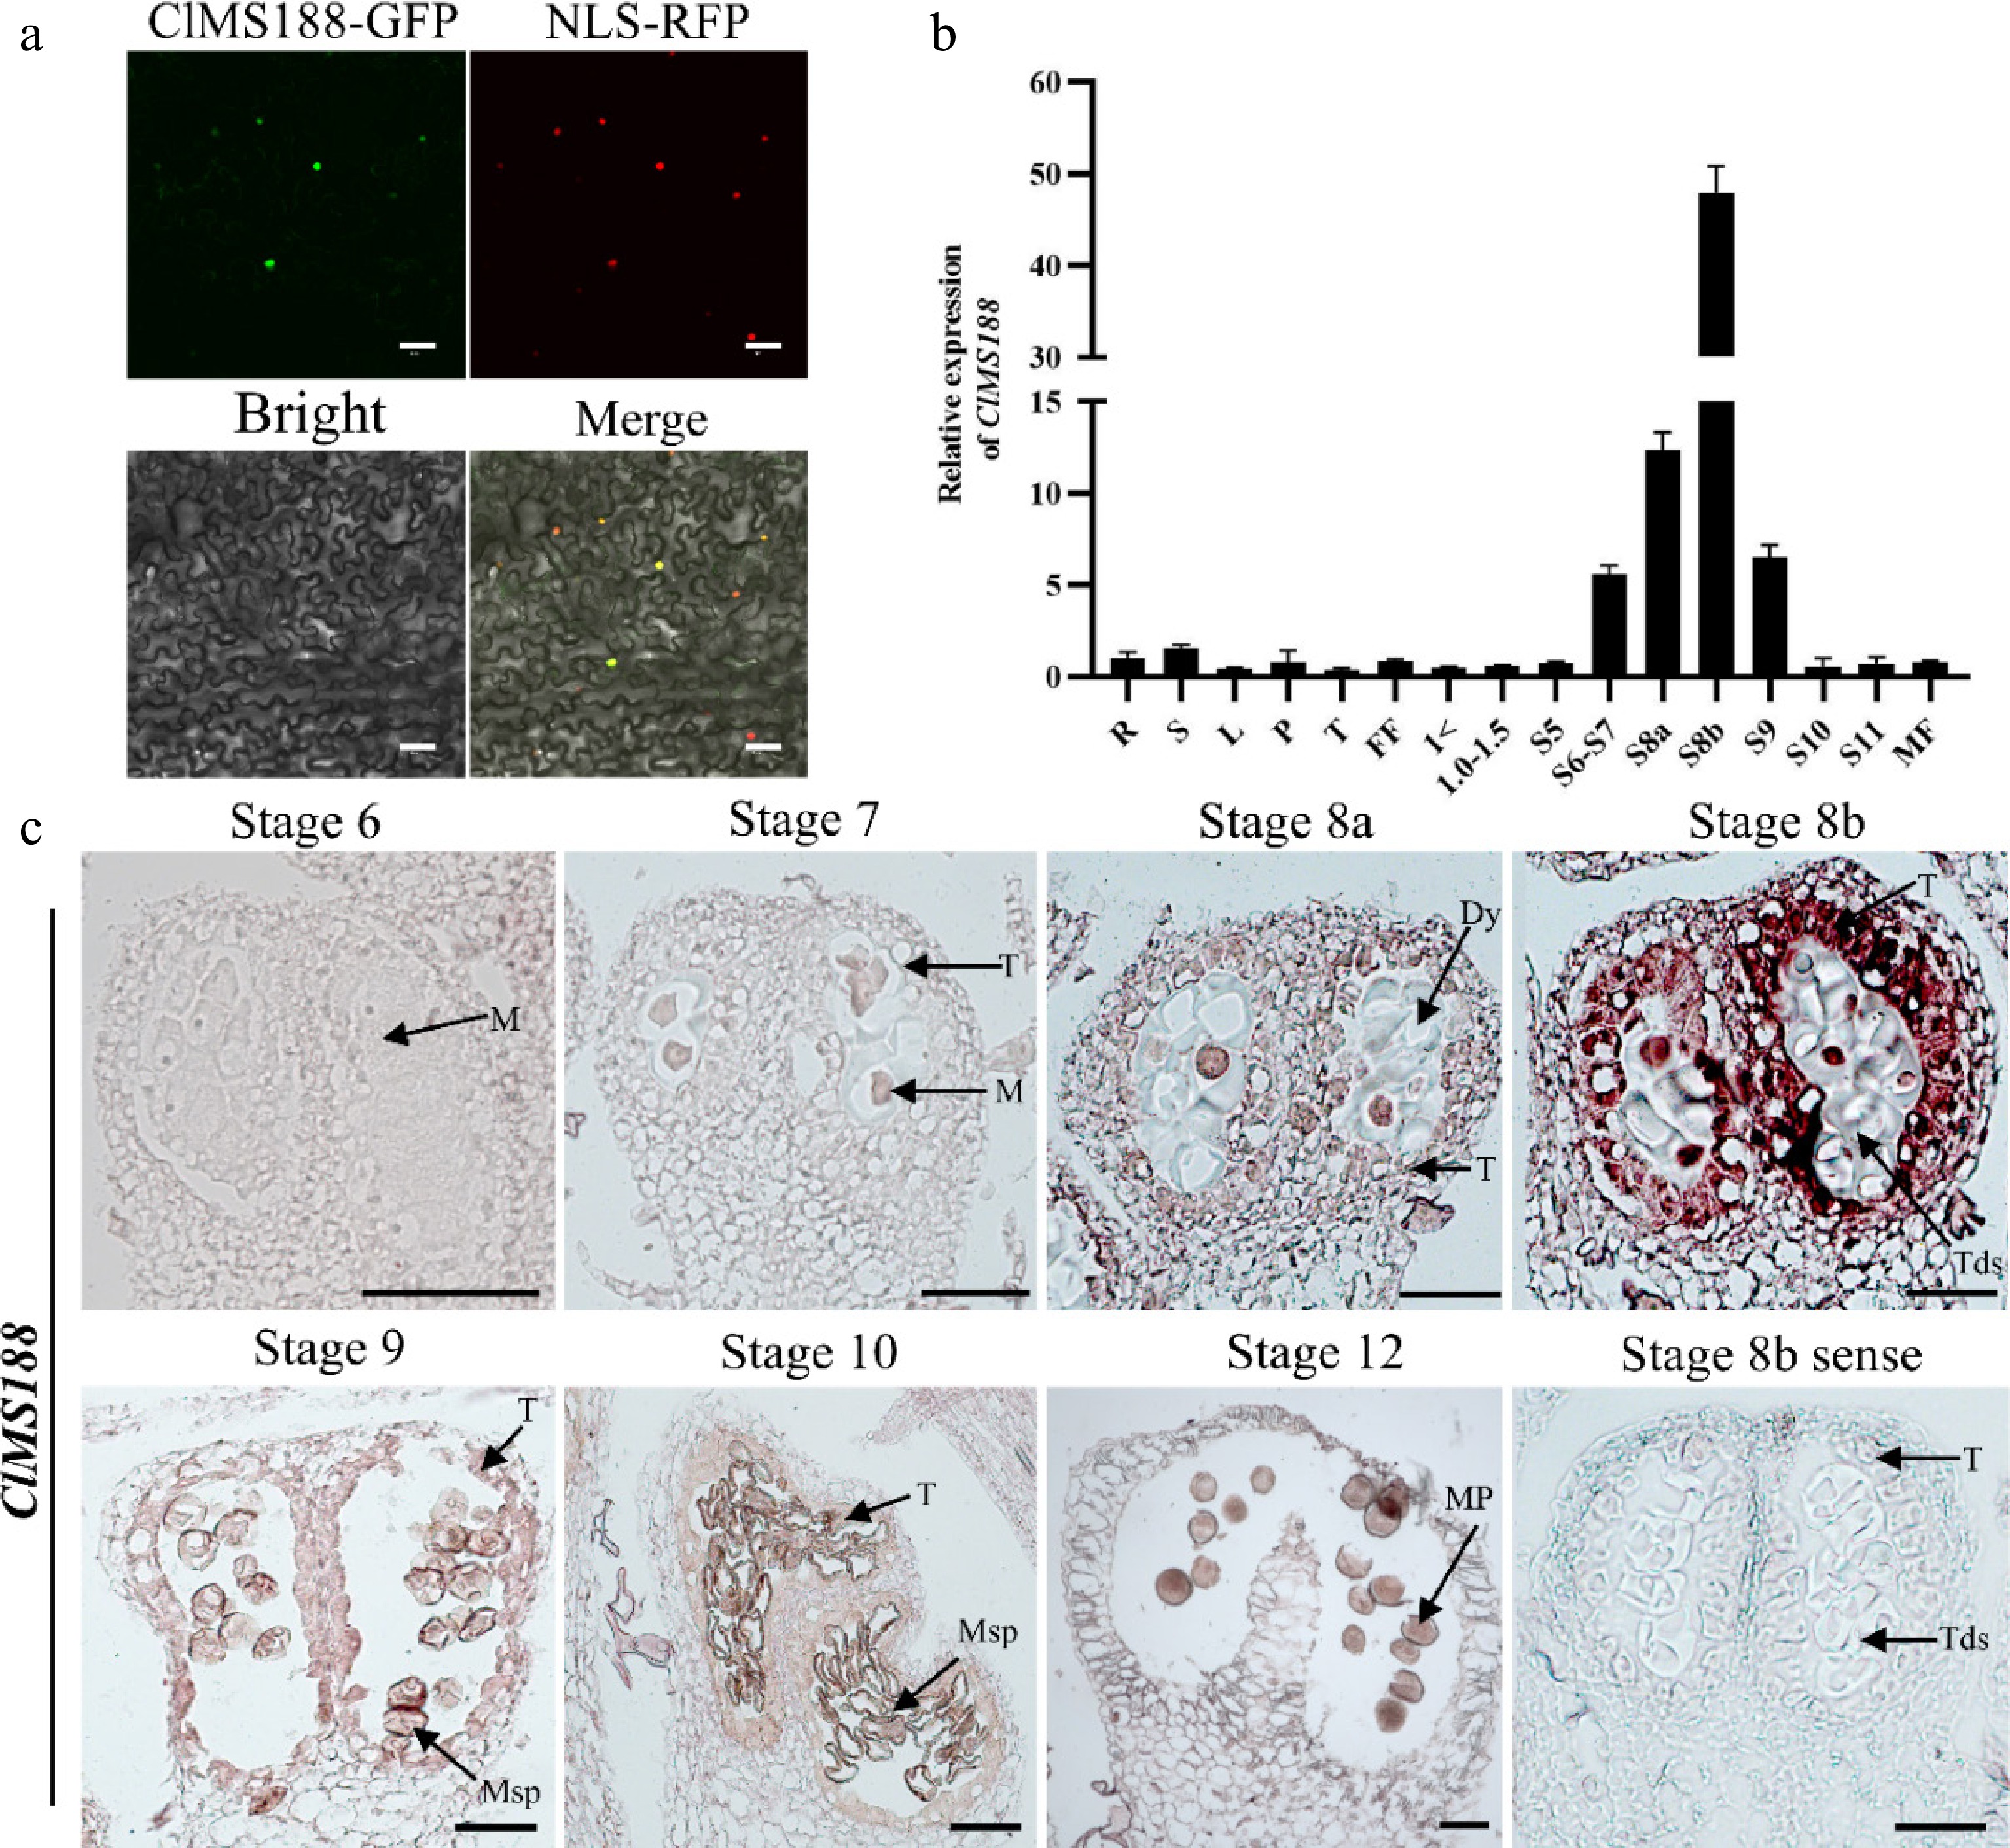
Figure 1.
Subcellular localization and expression analysis of the ClMS188 gene. (a) Subcellular localization of ClMS188. The constructs p35S::ClMS188-GFP and p35S::NLS-RFP were transformed into N. benthamiana leaves and then observed by confocal microscopy. Scale bars, 50 μm. (b) Transcript levels of ClMS188 in the roots (R), stems (S), leaves (L), petioles (P), tendrils (T), female flowers (FF), male floral buds of different diameters, and open male flowers (MF) of WT plants. '> 1' indicates male floral buds with a diameter > 1 mm; 'S5' indicates male floral buds at stage 5 of anther development. Relative expression was normalized to the expression level in WT roots. Data are means ± SDs (n = 3). (c) RNA in situ hybridization of ClMS188 transcript in WT anthers during stages 6–12 is shown. Stage 8b anthers hybridized with the sense probe served as the negative control. Dy, dyad cell; M, microsporocyte; Mp, mature pollen; Msp, microspore; T, tapetum; Tds, tetrads. Scale bars, 20 μm.
-
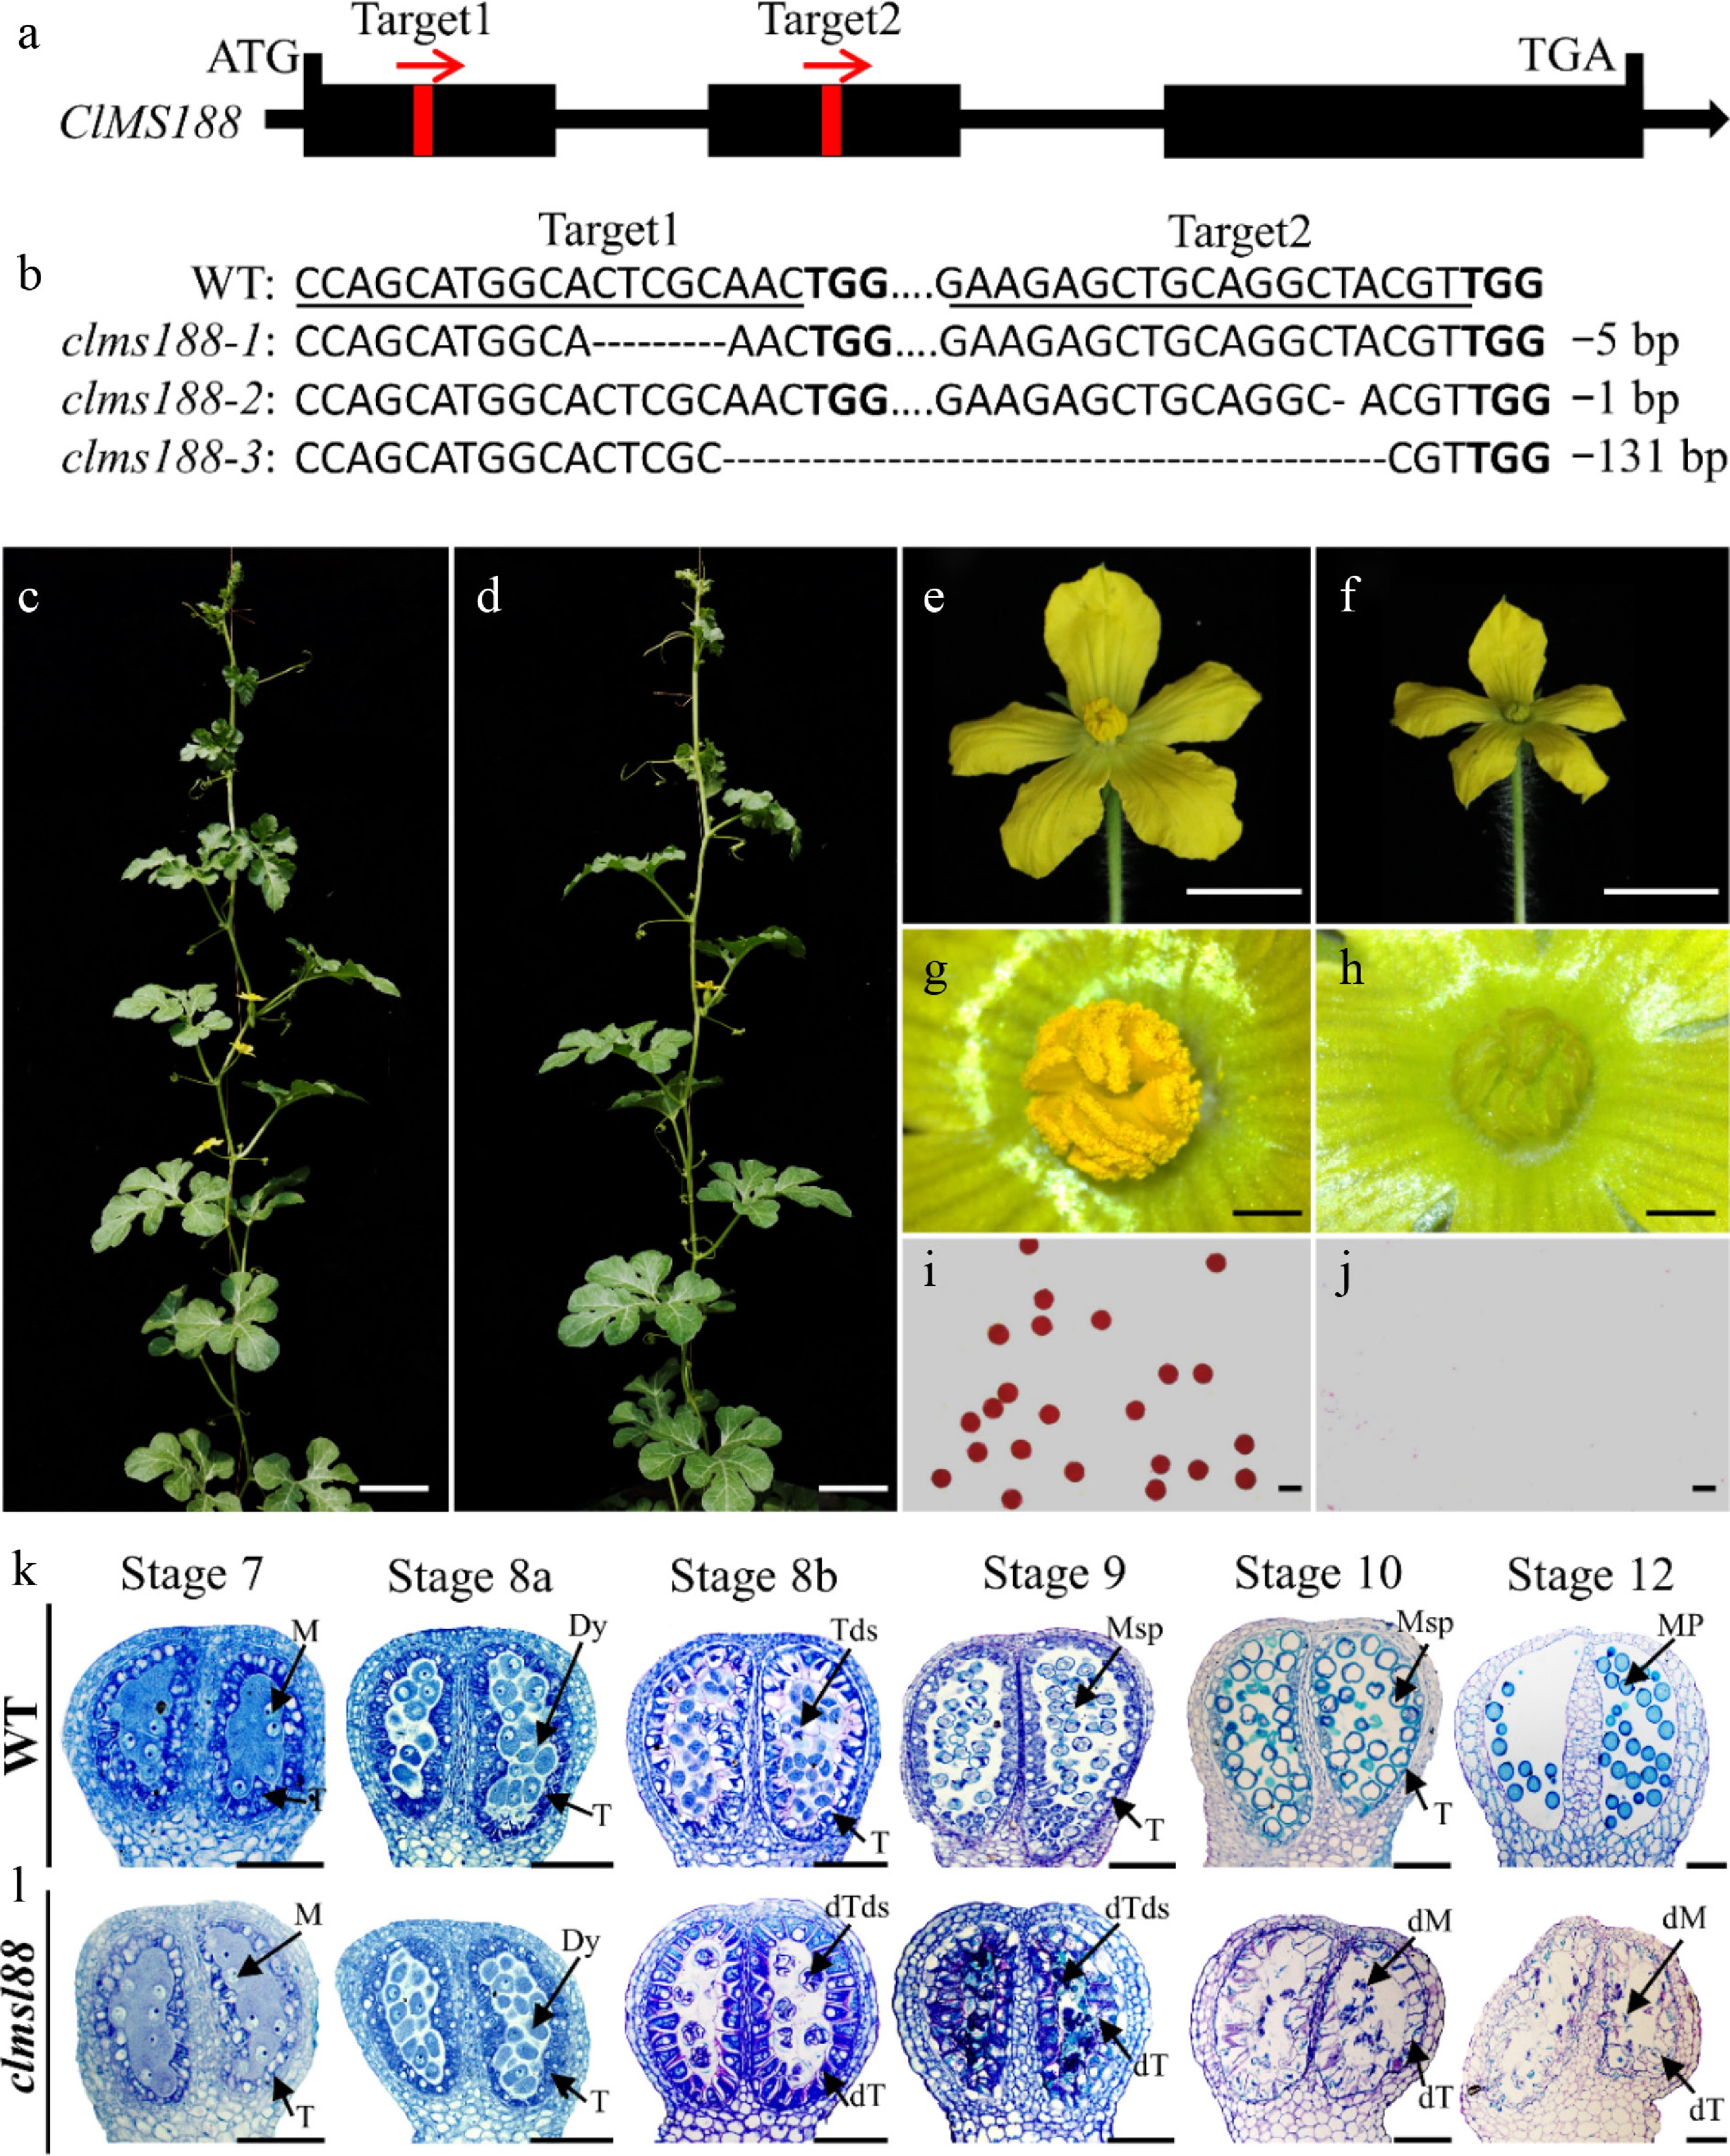
Figure 2.
Knockout of ClMS188 to obtain completely male-sterile mutants. (a) Gene structure and target site positions of ClMS188. Black boxes represent exons; red boxes represent target site locations; red arrows represent target site orientation. (b) Mutation profiles of ClMS188 in three mutant lines identified by sequencing. PAM motifs are in bold; target sites are underlined; '-' indicates deletions. Phenotypes of the (c) WT and (d) clms188. Scale bars, 10 cm. Male flower morphology of (e) WT and (f) clms188. Scale bars, 1 cm. Anther morphology of (g) WT and (h) clms188. Scale bars, 200 μm. Alexander staining of pollen from (i) WT and (j) clms188. Scale bars, 60 μm. Semi-thin sections of (k) WT and (l) clms188 mutant anthers during stages 6–14 are shown. dM, defective microsporocyte; dT, defective tapetum; dTds, defective tetrads. Dy, dyad cell; M, microsporocyte; Mp, mature pollen; Msp, microspore; T, tapetum; Tds, tetrads. Scale bars, 20 μm.
-
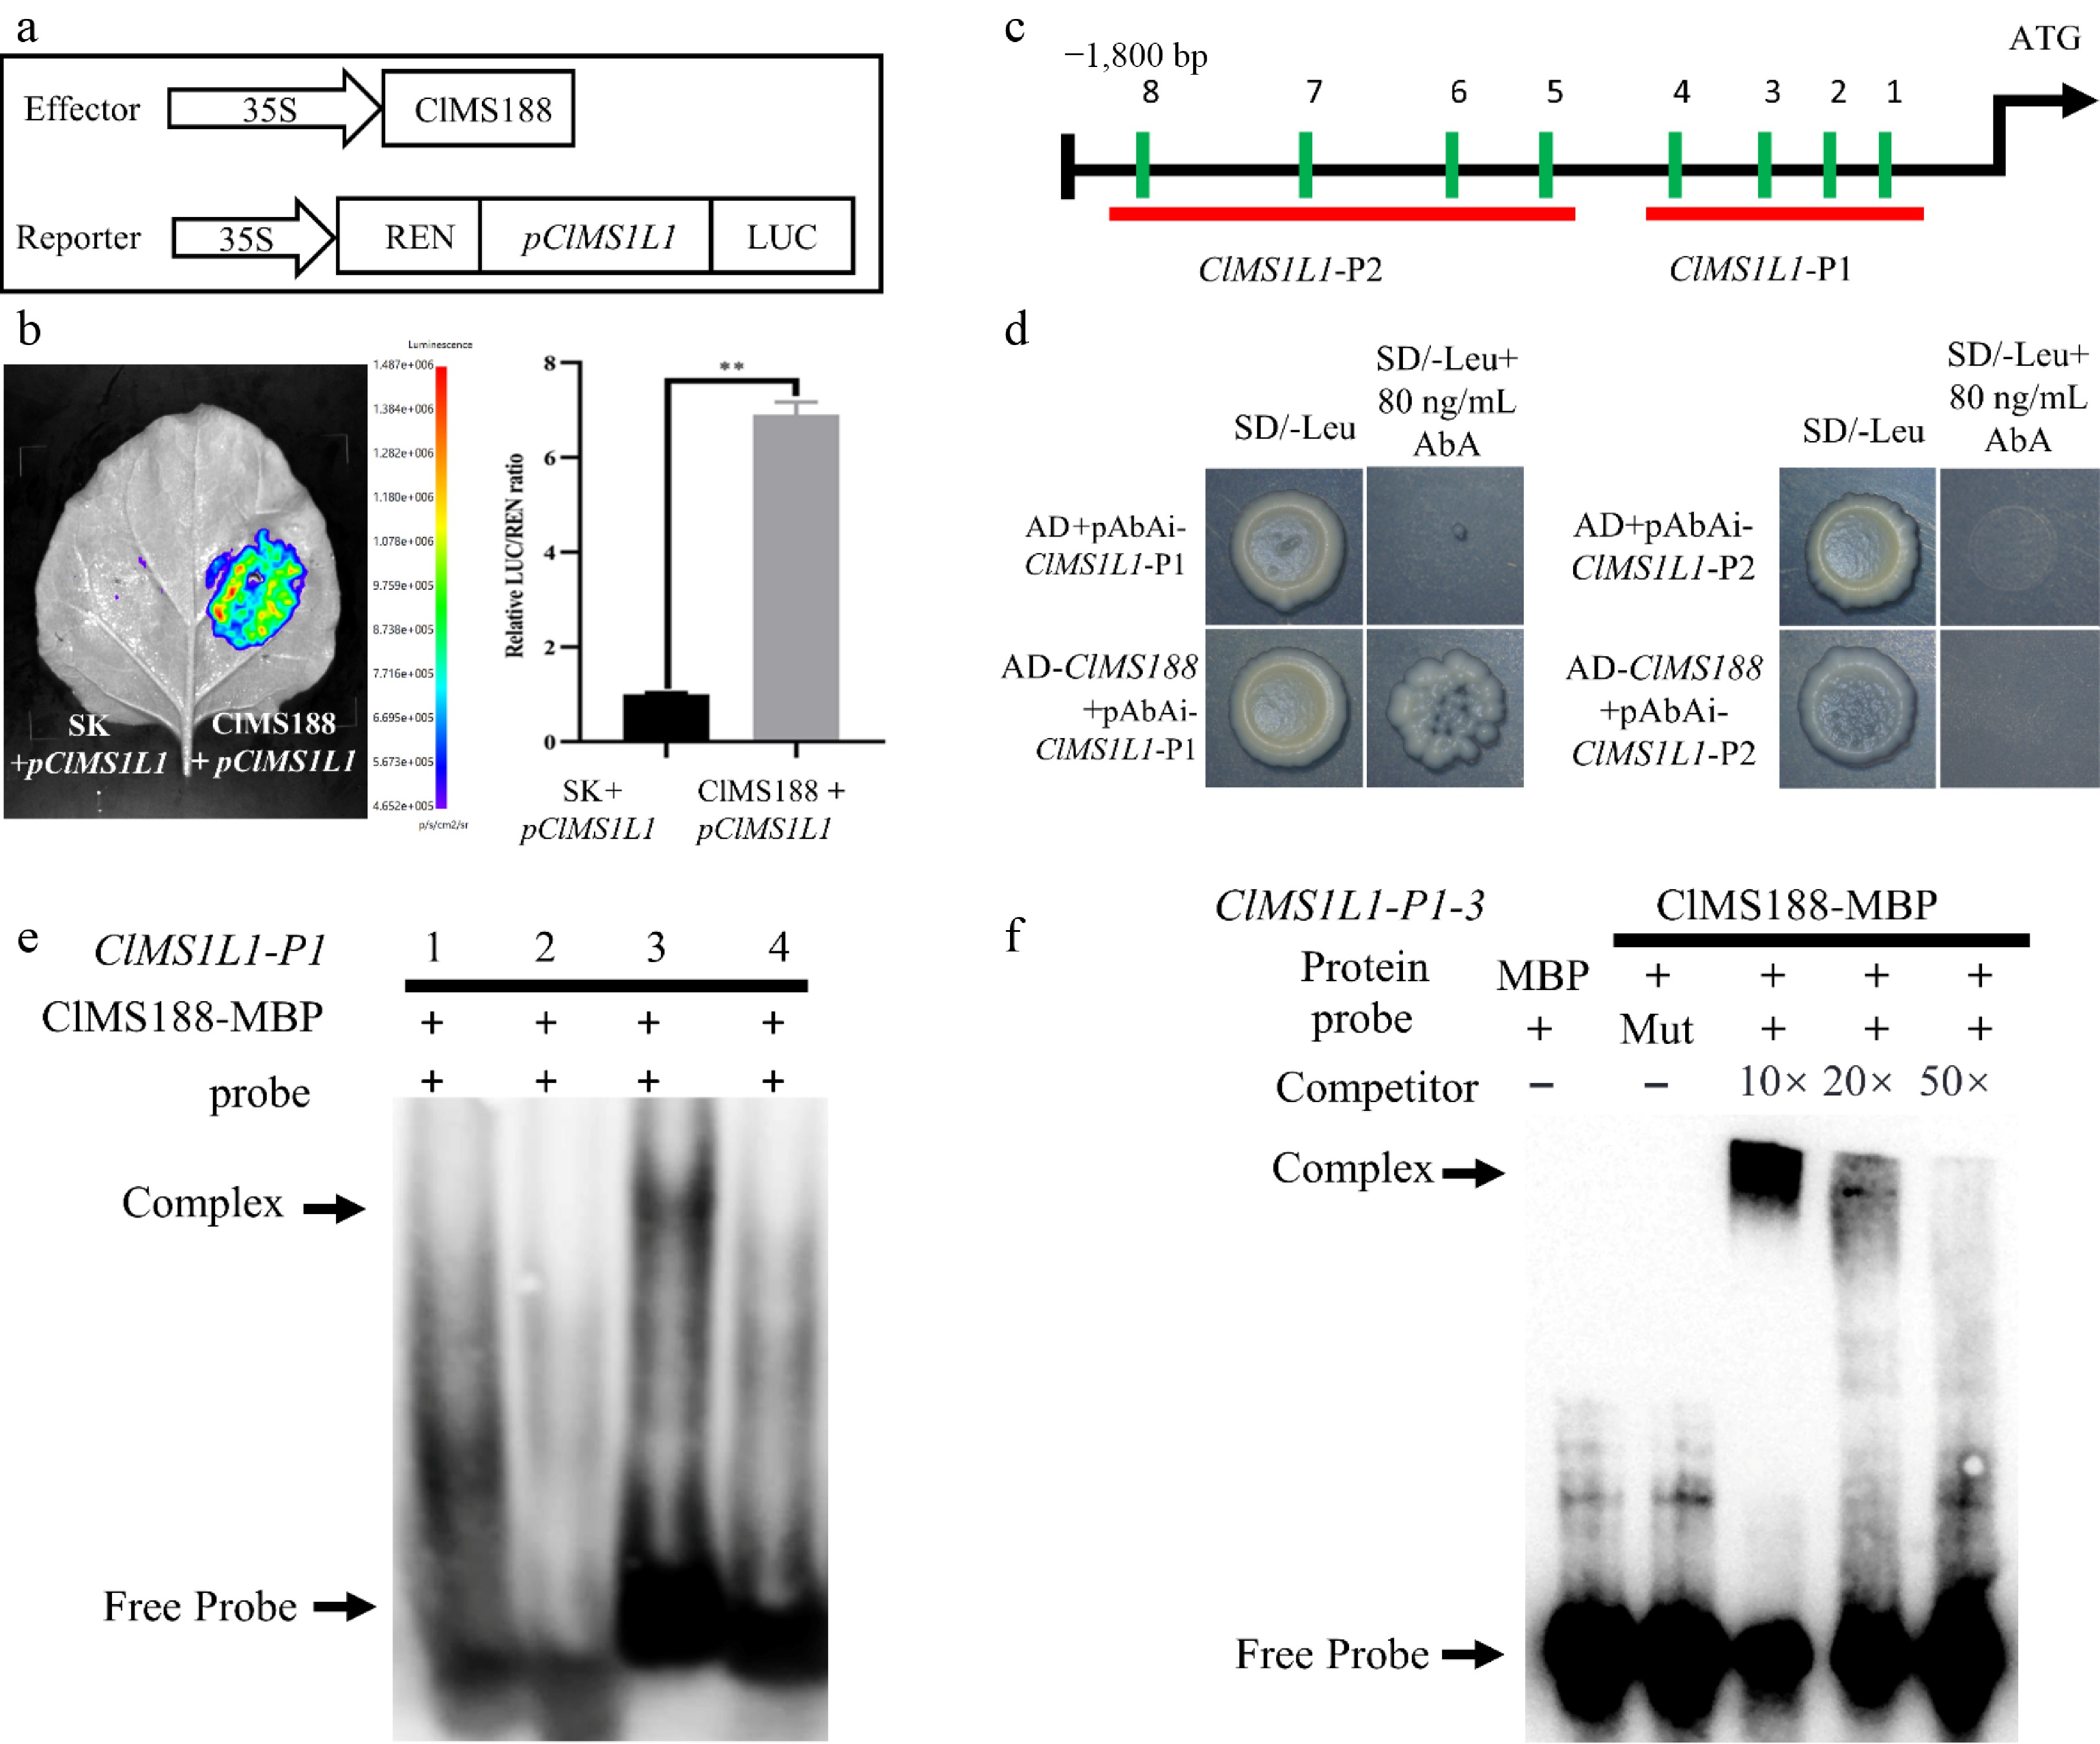
Figure 3.
ClMS188 binds to the promoter of ClMS1L1 and activates its expression. (a) Schematic diagram of effector and reporter constructs for dual-luciferase assay. (b) Dual-luciferase assay to evaluate ClMS188-mediated transactivation of ClMS1L1. The data represent the mean ± SD of five independent experiments. ** Indicates significant differences at p < 0.01. (c) AACC elements in the upstream promoter region of ClMS1L1. (d) Yeast one-hybrid assay of ClMS188 binding to the ClMS1L1 promoter. Yeast cotransformed with the empty vector pGADT7 (AD) and the ClMS1L1 promoter was used as a negative control. Yeast cotransformed with pAbAi-ClMS1L1-P1 and pAbAi-ClMS1L1-P2, along with AD-ClMS188 transformants, grew well on selective medium (SD/-Leu) supplemented with 80 ng/mL AbA. (e), (f) Identification of ClMS188 binding specificity to sites on the ClMS1L1 promoter by electrophoretic mobility shift assays. (e) Binding verification of ClMS188 to four sets of probes, Probe-1ClMS1L1(AAACCC), Probe-2ClMS1L1(TAAACC), Probe-3ClMS1L1(TAACCA), and Probe-4ClMS1L1(AAACCT) on ClMS1L1-P1. (f) ClMS188 binding specificity to sites on the ClMS1L1-P1 promoter of Probe-3ClMS1L1(TAACCA). '−' indicates absence; '+' indicates presence. The arrow indicates the position of the protein-DNA complex after incubation of a biotin-labelled DNA probe with MBP-MS188.
-
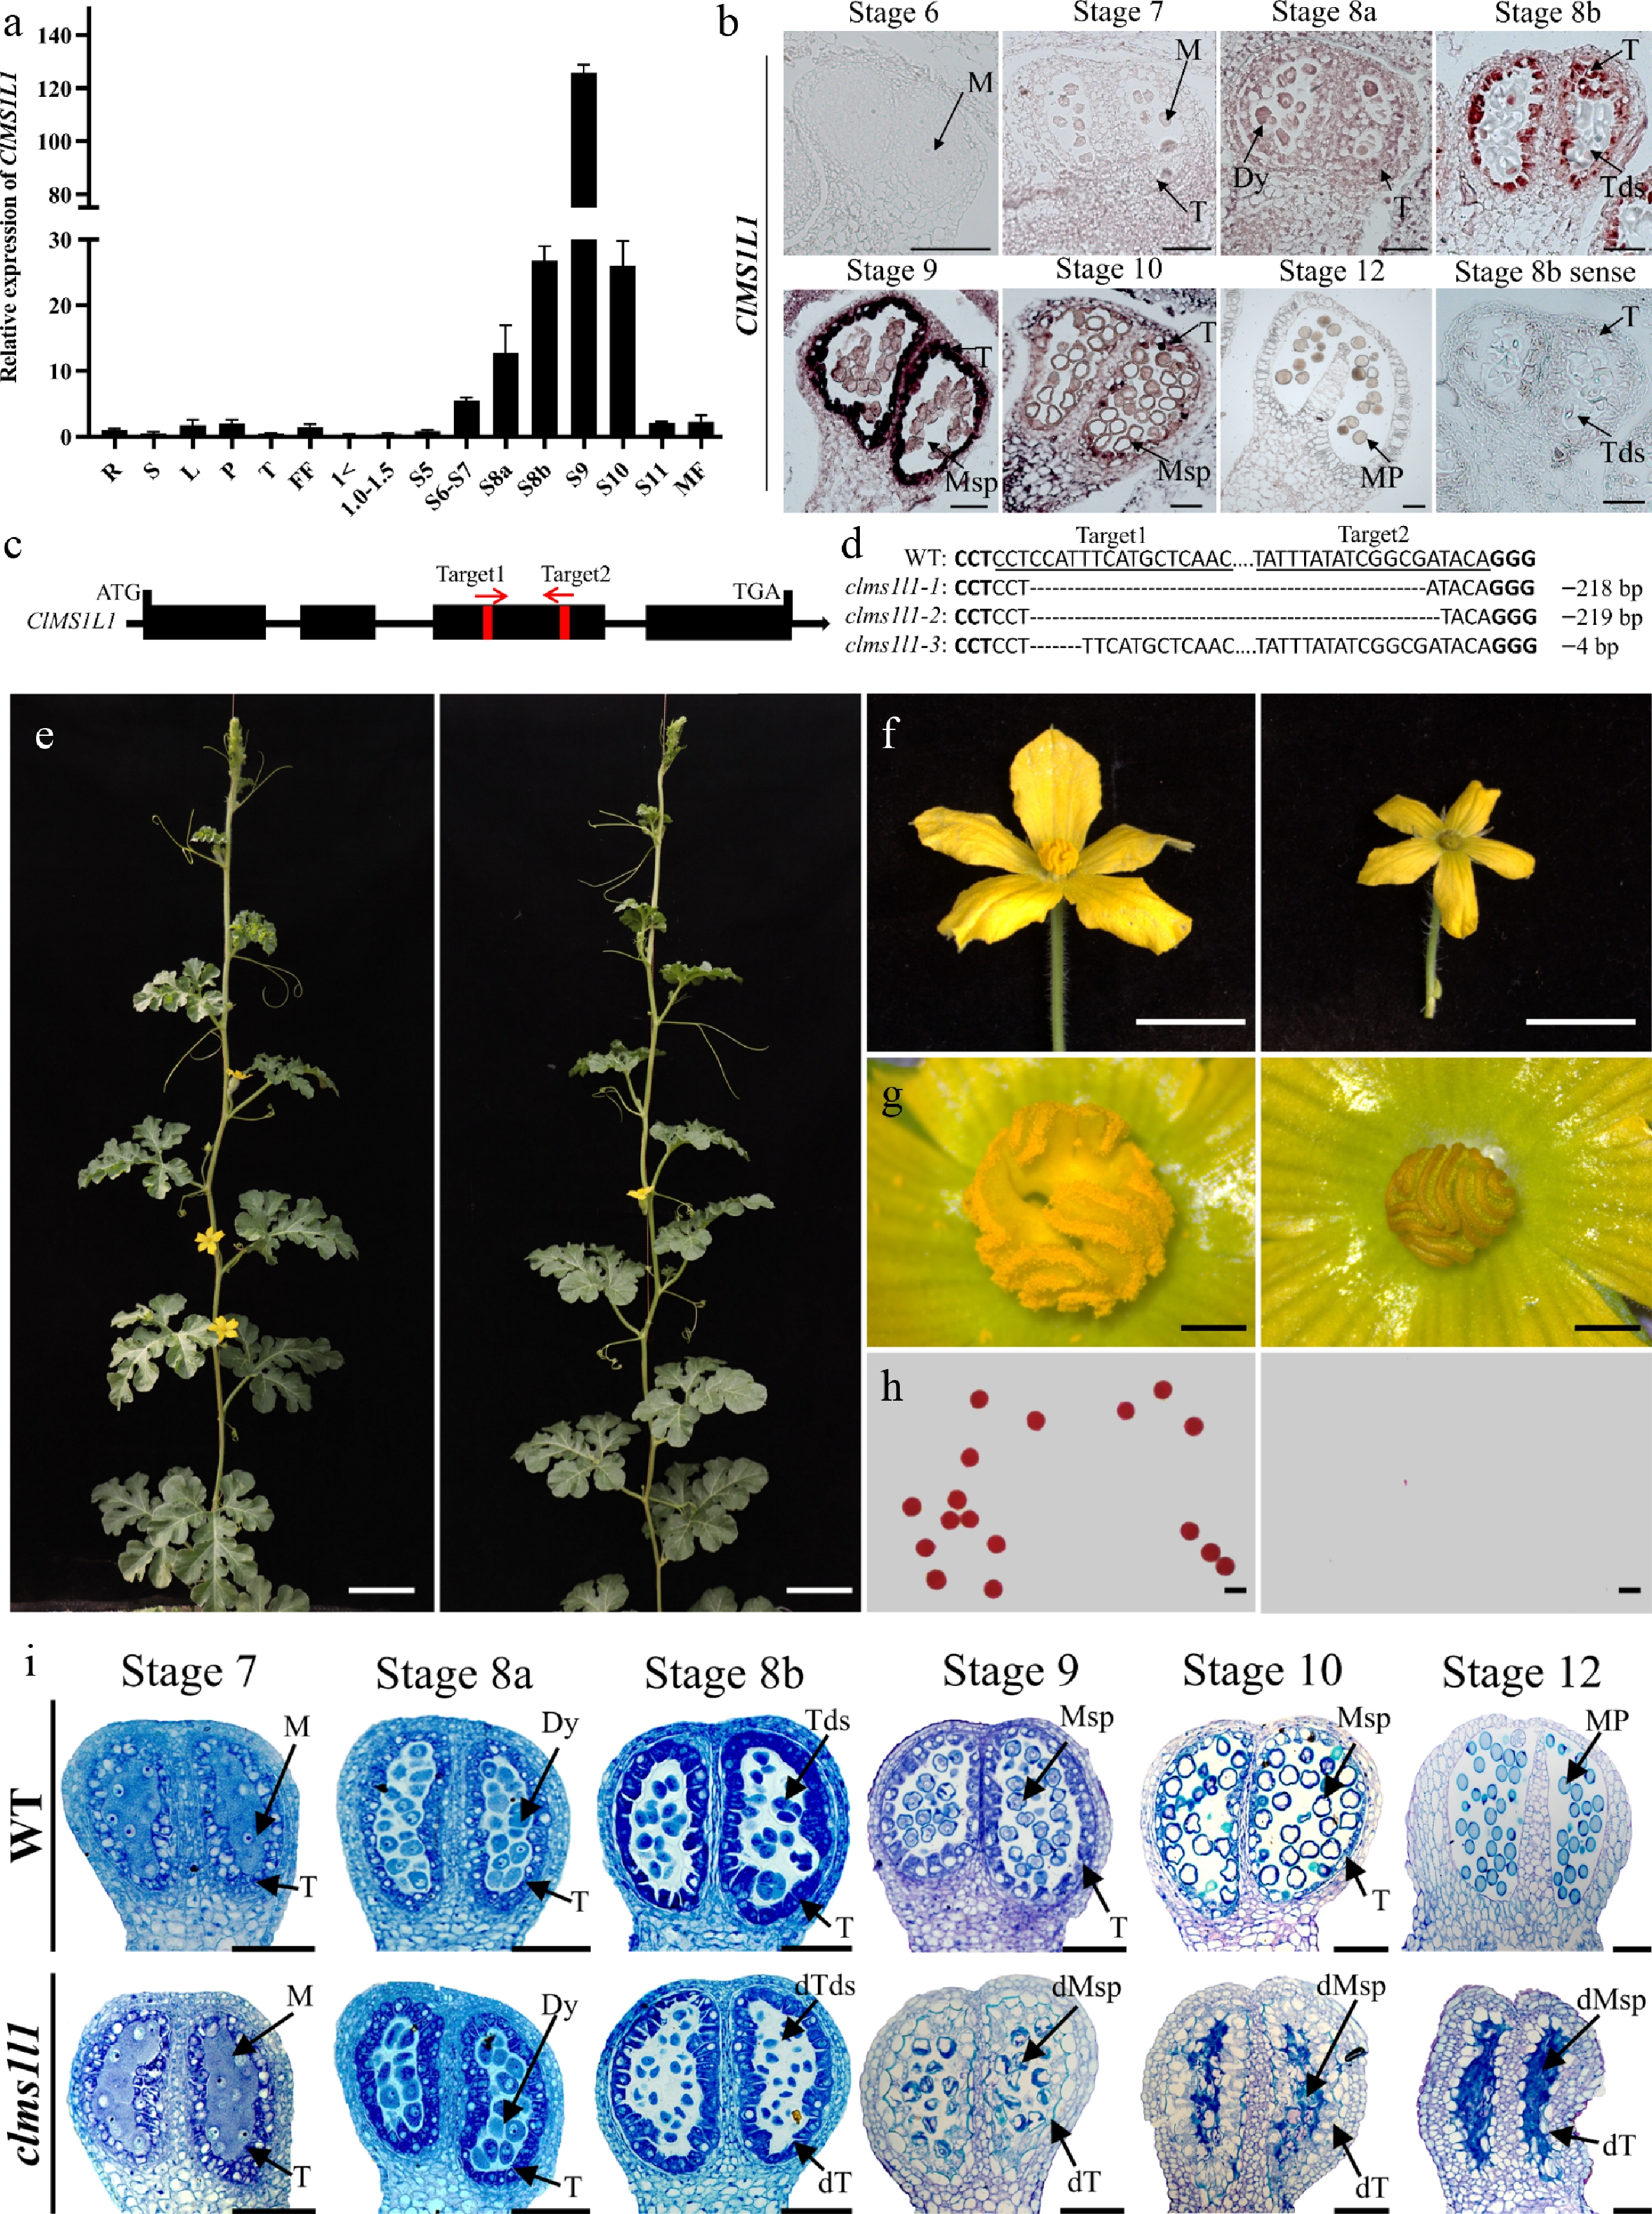
Figure 4.
Expression and function of the ClMS1L1. (a) Transcript levels of ClMS1L1 in the roots (R), stems (S), leaves (L), petioles (P), tendrils (T), female flowers (FF), male floral buds of different diameters, and open male flowers (MF) of WT plants. (b) RNA in situ hybridization of ClMS1L1 transcript in WT anthers during stages 6–12. (c) Gene structure and target site positions of ClMS1L1. (d) Mutation profiles of ClMS1L1 in three mutant lines identified by sequencing. (e) Phenotypes of the WT and ClMS1L1. Scale bars, 10 cm. (f) Male flower morphology of WT and clms1l1. Scale bars, 1 cm. (g) Anther morphology of the WT and clms1l1. Scale bars, 200 μm. (h) Alexander staining of pollen from WT and clms1l1. Scale bars, 60 μm. (i) Semi-thin sections of WT and clms1l1 anthers during stages 6–12. Scale bars, 20 μm.
-
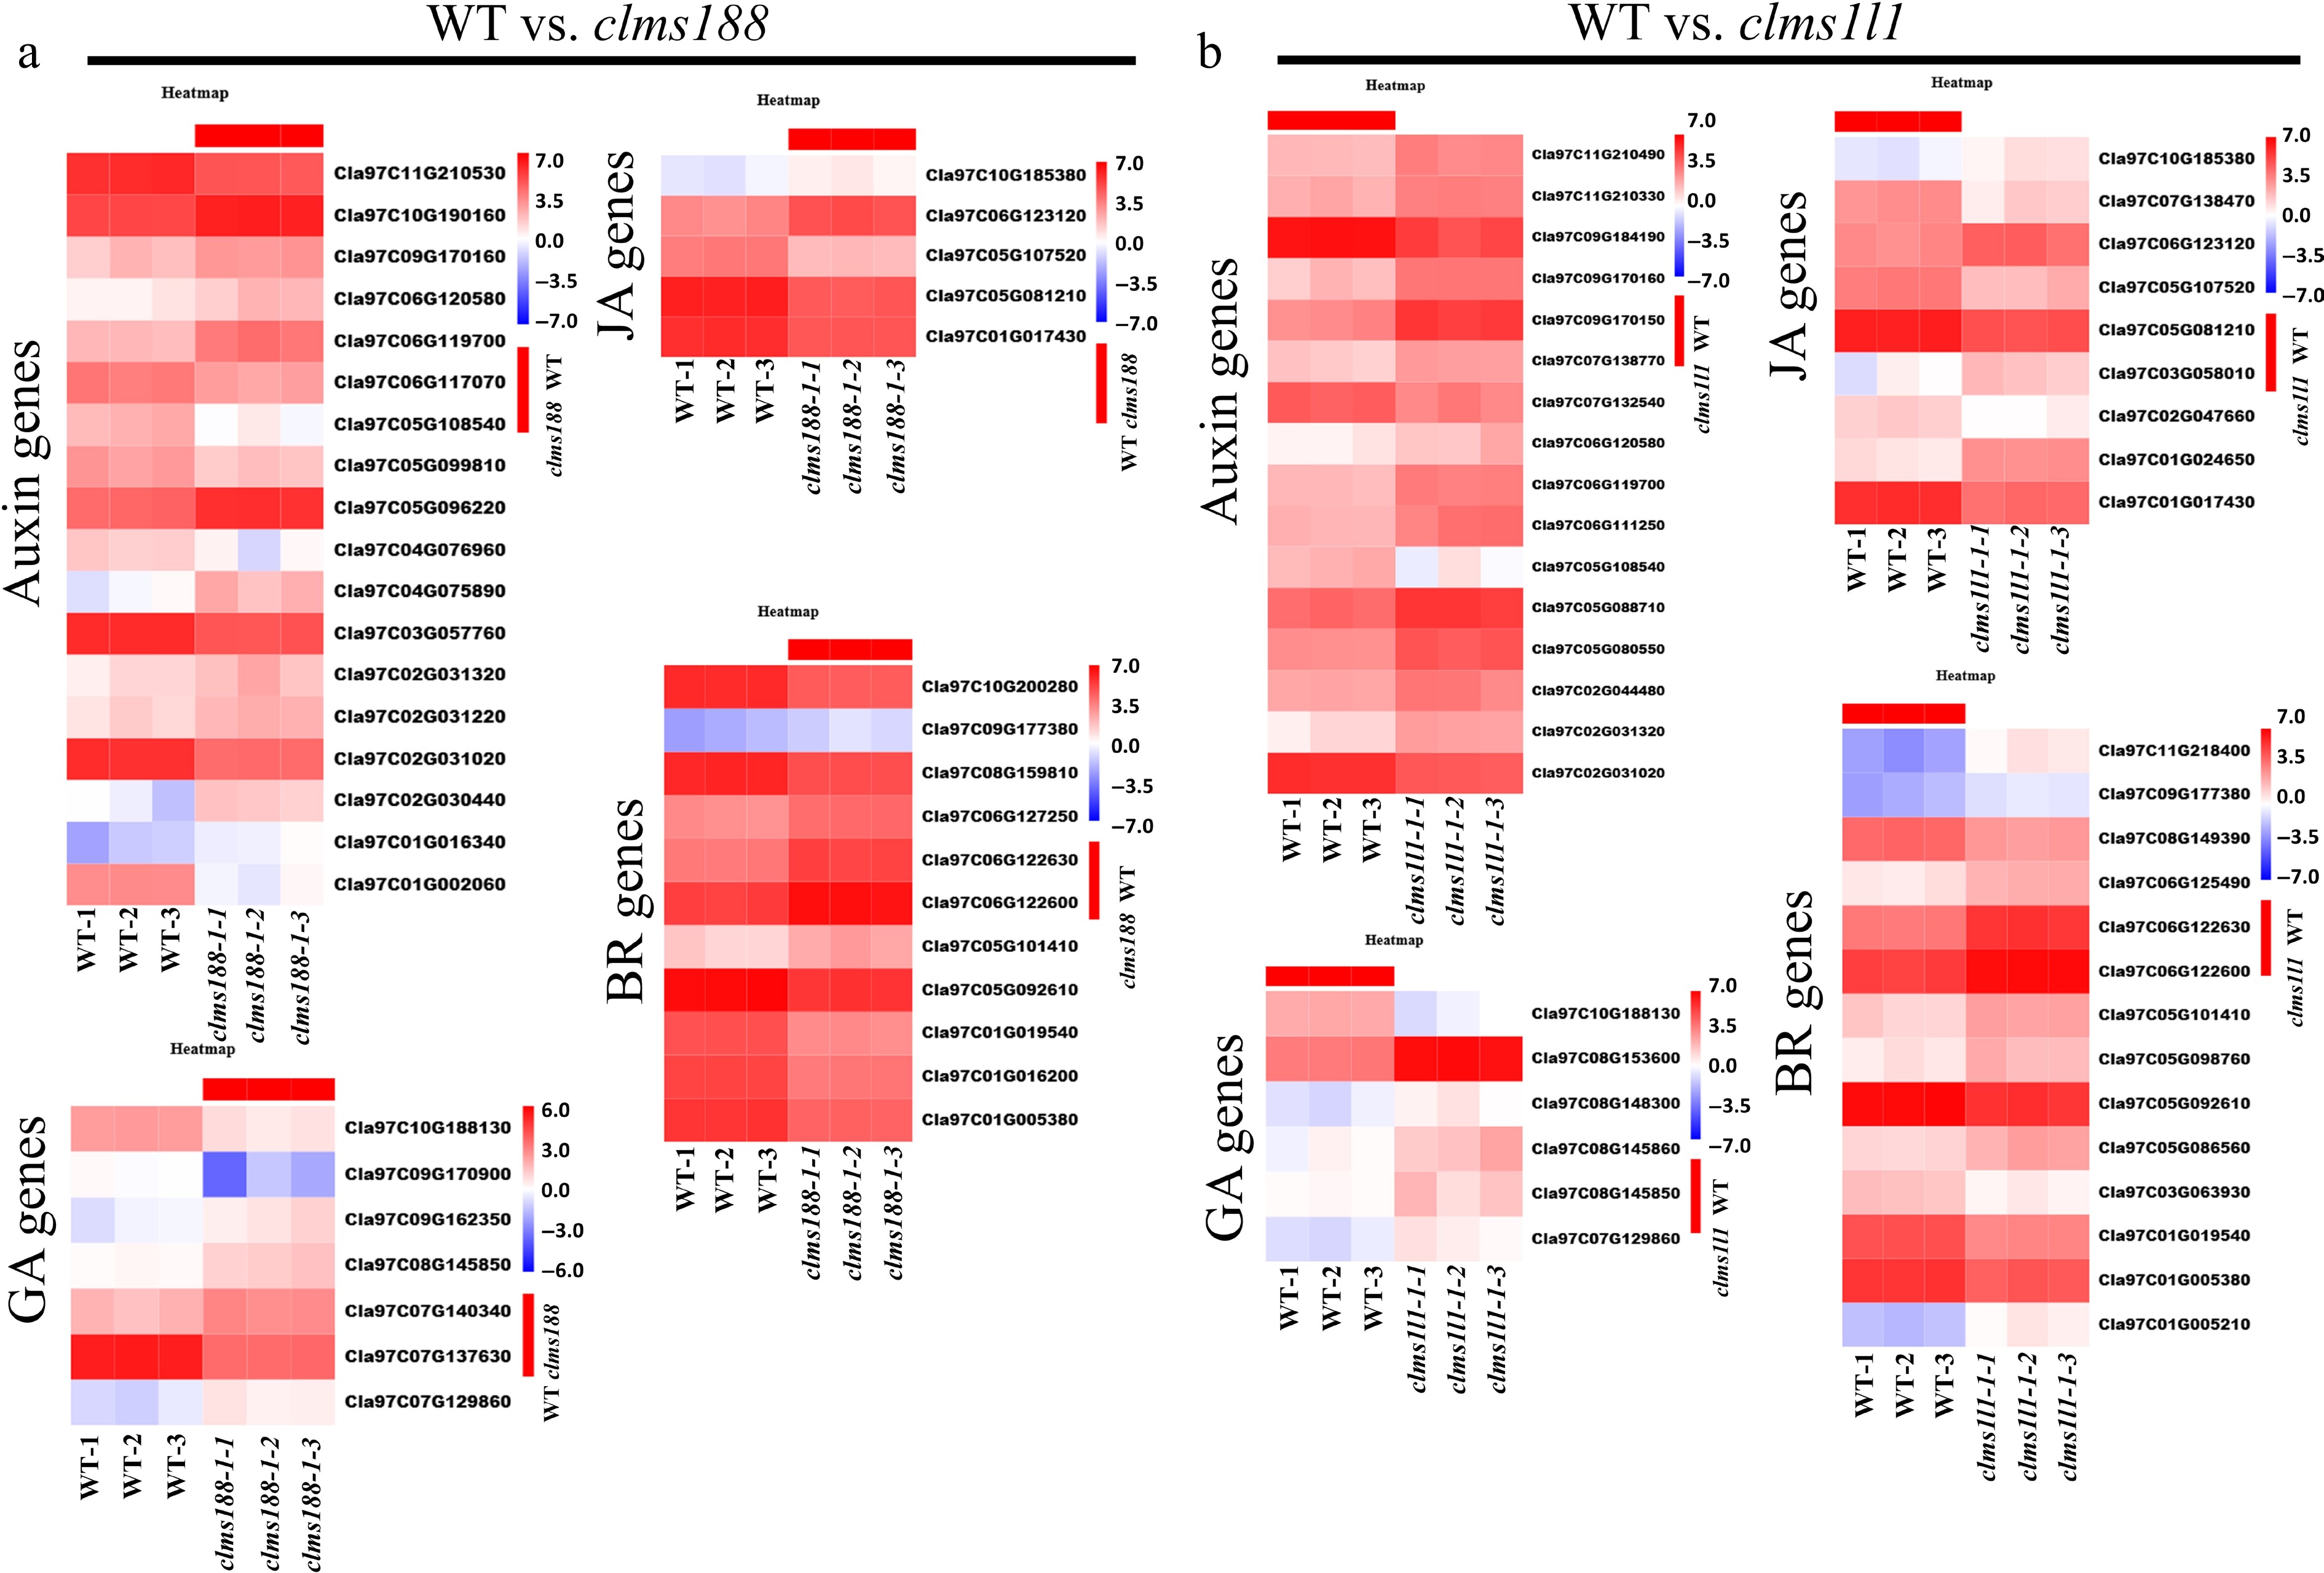
Figure 5.
KEGG enrichment of plant hormone signal transduction pathway in WT vs. clms188 and in WT vs. clms1l1. Heatmaps showing the expression of DEGs associated with auxin, gibberellin, jasmonic acid, and brassinosteroid pathways in (a) WT vs. clms188 and (b) WT vs. clms1l1. The color bar on the right represents expression levels, with red and blue indicating high and low expression, respectively.
-
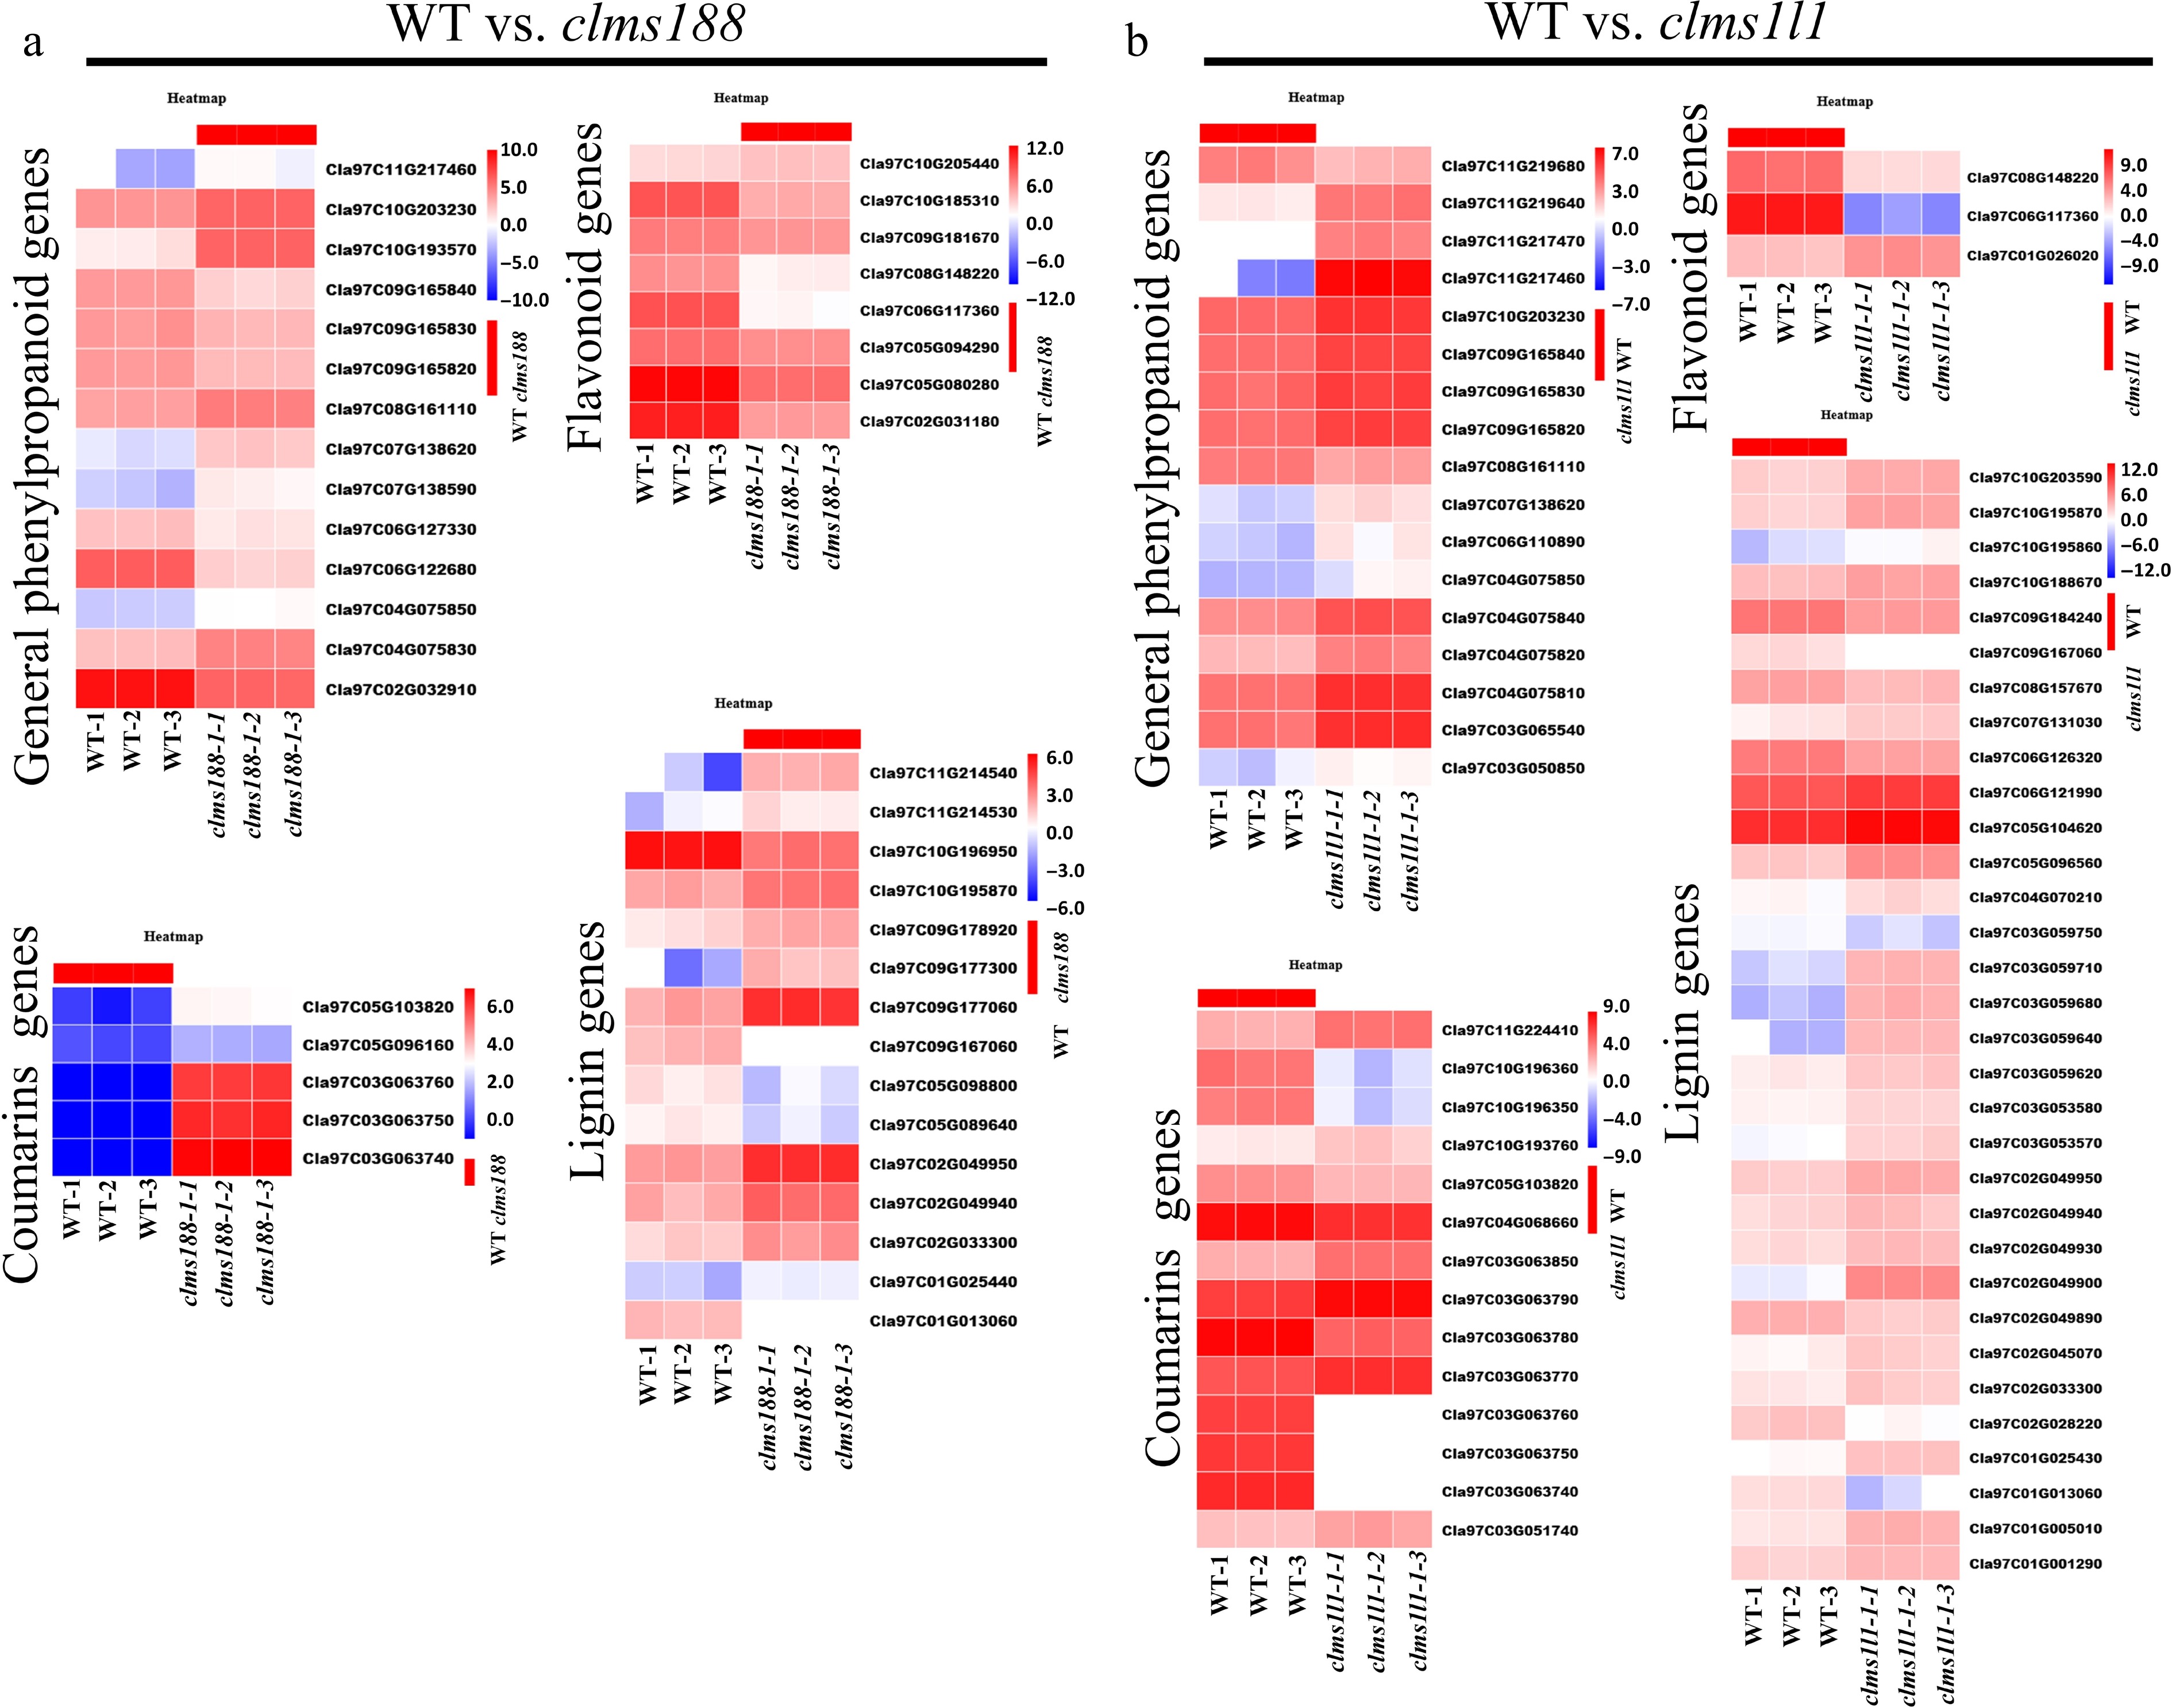
Figure 6.
KEGG enrichment of phenylpropanoid-related pathways in WT vs. clms188 and in WT vs. clms1l1. (a), (b) Heatmaps showing the expression of DEGs related to general phenylpropanoid biosynthesis, lignin, coumarin, and flavonoid metabolism in (a) WT vs. clms188 and (b) WT vs. clms1l1. The color bar on the right represents expression levels, with red and blue indicating high and low expression, respectively.
-
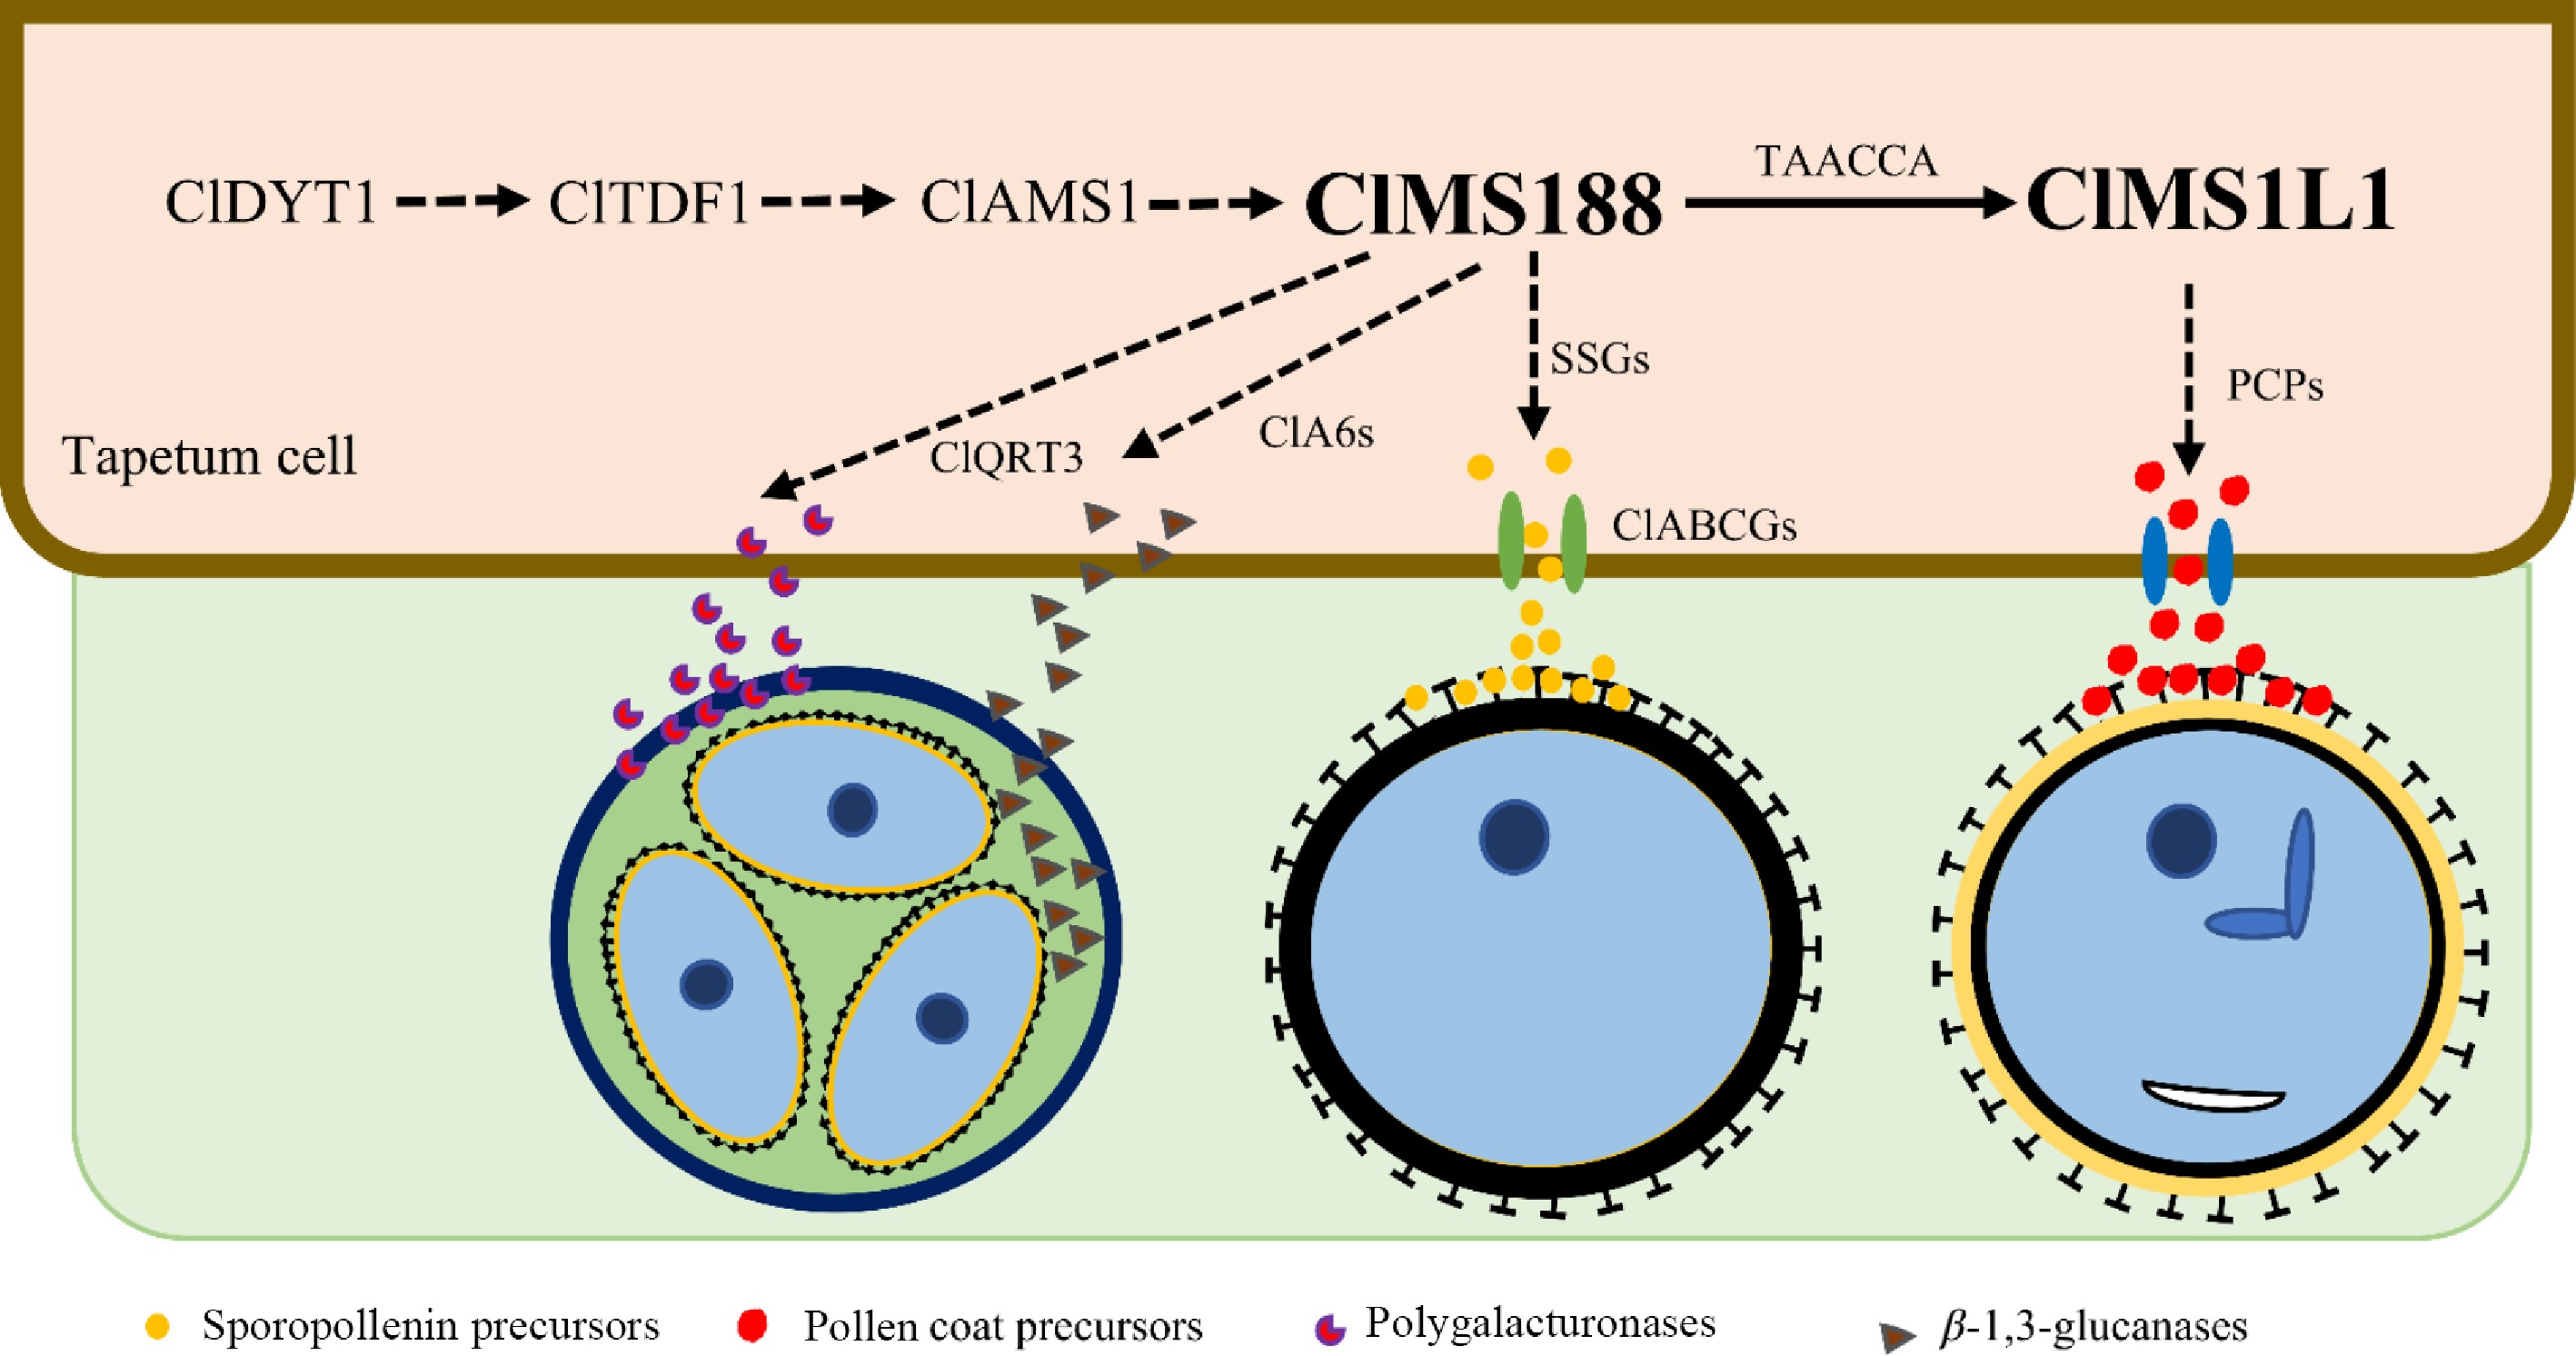
Figure 7.
A proposed model for the regulation of five transcription factors during anther development in watermelon. ClMS188 and ClMS1L1 are downstream components in the ClDYT1-ClTDF1-ClAMS-ClMS188-ClMS1L1 genetic pathway. ClMS188 directly activates ClMS1L1 expression; ClMS188 may control the expression of ClQRT3, ClA6s, and sporopollenin biosynthesis and transport genes. ClMS1L1 may control pollen coat protein formation. The solid arrow represents a validated regulatory mechanism, and the dashed arrows represent predicted regulatory mechanisms. SSGs: sporopollenin biosynthesis genes; PCPs: pollen coat precursors.
-
Gene name Gene ID Log2FC Function of homologs protein function Fertility of homologs gene male sterility (MS) WT vs. clms188 ClDYT1 Cla97C05G107520 −1.69 Early tapetum development Complete MS ClTDF1 Cla97C06G126110 −2.08 Early tapetum development Complete MS ClAMS1 Cla97C02G030840 2.016 Early tapetum development Complete MS ClMS1L1 Cla97C11G207480 −5.98 Tapetum PCD, exine and pollen coat formation Complete MS ClMS2 Cla97C04G069450 −6.31 Sporopollenin synthesis Complete MS ClCYP704B1 Cla97C11G214660 2.29 Sporopollenin synthesis Complete MS ClPKSA Cla97C05G080280 −5.73 Sporopollenin synthesis Partial MS ClTKPR1 Cla97C02G036530 −4.77 Sporopollenin synthesis Partial MS ClDPW2 Cla97C06G119670 −1.69 Sporopollenin synthesis Complete MS ClLAP3 Cla97C05G088990 −12.39 Sporopollenin synthesis Complete MS ClACLB1 Cla97C08G152670 −1.13 Sporopollenin synthesis Thermo-sensitive MS ClABCG1 Cla97C09G181690 −4.85 Sporopollenin transportation Redundant MS ClABCG9 Cla97C10G190610 −4.65 Sporopollenin transportation Complete MS ClABCG26 Cla97C10G188910 −5.69 Sporopollenin transportation Complete MS ClC6 Cla97C05G094260 −2.57 Lipid transportation Partial MS ClMS44 Cla97C05G089860 1.05 Lipid transportation Complete MS ClA6.2 Cla97C03G066330 −1.26 Callose dissolution Redundant MS ClA6.5 Cla97C11G209110 −1.01 Callose dissolution Redundant MS ClQRT3 Cla97C01G025690 −1.14 Pectin dissolution Complete MS ClCalS5 Cla97C02G026770 −2.90 Callose biosynthesis Partial MS ClKCS7 Cla97C10G196270 −2.66 Pollen coat synthesis Partial MS ClKCS15 Cla97C05G096910 −1.19 Pollen coat synthesis Partial MS ClGPAT3 Cla97C09G183960 −3.10 Anther cutin biosynthesis Complete MS ClUCL23 Cla97C11G213980 −1.15 Flavonoid metabolism Partial MS ClJAR1 Cla97C05G081210 −1.49 JA biosynthesis Complete MS WT vs. clms1l1 ClDYT1 Cla97C05G107520 2.25 Early tapetum development Complete MS ClATM1 Cla97C06G117840 −1.09 Tapetum PCD Complete MS ClLBD10 Cla97C02G038990 −2.27 Pollen development Partial MS ClCYP704B1 Cla97C11G214660 1.93 Sporopollenin synthesis Complete MS ClTKPR2 Cla97C05G104620 1.80 Sporopollenin synthesis Partial MS ClDPW2 Cla97C06G119670 2.37 Sporopollenin synthesis Complete MS ClABCG9 Cla97C10G190610 −2.86 Sporopollenin transportation Complete MS ClGPAT3 Cla97C09G183960 2.25 Lipid metabolism Complete MS ClMS44 Cla97C05G089860 −2.32 Lipid transportation Complete MS ClC6 Cla97C05G094260 −1.13 Lipid transportation Partial MS ClLecRK5 Cla97C08G149390 1.43 Callose biosynthesis Complete MS ClG1 Cla97C03G061520 2.00 Callose degradation Complete MS ClKCS5 Cla97C05G089490 −5.12 Pollen coat synthesis Partial MS ClKCS7 Cla97C10G196270 −1.02 Pollen coat synthesis Partial MS ClGELP34 Cla97C07G138280 −1.44 Pollen exine formation Complete MS ClUAM3 Cla97C06G125020 −1.71 Pollen cell wall formation Partial MS Further details and references for these genes are provided in Supplementary Table S12. Table 1.
Identification of the DEGs genes associated with a potential male fertility phenotype.
Figures
(7)
Tables
(1)