-
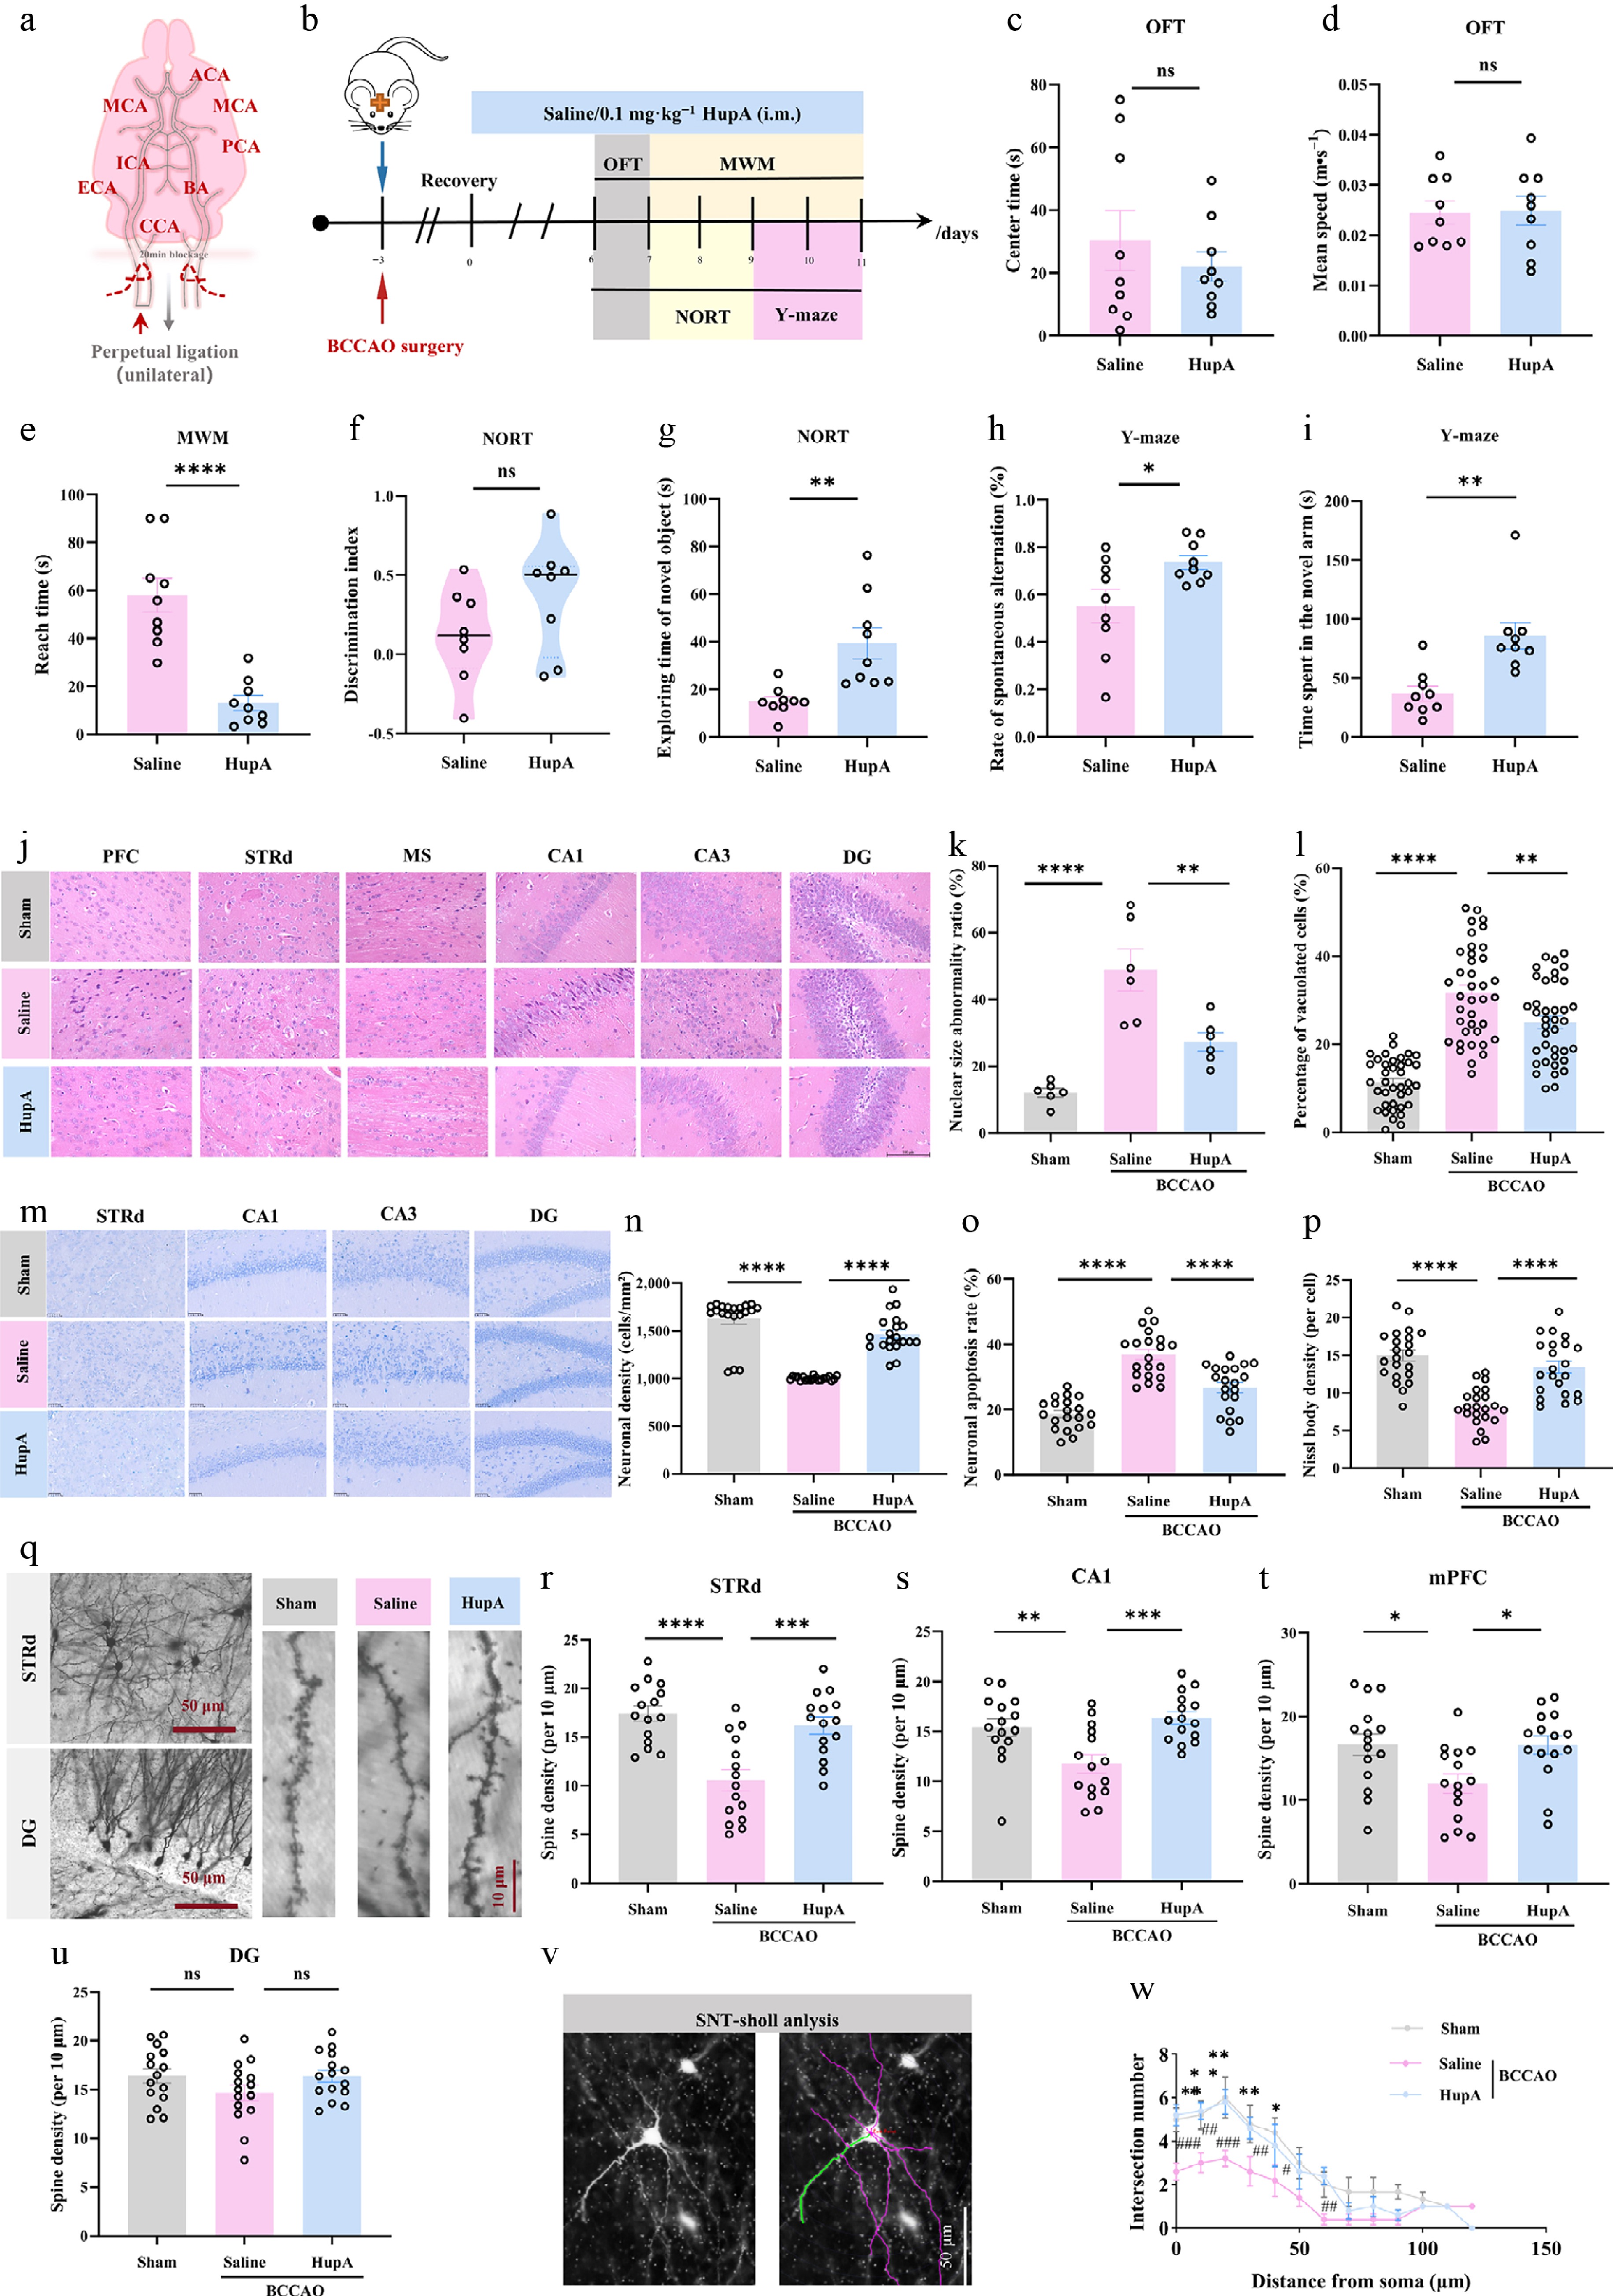
Figure 1.
Intramuscular injection of HupA attenuates cognitive impairment in VaD mice. (a) Schematic diagram of bilateral common carotid artery occlusion (BCCAO) surgery for vessel blockade in mice. (b) Schematic diagram of the Huperzine A (HupA) dosing regimen and behavioral testing timeline in BCCAO mice. i.m., intramuscular. (c) Time spent in the central area during the Open Field Test (OFT) (n = 9). (d) Average movement speed during OFT (n = 9). (e) Time to reach the platform in the Morris Water Maze test (n = 9). (f) Discrimination index in the Novel Object Recognition Test (NORT) (n = 9). (g) Exploration time of the novel object in NORT (n = 9). (h) Spontaneous alternation rate in the Y-maze test (n = 9). (i) Exploration time in the novel open arm of the Y-maze test for each group (n = 9). (j) Representative H&E staining images of different brain regions from each group. Scale bar = 100 μm. PFC, prefrontal cortex. STRd, dorsal striatum. MS, medial septum. CA1, cornu ammonis area 1. CA3, cornu ammonis area 3. DG, dentate gyrus. (k) Percentage of nuclei with abnormal size (n = 6). (l) Percentage of vacuolated cells (n = 38 cells). (m) Representative Nissl staining images of different brain regions. Scale bar = 100 μm. (n) Neuronal density per mm2 (n = 20). (o) Proportion of apoptotic neurons (n = 20). (p) Density of Nissl bodies per cell (n = 22 cells). (q) Representative Golgi staining images from each group. Scale bar = 50 and 10 μm. (r)–(u) Dendritic spine density in the STRd, CA1, mPFC, and DG regions (n = 15). (v) Schematic diagram of Sholl analysis. Scale bar = 50 μm. (w) Results of Sholl analysis. Data are presented as mean ± SEM; * P < 0.05, ** P < 0.01, *** P < 0.001, **** P < 0.0001; # P < 0.05, ## P < 0.01, ### P < 0.001; (c)–(i) two-tailed unpaired Student's t-test; (k), (l), (n)–(p), (r)–(u) one-way analysis of variance.
-
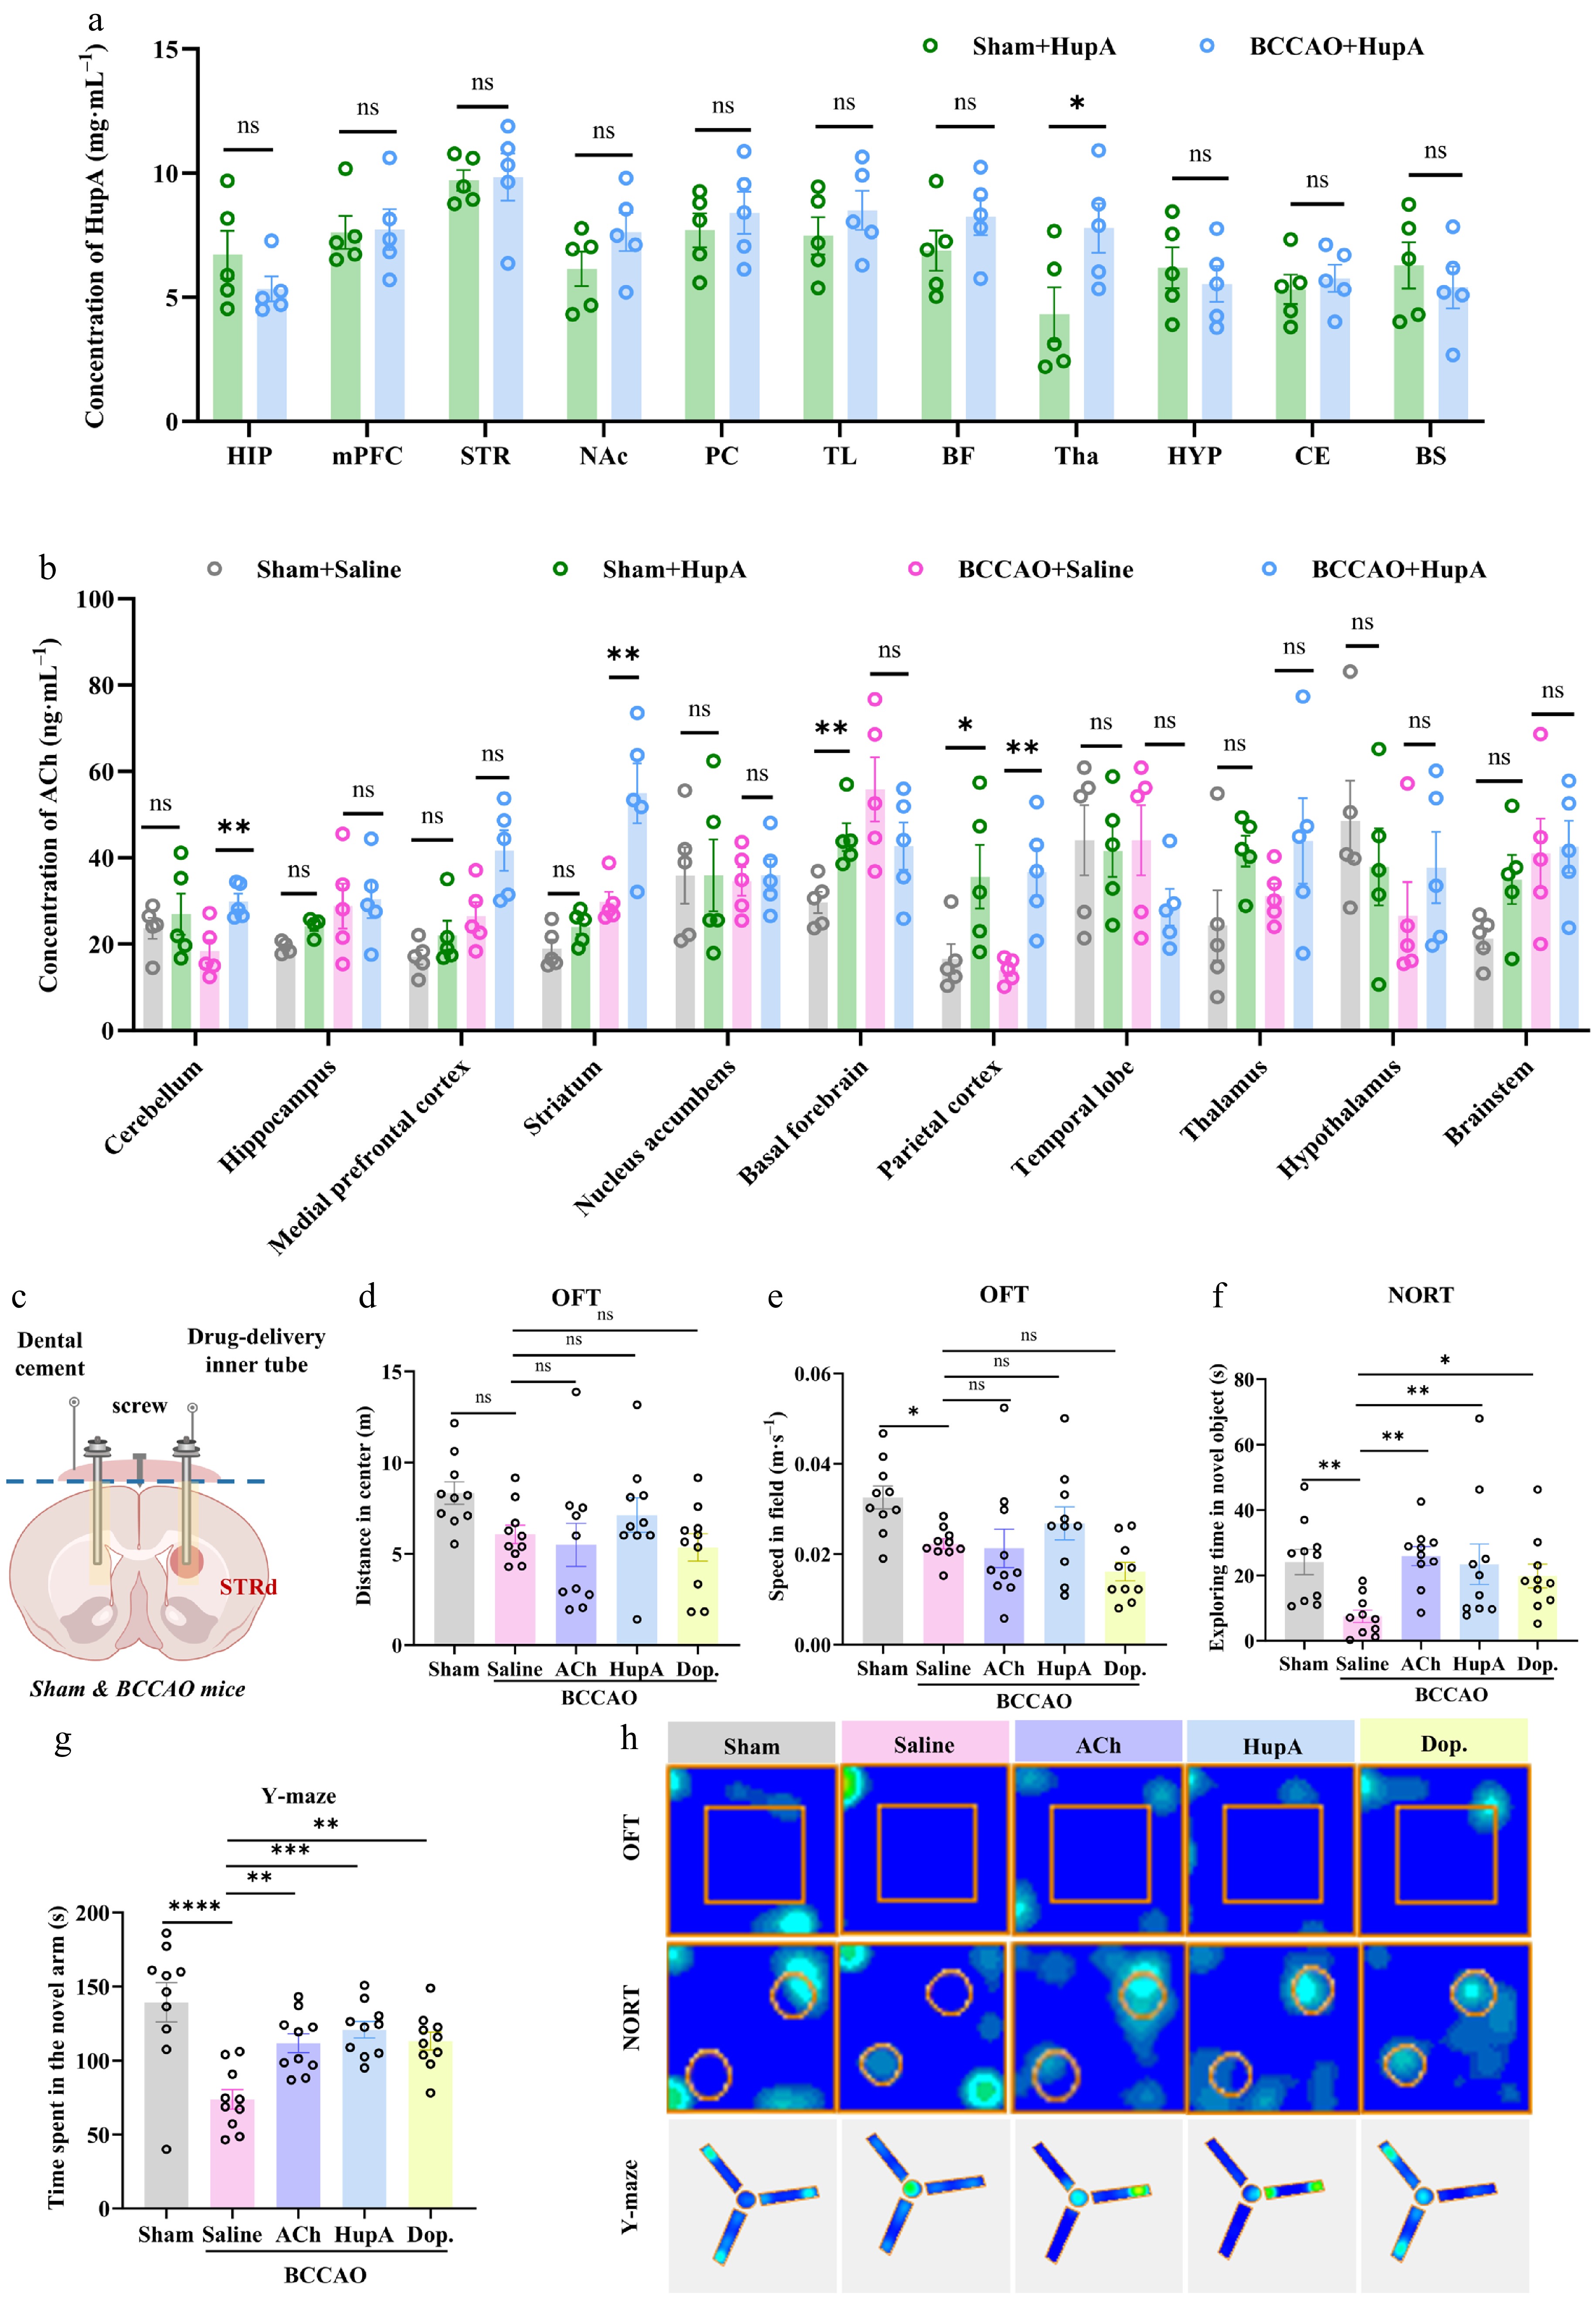
Figure 2.
HupA administration into the STRd confers cognitive improvement in VaD mice. (a) Changes in Huperzine A (HupA) concentration in different brain regions after intramuscular injection of HupA to sham or bilateral common carotid artery occlusion (BCCAO) mice (n = 5). HIP, hippocampus. mPFC, medial prefrontal cortex. STR, striatum. NAc, nucleus accumbens. PC, piriform cortex. TL, temporal lobe. BF, basal forebrain. Tha, thalamus. HYP, hypothalamus. CE, central nucleus of amygdala. BS, brainstem. (b) Changes in ACh concentration in different brain regions of sham or BCCAO mice with or without HupA treatment (n = 5). (c) Schematic diagram of dorsal striatal cannula burial and in situ drug delivery. (d) Time spent in the central area during the Open Field Test (OFT) (n = 10). ACh, acetylcholine. Dop, donepezil. (e) Average movement speed during OFT (n = 10). (f) Exploration time in the novel open arm of the Y-maze test (n = 10). (g) Exploration time of the novel object in the Novel Object Recognition Test (NORT) (n = 10). (h) Representative heatmaps depicting the movement tracks of mice during behavioral tests. Data are expressed as mean ± SEM; * P < 0.05, ** P < 0.01, *** P < 0.001, **** P < 0.0001; (a), (b) two-tailed unpaired Student's t-test; (d)–(g) one-way analysis of variance.
-
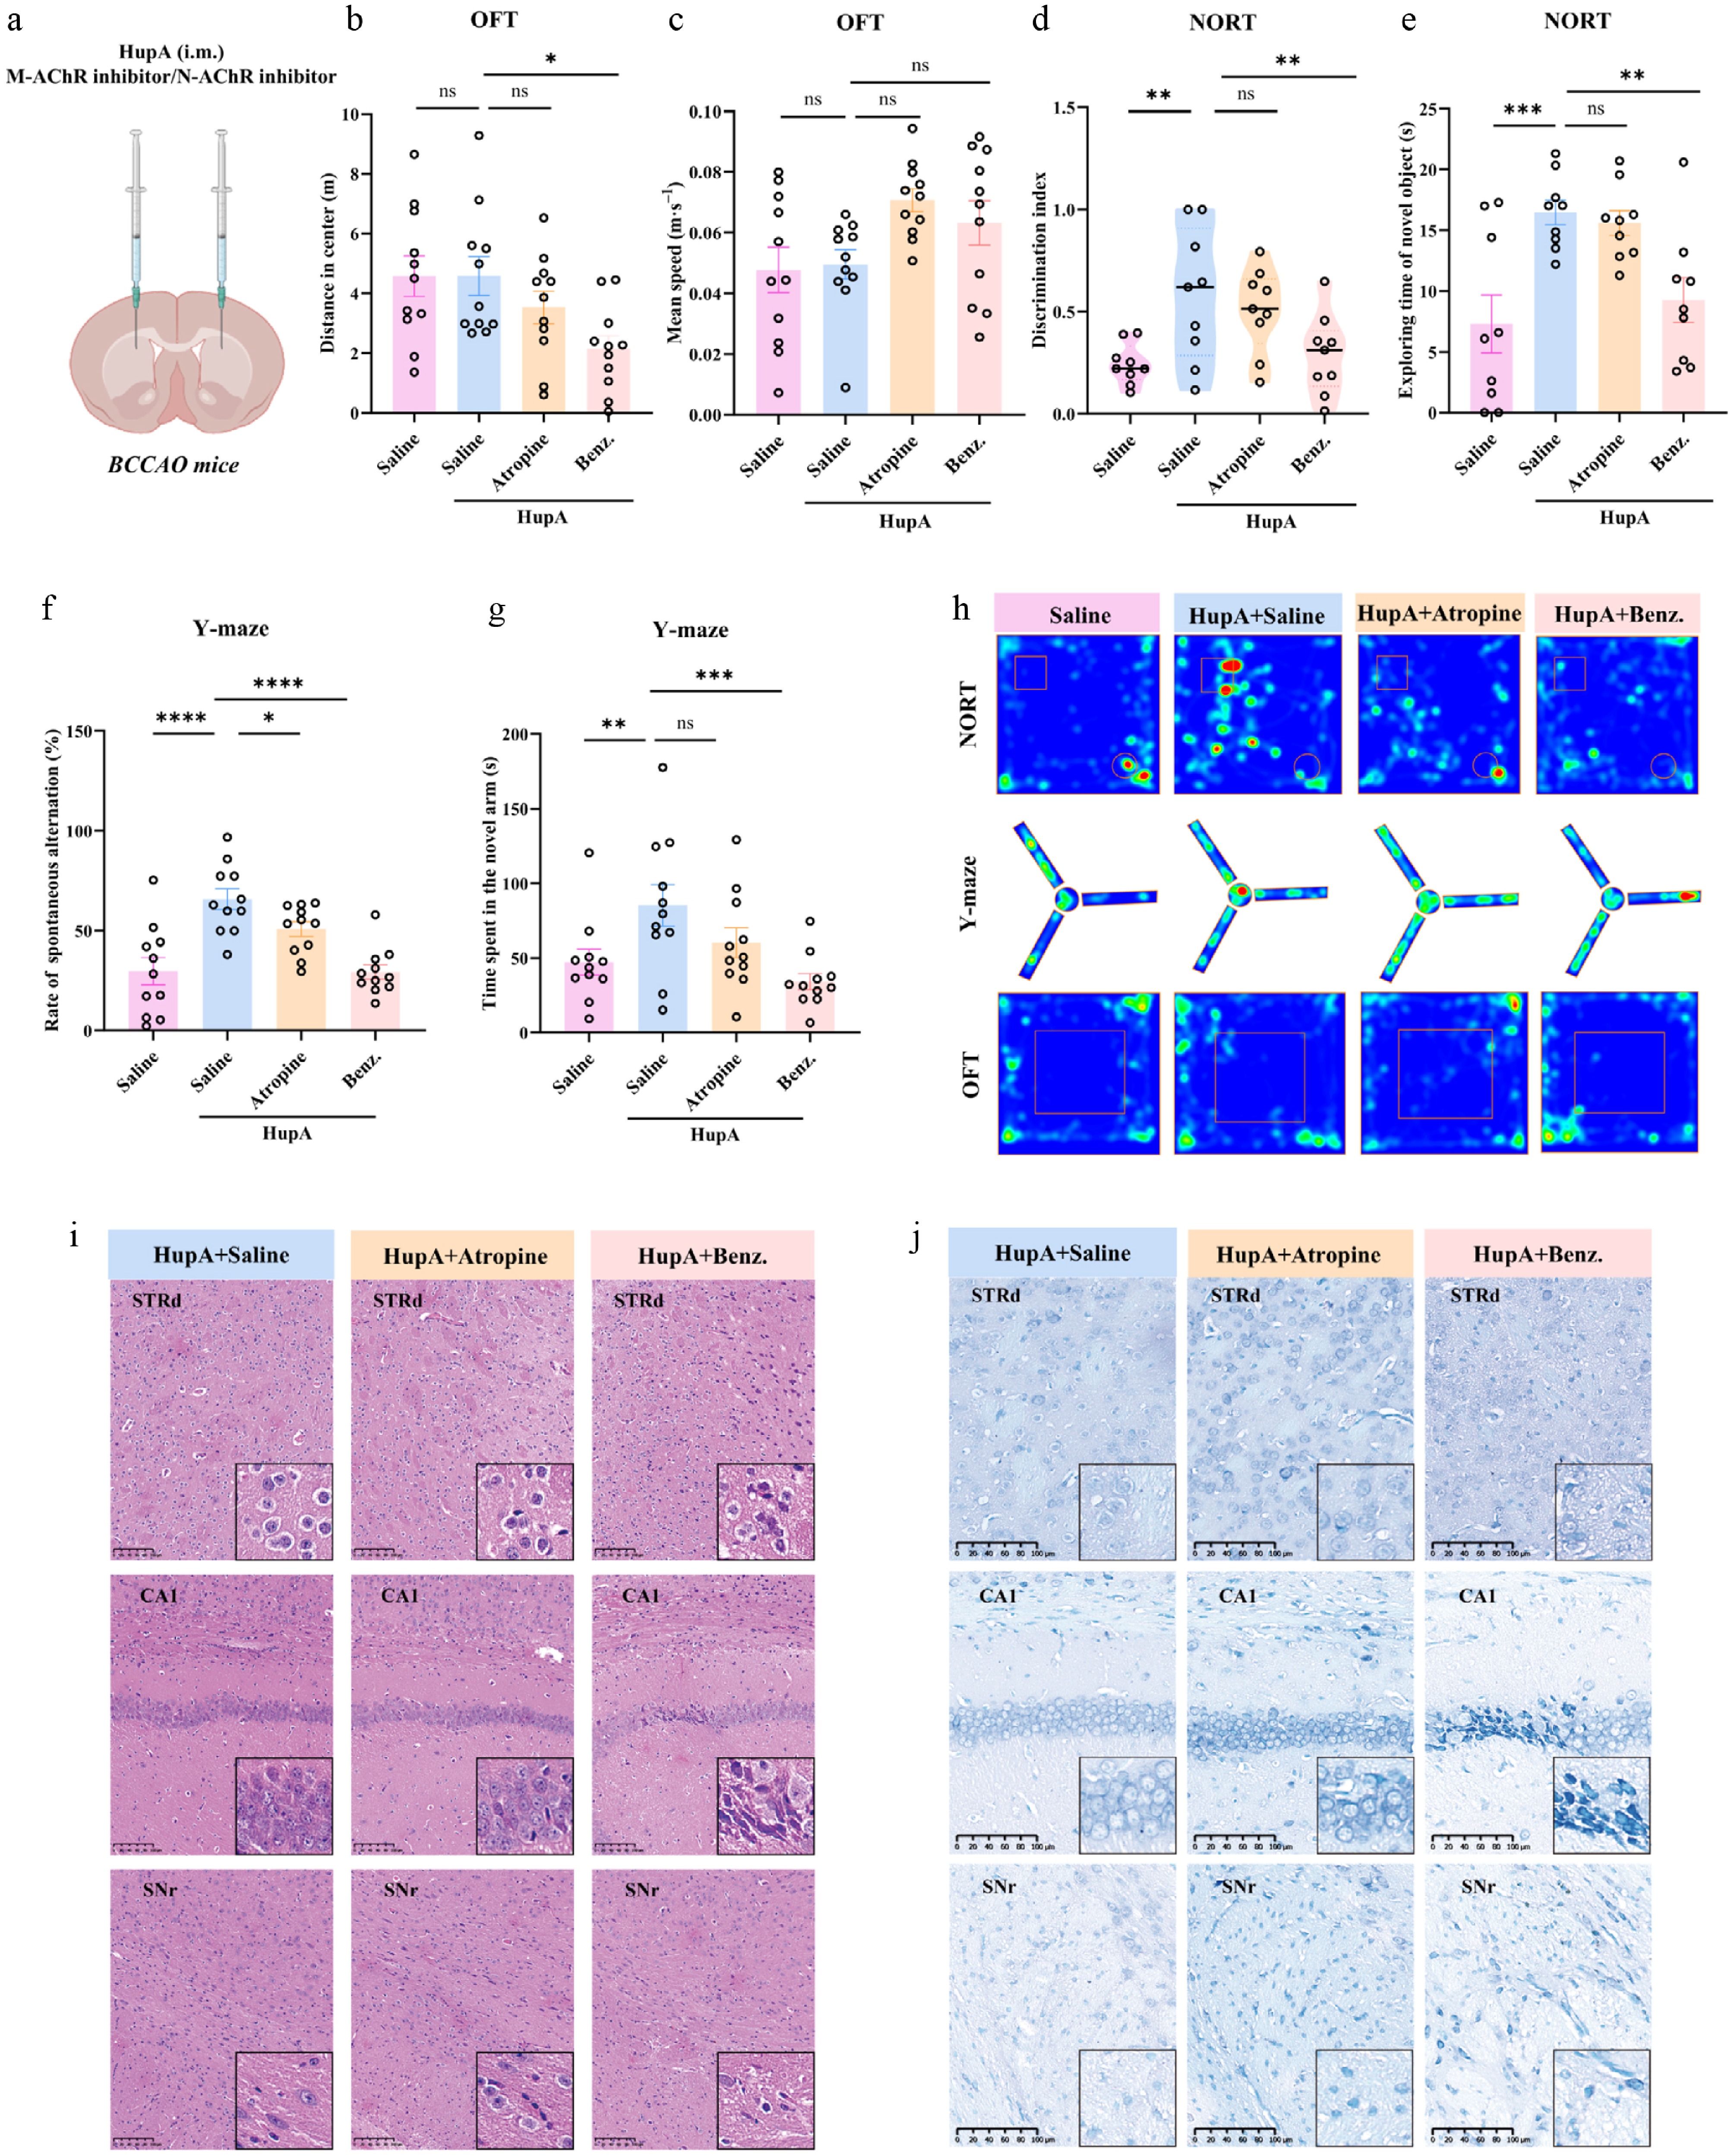
Figure 3.
N-type AChRs mediate the improvement of cognitive dysfunction in VaD mice by HupA. (a) Schematic diagram of in situ administration into the dorsal striatum (STRd) in BCCAO mice. Drug administration: atropine (0.5 mmol·L−1, 1 μL per side, bilateral injection). (b) Distance traveled in the center during the Open Field Test (OFT) (n = 11). Benz., benzethonium chloride. Drug administration: Benz (1 mmol·L−1, 0.25 μL per side, bilateral injection). (c) Movement speed during OFT (n = 11). (d) Discrimination index in the Novel Object Recognition Test (NORT) (n = 9). (e) Exploration time of the novel object in NORT (n = 9). (f) Spontaneous alternation rate in the Y-maze (n = 11). (g) Exploration time in the novel arm of the Y-maze (n = 11). (h) Representative heatmaps depicting the movement tracks of mice during behavioral tests. CA1, cornu ammonis area 1. SNr, substantia nigra pars reticulata. (i) Representative H&E staining images of different brain regions. Scale bar = 100 μm. (j) Representative Nissl staining images of different brain regions; scale bar = 100 μm. Data are expressed as mean ± SEM; * P < 0.05, ** P < 0.01, *** P < 0.001, **** P < 0.0001; (b)–(g) one-way analysis of variance.
-
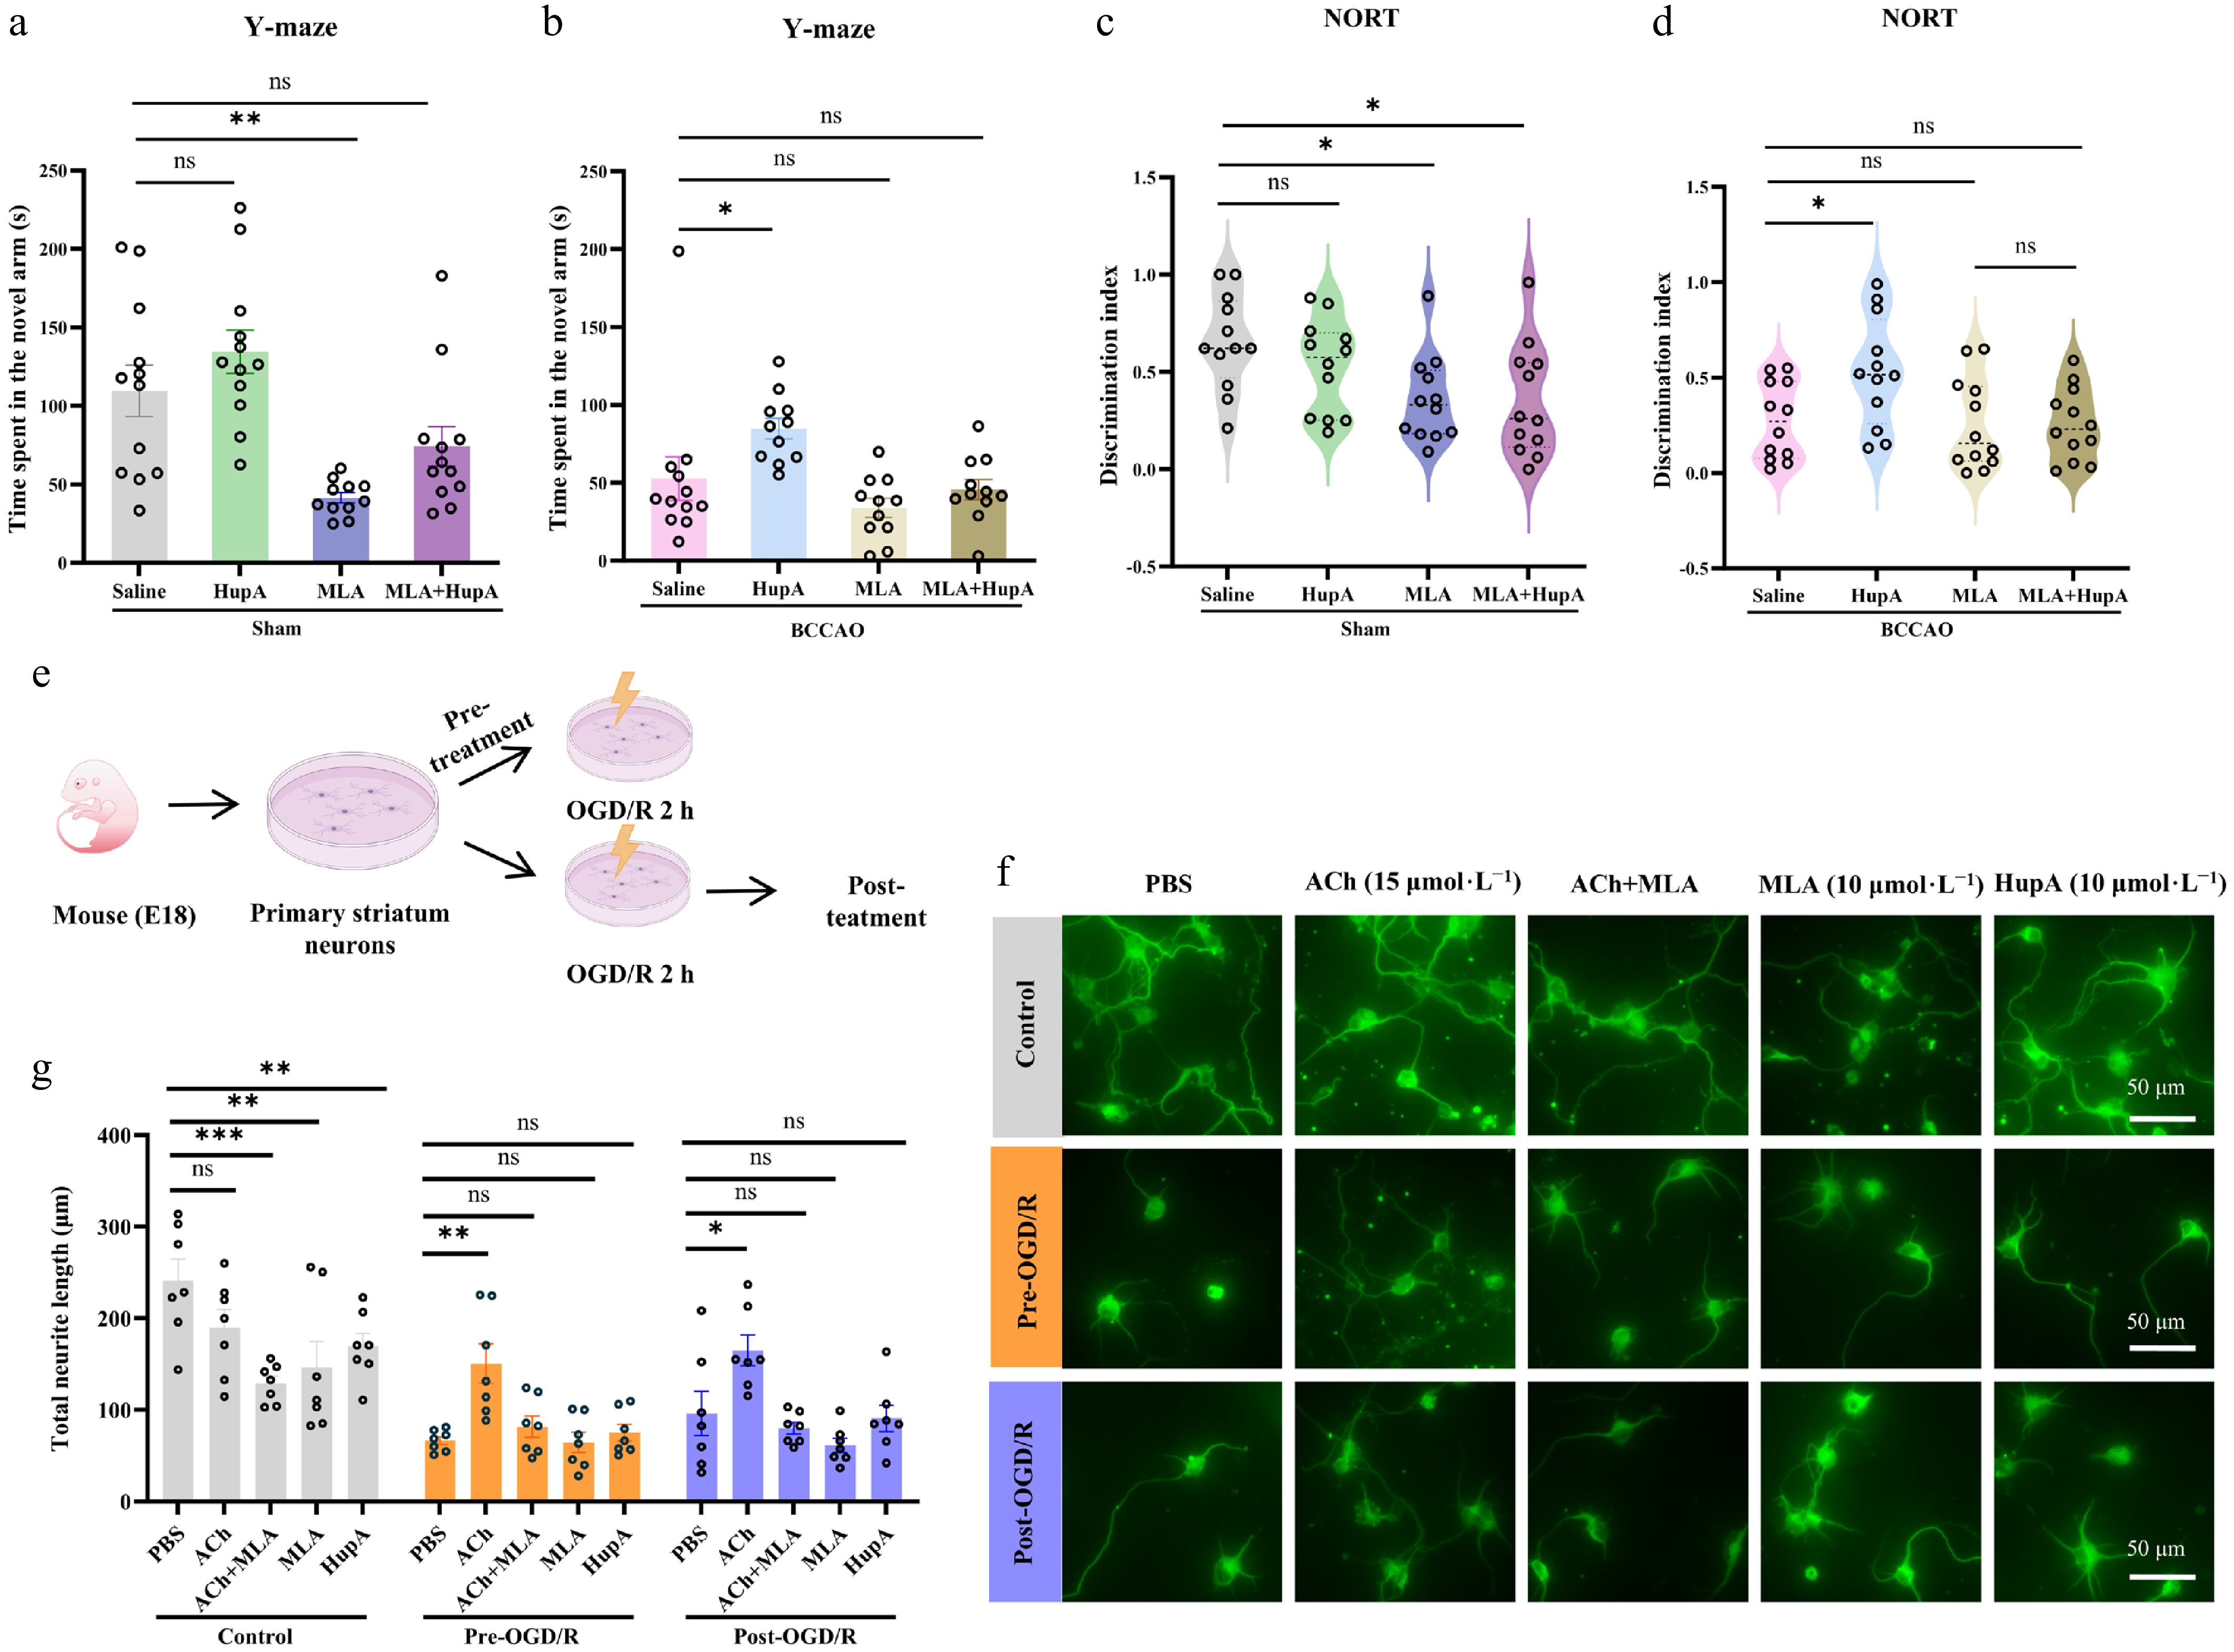
Figure 4.
α7nAChR mediate improvement of cognitive dysfunction in VaD mice by HupA. (a), (b) Exploration time in the novel arm of the Y-maze (n = 11). Drug administration: MLA (methyllycaconitine citrate, 2 μmol·L−1, 1 μL per side, bilateral injection). (c), (d) Discrimination index in the NORT (n = 11). Drug administration: MLA (methyllycaconitine citrate, 2 μmol·L−1, 1 μL per side, bilateral injection). (e) Schematic diagram of study involving the mouse striatal primary neuron extraction, oxygen-glucose deprivation/reoxygenation (OGD/R) and pharmacological treatment. (f) Fluorescence images of neurons after pharmacological treatment. Scale bar = 50 μm. (g) Neurite length after drug treatment (n = 7). Data are presented as mean ± SEM; * P < 0.05, ** P < 0.01, *** P < 0.001, **** P < 0.0001; (a)–(d), (g) one-way analysis of variance.
-
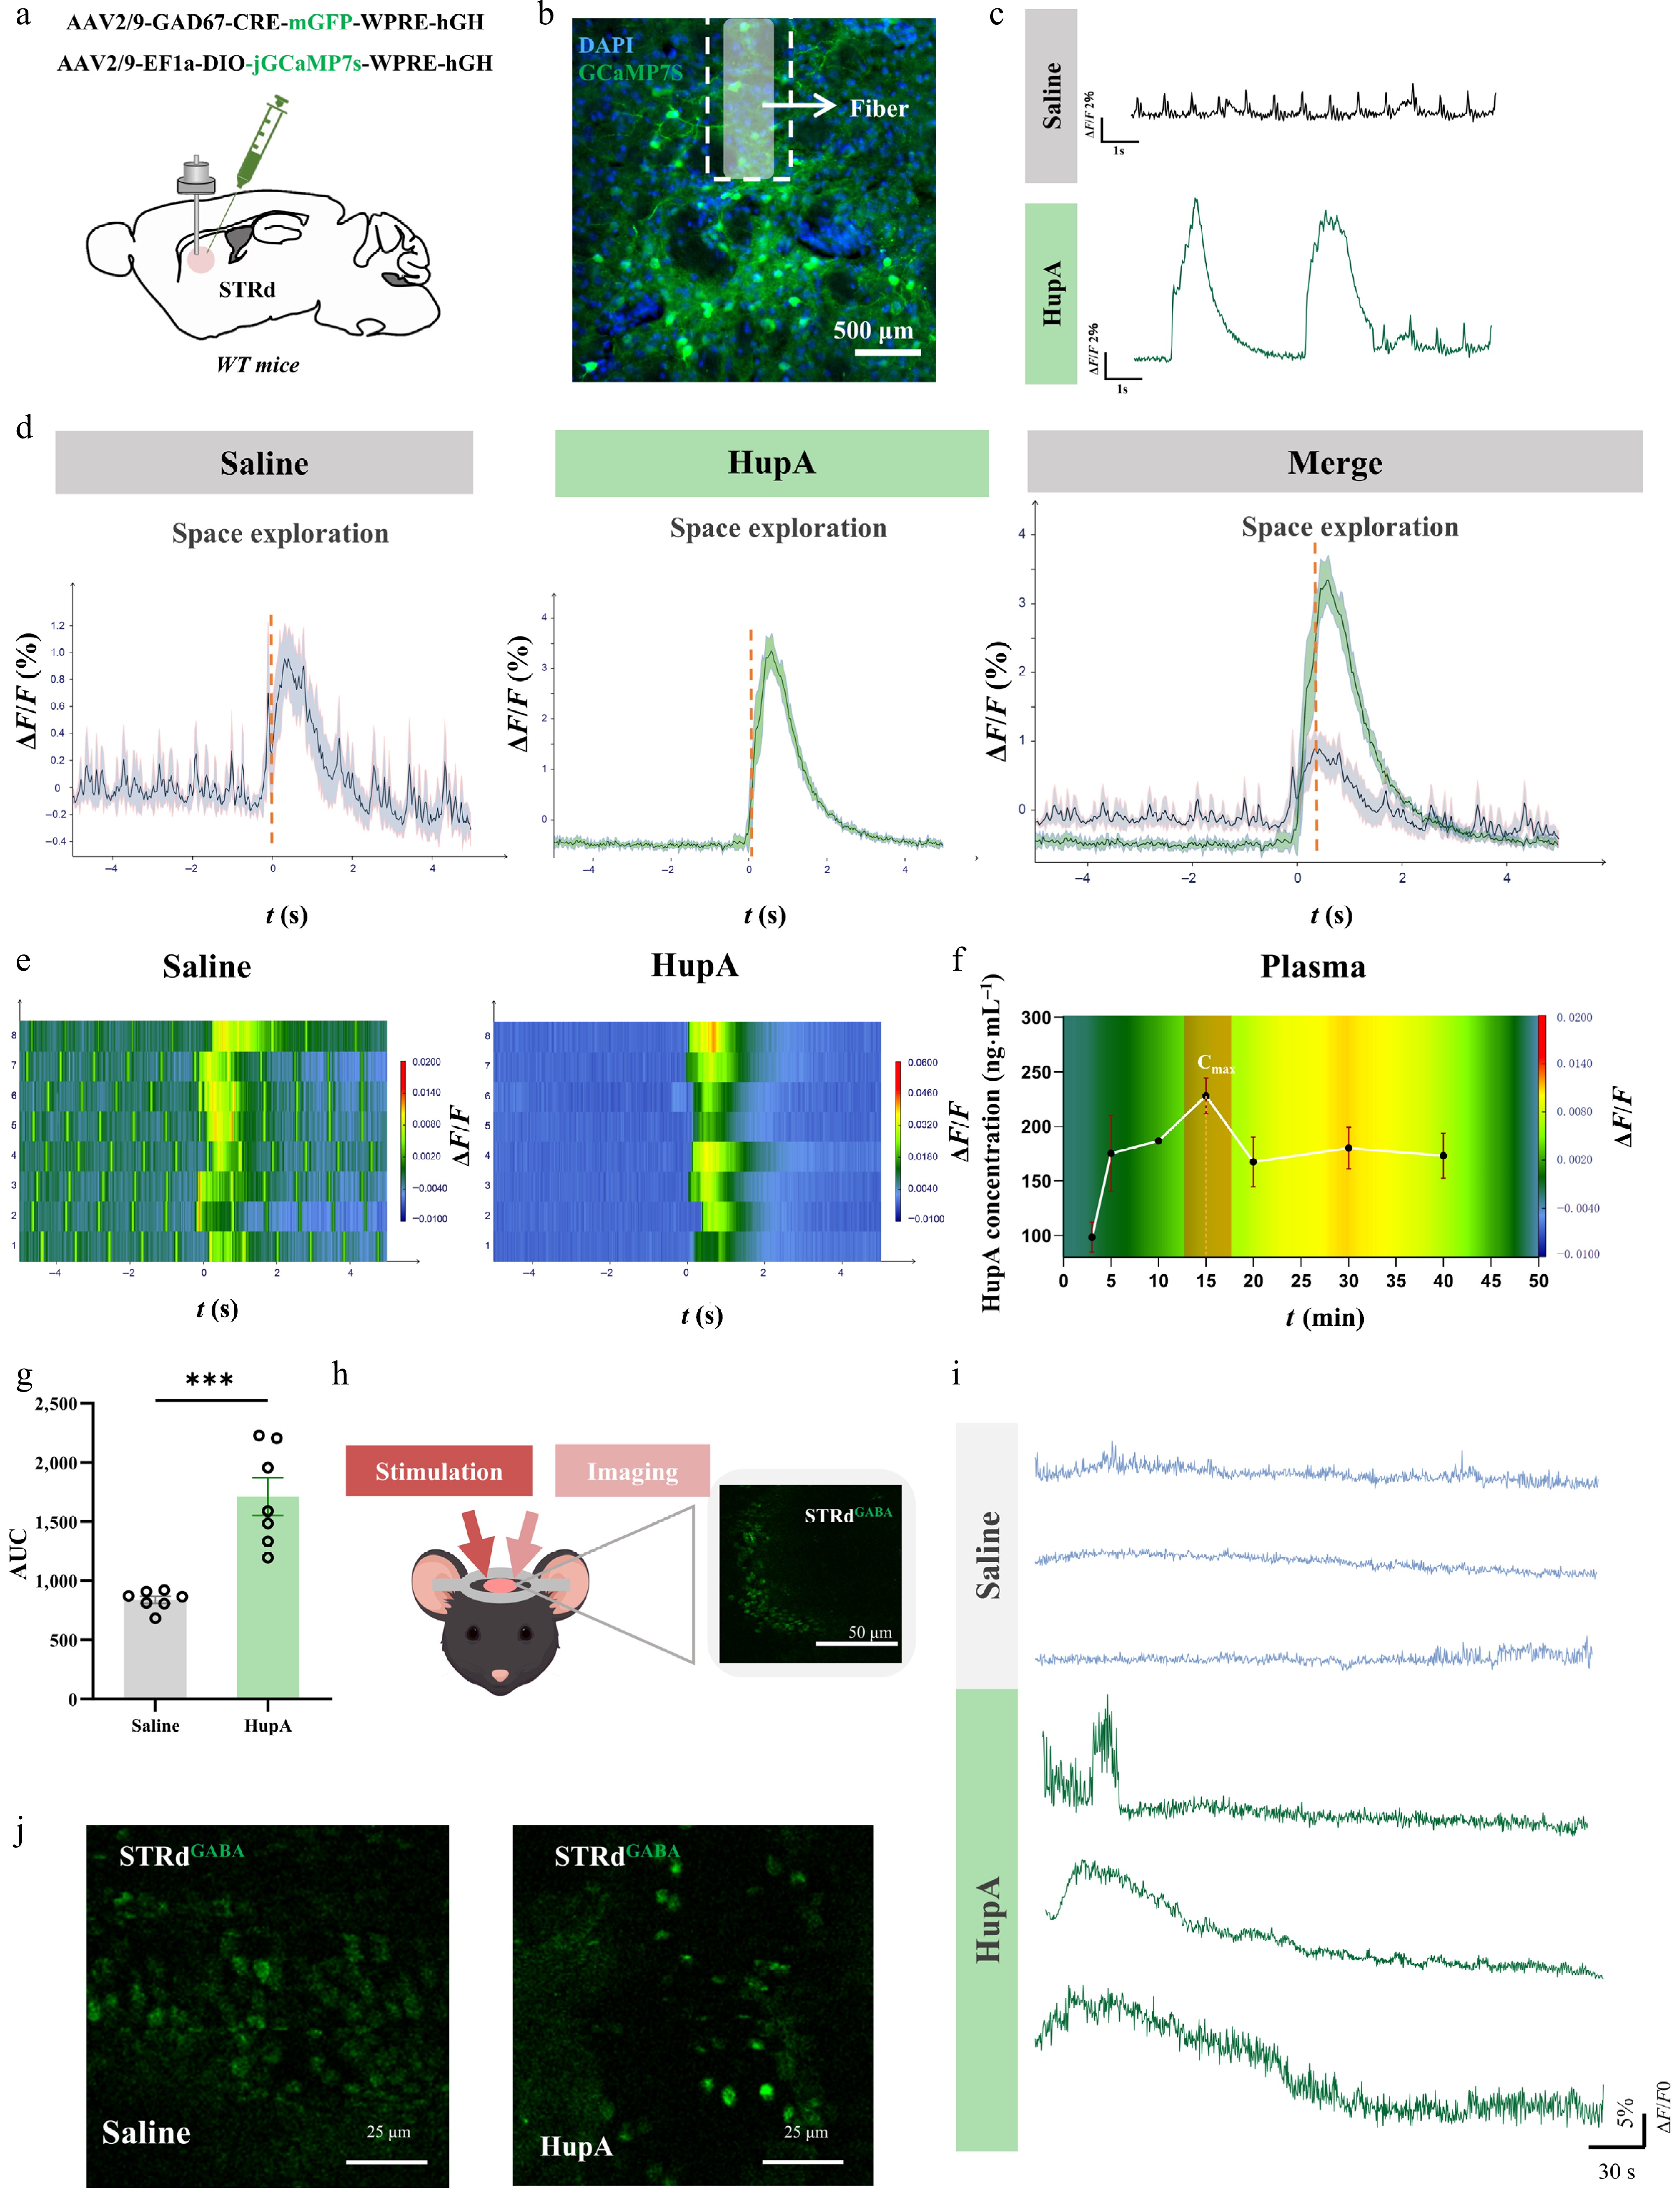
Figure 5.
Intramuscular injection of HupA activates STRd GABA neurons. (a) Schematic diagram of virus injection into the dorsal striatum (STRd) in WT mice. (b) Diagram confirming virus injection site and cannula placement site in the STRd. Scale bar = 500 μm. (c) Characteristic calcium signal waveforms before and after HupA injection. (d) Comparison of calcium signals before and after HupA injection. (e) Representative heatmaps of calcium signals before and after HupA injection. (f) Time-course plot of calcium signaling and plasma drug concentration following HupA injection (0−50 min). The calcium signals were plotted as a heatmap. (g) Statistical values of the area under the curve (AUC) for fiber photometry signals in each group (n = 7). (h) Schematic diagram of in vivo two-photon experiment in normal mice. Scale bar = 50 μm. (i) Characteristic calcium signal waveforms in saline and HupA groups (n = 3). (j) Fluorescence images of calcium signals in GABAergic neurons in the STRd. Scale bar = 25 μm. Data are presented as mean ± SEM; * P < 0.05, ** P < 0.01, *** P < 0.001, **** P < 0.0001; (g) two-tailed unpaired Student's t-test.
-
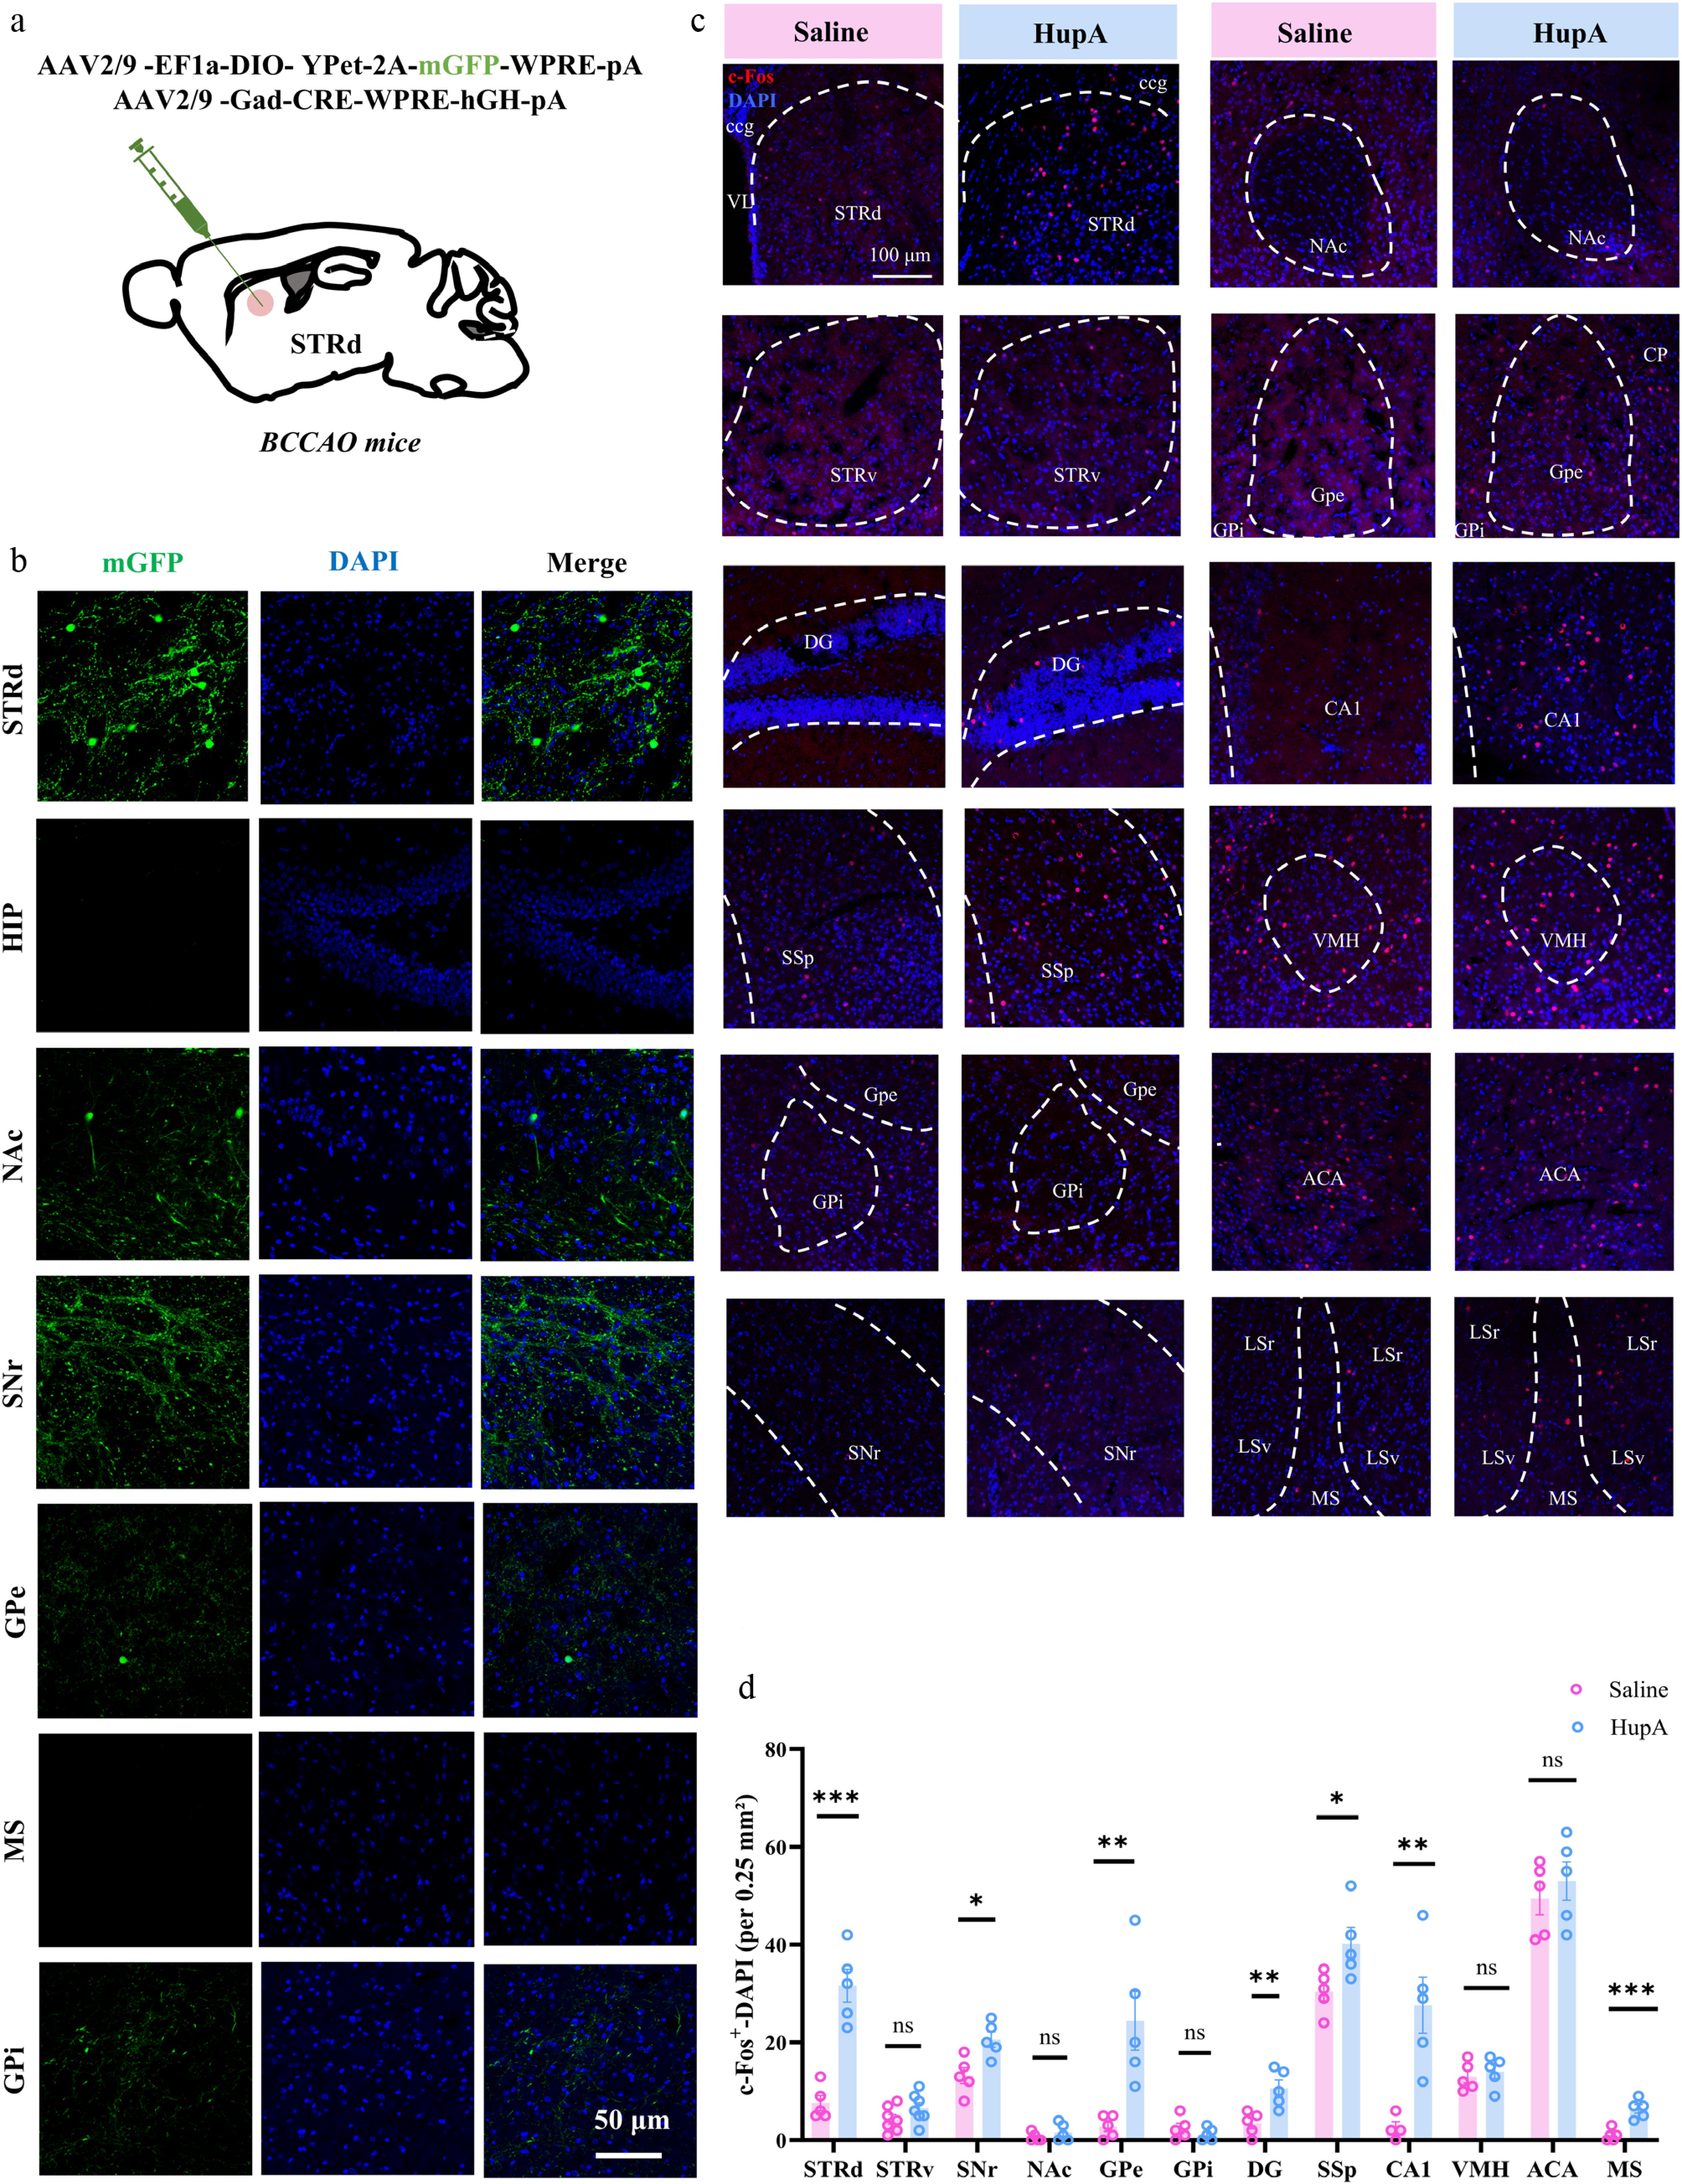
Figure 6.
HupA activates SNr neurons downstream of the striatum. (a) Schematic of the anterograde tracing virus strategy in BCCAO mice. (b) Schematic of anterograde tracing results from the striatum. Scale bar = 50 μm. HIP, hippocampus. STRd, dorsal striatum. NAc, nucleus accumbens. SNr, substantia nigra pars reticulata. GPi, globus pallidus internus. GPe, globus pallidus externus. MS, medial septum. (c) Representative c-Fos immunostaining images of the STRd, GPi, GPe, SNr, NAc, ventral striatum (STRv), dentate gyrus (DG), primary somatosensory cortex (SSp), cornu ammonis area 1 (CA1), ventromedial hypothalamus (VMH), anterior cingulate area (ACA), and MS brain regions. Scale bar = 100 μm. (d) Statistical analysis of the number of c-Fos+ neurons per 0.25 mm2 area (n = 5). Data are presented as mean ± SEM; * P < 0.05, ** P < 0.01, *** P < 0.001; (d) two-tailed unpaired Student's t-test.
-
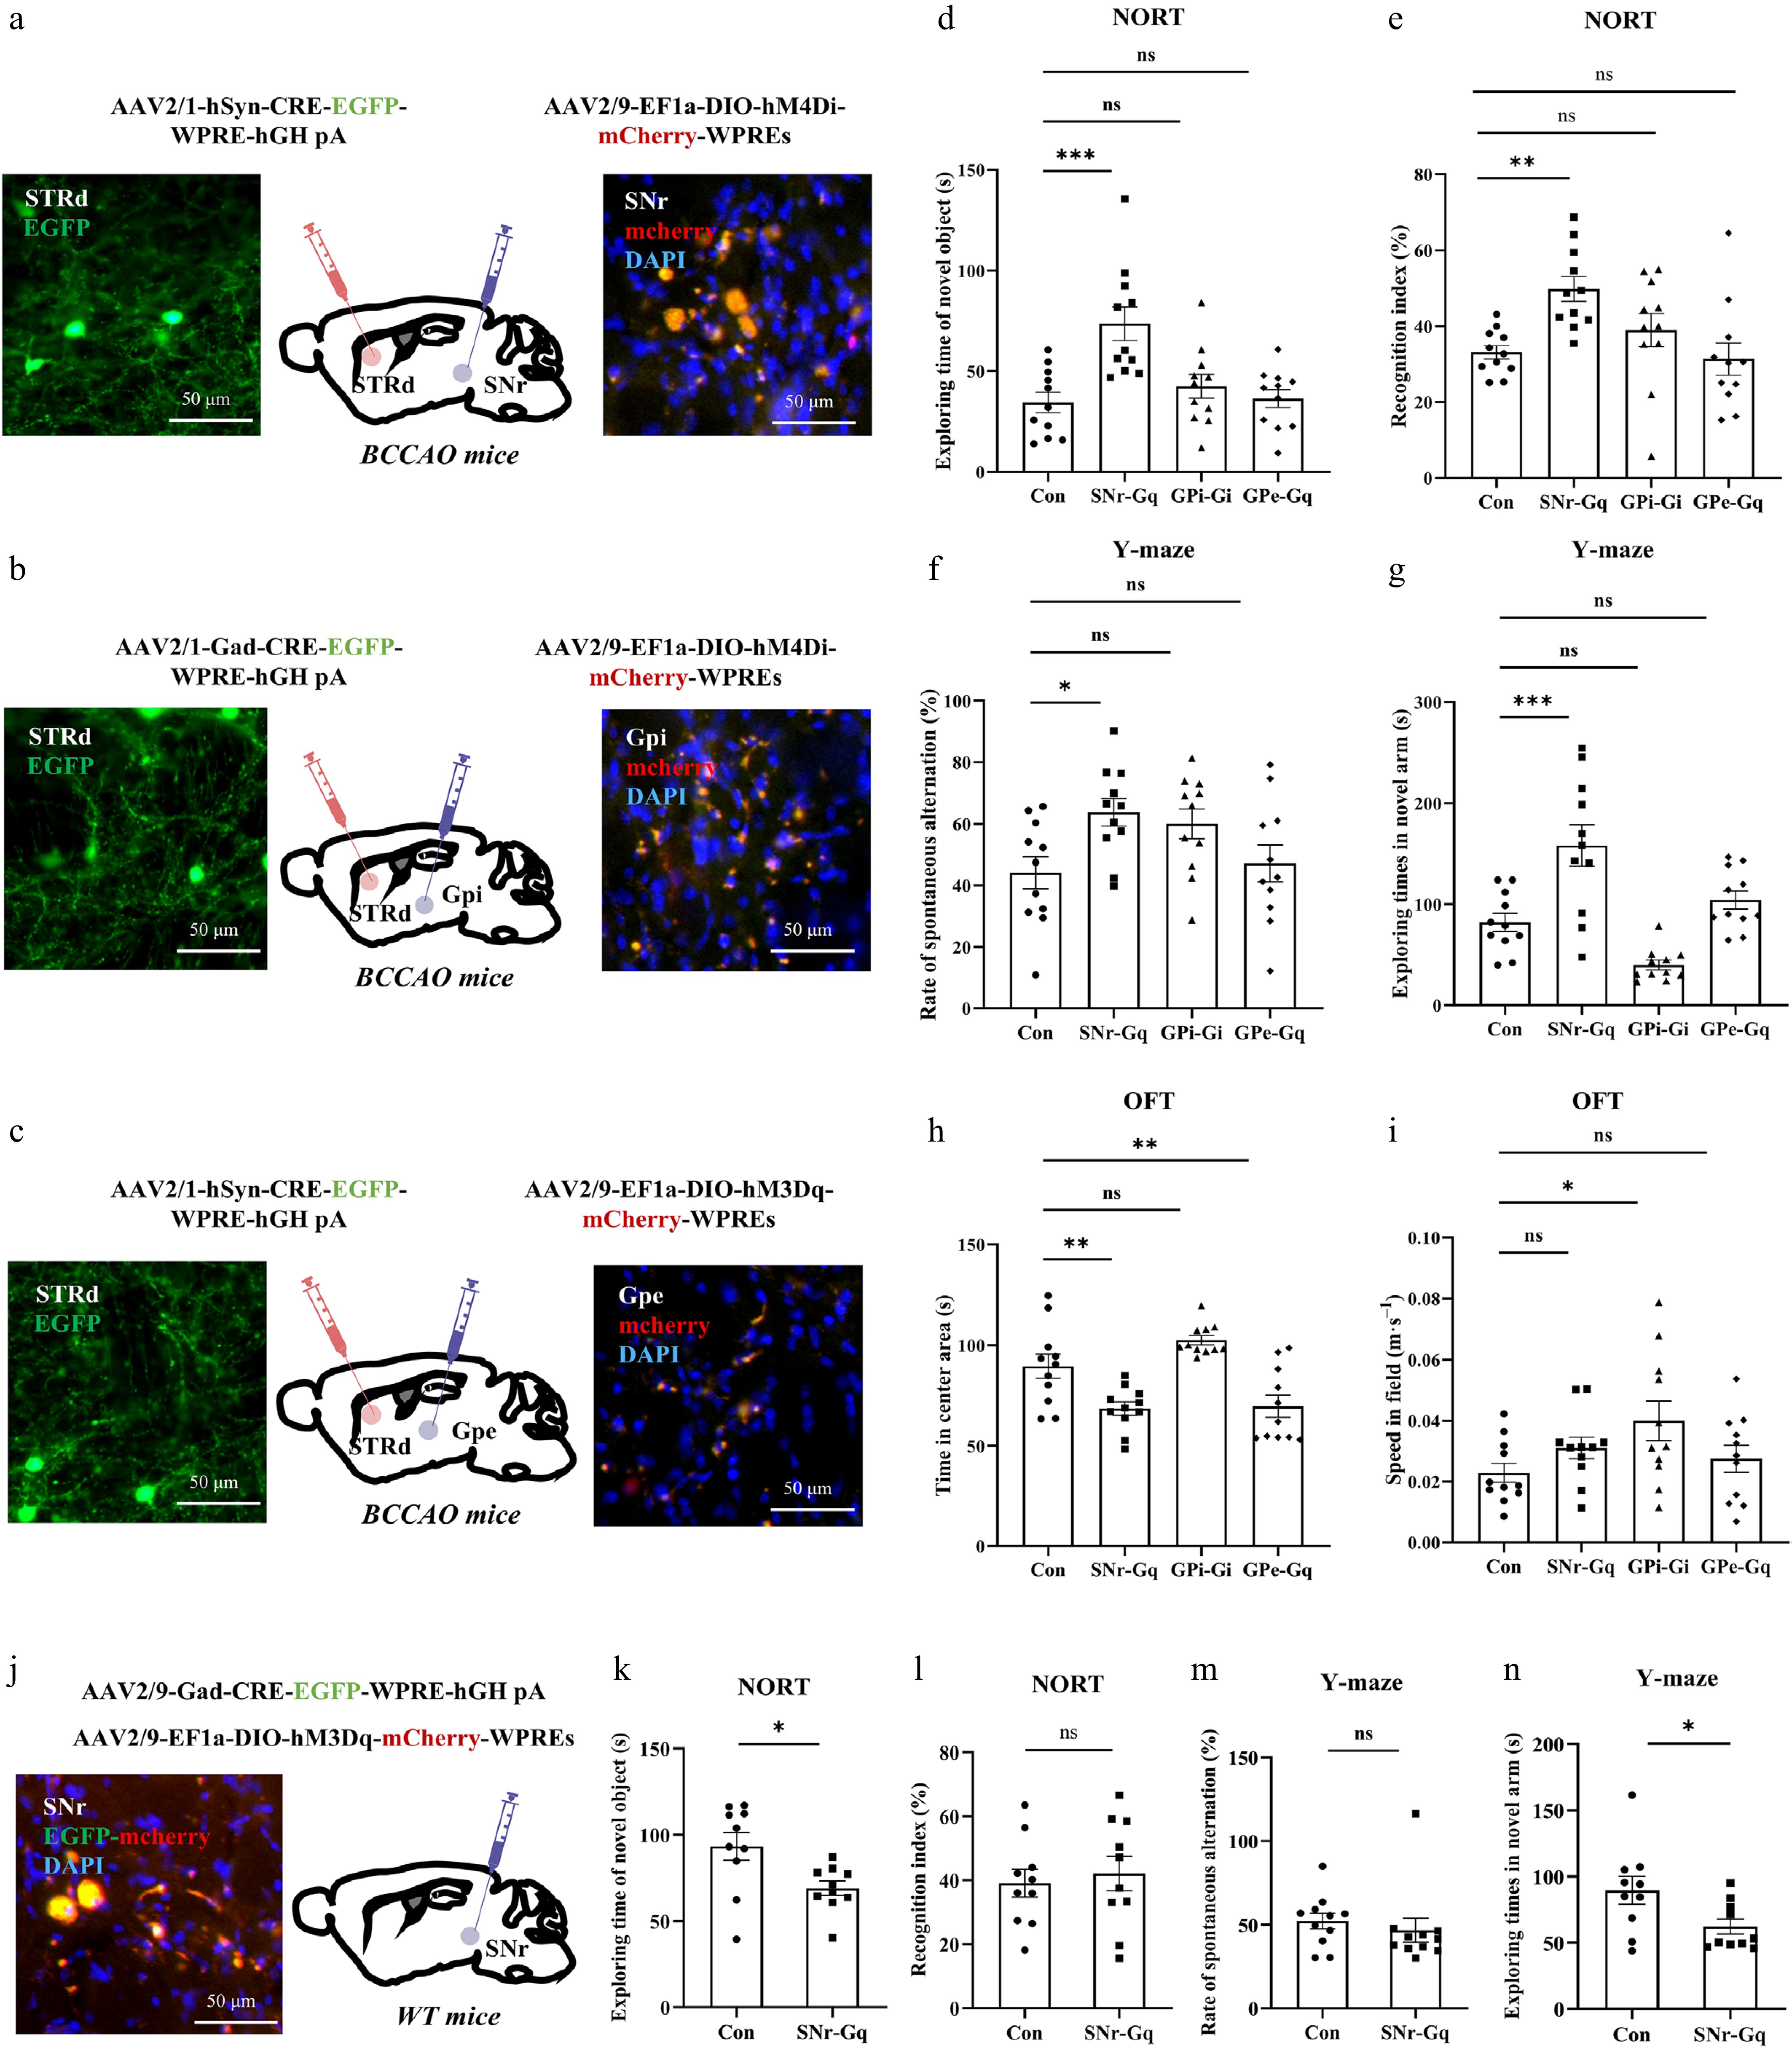
Figure 7.
HupA improves cognitive impairment in VaD mice via the STRdGABA→SNrGABA circuit. (a)–(c) Chemogenetic regulation strategy for STRd projections and representative images of virus expression. Scale bar = 50 μm. (d) Exploration time of the novel object in NORT (n = 11). (e) Discrimination index in NORT (n = 11). (f) Exploration time in the open arm of the Y-maze (n = 11). (g) Spontaneous alternation rate in the Y-maze (n = 11). (h) Time spent in the central area during OFT (n = 11). (i) Movement speed during OFT (n = 11). (j) Chemogenetic strategy for SNr. Scale bar = 50 μm. (k), (l) Exploration time and discrimination index of the novel object in the NORT (n = 10). (m), (n) Exploration time in the open arm and spontaneous alternation rate in the Y-maze (n = 10). Data are presented as mean ± SEM; * P < 0.05, ** P < 0.01, *** P < 0.001; (k)–(n) two-tailed unpaired Student's t-test; (d)–(i) one-way analysis of variance.
-
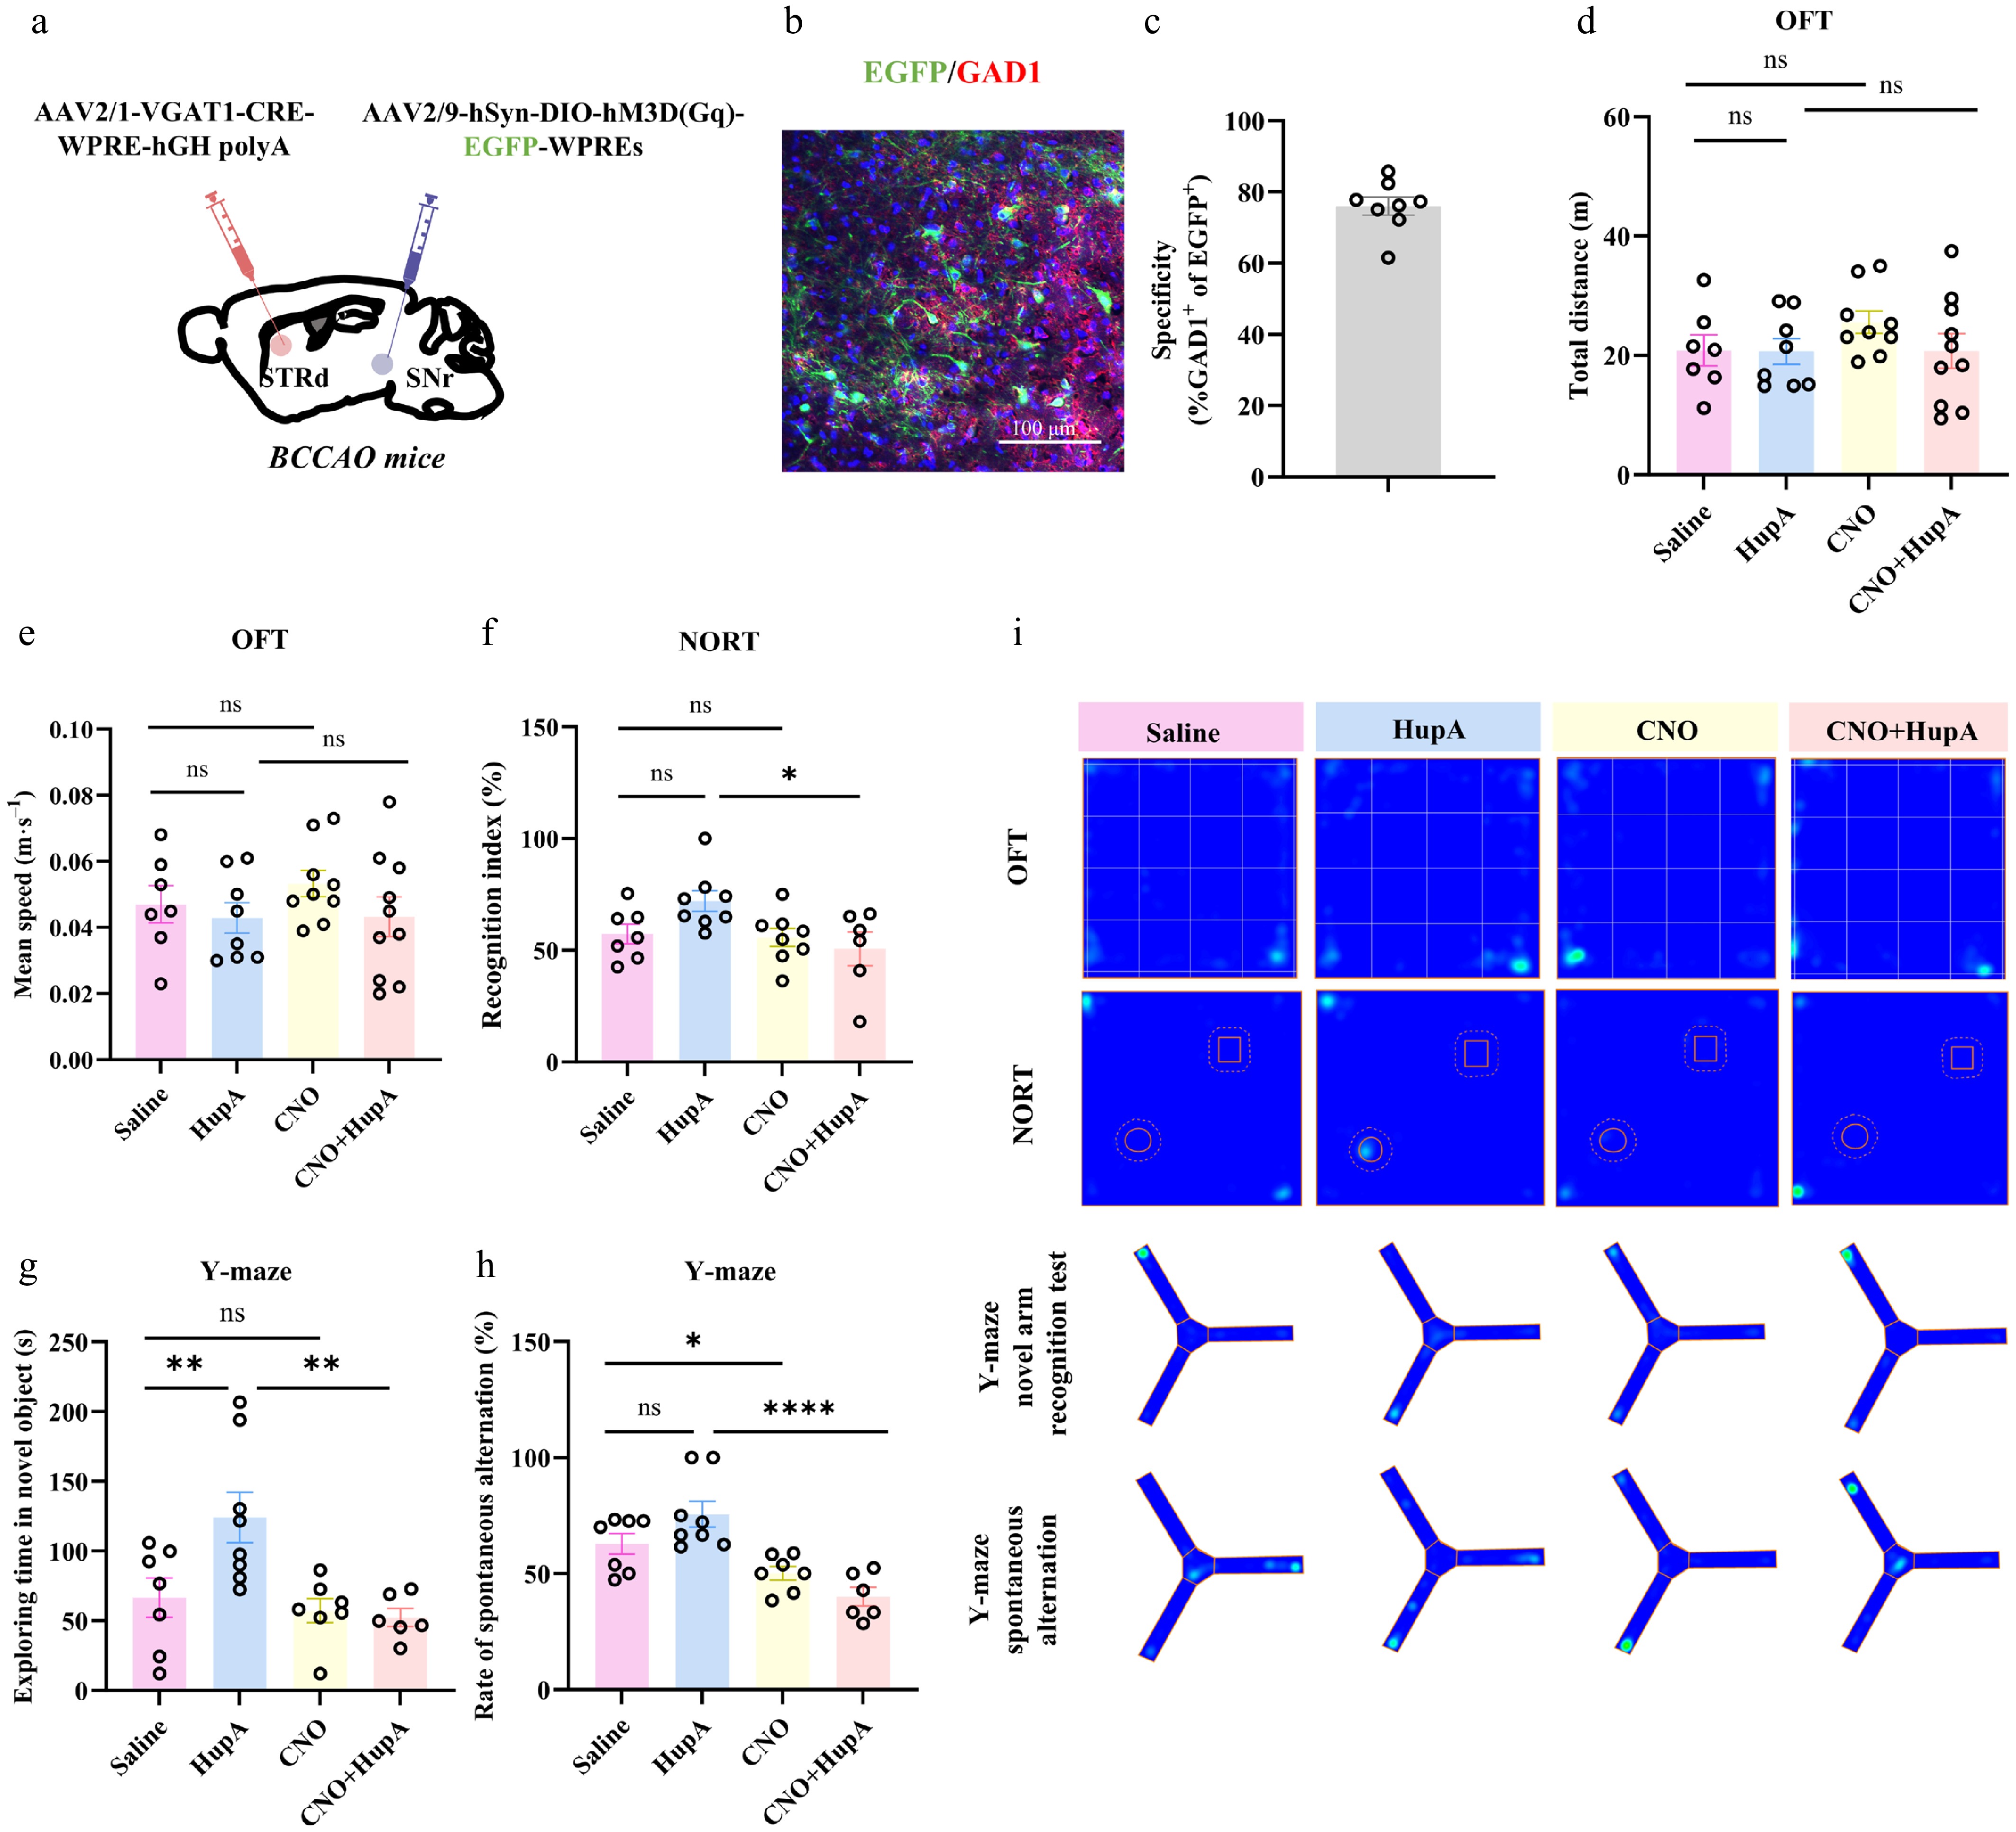
Figure 8.
Chemogenetic activation of SNr GABAergic neurons blunts HupA effect. (a) Schematic diagram of virus injection into VaD mice. (b) Specificity verification of virus expression. (c) Percentage of EGFP+ cells co-labeled with GAD1 (n = 8). (d) Total distance traveled during OFT for each group (n = 7−10). (e) Movement speed during OFT (n = 7−10). (f) The novel object recognition index in NORT for each group (n = 6−8). (g) Exploration time in the novel open arm of the Y-maze test for each group (n = 6−8). (h) Spontaneous alternation rate in the Y-maze test for each group (n = 6−8). (i) Representative heatmaps depicting the movement tracks of mice during the behavioral tests. Data are presented as mean ± SEM; * P < 0.05, ** P < 0.01, **** P < 0.0001; (d)–(h) two-way analysis of variance.
Figures
(8)
Tables
(0)