-
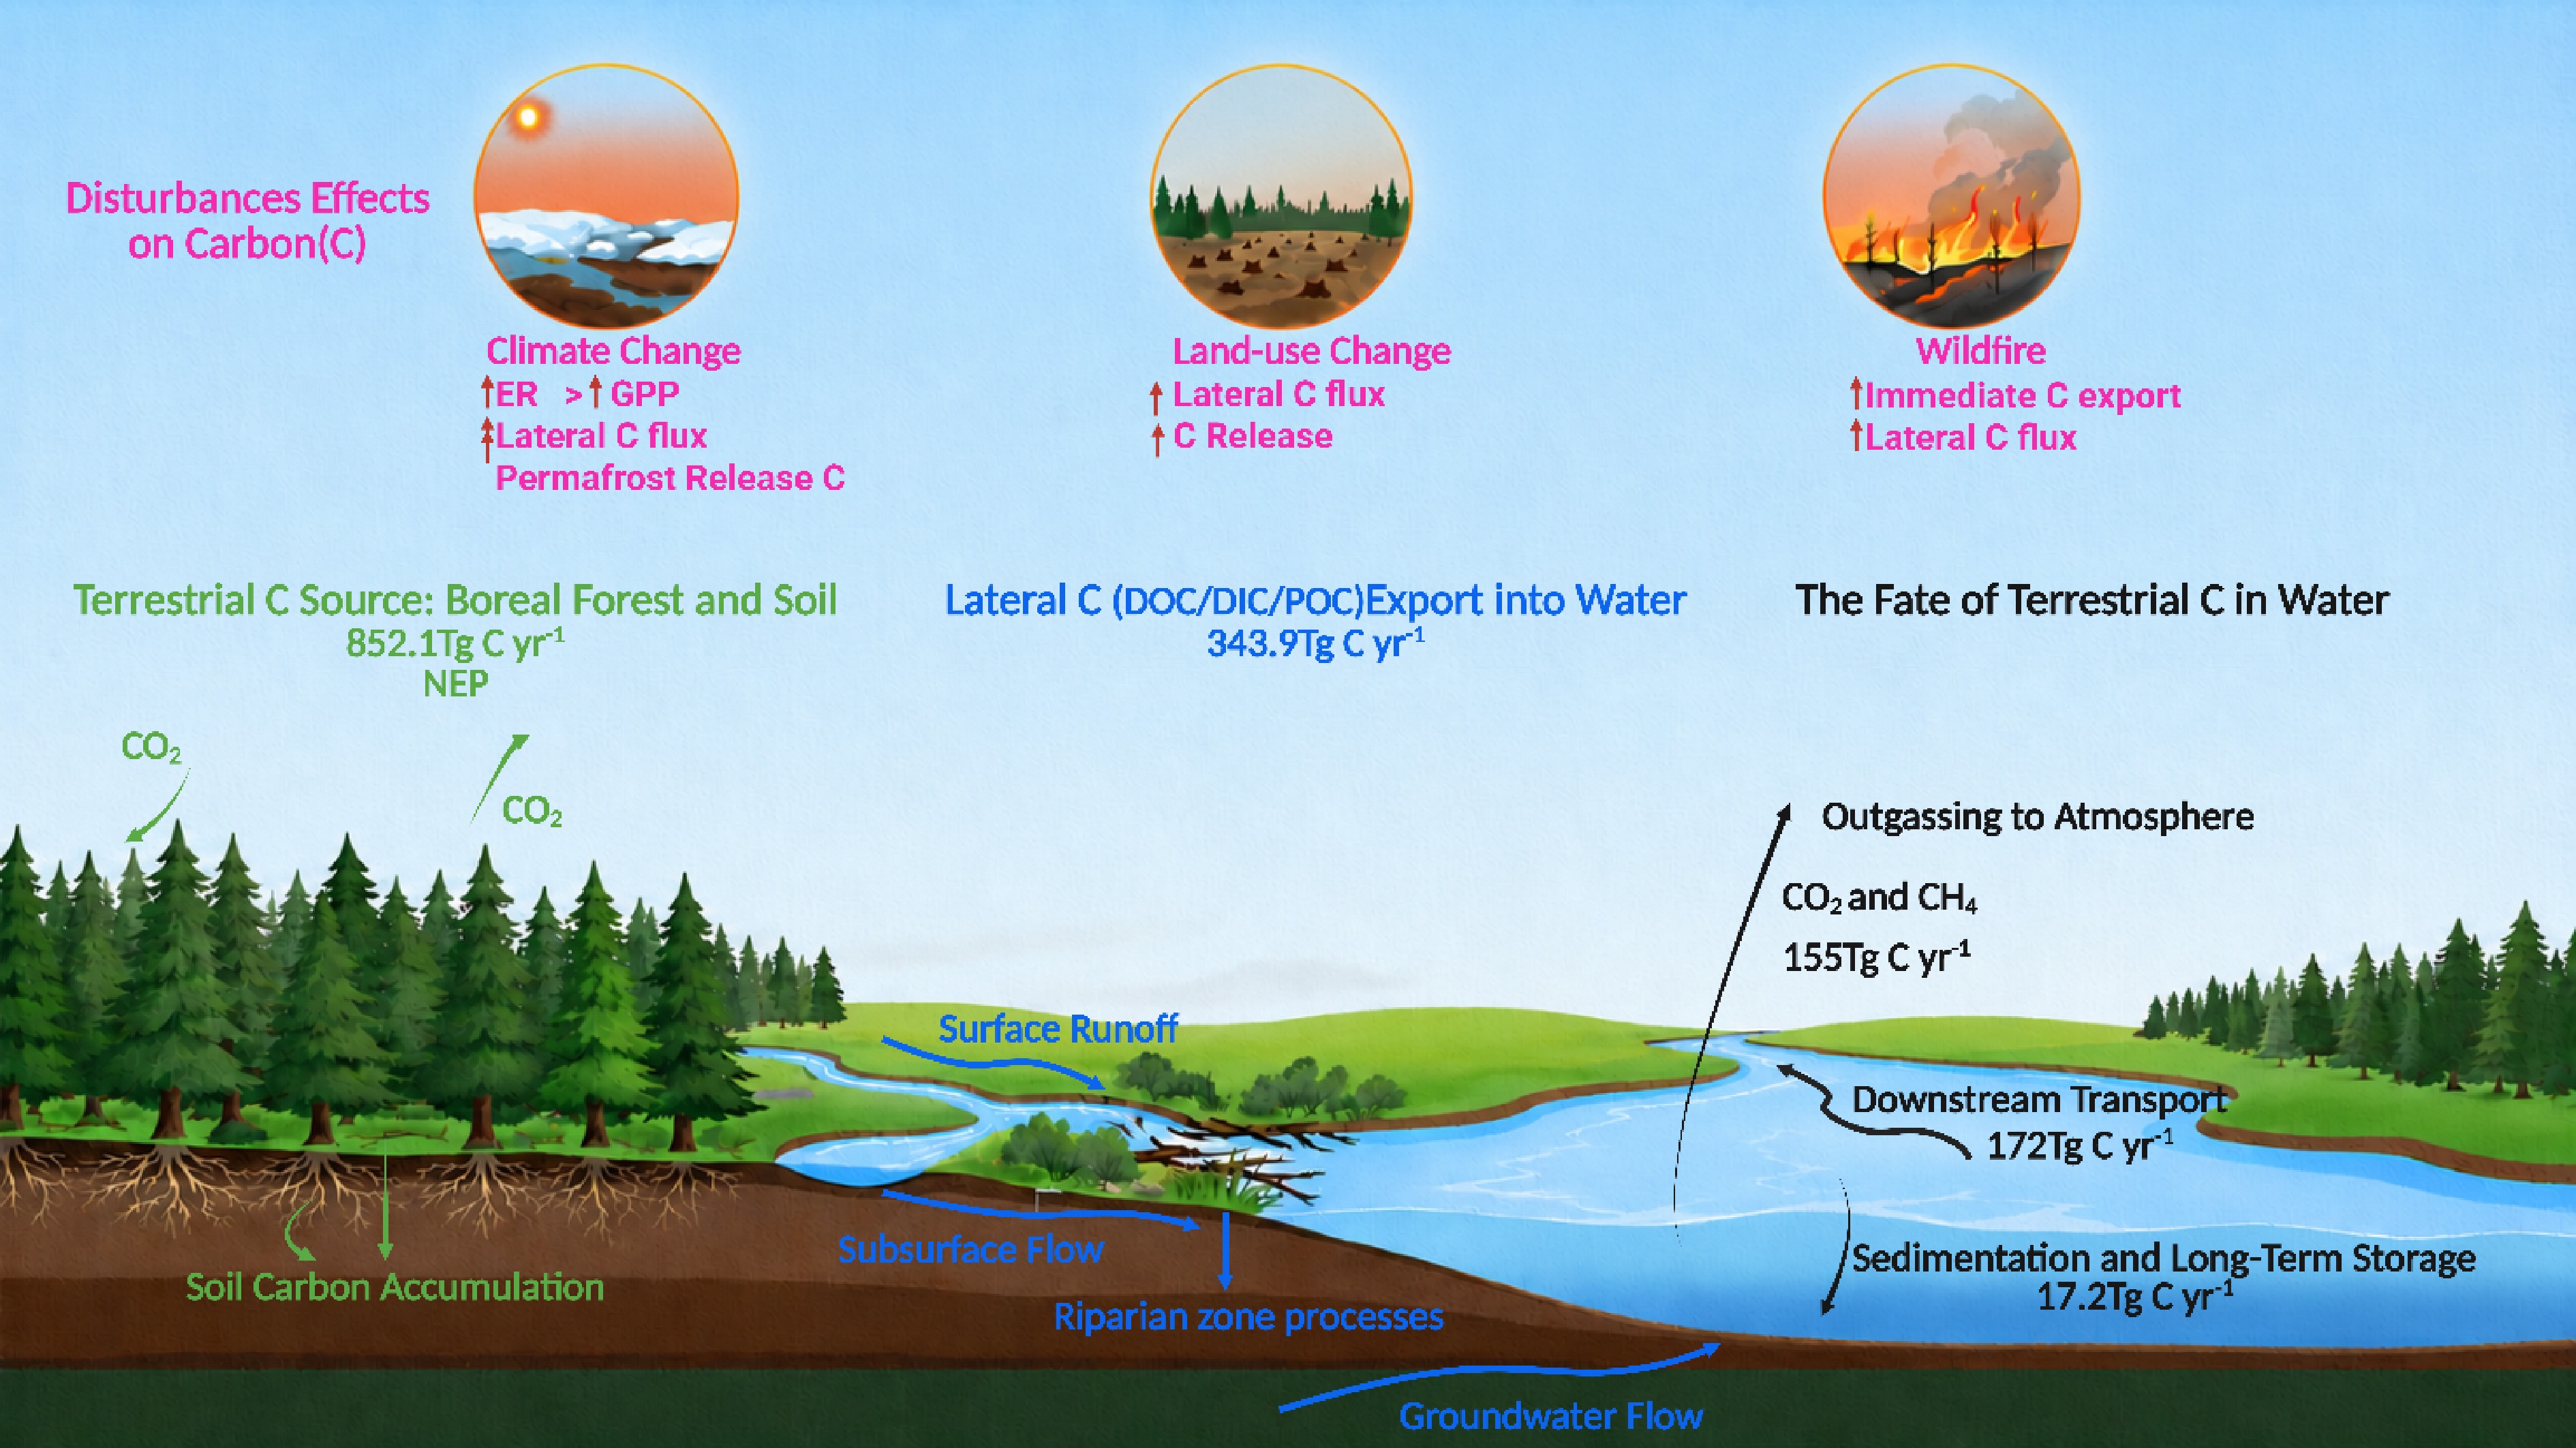
Figure 1.
A conceptual framework of this review scope. The quantity value of NEP and lateral carbon flux is calculated according to Liu et al.[9], and the outgassing value is calculated according to Jonsson et al., who stated that 45% of terrestrial export was evaded as CO2, and 50% was transported to the sea based on a boreal catchment[10]. NEP, net ecosystem productivity, represents carbon retention or storage in the ecosystems; ER, ecosystem respiration, represents carbon emissions to the atmosphere; GPP, gross primary production.
-
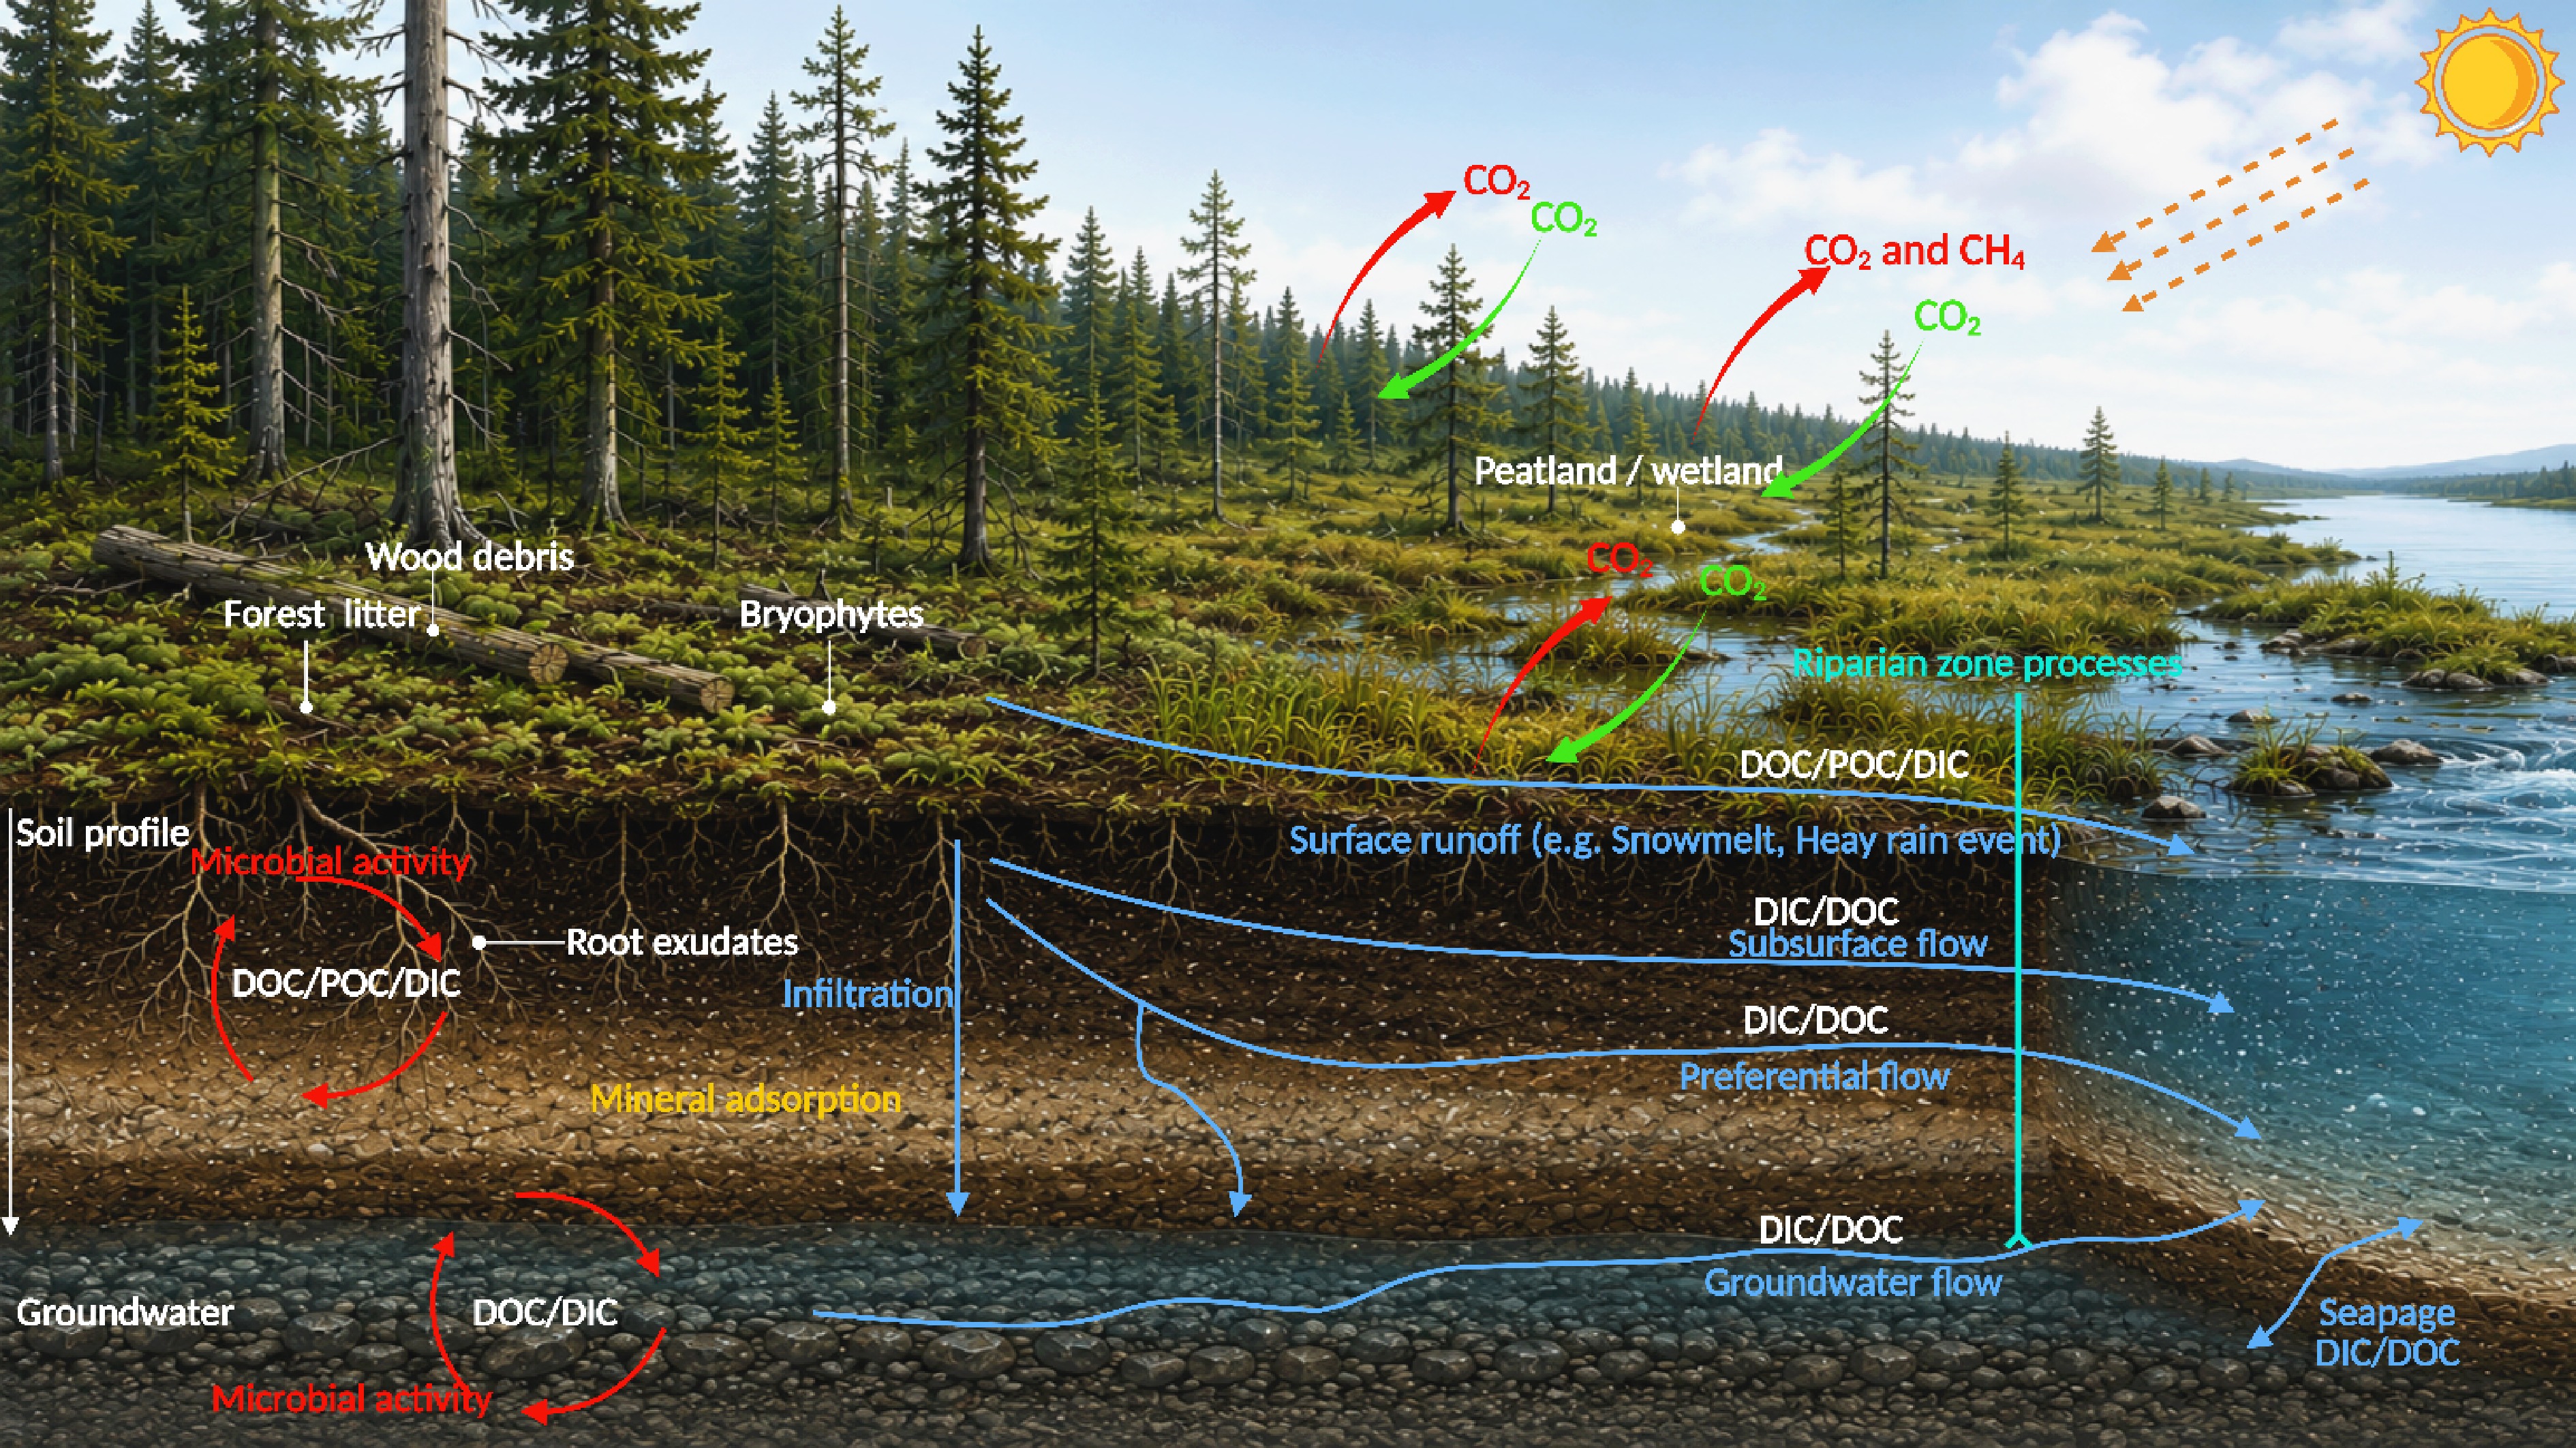
Figure 2.
Main carbon processes in terrestrial ecosystems and the pathways from land to water. These fluxes are adapted from Llanos-Paez et al.[20]. Blue arrows represent carbon flux transported into waters highly connected with water movement, green arrows represent fixed carbon in ecosystems, and red arrows mean outgassing to the atmosphere; red circles represent carbon process occurrences such as microbial activities and photochemical reactions.
-
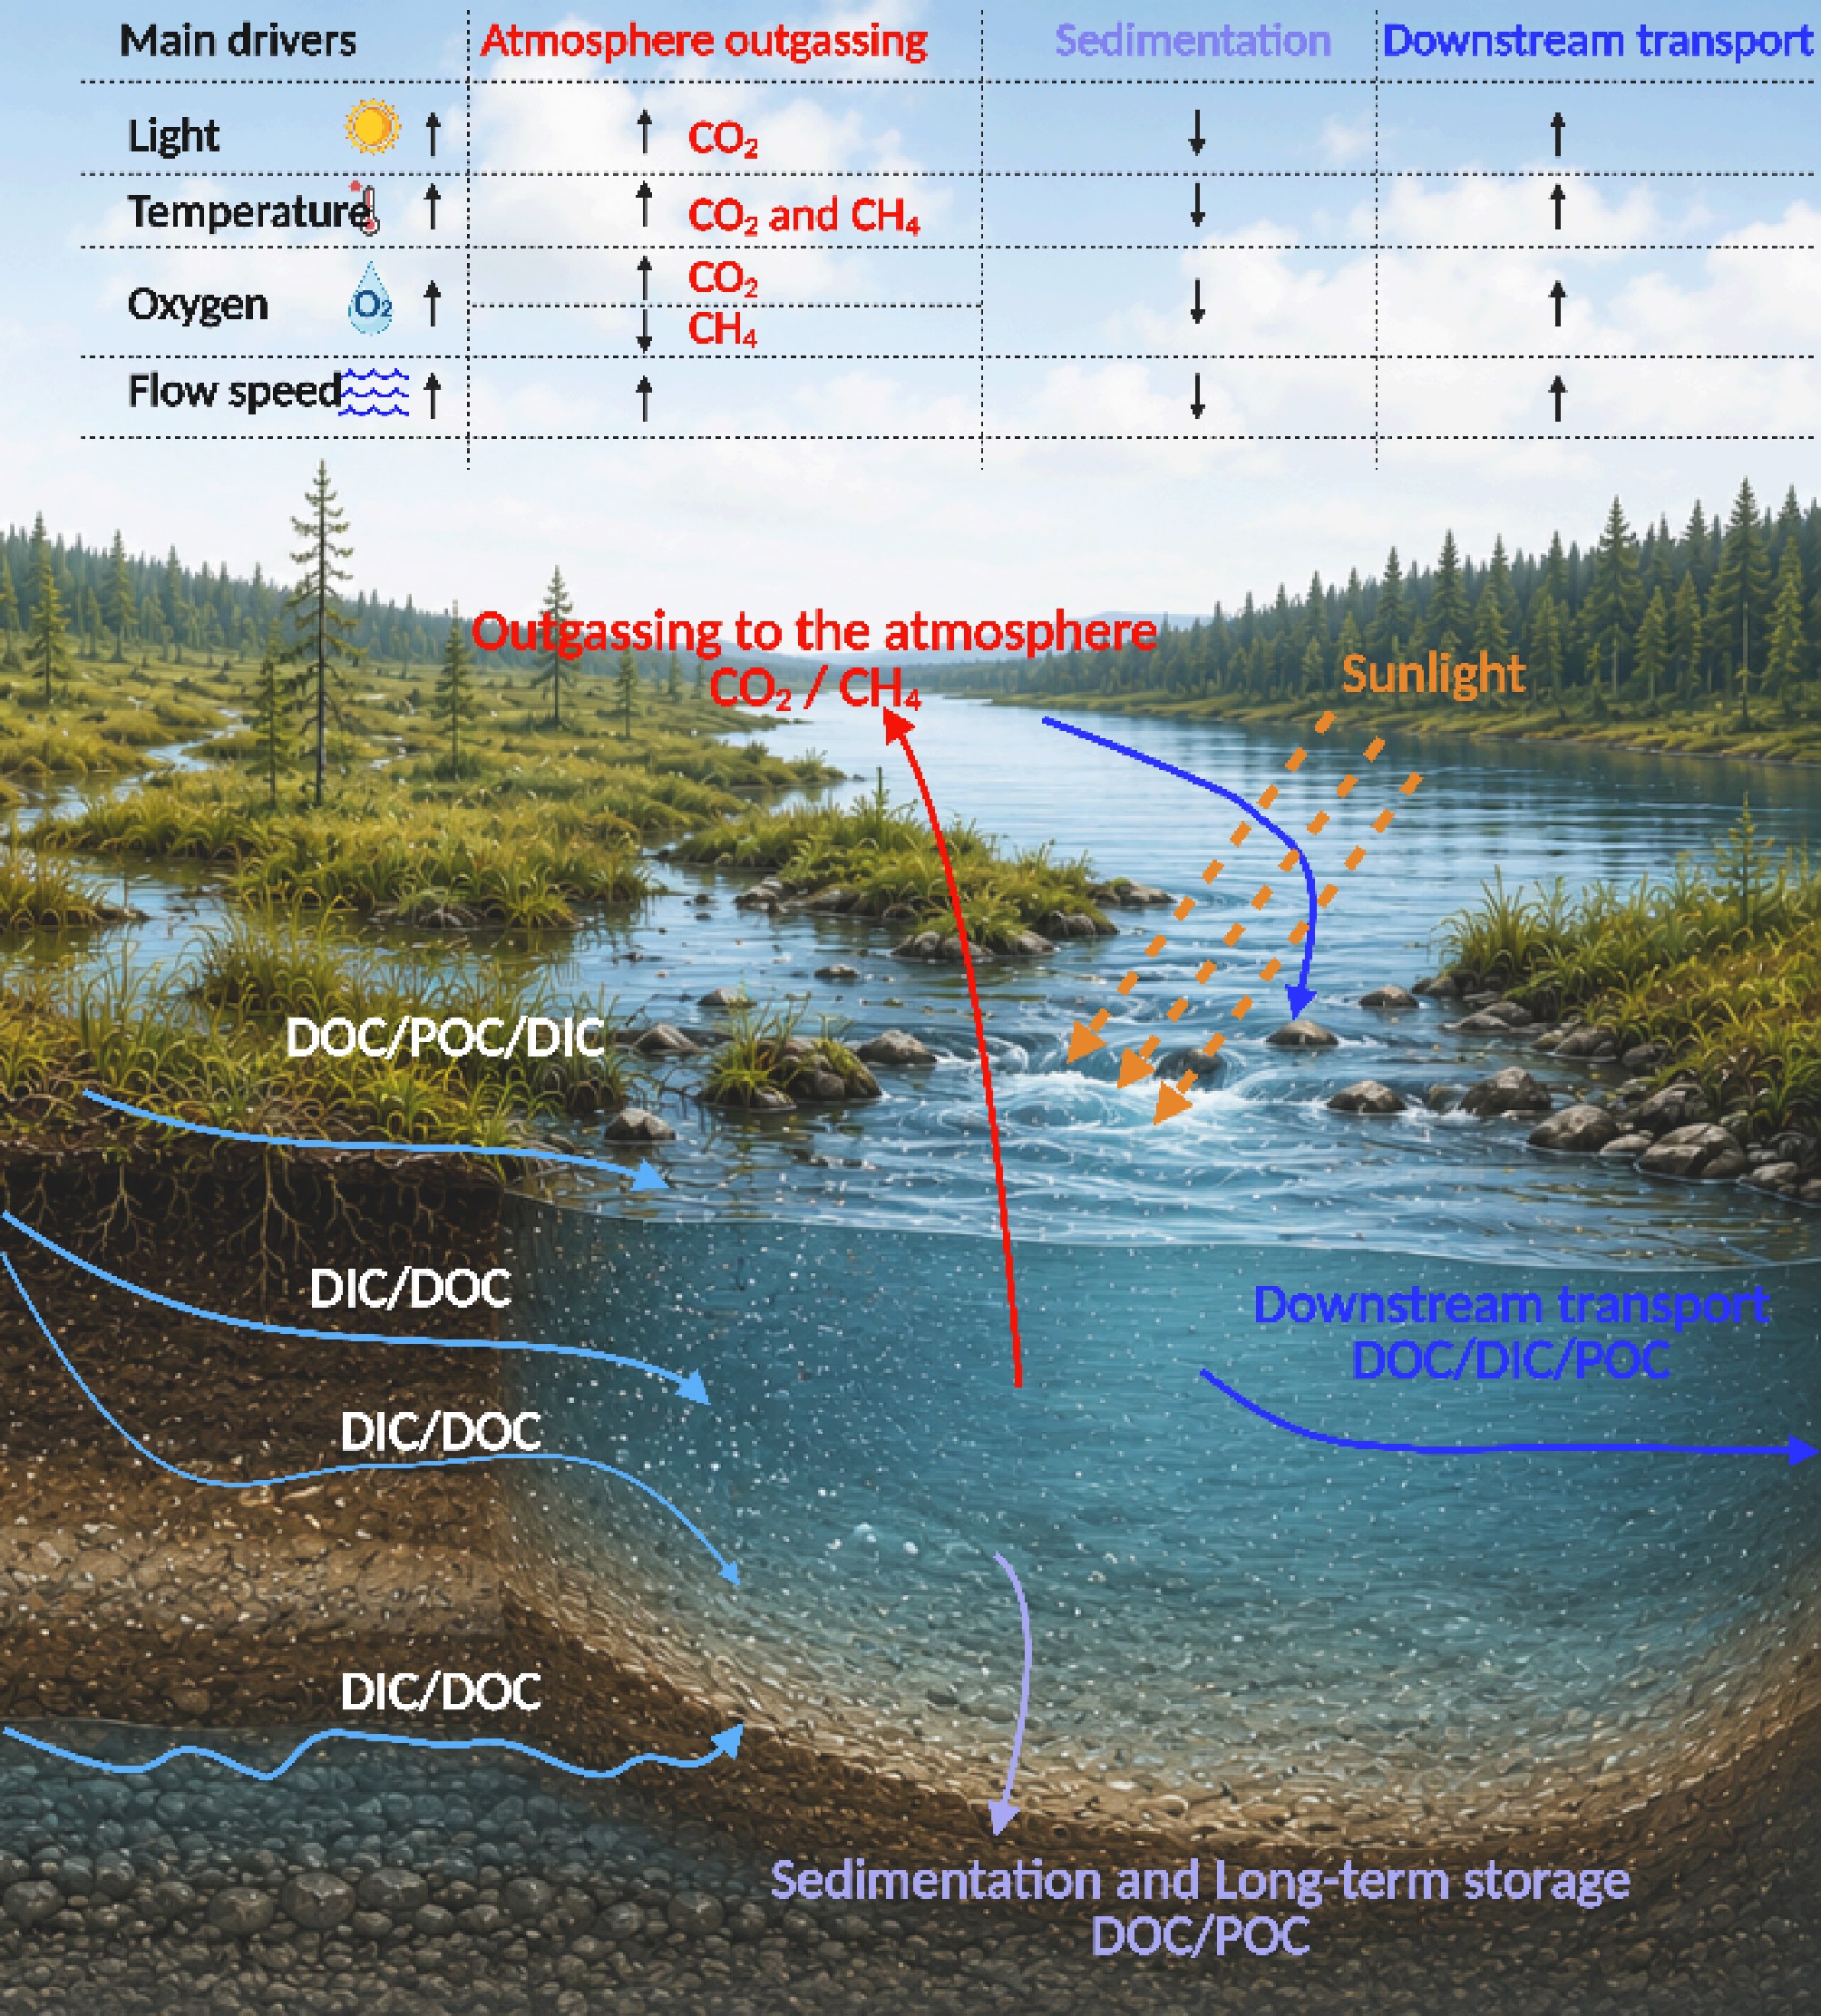
Figure 3.
Ultimate fates of terrestrial-derived carbon in aquatic systems with main drivers. Text represents terrestrial-derived carbon sources and forms; shallow blue arrows represent lateral carbon transport highly connected with hydrological conditions. These terrestrial carbons follow three fates: outgassing to the atmosphere, burial as sediment, and downstream transport, depending on the different temperature, light, oxygen, and flow speed.
-
Lateral carbon flux Sources Transport pathway DOC (40.9 Tg C yr−1) Forest floor/understory/permafrost Surface runoff/preferential flow Organic-rich topsoil/peatland *Subsurface flow Riparian zone processes Riparian zone groundwater POC (0.6–409 Tg C yr−1) Forest floor/understory/soil/riparian zone Surface runoff/preferential flow DIC (0–197.7 Tg C yr−1) Soil respiration CO2/groundwater derived Carbon Groundwater The values of lateral carbon fluxes are calculated through the related fluxes and their relationships from Liu et al.[9] estimating model, and * represents the major pathway of DOC transport. Table 1.
Summary of lateral carbon flux corresponding to dominant sources and transport pathways in boreal ecosystems.
-
Disturbance Flux pathway Key mechanism (some examples) Ref. Climate change (warming) DOC ↑ ·Shortened snowpack duration, enhancing DOC mobilization and export Bowering et al.[81] POC ↑ ·Shortened snow seasons, enhanced soil erosion, increased terrestrial litter transport
·Permafrost degradation enhanced winter POC transportStrååt et al.[82]
Liu et al.[83]DIC ↑ ·Increased soil respiration, increased DIC in groundwater Liang et al.[84]
Öquist et al.[85]CO2 ↑ ·Increasing soil respiration could elevate the atmospheric CO2 concentration Liang et al.[84] CH4 ↑ ·Increased acetate production and methanogenesis Yuan et al.[86] Land-use change DOC ↑ ·Forest harvest and site preparation increased DOC by enhancing runoff, groundwater level, and soil organic matter decomposition Schelker et al.[87] POC ↑ ·Forest harvest and soil disturbance increased soil erosion, further increasing POC Hatten et al.[88] DIC ↔ ·Peatland drainage did not affect lateral DIC due to increased runoff Rantakari et al.[89] CO2 ↑ ·Forestry drainage lowered the water table, increased respiration rates, and reduced net CO2 uptake Laine et al.[75] CH4 ↓ ·Lower water tables suppressed methanogenesis and reduced CH4 emission Laine et al.[75] Wildfire DOC↑ ·DOM appeared less bioavailable for microbial degradation
·Post-wildfire enhances surface runoff during intense precipitationMatula et al.[78]
Polack et al.[76]POC↑ ·Fire caused erosion and hydrological change Hatten et al.[88] DIC↓ ·Lower DIC input from altered pathways and post-fire biogeochemical changes Richardson et al.[90] CO2↑ ·Reduced photosynthetic carbon uptake, and transiently enhanced ecosystem respiration Hermesdorf et al.[91] CH4↓ ·Methanogenesis was limited following fire Davidson et al.[92] ↑ represents an increase, ↓ represents a decrease, ↔ represents no change. DOC, POC, DIC represent lateral carbon flux from land to water; CO2 and CH4 represent vertical carbon flux from terrestrial ecosystem to atmosphere. We present some cases to interpret the effects of disturbance, not covering every situation. Table 2.
Comparison of disturbance effects on lateral and vertical carbon flux.
Figures
(3)
Tables
(2)