-
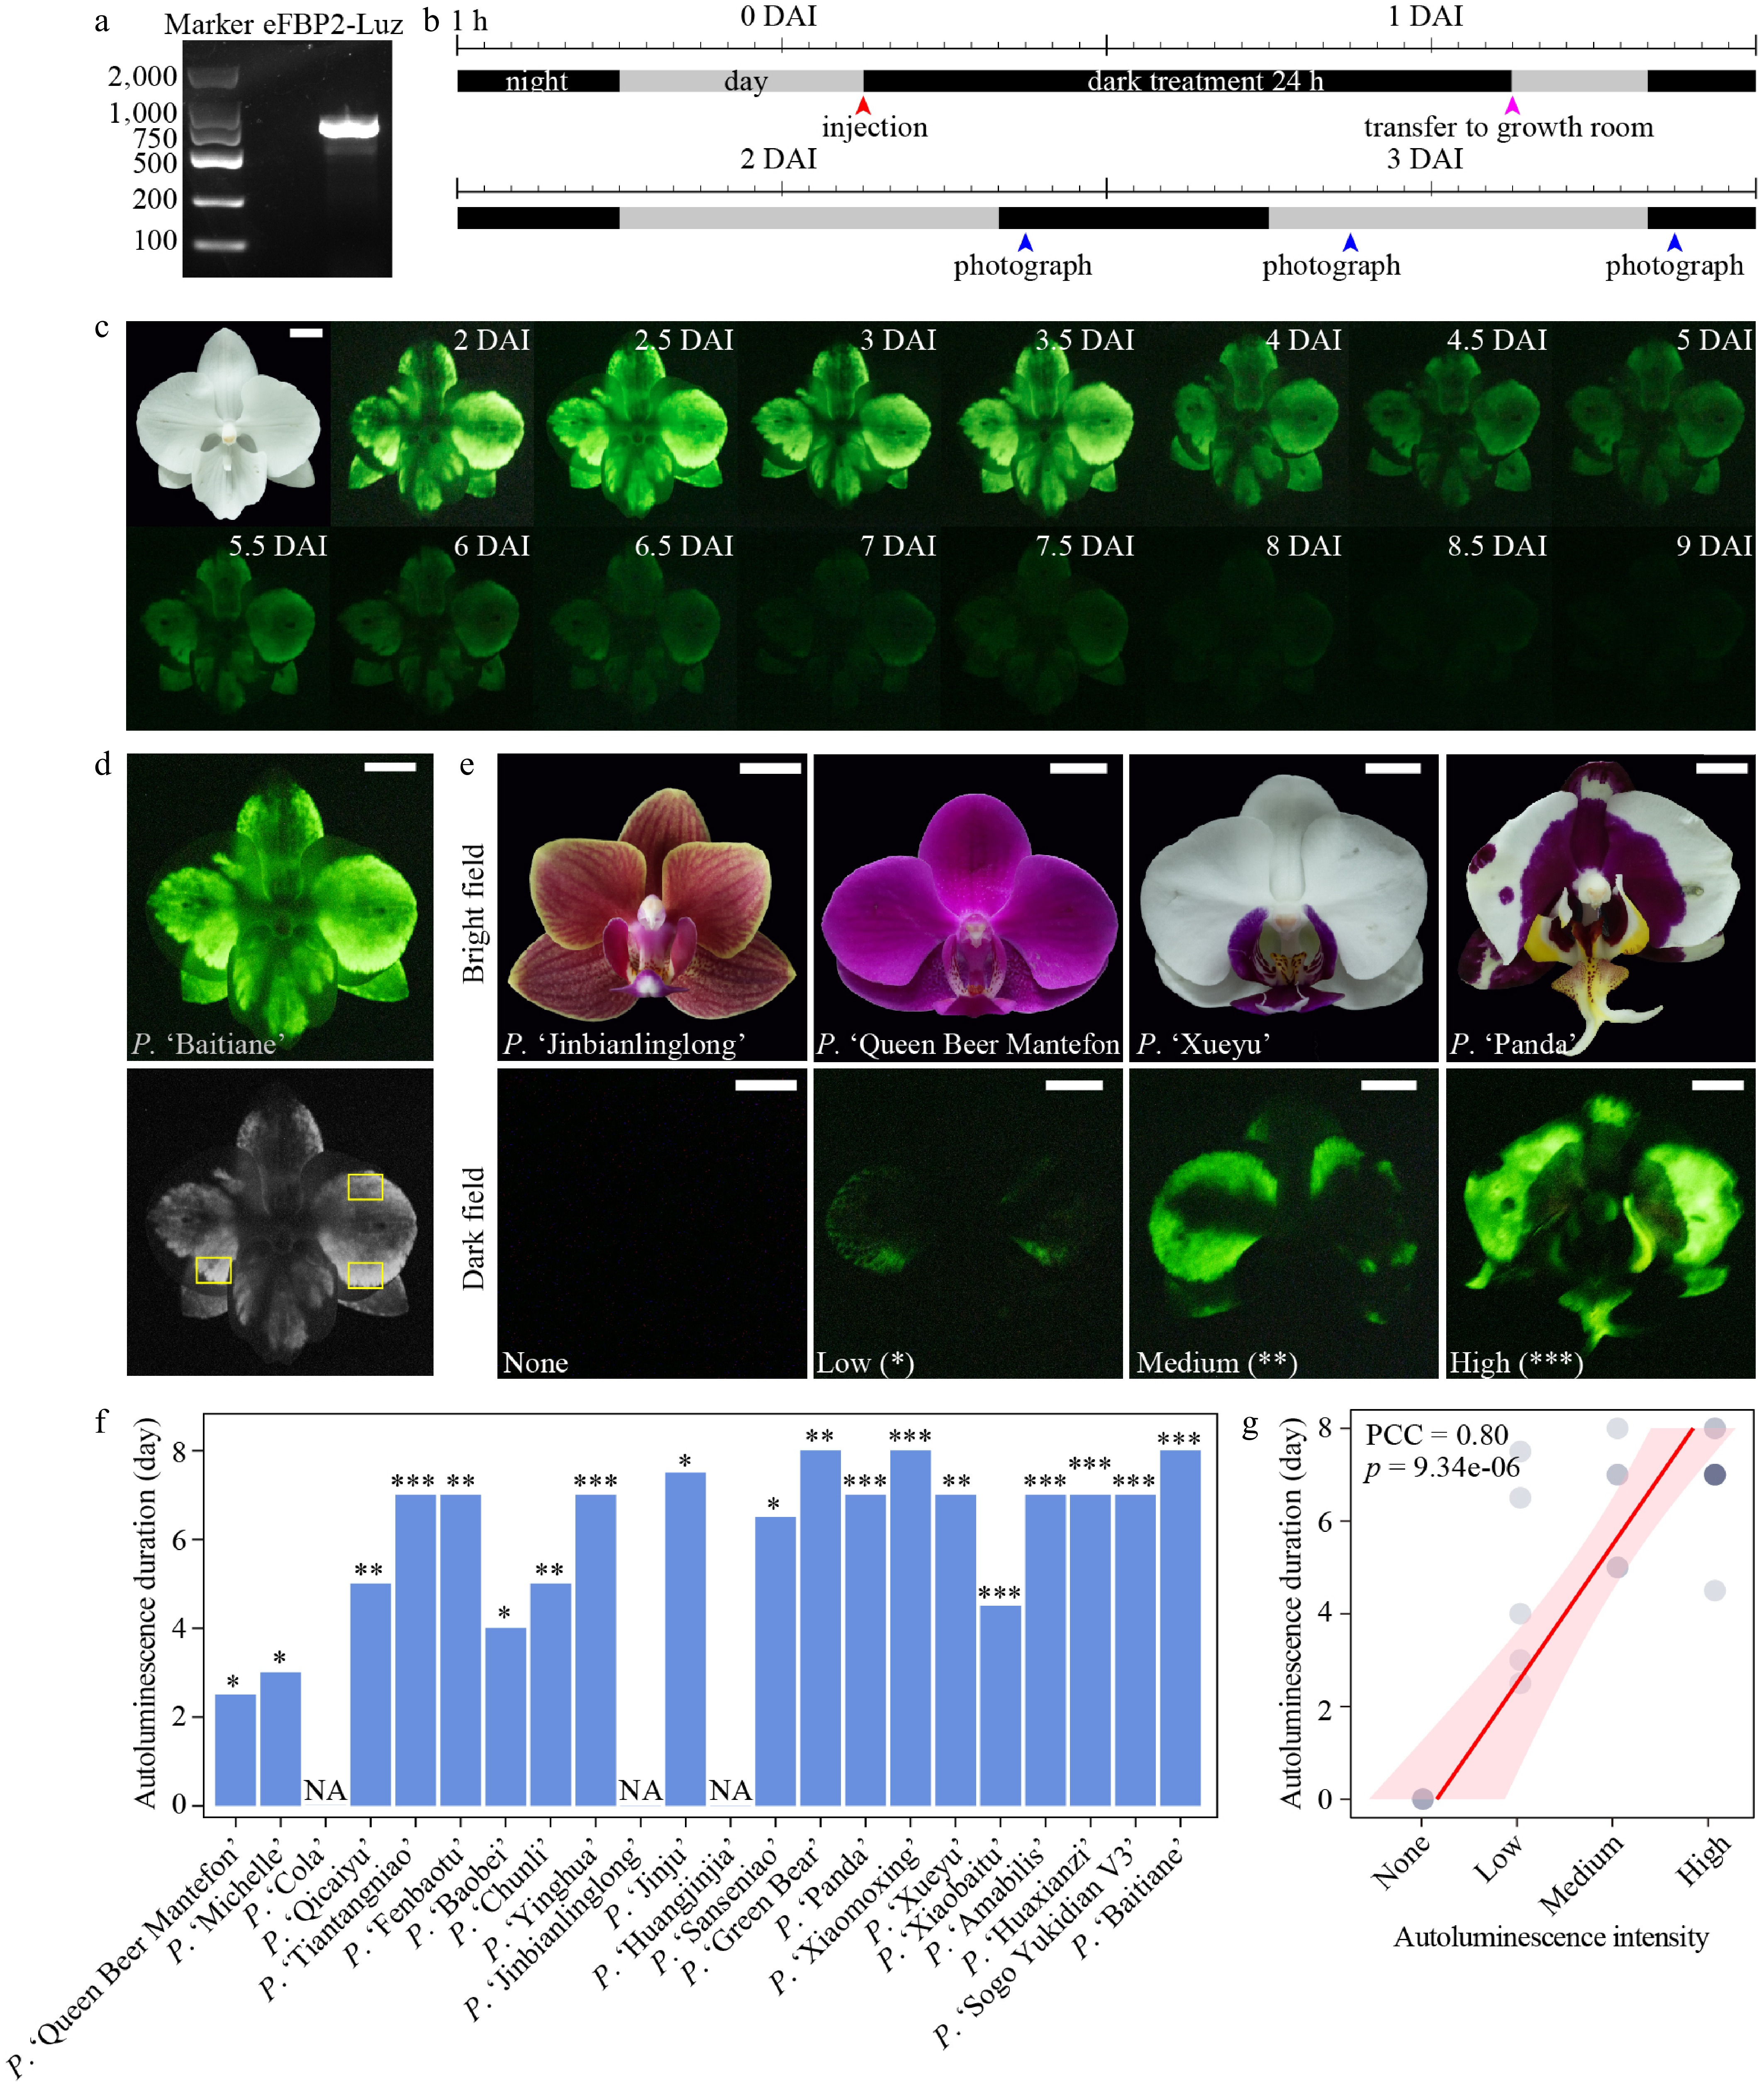
Figure 1.
Measure of autoluminescence characteristics. (a) Gel electrophoresis image showing the PCR production of eFBP2-Luz. (b) Schematic timeline illustrating the schedule of the injection of eFBP2-containing inoculation solution, dark treatment, transfer to growth room, and photography. DAI: day after injection. (c) Bright-field image of P. 'Baitiane', and dark-field images taken every 12 h after eFBP2 transient transformation. (d) The dark-field image of P. 'Baitiane' and its corresponding grayscale image. Three yellow rectangles indicate the brightest regions measured for the grayscale values. (e) Bright- and dark-field images of four cultivars, representing those with no, low, medium, and high autoluminescence, respectively. (f) Autoluminescence duration of 22 Phalaenopsis cultivars. Asterisk above each bar denotes the autoluminescence intensity of the corresponding cultivar: low (*), medium (**), and high (***). NA: not applicable. (g) Correlation between autoluminescence intensity and duration. PCC: Pearson correlation coefficient. Scale bar: 1 cm.
-
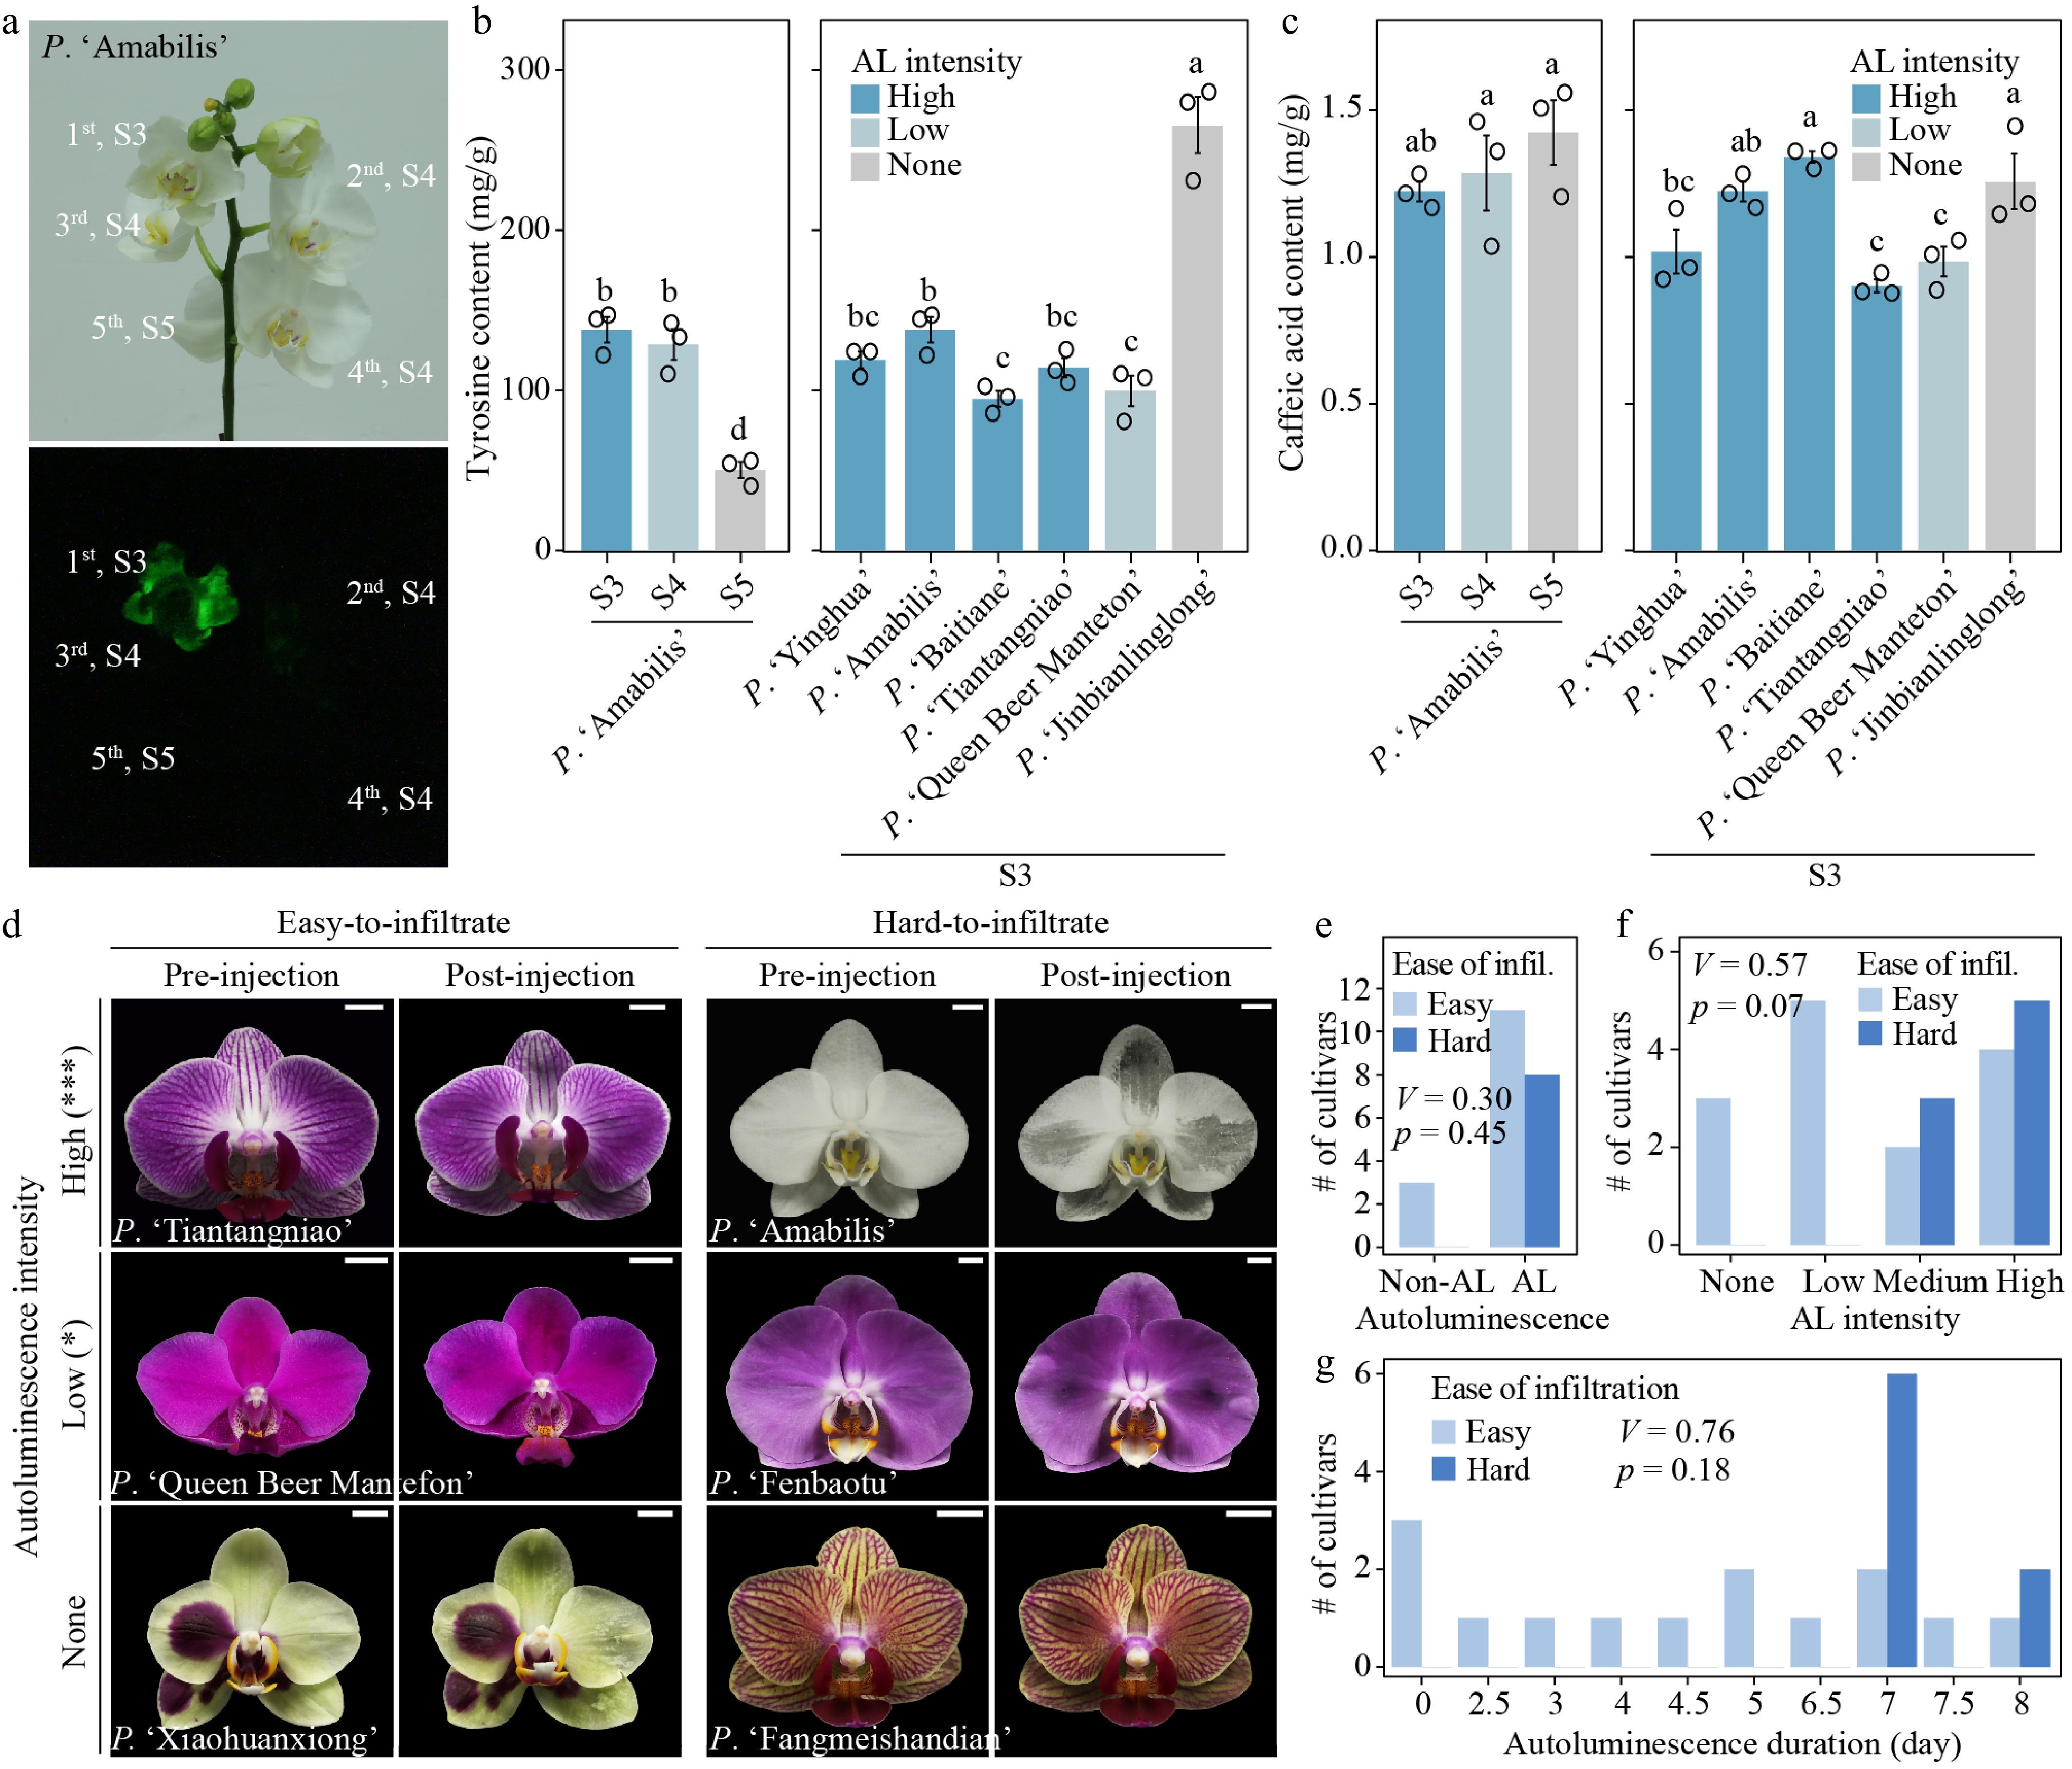
Figure 2.
Limited influences of caffeic acid and tyrosine content and the ease of infiltration on autoluminescence characteristics. (a) Bright-field (upper) and corresponding dark-field (lower) images of P. 'Amabilis' inflorescence, illustrating the position-dependent autoluminescence after eFBP2 transformation. (b), (c) The tyrosine and caffeic acid content in petals of six cultivars at stages S3, S4, and S5. Error bars: ± standard deviation (n = 3). Different lowercase letters indicate significant differences between groups (ANOVA, p < 0.05). (d) Images of six cultivars—with no (None), low (*) or high (***) autoluminescence intensity—before and after being injected with eFBP2-containing inoculation solution, showing differences in the ease of liquid infiltration into floral tissues. Results of the remaining 19 cultivars were shown in Supplementary Fig. S7. Scale bar: 1 cm. (e)–(g) Correlation between the ease of infiltration and autoluminescence capability (e), intensity (f), duration (g). AL: autoluminescence; V: Cramér's V; p: p value of Chi-square test.
-
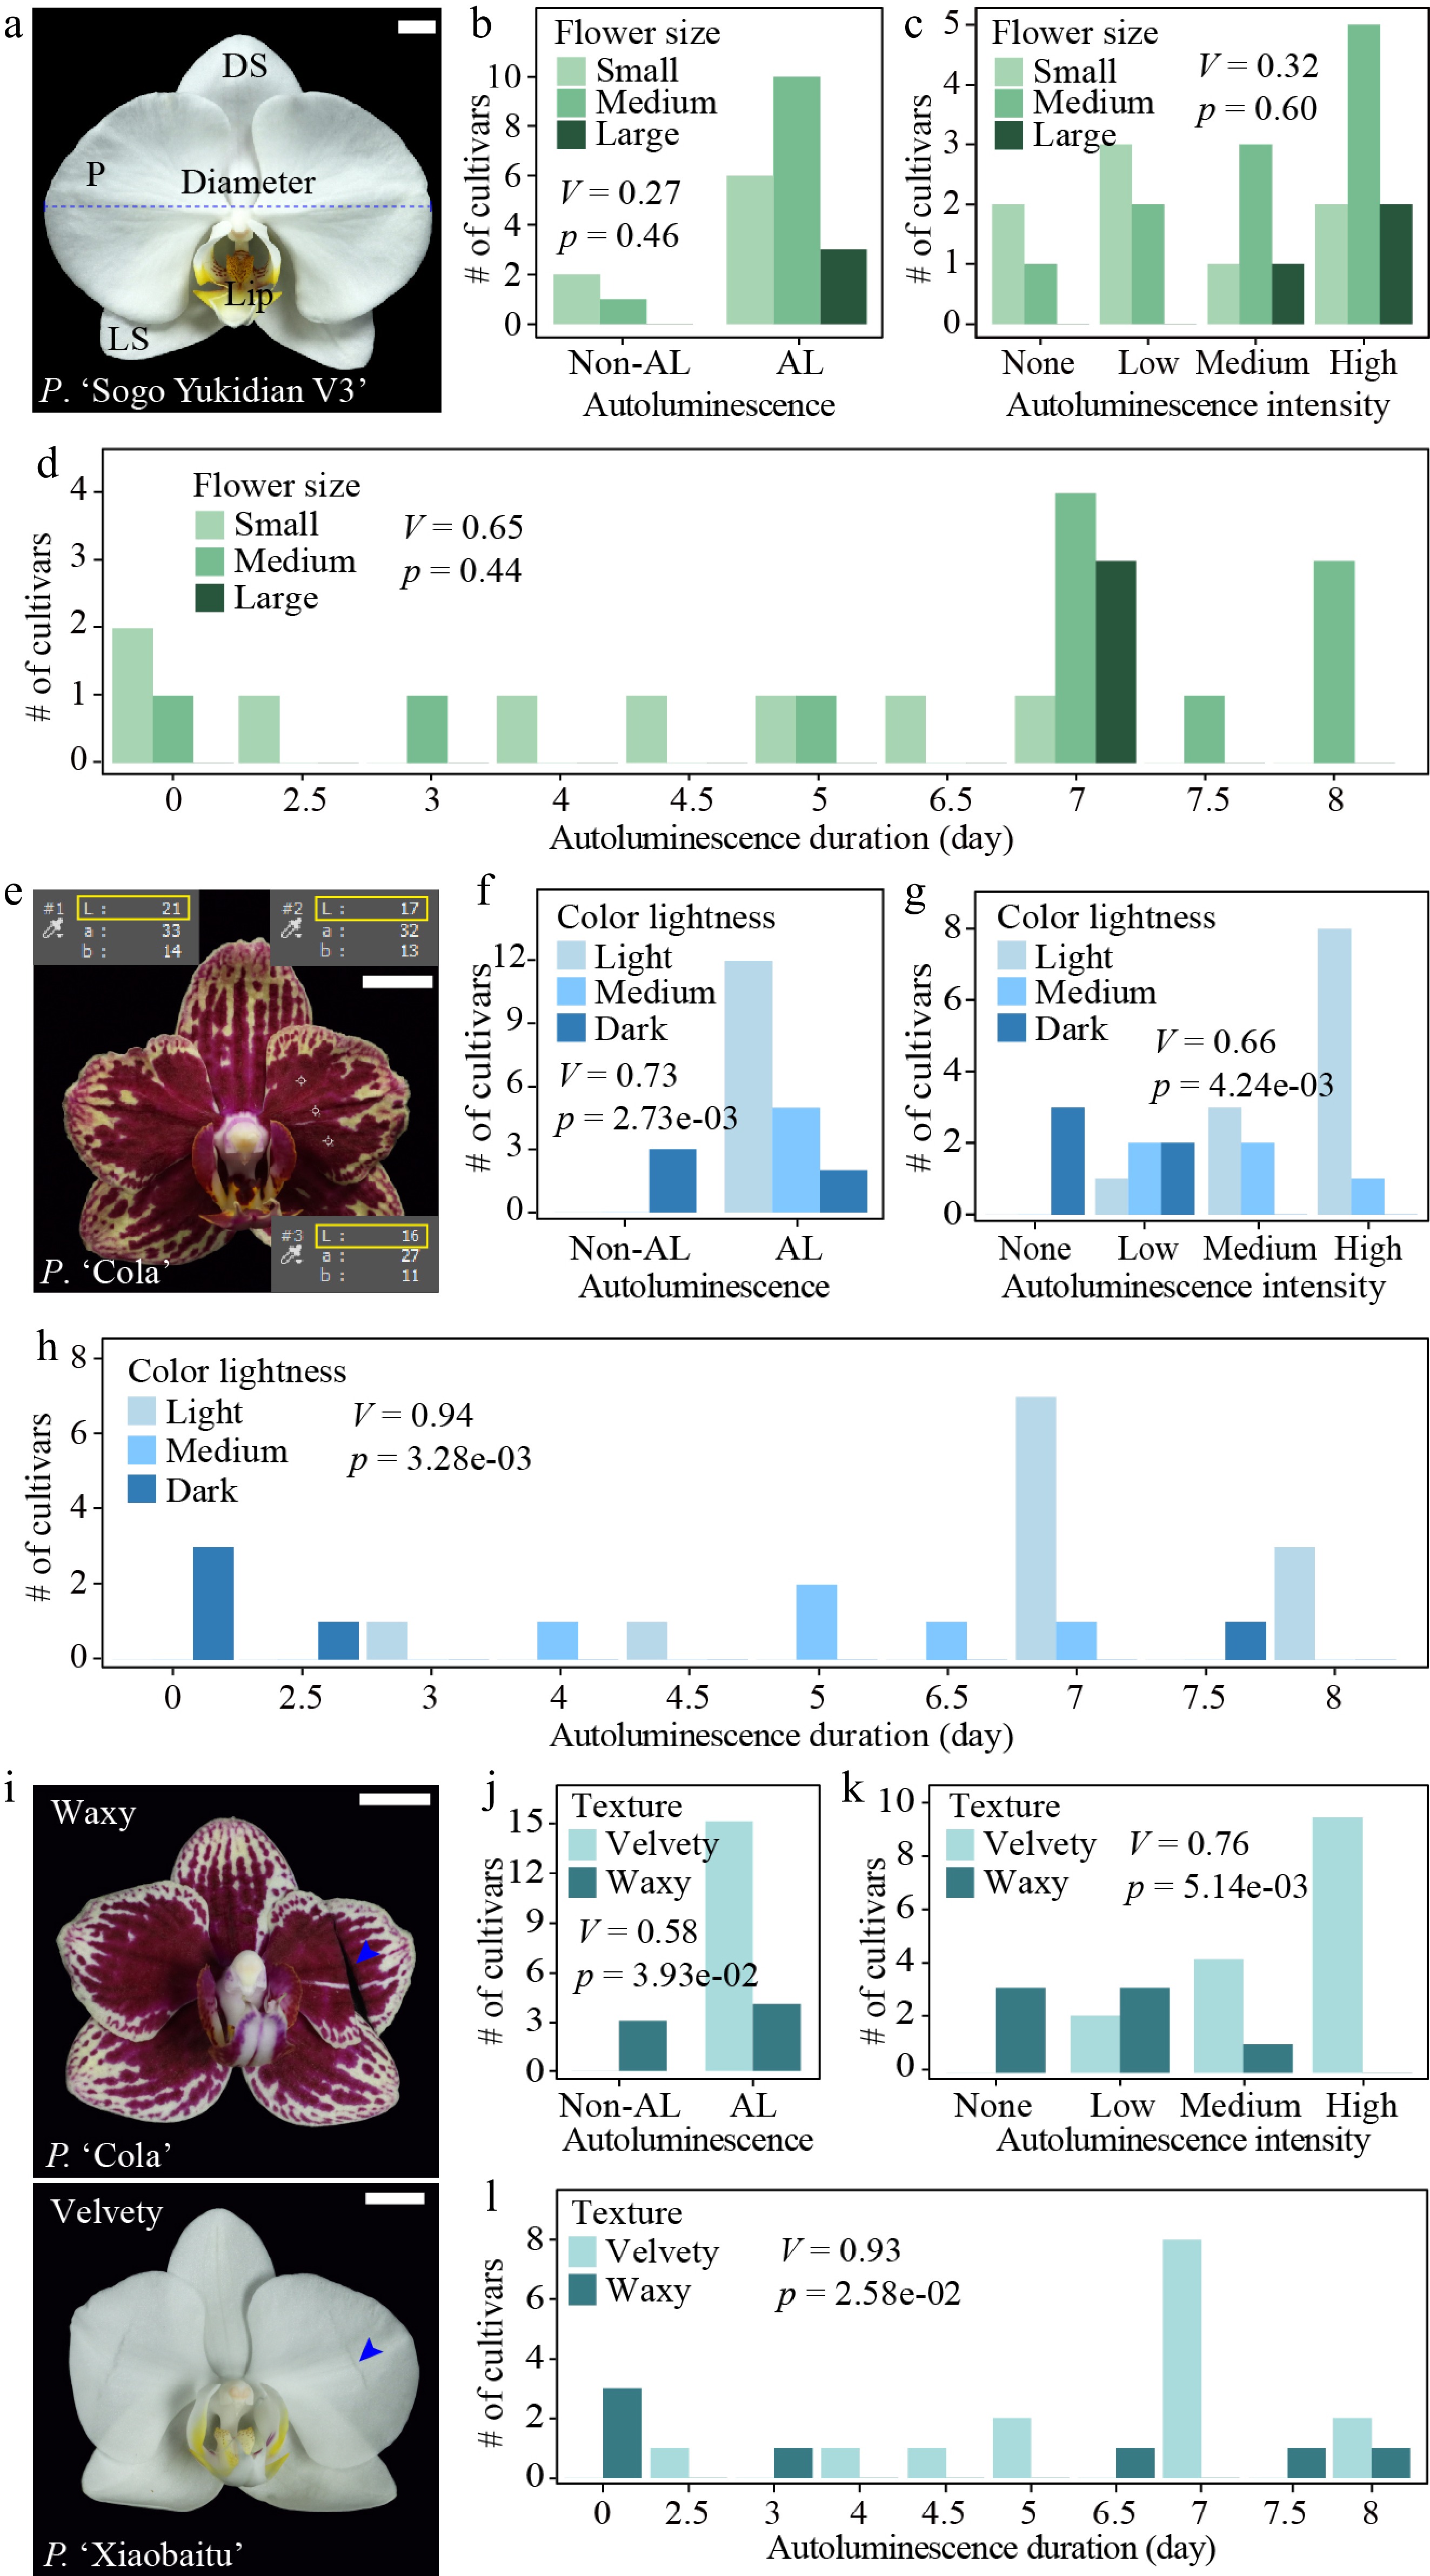
Figure 3.
Correlation between autoluminescence characteristics and three floral traits. (a) Image of P. 'Sogo Yukidian V3' showing how the flower diameter (flower size) is measured. DS: dorsal sepal; P: petal; LS: lateral sepal. (b)–(d) Correlation between the autoluminescence characteristics and flower sizes. (e) Image of P. 'Cola' showing the measurement of color lightness (L) of three representative regions on its petals. (f)–(h) Correlation between the autoluminescence characteristics and color lightness of petals. (i) Images of P. 'Cola' and P. 'Xiaobaitu' after gentle folding, illustrating cultivars with waxy and velvety petals, respectively. (j)–(l) Correlation between the autoluminescence characteristics and texture of floral organs. AL: autoluminescence; V: Cramér's V; p: p value of Chi-square test. Scale bar: 1 cm.
-
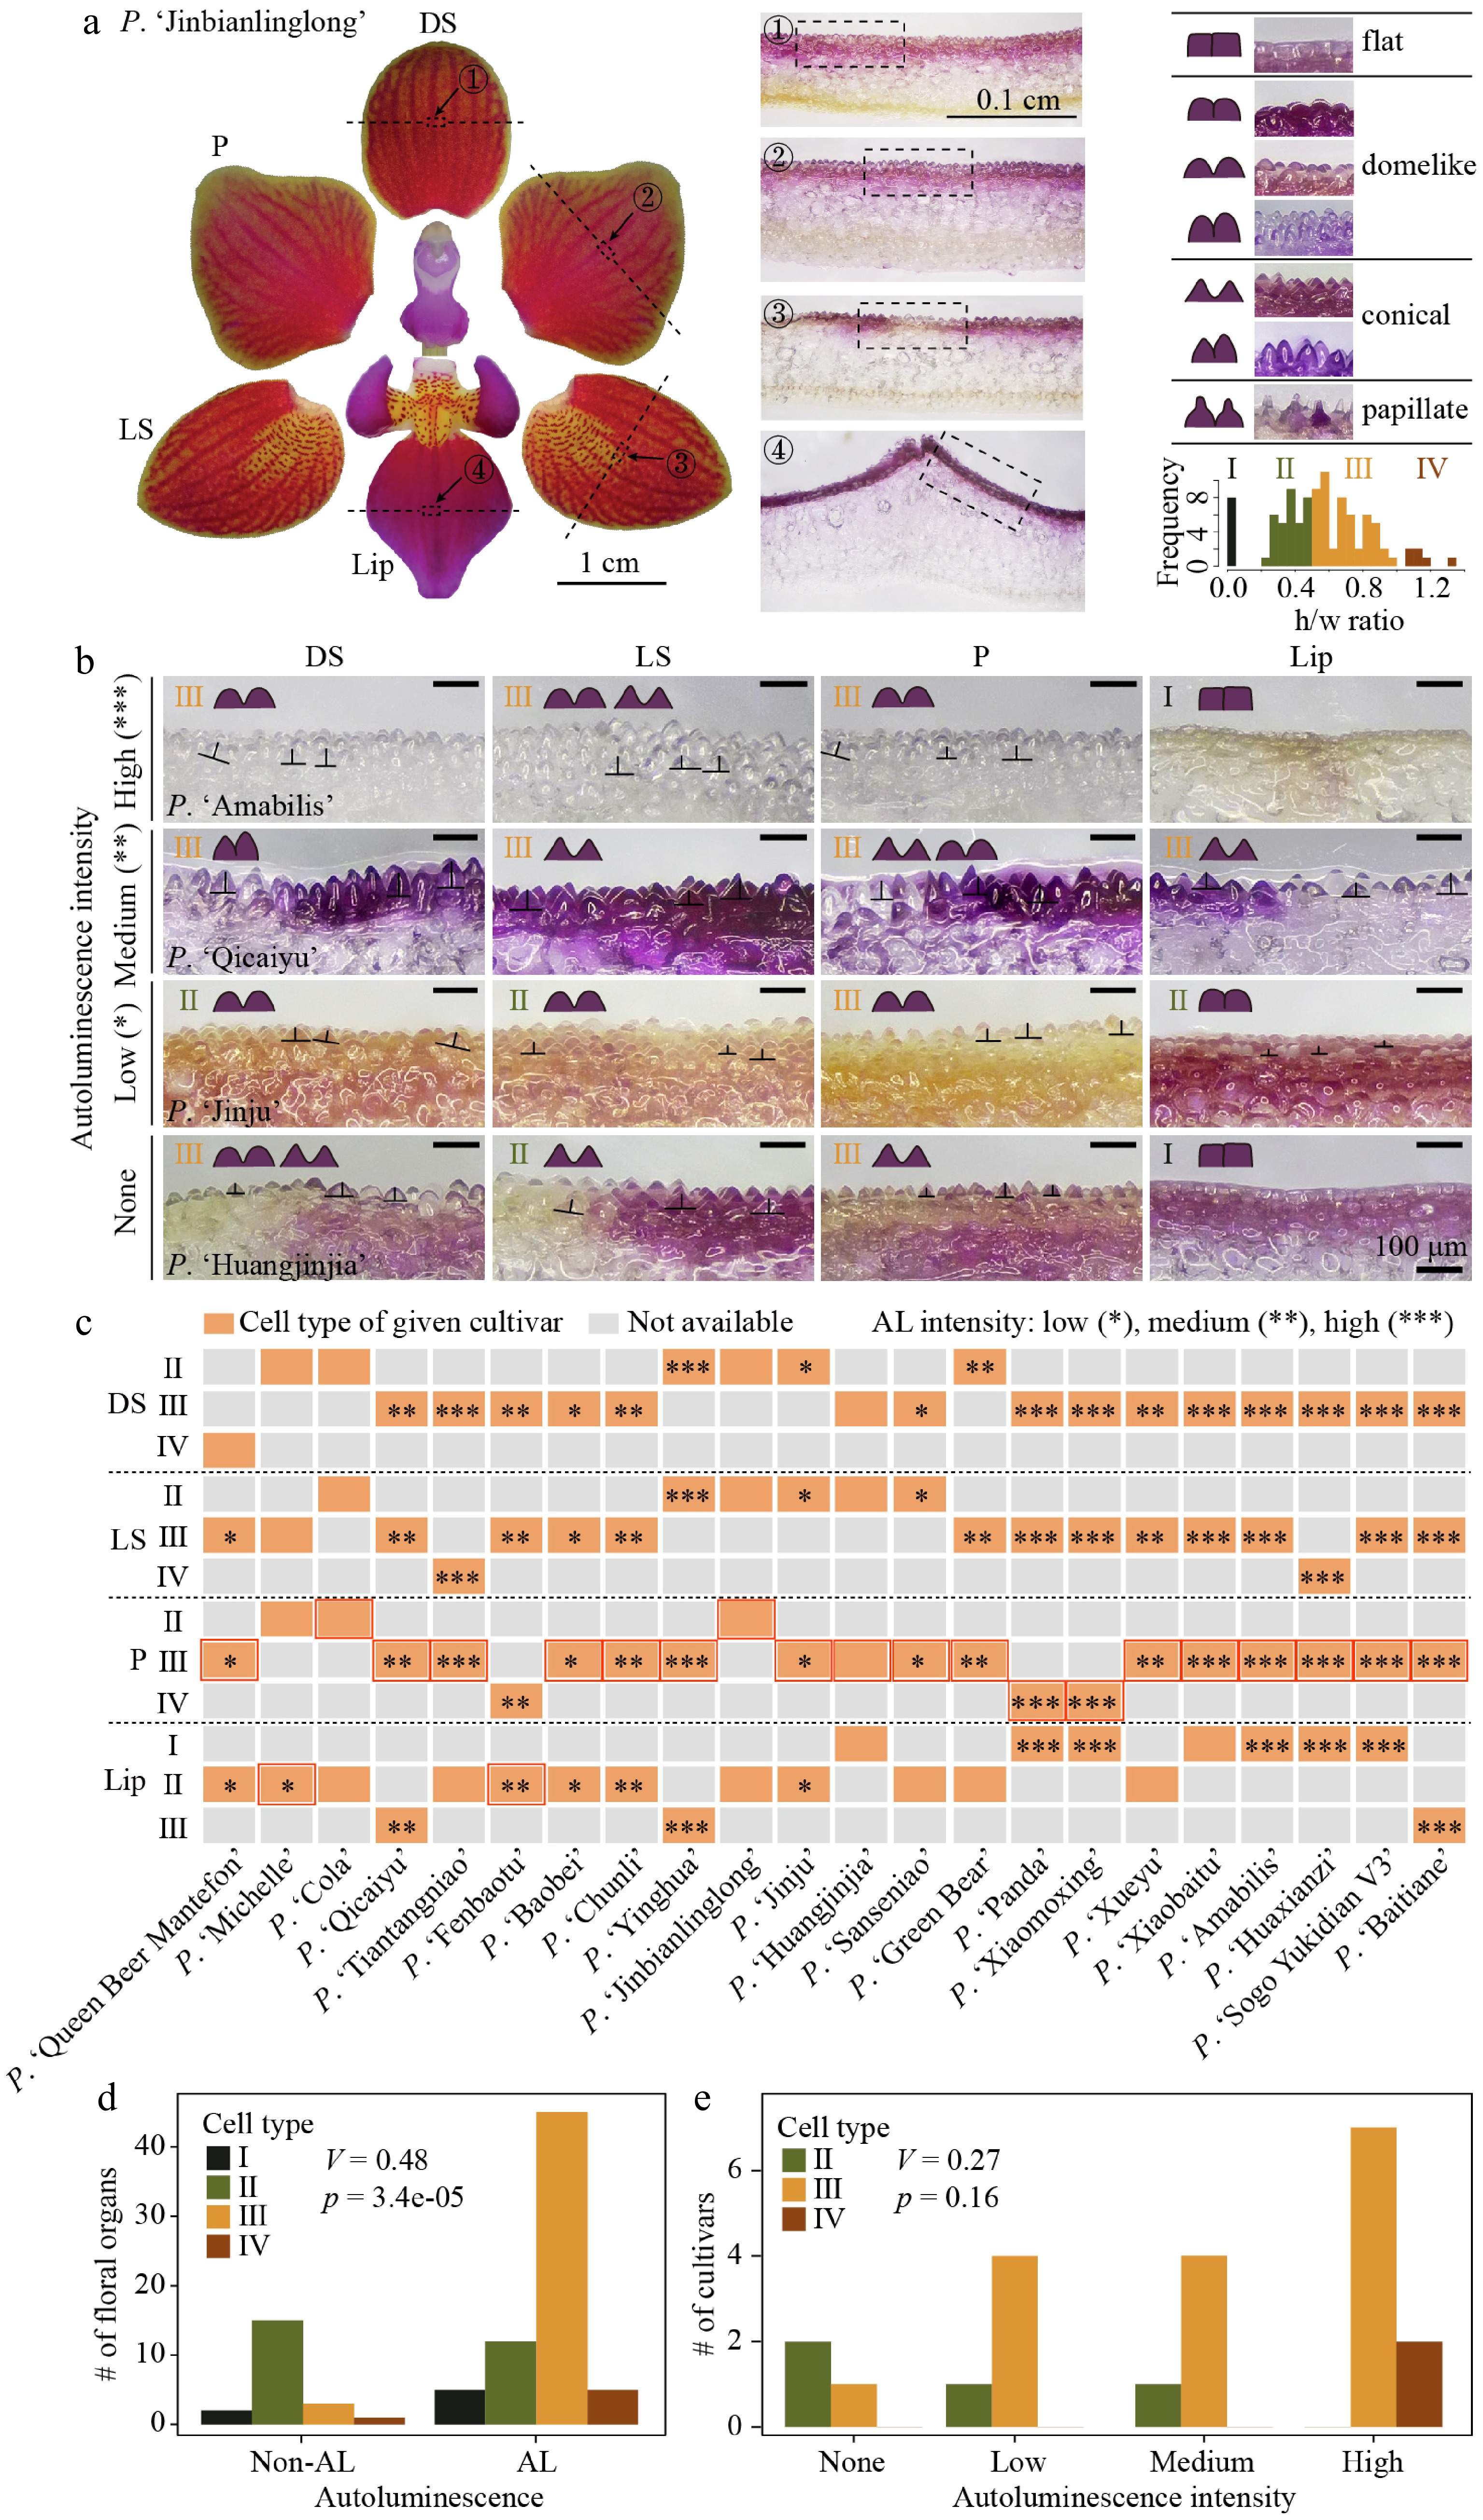
Figure 4.
Correlation between autoluminescence characteristics and epidermal cell types of floral organs. (a) P. 'Jinbianlinglong' floral organ images showing positions of transverse sections (dash lines) and the locations of epidermal cells examined. Scale bar: 1 cm for the organ images and 1 mm for the transverse section images. (b) Images of floral organ epidermal cells from four cultivars exhibiting no (None), low (*), medium (**), and high (***) autoluminescence intensity, respectively. Seven epidermal cell types are illustrated above. The classification of cells into four categories (types I–IV) based on their average height/width ratios (n = 3) was shown as well. Scale bar: 100 μm. Results of the remaining 21 cultivars were shown in Supplementary Fig. S9. (c) Distribution of epidermal cell types on different floral organs of 22 cultivars. Results of the remaining three cultivars were shown in Supplementary Fig. S5o. Orange rectangle: the cell type of the floral organ in a given cultivar. Rectangles with *, **, and *** indicate organs with low, medium, and high autoluminescence intensity, respectively. DS, dorsal sepal; LS, lateral sepal; P, petal. A red rectangle indicates the floral organ with the highest autoluminescence intensity per flower, or the petal if the cultivar was not autoluminescent. (d) Correlation between autoluminescence capability and epidermal cell types in all floral organs. (e) Correlation between autoluminescence intensity and cell types in the representative floral organ with the highest intensity per cultivar. V: Cramér's V; p: p value of Chi-square test.
-
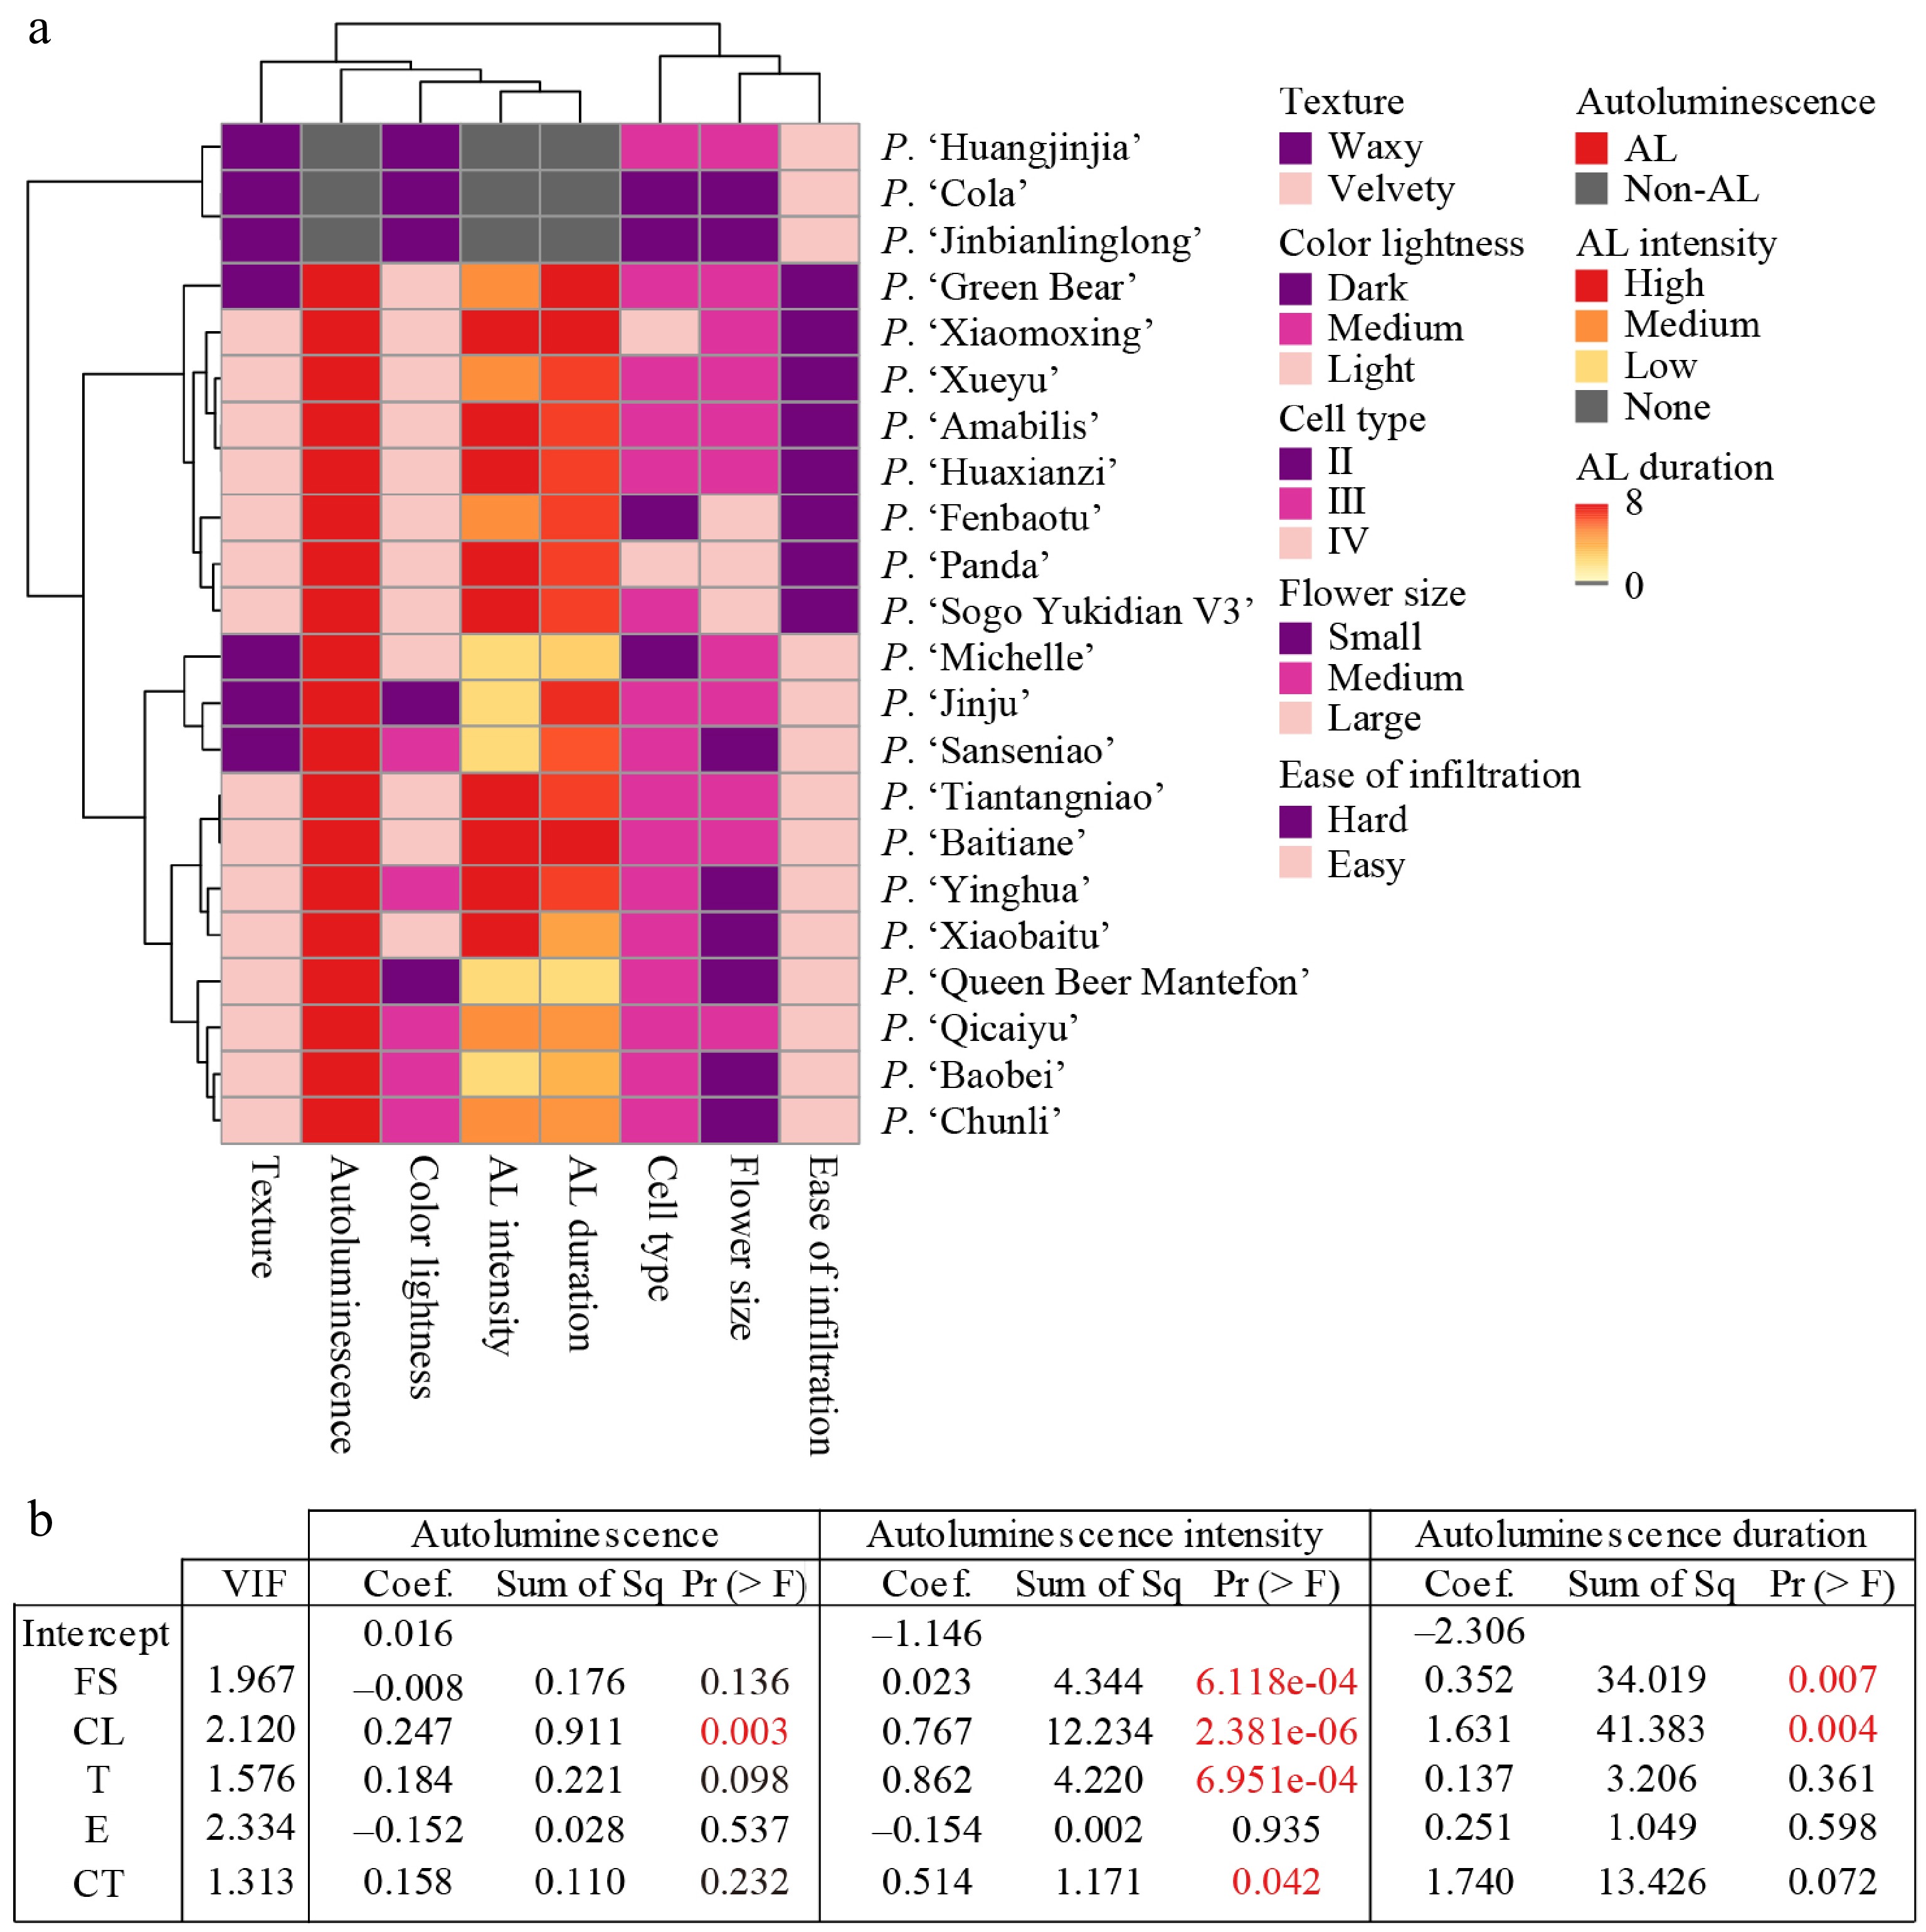
Figure 5.
Prediction of autoluminescence characteristics using floral traits. (a) Clustering heatmap among autoluminescence characteristics and floral traits of 22 Phalaenopsis cultivars. Color scale: corresponding categories or values of different autoluminescence characteristics and floral traits, as illustrated in the legend. (b) Regression models for three autoluminescence characteristics. Sum of Sq: the additional explained variation in autoluminescence characteristics when a given floral trait was added to the regression models. AL: autoluminescence; FS: flower size; CL: color lightness; T: texture of floral organs; E: ease of infiltration; CT: cell type on the representative floral organ, as indicated in Fig. 4c; VIF: variance inflation factor; Sq: Squares; Pr (> F): Probability (greater than F), namely p value.
Figures
(5)
Tables
(0)