










-
Autoluminescent organisms are widespread in nature, including numerous marine species, various bacteria, insects like fireflies and beetles, as well as springtails, fungi, and snails[1,2]. This widespread phenomenon contrasts with its rarity in the plant kingdom: no higher plants are autoluminescent, although some exhibit ultra-weak luminescence that is far too dim to be perceived by the naked eye and requires particular equipment to be detected[3]. Making flowering plants with autoluminescence has been the target of efforts for over 40 years. Bioluminescent light is normally produced by energy release during the oxidation of luciferin that emits visible light[1]. The luciferins utilized by different organisms are structurally distinct molecules, such as coelenterazine in cnidarians[4] and FMNH2 (reduced form of flavin mononucleotide) in bacteria[5]. In 1986, Ow et al. delivered firefly luciferase into tobacco, but it requires the exogenous application of luciferin (frequently toxic and high-cost) and adenosine triphosphate (ATP) to make the plants produce light, which is normally temporary and non-uniform due to unstable substrate delivery[6]. The bacterial luciferase Lux operon (luxCDABEG) that composes the light-emission system was delivered into the plastid of tobacco to produce autonomous light without application of luciferin[7]. However, the low brightness, the technical challenges of plastid transformation in plants, and potential toxicity of the luciferin substrate for some eukaryotes when nuclearly encoded prevent its widespread application in plants[8].
Currently, the only eukaryotic bioluminescence system that has been well studied and delivered into plants to confer autoluminescence is from fungi. In fungi, the luciferin is 3-hydroxyhispidin, which is produced by hispidin-3-hydroxylase (H3H) via hydroxylating hispidin. Luciferase (Luz) adds oxygen to 3-hydroxyhispidin, resulting in an unstable high-energy intermediate that subsequently emits light and is decomposed into caffeylpyruvic acid. Caffeylpyruvic acid is then converted to caffeic acid by caffeylpyruvate hydrolase (CPH), while hispidin is synthesized by hispidin synthase (HispS) from caffeic acid[9−12]. Genes encoding Luz, H3H, CPH, and HispS form a gene cluster in fungal genomes that is relatively conserved in autoluminescent fungal species, with CPH sometimes located in other genomic regions[10,11]. These four genes from Neonothopanus nambi were first transformed into tobacco after codon optimization by Mitiouchkina et al.[13].
Khakhar et al[8] added four additional genes into the construction (named as fungal bioluminescence pathway construction, FBP): 4'-phosphopantetheinyl transferase (NpgA) from Aspergillus nidulans that is required for the post-translational activation of HispS, Rhodobacter capsulatus tyrosine ammonia lyase (RcTAL), and two Escherichia coli 4-hydroxyphenylacetate 3-monooxygenase components (HpaB, HpaC); the latter three catalyze caffeic acid synthesis from tyrosine[10], a molecule that is even more ubiquitous than caffeic acid in higher plants. Shakhova et al. enhanced the bioluminescence of the FBP system by employing a combined strategy of mutagenesis and cross-species comparison to screen for the optimal combination of five key genes: HispS, H3H, Luz, CPH and NpgA[14]. Zheng et al. added 4-coumaroyl shikimate/quinate 3'-hydroxylase (C3'H1) from Brassica napus to FBP (named as enhanced FBP, eFBP), leading to enhanced bioluminescence intensity, where C3'H1 facilitates the biosynthesis of caffeic acid and hispidin from p-Coumaroyl shikimate[12]. Sequentially, Ge et al. integrated a multiplex artificial microRNA (amiR) array into eFBP (named as eFBP2) to reduce the bypass flow of caffeic acid, leading to 0.7- and 1.0-fold increases in the accumulation of caffeic acid and hispidin, respectively, and further enhanced bioluminescence intensity[15].
Several plants have been transgenically modified with FBPs, including tobacco[8,12,13,16], hybrid poplar[12], Arabidopsis thaliana[14], and petunia by the company Light Bio (
https://light.bio ). These plants tend to have light-colored flowers with thin and soft organs. However, whether dark-colored flowers and those with thick and waxy floral organs have the potential to be autoluminescent after transgenic modification remains unclear. Phalaenopsis orchids, having flowers with extraordinarily high diversity in color patterning and organ textures, serve as a good system for assessing the effects of different floral traits on the autoluminescence potential. In addition, Phalaenopsis orchids normally have large and gorgeous flowers and exceptionally long flowering phases (two to three months), which makes autoluminescent Phalaenopsis orchids of inestimable horticultural and economic value.Here, we assess the autoluminescence characteristics for 25 representative Phalaenopsis orchids after transient eFBP2 transformation, in terms of autoluminescence capability, intensity, and duration. These 25 Phalaenopsis orchids have flowers with different contents of caffeic acid and tyrosine, sizes, color lightness, organ textures, and epidermal cell types. We evaluate the associations between autoluminescence characteristics and these floral traits. Our findings provide insights for the selection of Phalaenopsis orchids and other crop plants to develop autoluminescent varieties in the future.
-
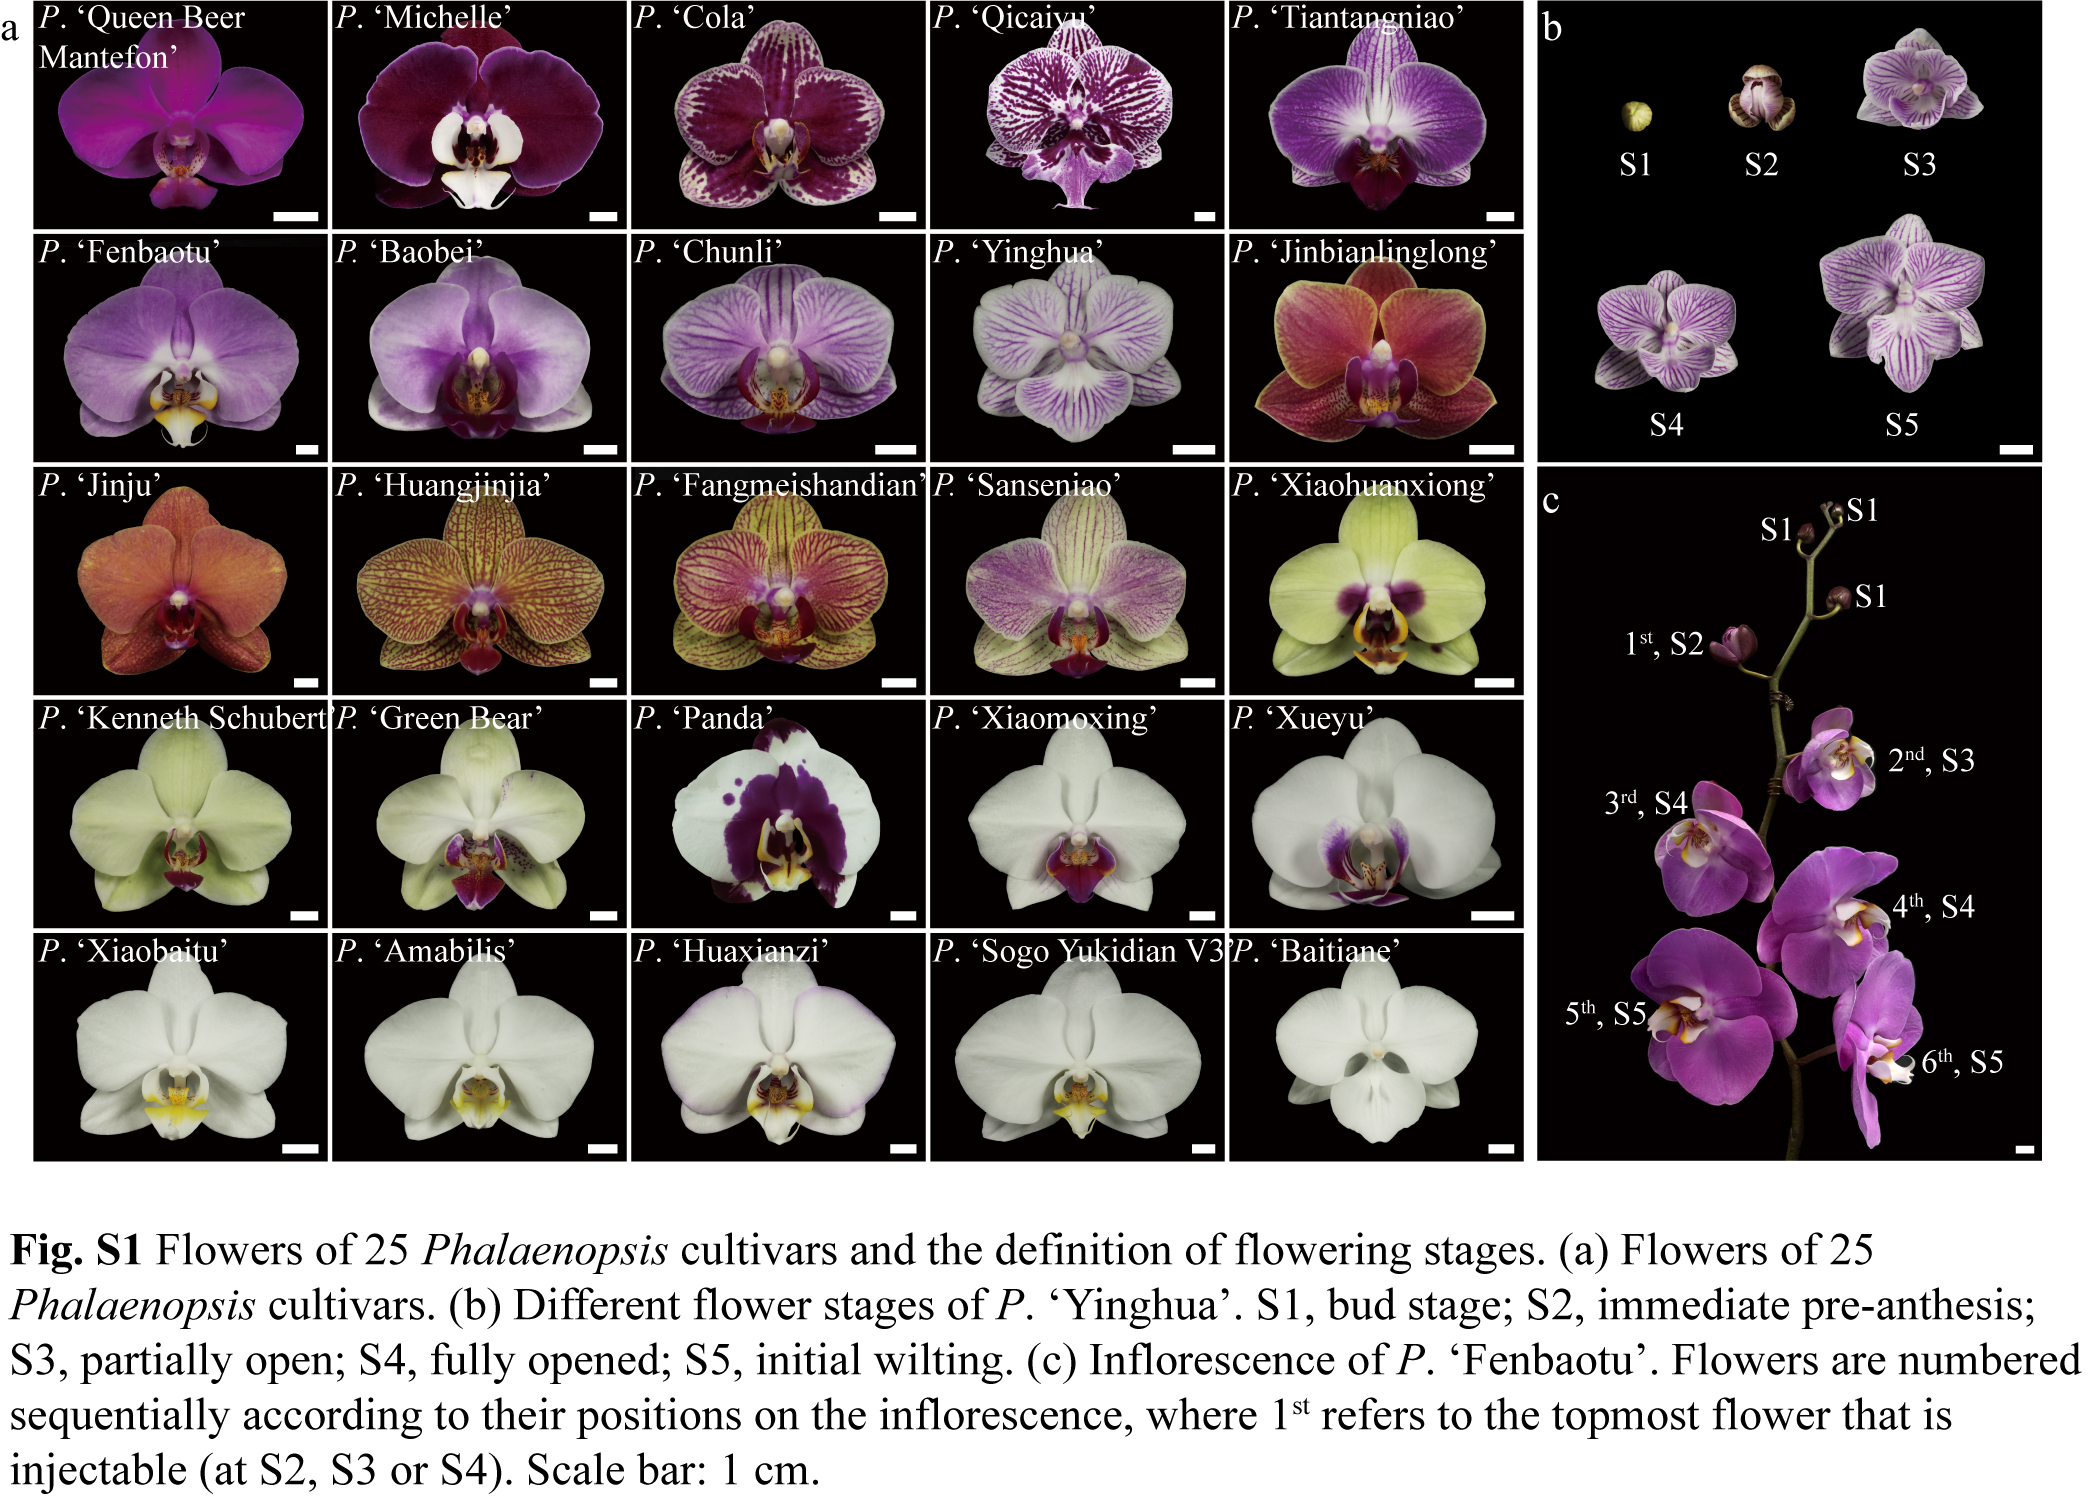
A total of 25 Phalaenopsis cultivars were treated in this study (Supplementary Fig. S1a, Supplementary Table S1). Plants with floral buds and open flowers were purchased from companies in Foshan, where the plants were grown in glass greenhouses with day/night temperatures at 22–30 °C/17–23 °C, a natural photoperiod, and light intensities of 220 μmol·m−2·s−1. These plants were grown in A-grade sphagnum moss, with pot size varying by cultivar flower size—3.5 in for large-flowered types, 3.0 in for P. 'Huangjinjia', and 2.8 in for all the other medium- and small-flowered types.
Transient transformation of eFBP2
-
The eFBP2 plasmid[15] was transformed into Agrobacterium tumefaciens GV3101 (pSoup) using a freeze-thaw method. Competent cells stored at –80 °C were thawed at room temperature until partially melted and subsequently placed on ice. Approximately 100 ng of the eFBP2 plasmid was added to 100 µL of competent cells, mixed gently, and subjected to sequential inoculation steps: 10 min on ice, 5 min in liquid nitrogen, 5 min in a 37 °C water bath, and 5 min on ice. Subsequently, 900 µL of antibiotic-free lysogeny broth (LB) medium was added, and the cells were incubated at 28 °C with shaking at 220 rpm for 2 h to allow recovery. After centrifugation at 6,000 rpm for 1 min, the supernatant was largely discarded, and the pellet was resuspended before being plated onto LB agar plates containing 50 µg/mL kanamycin and 25 µg/mL rifampicin. The plates were incubated inverted at 28 °C in the dark for 2 d. Single colonies were then inoculated into 3 mL LB medium supplemented with the same antibiotics and cultured at 28 °C, with shaking at 220 rpm for 2 d. Plasmid presence was confirmed by PCR using eFBP2-Luz primers (forward: 5′-CTAGAATTCATGAGAATCAACATCTCACT-3′; reverse: 5′-TTCGTCGACTTACTTAGCGTTCTCAACGA-3′) with 1 µL of bacterial culture as the template. Verified Agrobacterium cultures were expanded and stored at –80°C for subsequent experiments.
To initiate the transient transformation, Agrobacterium cultures carrying eFBP2 vectors were grown in 150 mL LB medium with the same antibiotics as above at 28 °C with shaking at 230 rpm until the OD600 reached 1.8 (approximately 14 h). The cells were harvested by centrifugation at 6,000 rpm for 8 min at room temperature, resuspended in MMA buffer (10 mM MES, 10 mM MgCl2, 100 µM acetosyringone, pH 5.6) to an OD600 of 0.8, and then incubated in the dark for 2 h. Silwet L-77 was added to a final concentration of 0.005% (v/v), and the suspension was mixed thoroughly. Prior to infiltration, plants were withheld from watering for several days to facilitate a degree of solute concentration within tissues. The bacterial suspension was injected into the abaxial surface of tepals using a 1-mL syringe equipped with a needle. Injection was performed until complete tissue infiltration was observed, with care taken to prevent repeated puncturing to minimize tissue damage. A minimum of four plants per cultivar were utilized, and all the open flowers and flowers before anthesis on these plants were injected. Subsequently, plants were covered with black plastic bags to preserve humidity and maintained in the dark at room temperatures for ~24 h (~30 °C in the summer, while ~22 °C in the autumn), then were transferred to a growth room (~22 °C on average, 220 µmol·m−2·s−1 LED illumination, 14 h light/10 h dark) , and irrigation was withheld for a further 2–3 d.
Assessment of autoluminescence characteristics
-
The autoluminescence characteristics of eFBP2-transformed plants were first recorded 2 d after injection (DAI) photographically and were subsequently monitored at 12-h (in the autumn experiments) or 24-h (in the summer experiments) intervals until the autoluminescence disappeared completely. For each Phalaenopsis cultivar, only the flower with the highest autoluminescence intensity was photographed with a Canon EOS 90D camera (ISO 25600, the minimum aperture ranging from f/3.5 to f/5.6, 30-second exposure in Bulb mode) in the dark field. To grade cultivars with different autoluminescence intensities, the image with the highest brightness was first converted into a grayscale image. Three brightest regions (5.4 × 7.0 mm in size) were selected, and their grayscale values were determined using ImageJ. The averaged grayscale per image was used to represent the autoluminescence intensity of the cultivar in the target. The autoluminescence intensity can be categorized into four grades: none (grayscale = 0), low (0 < grayscale ≤ 30), medium (30 < grayscale ≤ 90), or high (grayscale > 90). Autoluminescence duration was defined as the number of days during which autoluminescence was detectable, commencing 24 h after transfer to the growth room and ending when it was no longer visible to the camera and/or the naked eye.
High-performance liquid chromatography analysis
-
To measure the content of caffeic acid and tyrosine in flowers of Phalaenopsis cultivars, the petal samples were ground in liquid nitrogen and thoroughly mixed. Exactly 0.1 g of powder was weighed and placed in a 15 mL centrifuge tube. For caffeic acid, 3 mL of methanol was added to the 15 mL centrifuge tube, and the mixture was ultrasonicated at 4 °C for 1 h, then centrifuged at 4,000 rpm for 10 min. A suitable amount of the supernatant was filtered through a 0.22 μm filter for testing. The samples were analyzed using a High-Performance Liquid Chromatography (HPLC) system (Agilent 1100) with a C18 column (4.6 mm × 250 mm, 5 μm, Agilent). The HPLC analysis was performed using an isocratic elution with a mobile phase of acetonitrile and 0.1% phosphoric acid in water (40:60, v/v). The flow rate was set at 1.0 mL/min, the column temperature was maintained at 30 °C, and the detection wavelength was 300 nm.
For tyrosine, 5 mL of 6 M HCl was added to the 15 mL centrifuge tube (containing petal powder) and was mixed thoroughly on a shaker for 5 min. The sample was transferred to a preheated oven at 105 °C for hydrolysis for 24 h. After hydrolysis, the sample was cooled immediately with cold water to room temperature, and it was checked whether HCl should be supplemented to make up for the deficiency. The sample was neutralized by adding 5 mL of 6 M NaOH and vortexing vigorously for 5 min, and then was centrifuged at 4,000 rpm for 10 min. A mixture of 0.5 mL of the supernatant, 0.5 mL of bicarbonate buffer (pH 9.0), and 0.5 mL of 2,4-dinitrofluorobenzene (DNFB) was transferred into a 15 mL brown centrifuge tube, incubated in a light-protected water bath at 60.0 ± 0.5 °C for 60 min, and was cooled immediately to room temperature with cold water. The mixture was treated with 3.5 mL of phosphate buffer (pH 7.0), mixed thoroughly, and incubated at room temperature in the dark for 15 min. The supernatant was filtered through a 0.22 μm membrane filter and was analyzed using an HPLC system (Agilent 1100) with a C18 column (4.6 mm × 250 mm, 5 μm, Agilent). The HPLC analysis was conducted with a binary gradient mobile phase composed of solvent A (acetonitrile and methanol in a 90:10 ratio) and solvent B (0.02 M monobasic sodium phosphate and sodium hydrogen phosphate). The gradient started from 14% (v/v) solvent A and 86% (v/v) solvent B, then the concentration of solvent A was increased to 70% (v/v) over 44 min, and then reset to 14% (v/v) at 44.01 min for column re-equilibration. The method utilized a constant flow rate of 1.0 mL/min, a column temperature of 38 °C, and UV detection at 360 nm.
Caffeic acid and tyrosine were identified by comparing their retention times (18 and 46 min, respectively) with those of authentic standards (Shanghai Yuanye Bio-Technology Co., Ltd) and quantified using external calibration curves generated from serially diluted standard solutions.
Measurement of floral traits
-
Floral traits recorded for 25 Phalaenopsis cultivars included flower size, color lightness, texture of floral organs, epidermal cell type, and ease of infiltration (Supplementary Table S2). Specifically, the diameter of a mature flower (typically the first flower at the base of the inflorescence) was measured per plant, with five biological replicates per cultivar. Floral color lightness was quantified using the CIELAB color space, where L represents perceptual lightness, which ranges from 0 (black) to 100 (white). Three representative points were sampled on the petal per cultivar, and the averaged L value was recorded. For P. 'Michelle', the L value was measured for the lip instead of the petal since the lip was the only organ with autoluminescence. The floral color lightness was categorized into three grades: dark (L ≤ 50), medium (50 < L < 70), and light (L ≥ 70).
The texture of floral organs was classified as waxy or velvety according to established criteria in refs[17,18], where waxy tepals are more brittle than velvety ones. To simplify the analysis, we gently folded the petals and classified cultivars with broken petals as waxy, while the ones with unbroken petals as velvety.
Statistical analysis
-
All statistical analyses were performed in R (v4.5.1)[19]. The Pearson Correlation Coefficient (cor.test function) was used to measure the linear correlation between the autoluminescence intensity and duration across cultivars. Differences in caffeic acid and tyrosine contents among multiple cultivars were tested using one-way analysis of variance (ANOVA) (aov function), followed by Fisher's Least Significant Difference (LSD) post-hoc multiple comparisons test (LSD.test function in R package 'agricolae'[20]). The strength of association (p value) between two categorical variables (i.e., autoluminescence potential and ease of infiltration), or between categorical and numeric variables (i.e., autoluminescence duration and ease of infiltration), was examined using the Chi-square (χ2) test (chisq.test function in R package 'desctable'[21]), with effect size reported as Cramér's V (assocstats function in R package 'vcd' [Visualizing Categorical Data][22,23]), which ranges from 0 to 1, with higher values indicating stronger associations between variables. Linear regression models were built using the lm function in R. Model fit was evaluated by adjusted R2; statistical significance of individual coefficients was assessed by t-tests; the overall significance of each model was tested by F-tests; all three estimates were provided by the lm function. Multicollinearity among different floral traits was assessed using the variance inflation factor (VIF, vif function in the R package 'car' [Companion to Applied Regression][24]), with VIF < 5 indicating no severe collinearity.
-
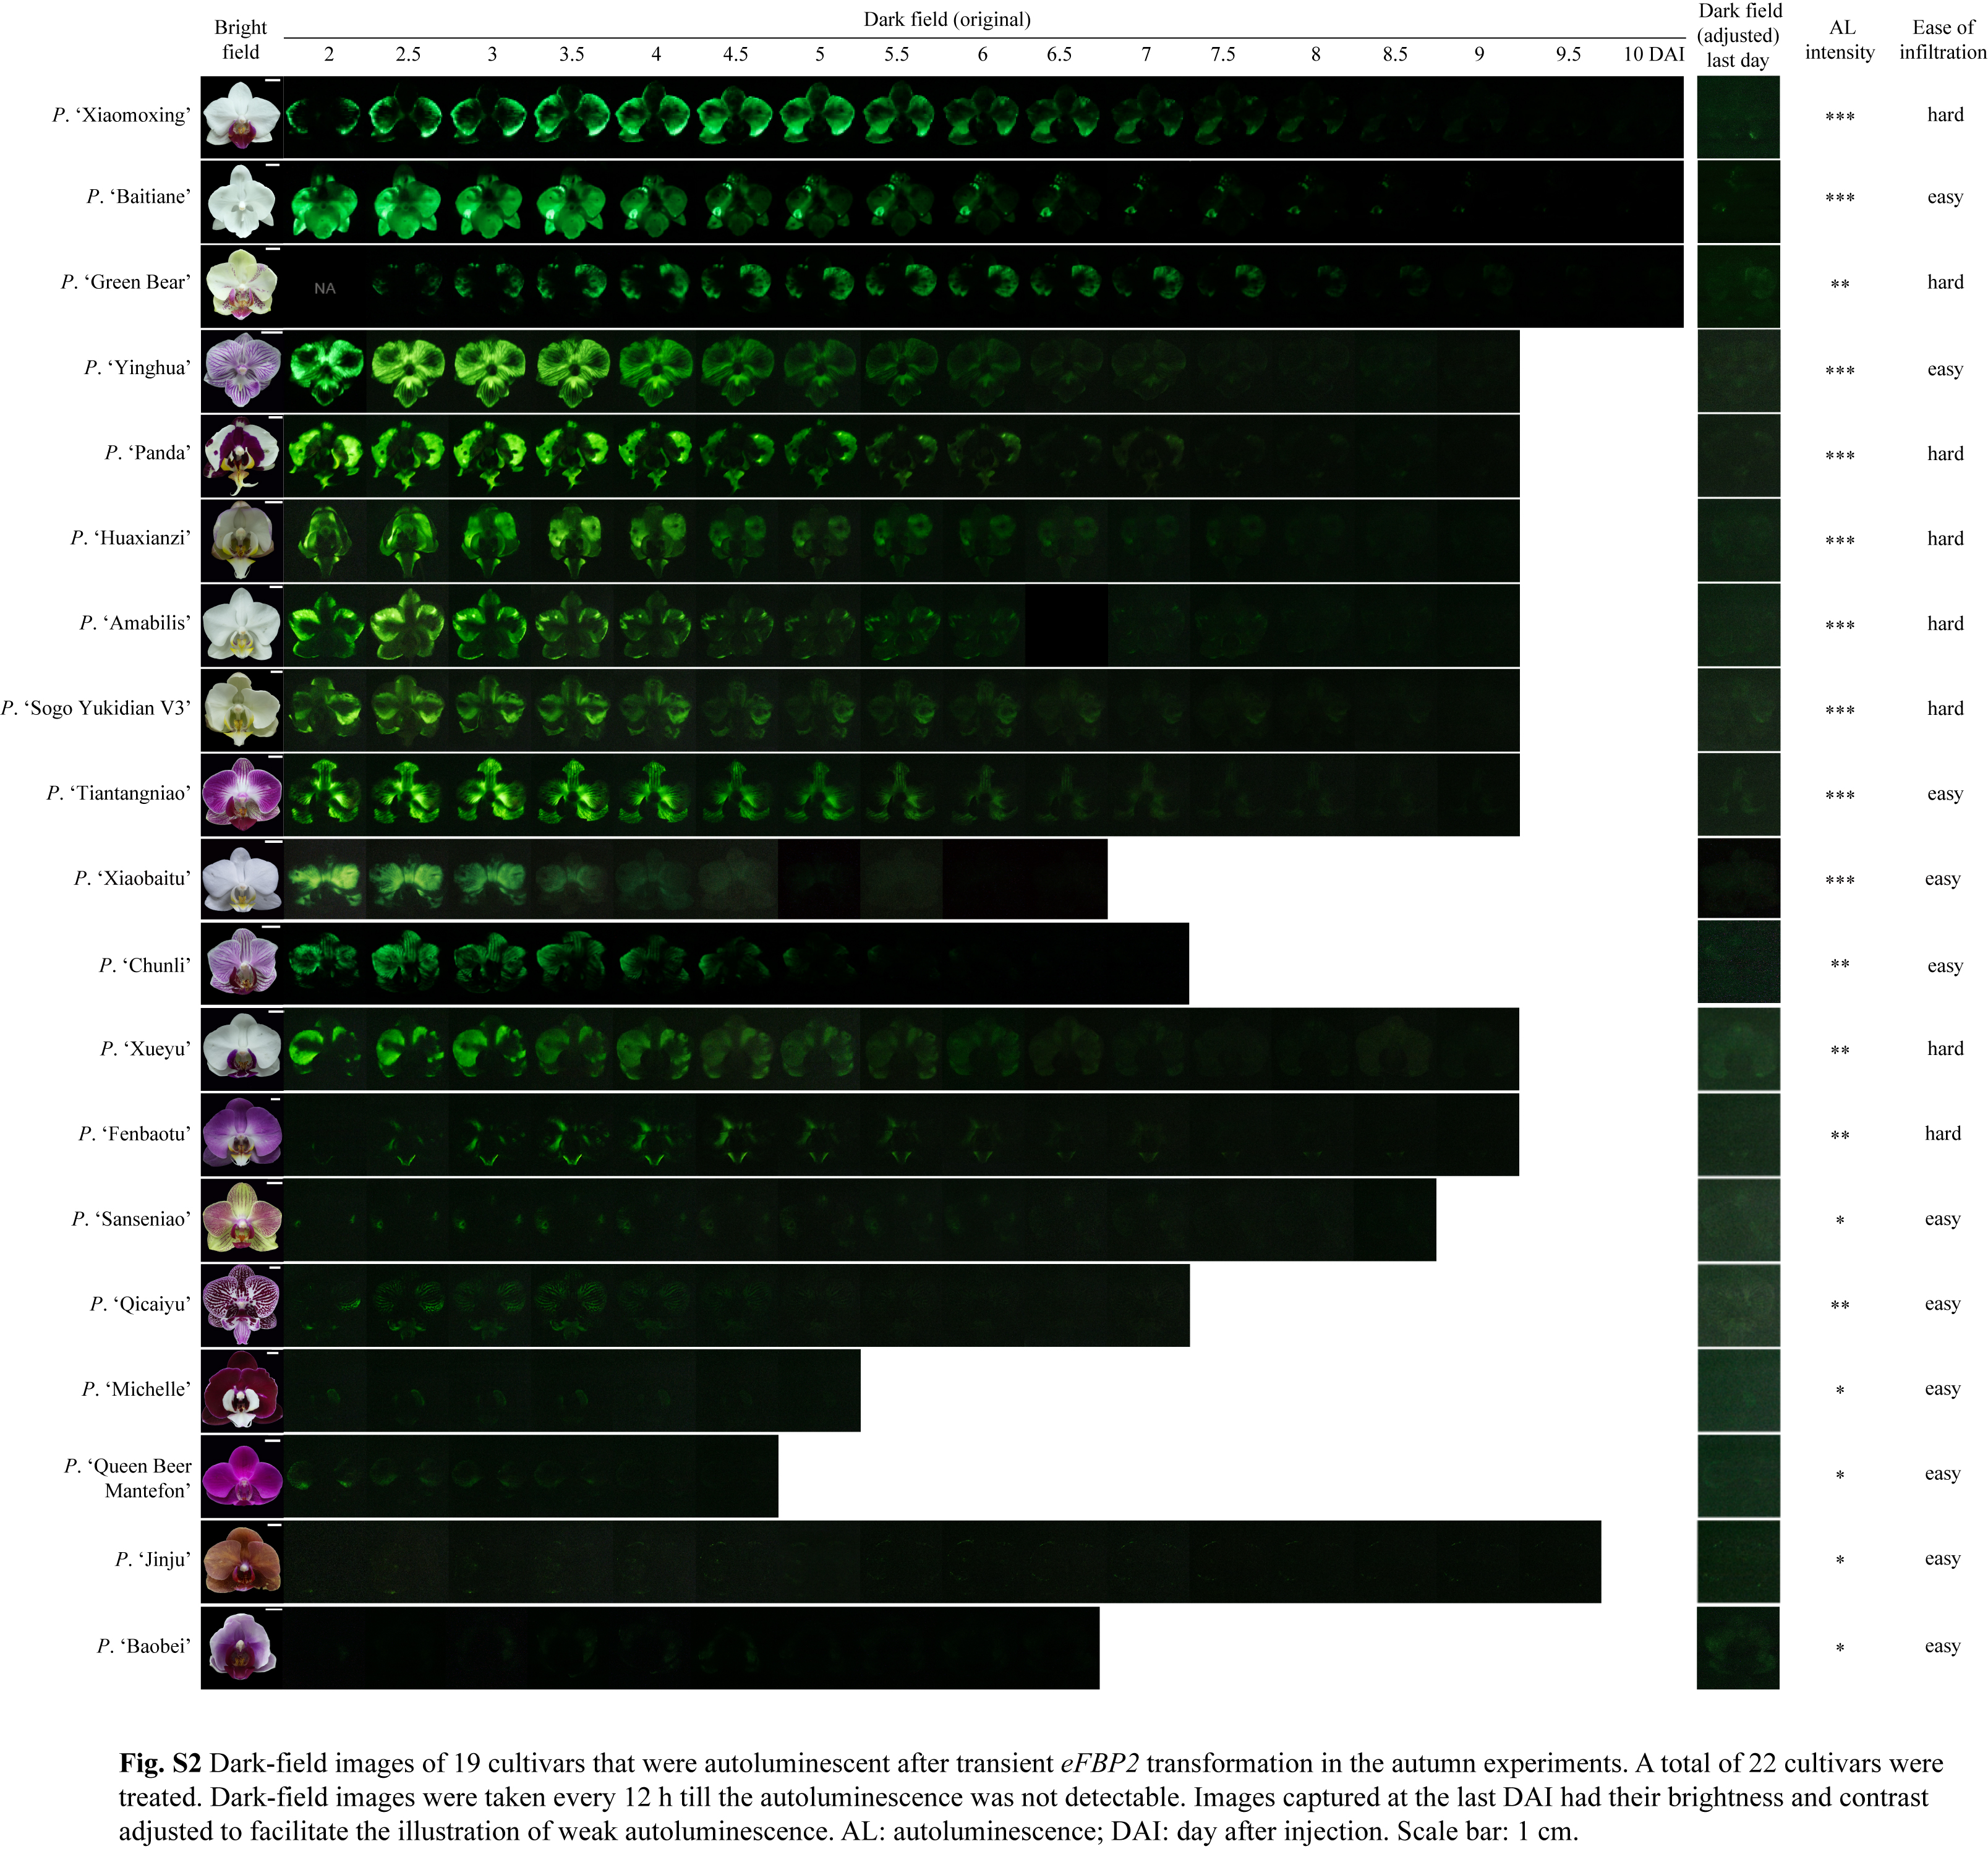
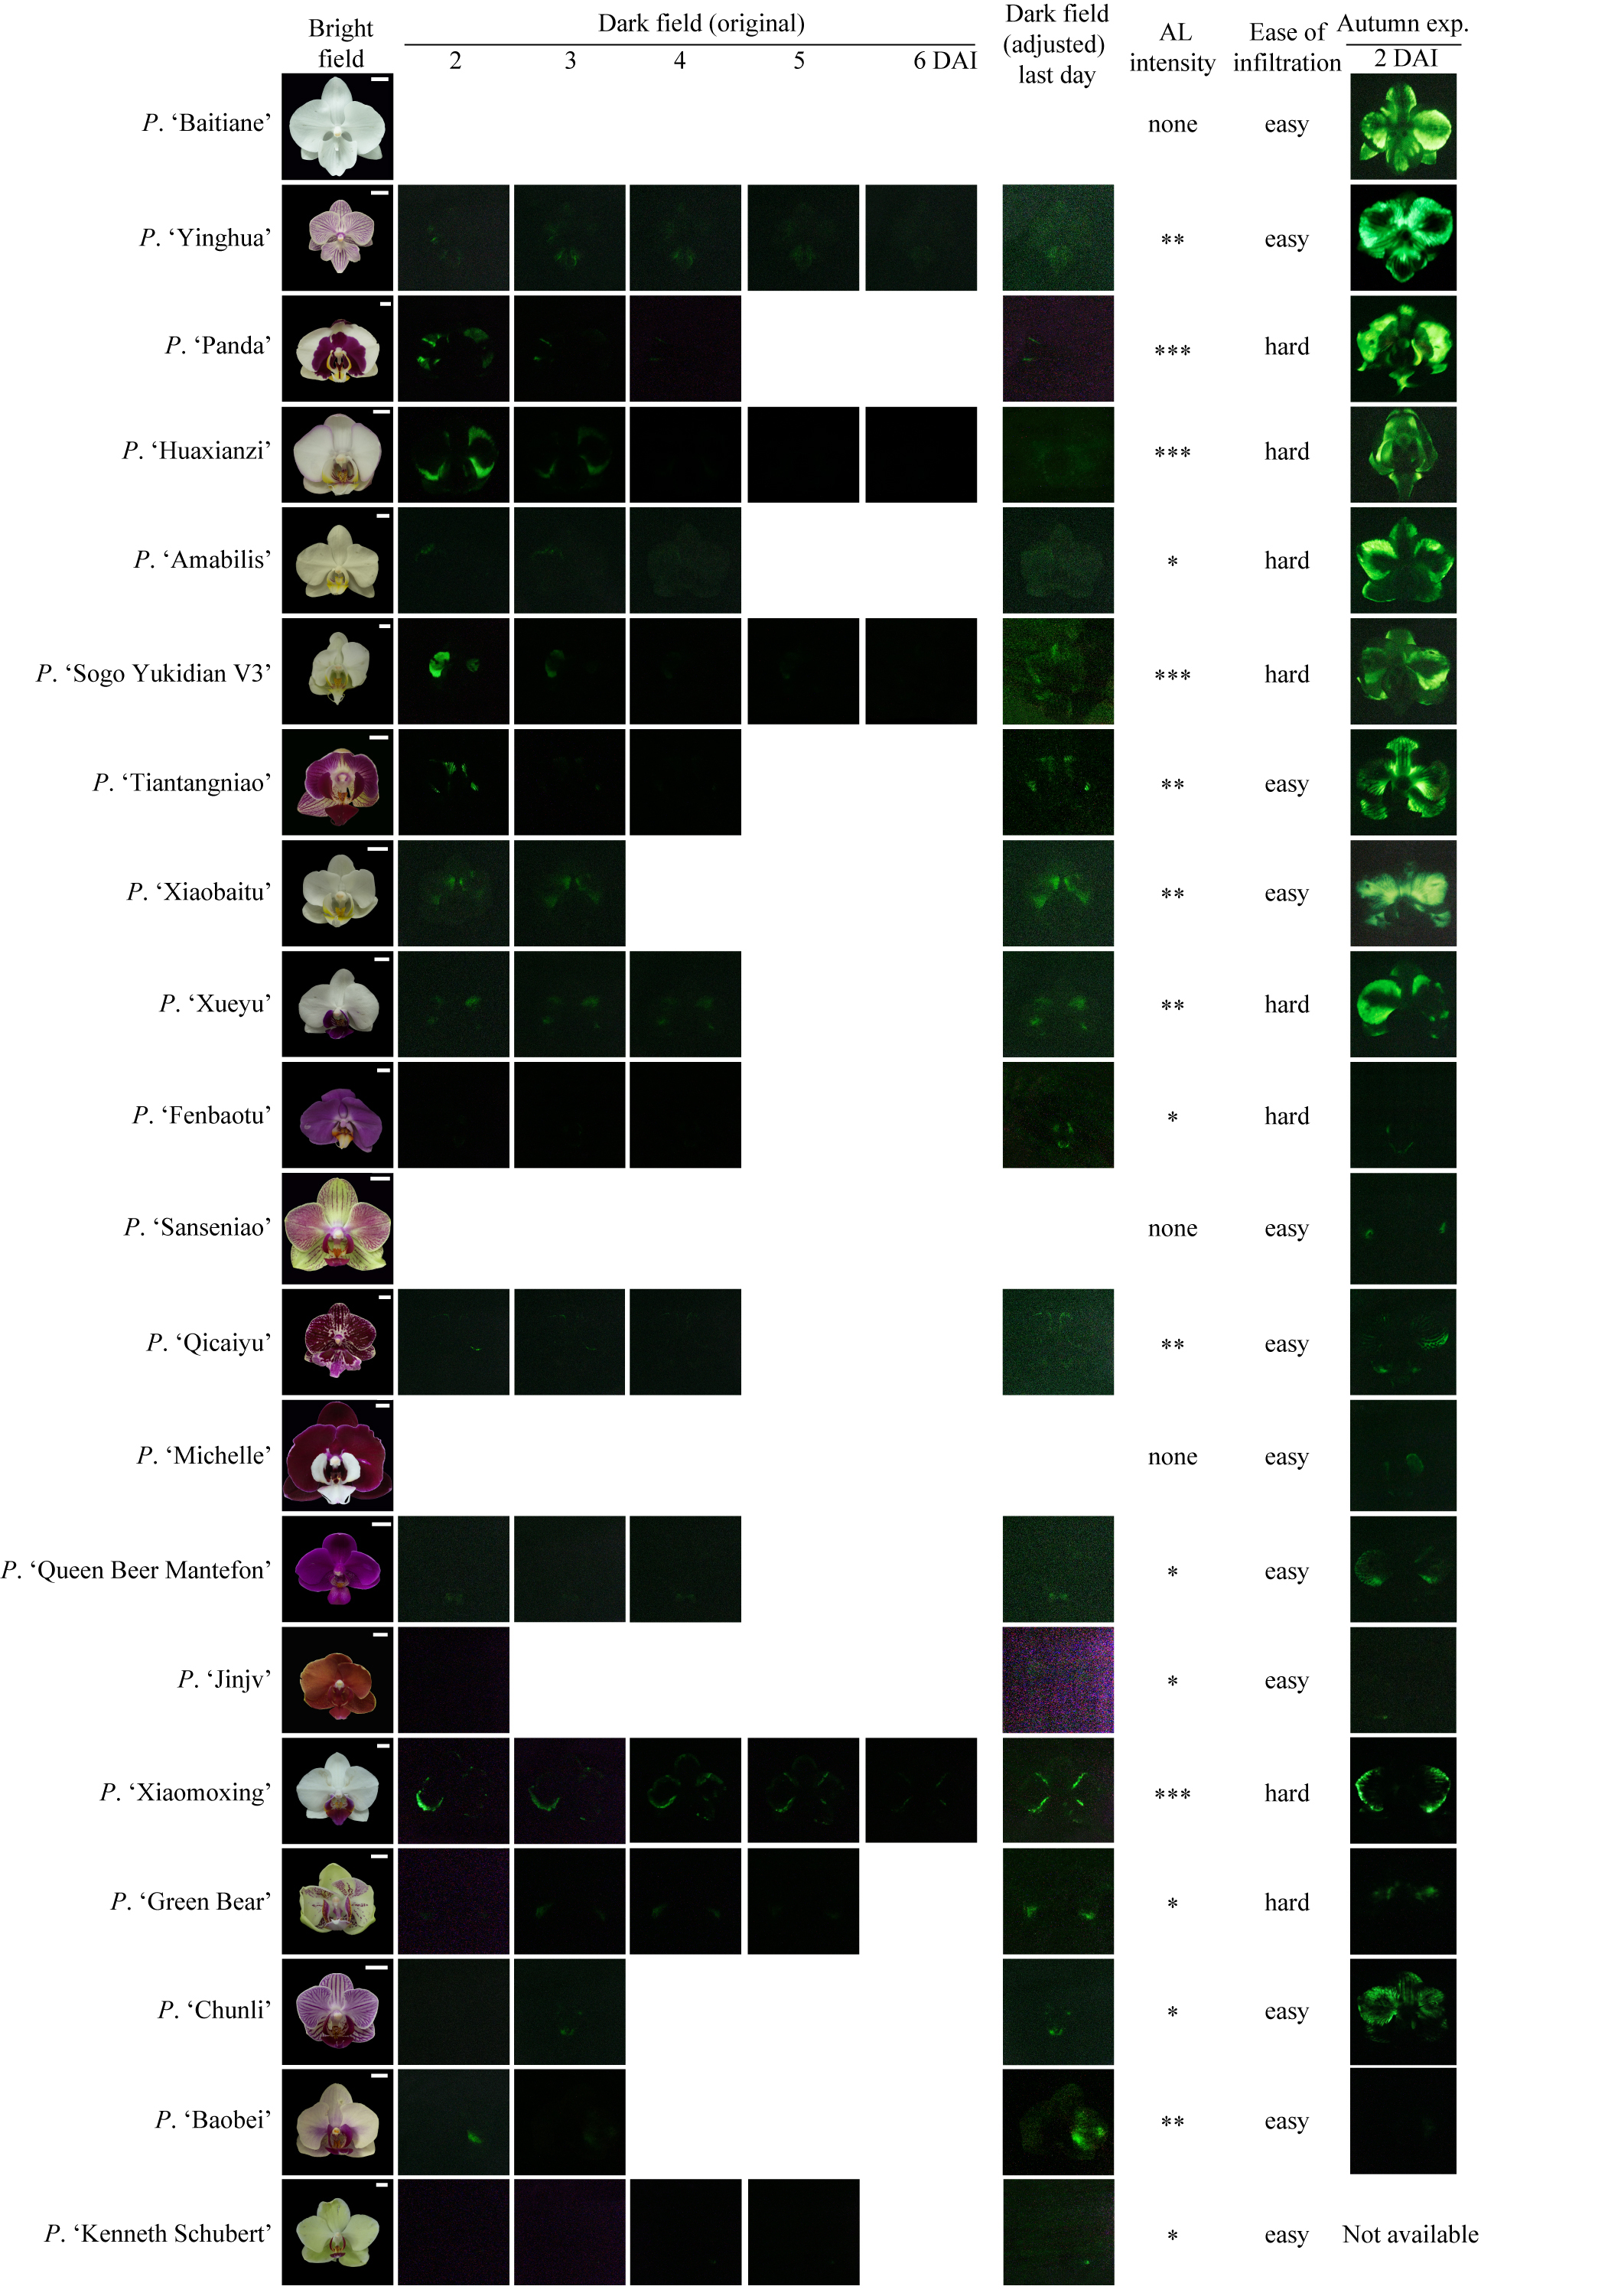
A total of 25 cultivars (Supplementary Fig. S1a) that differed in several floral key traits—including size, color lightness, venation-associated stripe, spot or patch pattern, and floral organ texture—were treated with eFBP2. Two batches of experiments were performed (Supplementary Table S1): one in the autumn of 2025 with room temperature about 22 °C (22 cultivars, Supplementary Fig. S2), the other in the summer of 2025 when the room temperature was about 30 °C (all 25 cultivars, Supplementary Fig. S3). Jointly considering the ease of injection operation and the endogenous biochemical activity of flowers at different development stages, only flowers that were immediately prior to anthesis (S2), partially open (S3), fully open (S4) and those began to wilt (S5) were injected with eFBP2-containing bacterial suspension, while those at bud stage (S1) were not used (Supplementary Fig. S1b, S1c). Three to six flowers were treated per plant and were numbered according to their positions on the inflorescence (Supplementary Fig. S1c). At least 14 flowers from at least four plants were treated per cultivar for the summer experiments, while ≥ three flowers from ≥ one plant were treated per cultivar for the autumn experiments (Supplementary Table S1).
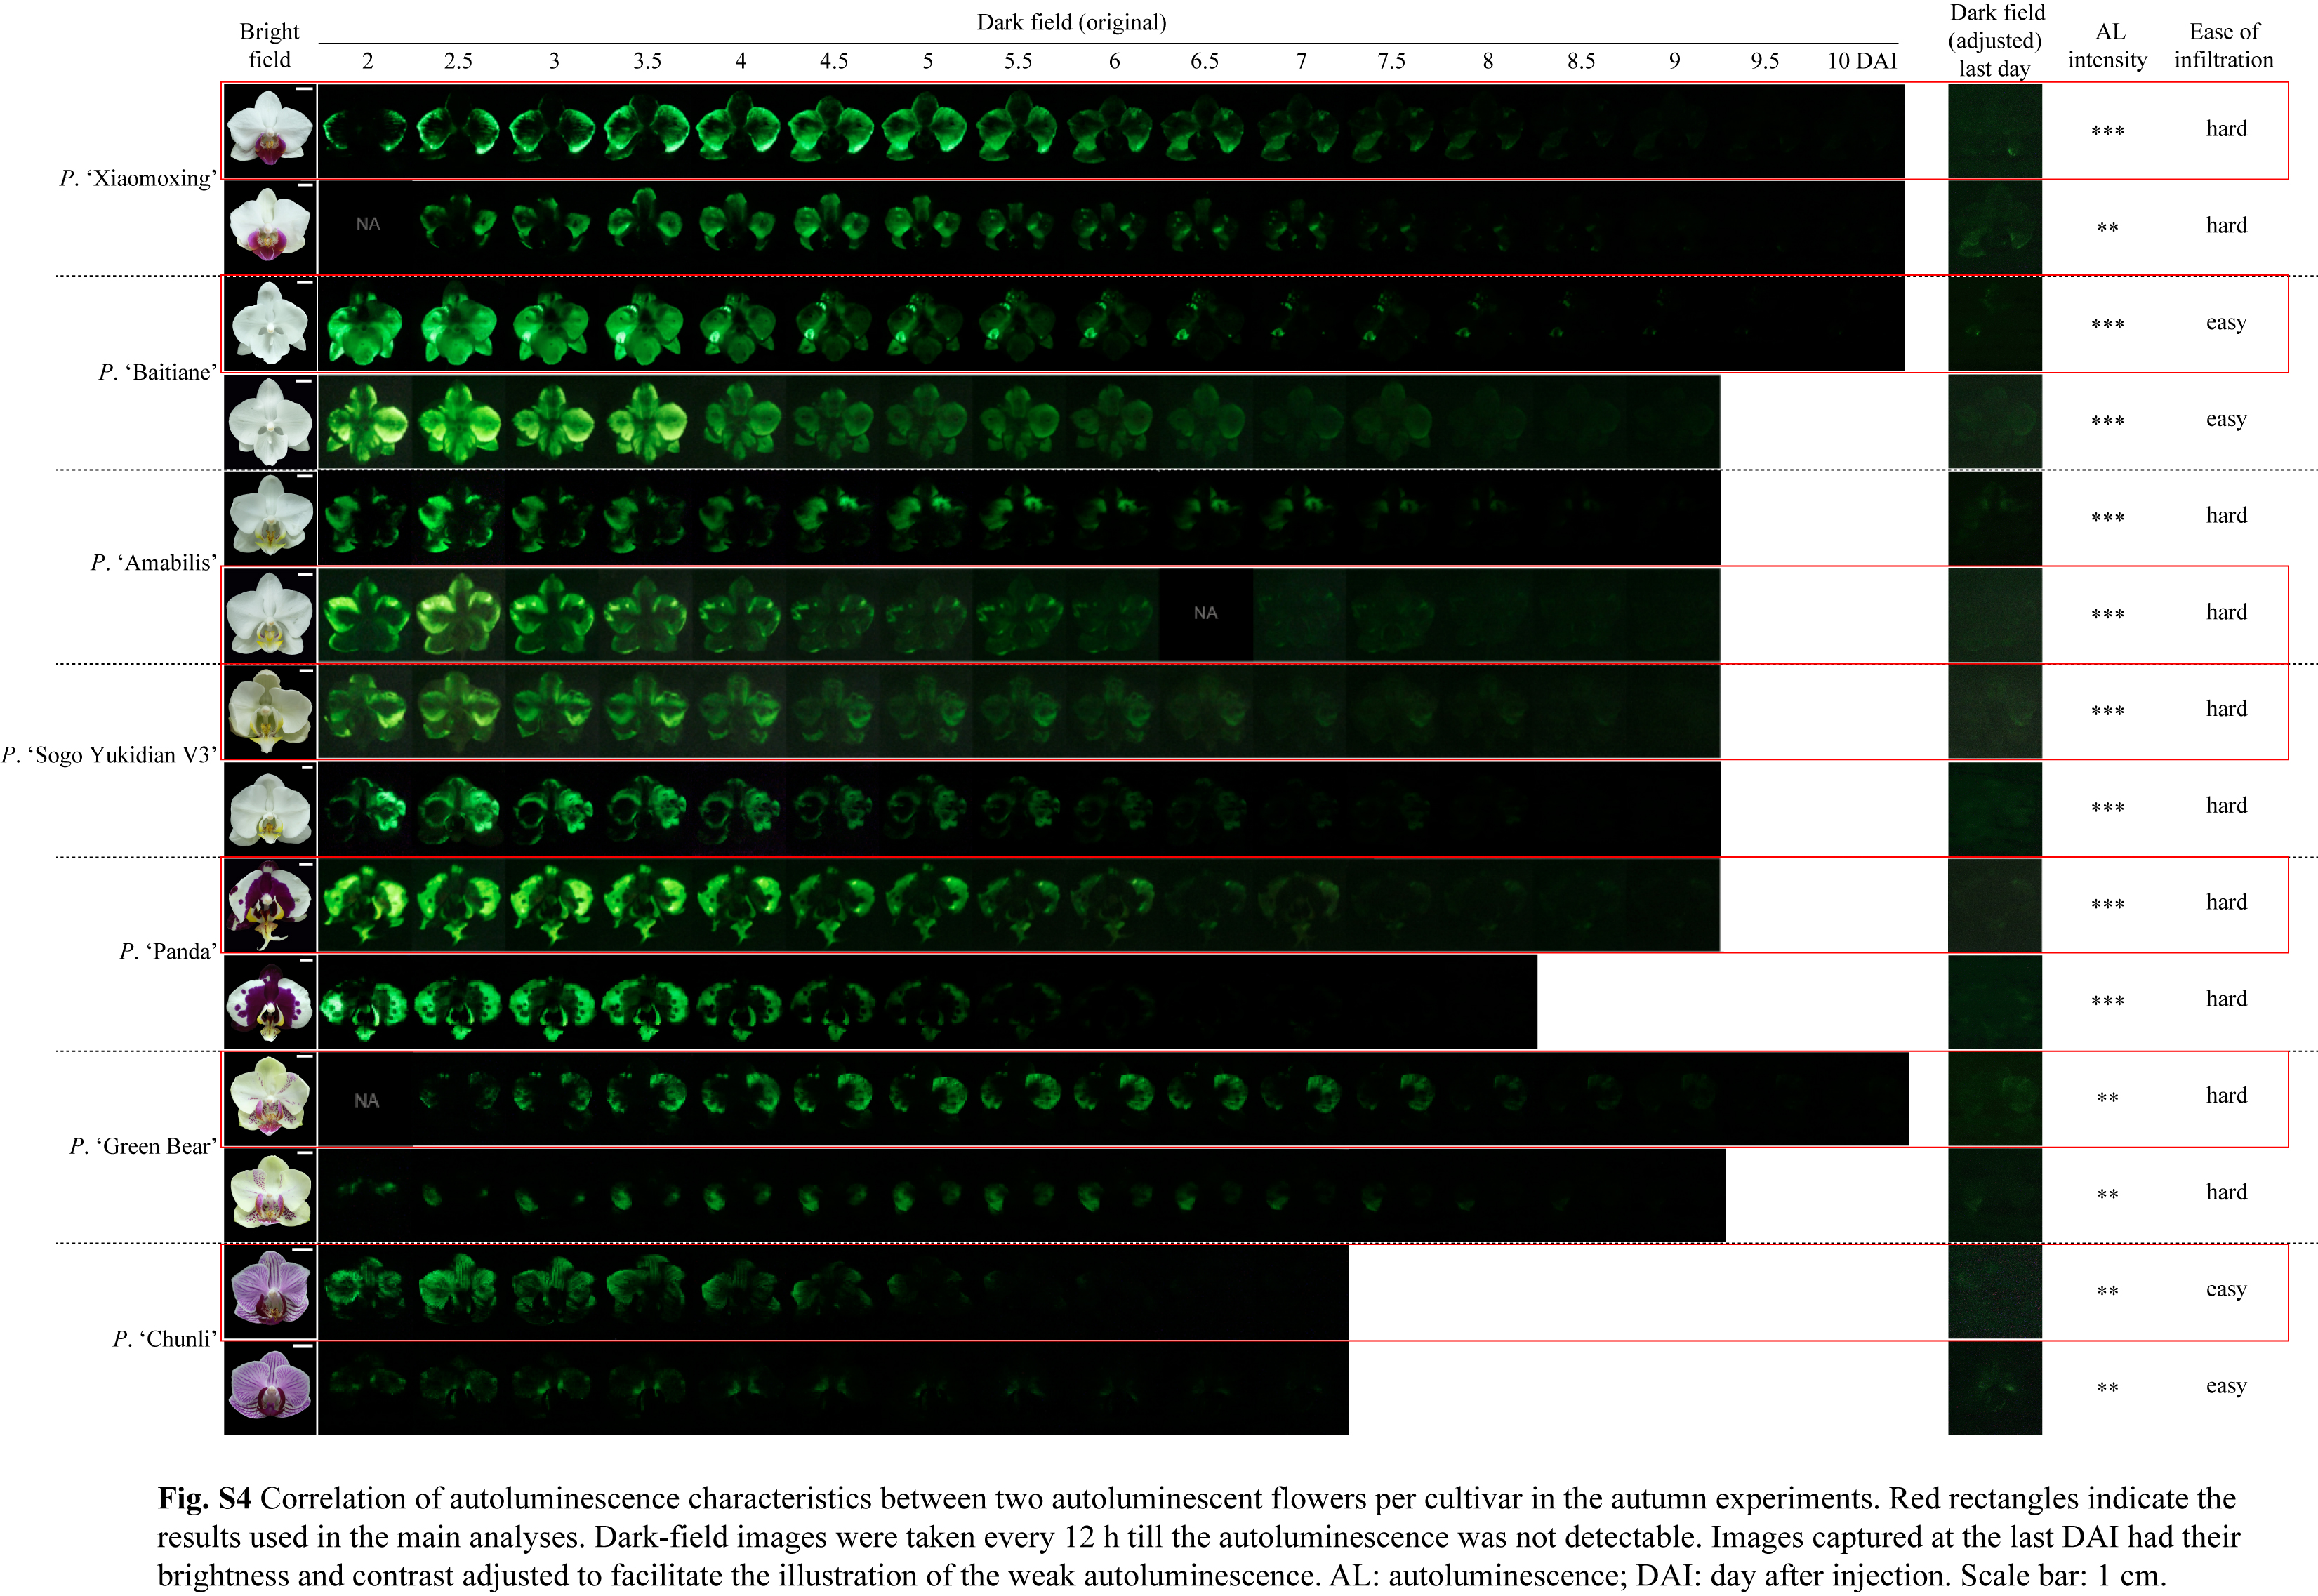
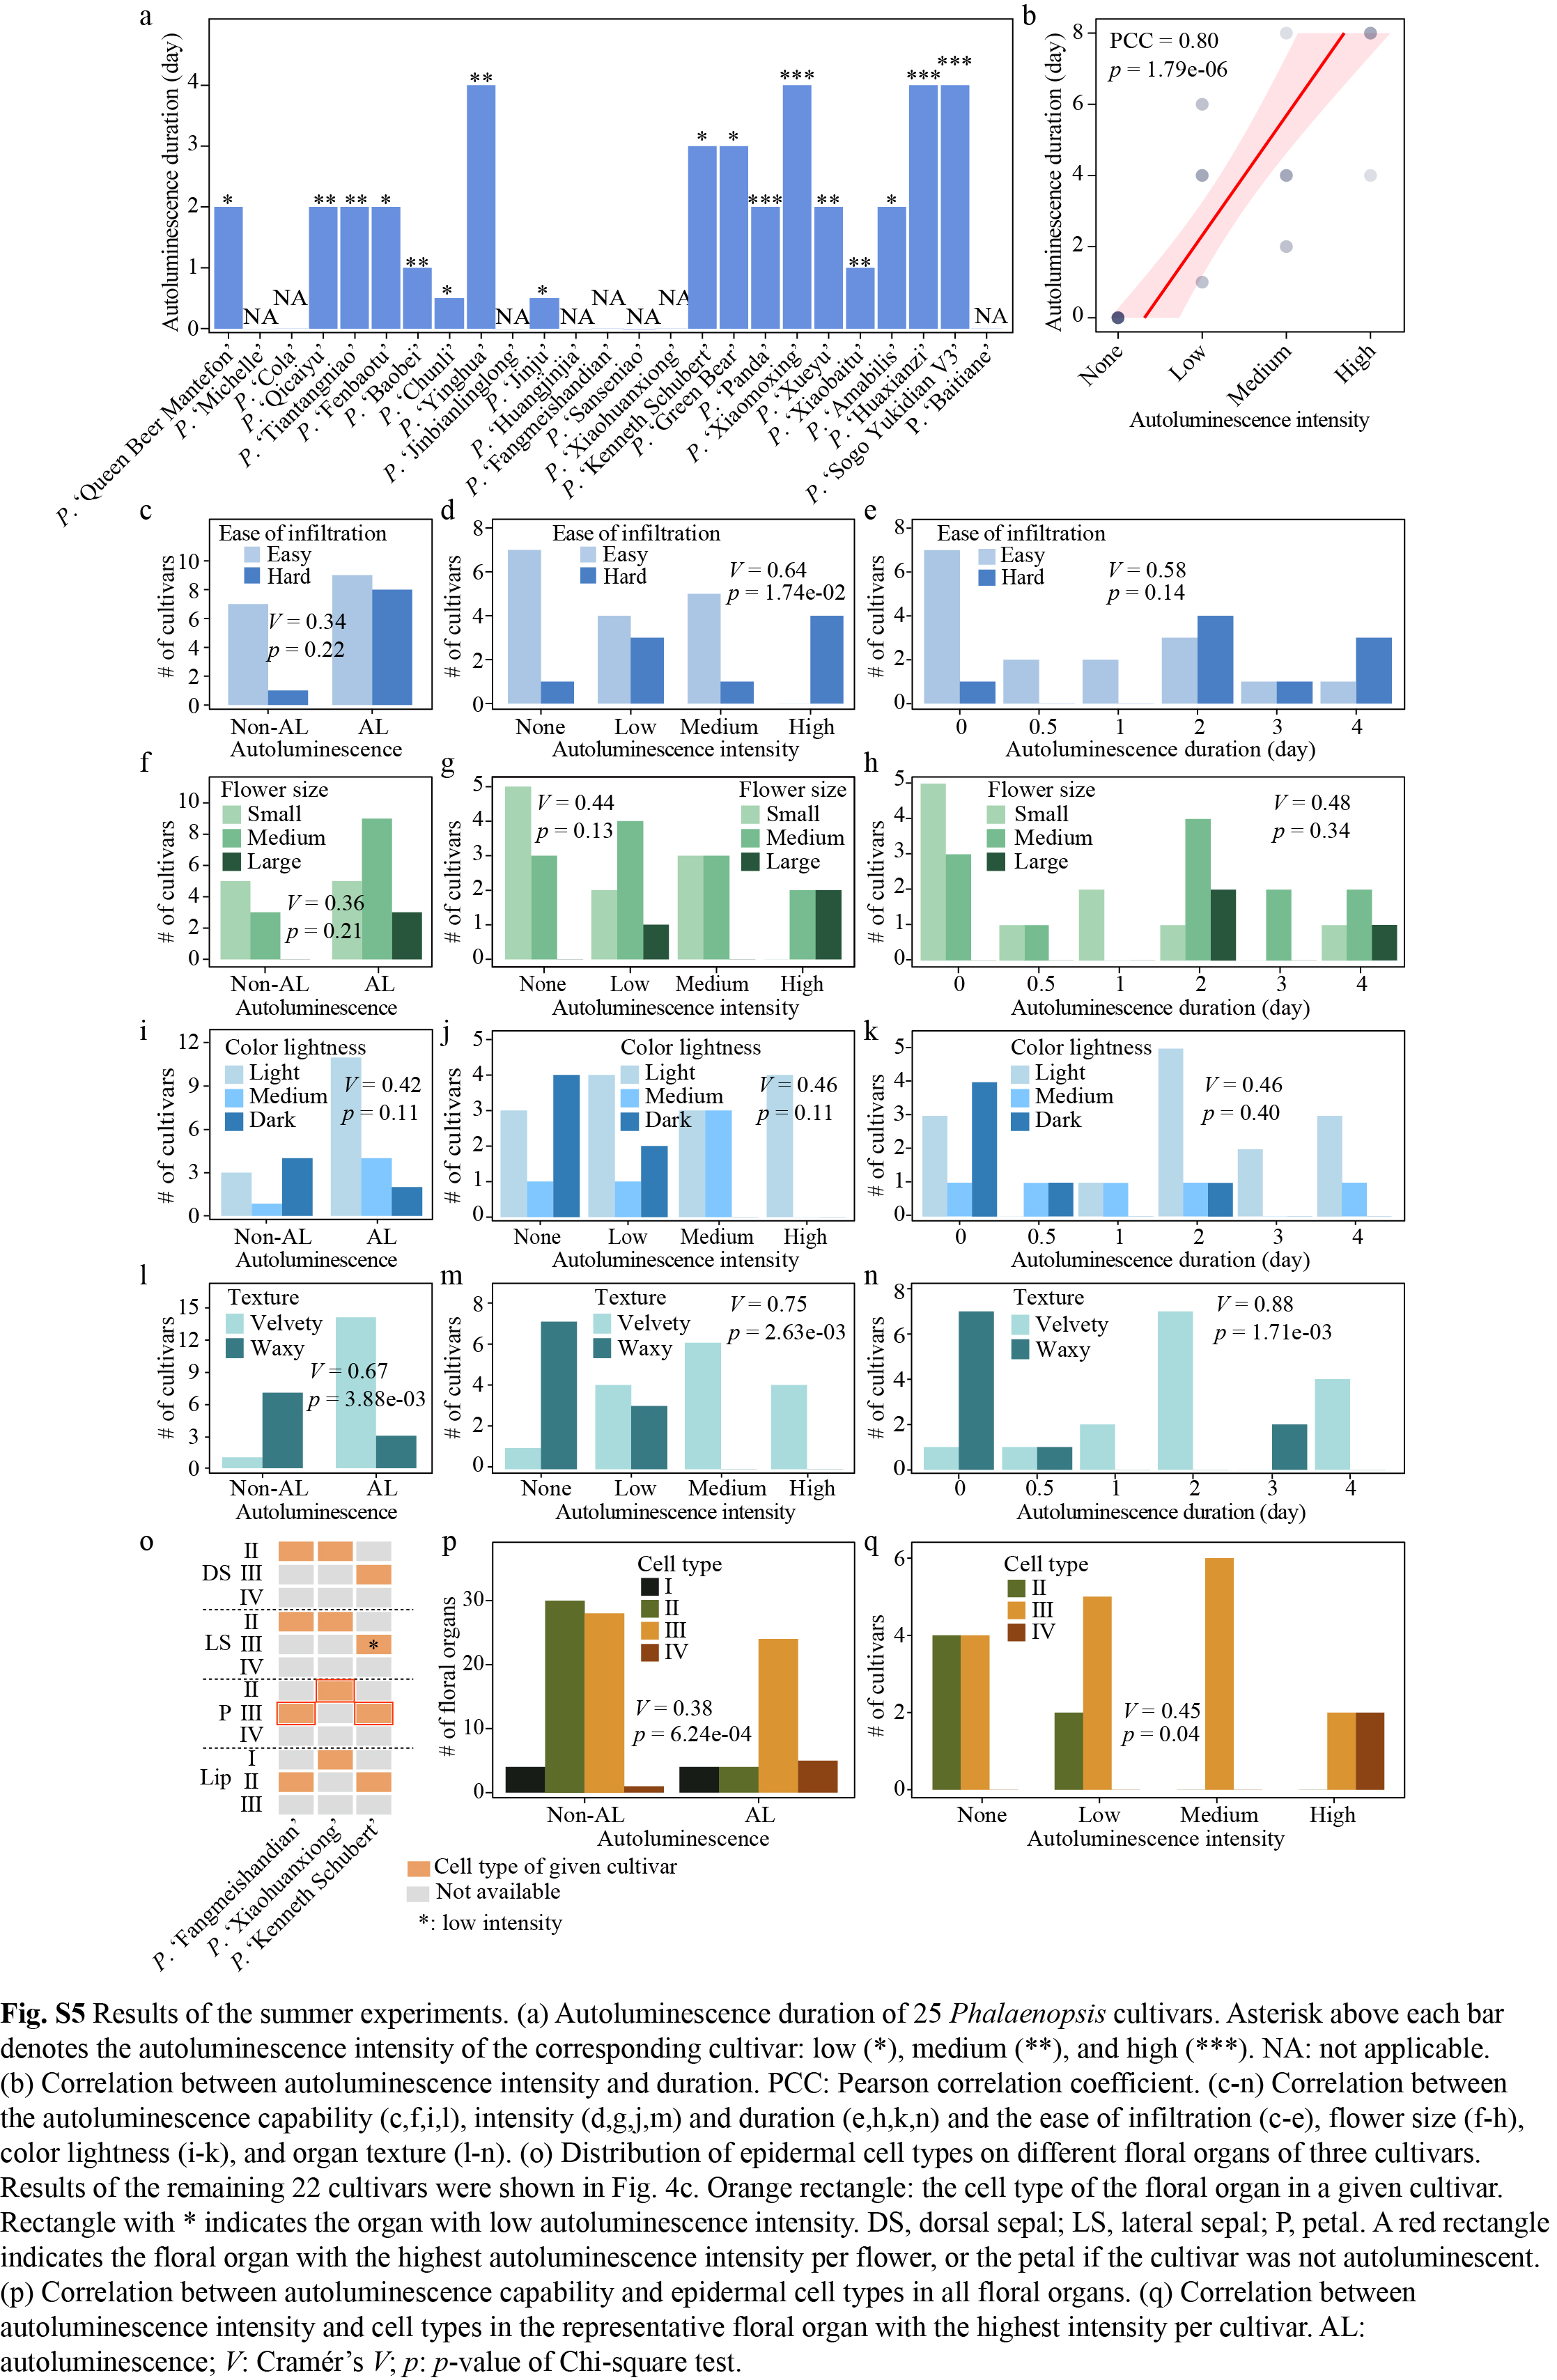
After transient transformation with eFBP2, flowers of certain cultivars displayed clear green autoluminescence at 2 d after injection (DAI) (Fig. 1a–c, Supplementary Figs S2, S3). Dark-field photos of flowers were recorded using Bulb mode of the camera, with a consistent 30-s exposure at ISO 25600 (Methods). Flowers were photographed every 12 h (Supplementary Fig. S2) or 24 h (Supplementary Fig. S3) till the bioluminescence light was no longer detectable, and the duration of autoluminescence was recorded. To ensure comparability of autoluminescence characteristics across cultivars, the characteristics of the flower with the highest autoluminescence intensity were recorded for each cultivar and each experimental batch. This strategy was adopted because we noticed that within each cultivar, the flowers capable of autoluminescence exhibited relatively comparable autoluminescence properties in the same experimental batch (Supplementary Fig. S4). Cultivars were further divided into four categories according to their autoluminescence intensity, which was calculated as the average grayscale across three brightest regions on their flowers (Supplementary Fig. S1d, Methods). Specifically, cultivars with high intensity had grayscale > 90, medium intensity with grayscale between 30 and 90, low intensity with grayscale ≤ 30, while those with no autoluminescence had grayscale = 0 (Fig. 1e, Supplementary Table S1). For flowers capable of autoluminescence, the highest light intensity was observed between 2 and 4 DAI, and later on, the light intensity decreased gradually (Fig. 1c, Supplementary Figs S2, S3). The duration of autoluminescence ranged from 1 to 8 d (Fig. 1f, Supplementary Fig. S5a). Cultivars with higher autoluminescence intensity tended to have a longer duration of autoluminescence (Fig. 1g, Supplementary Fig. S5b).
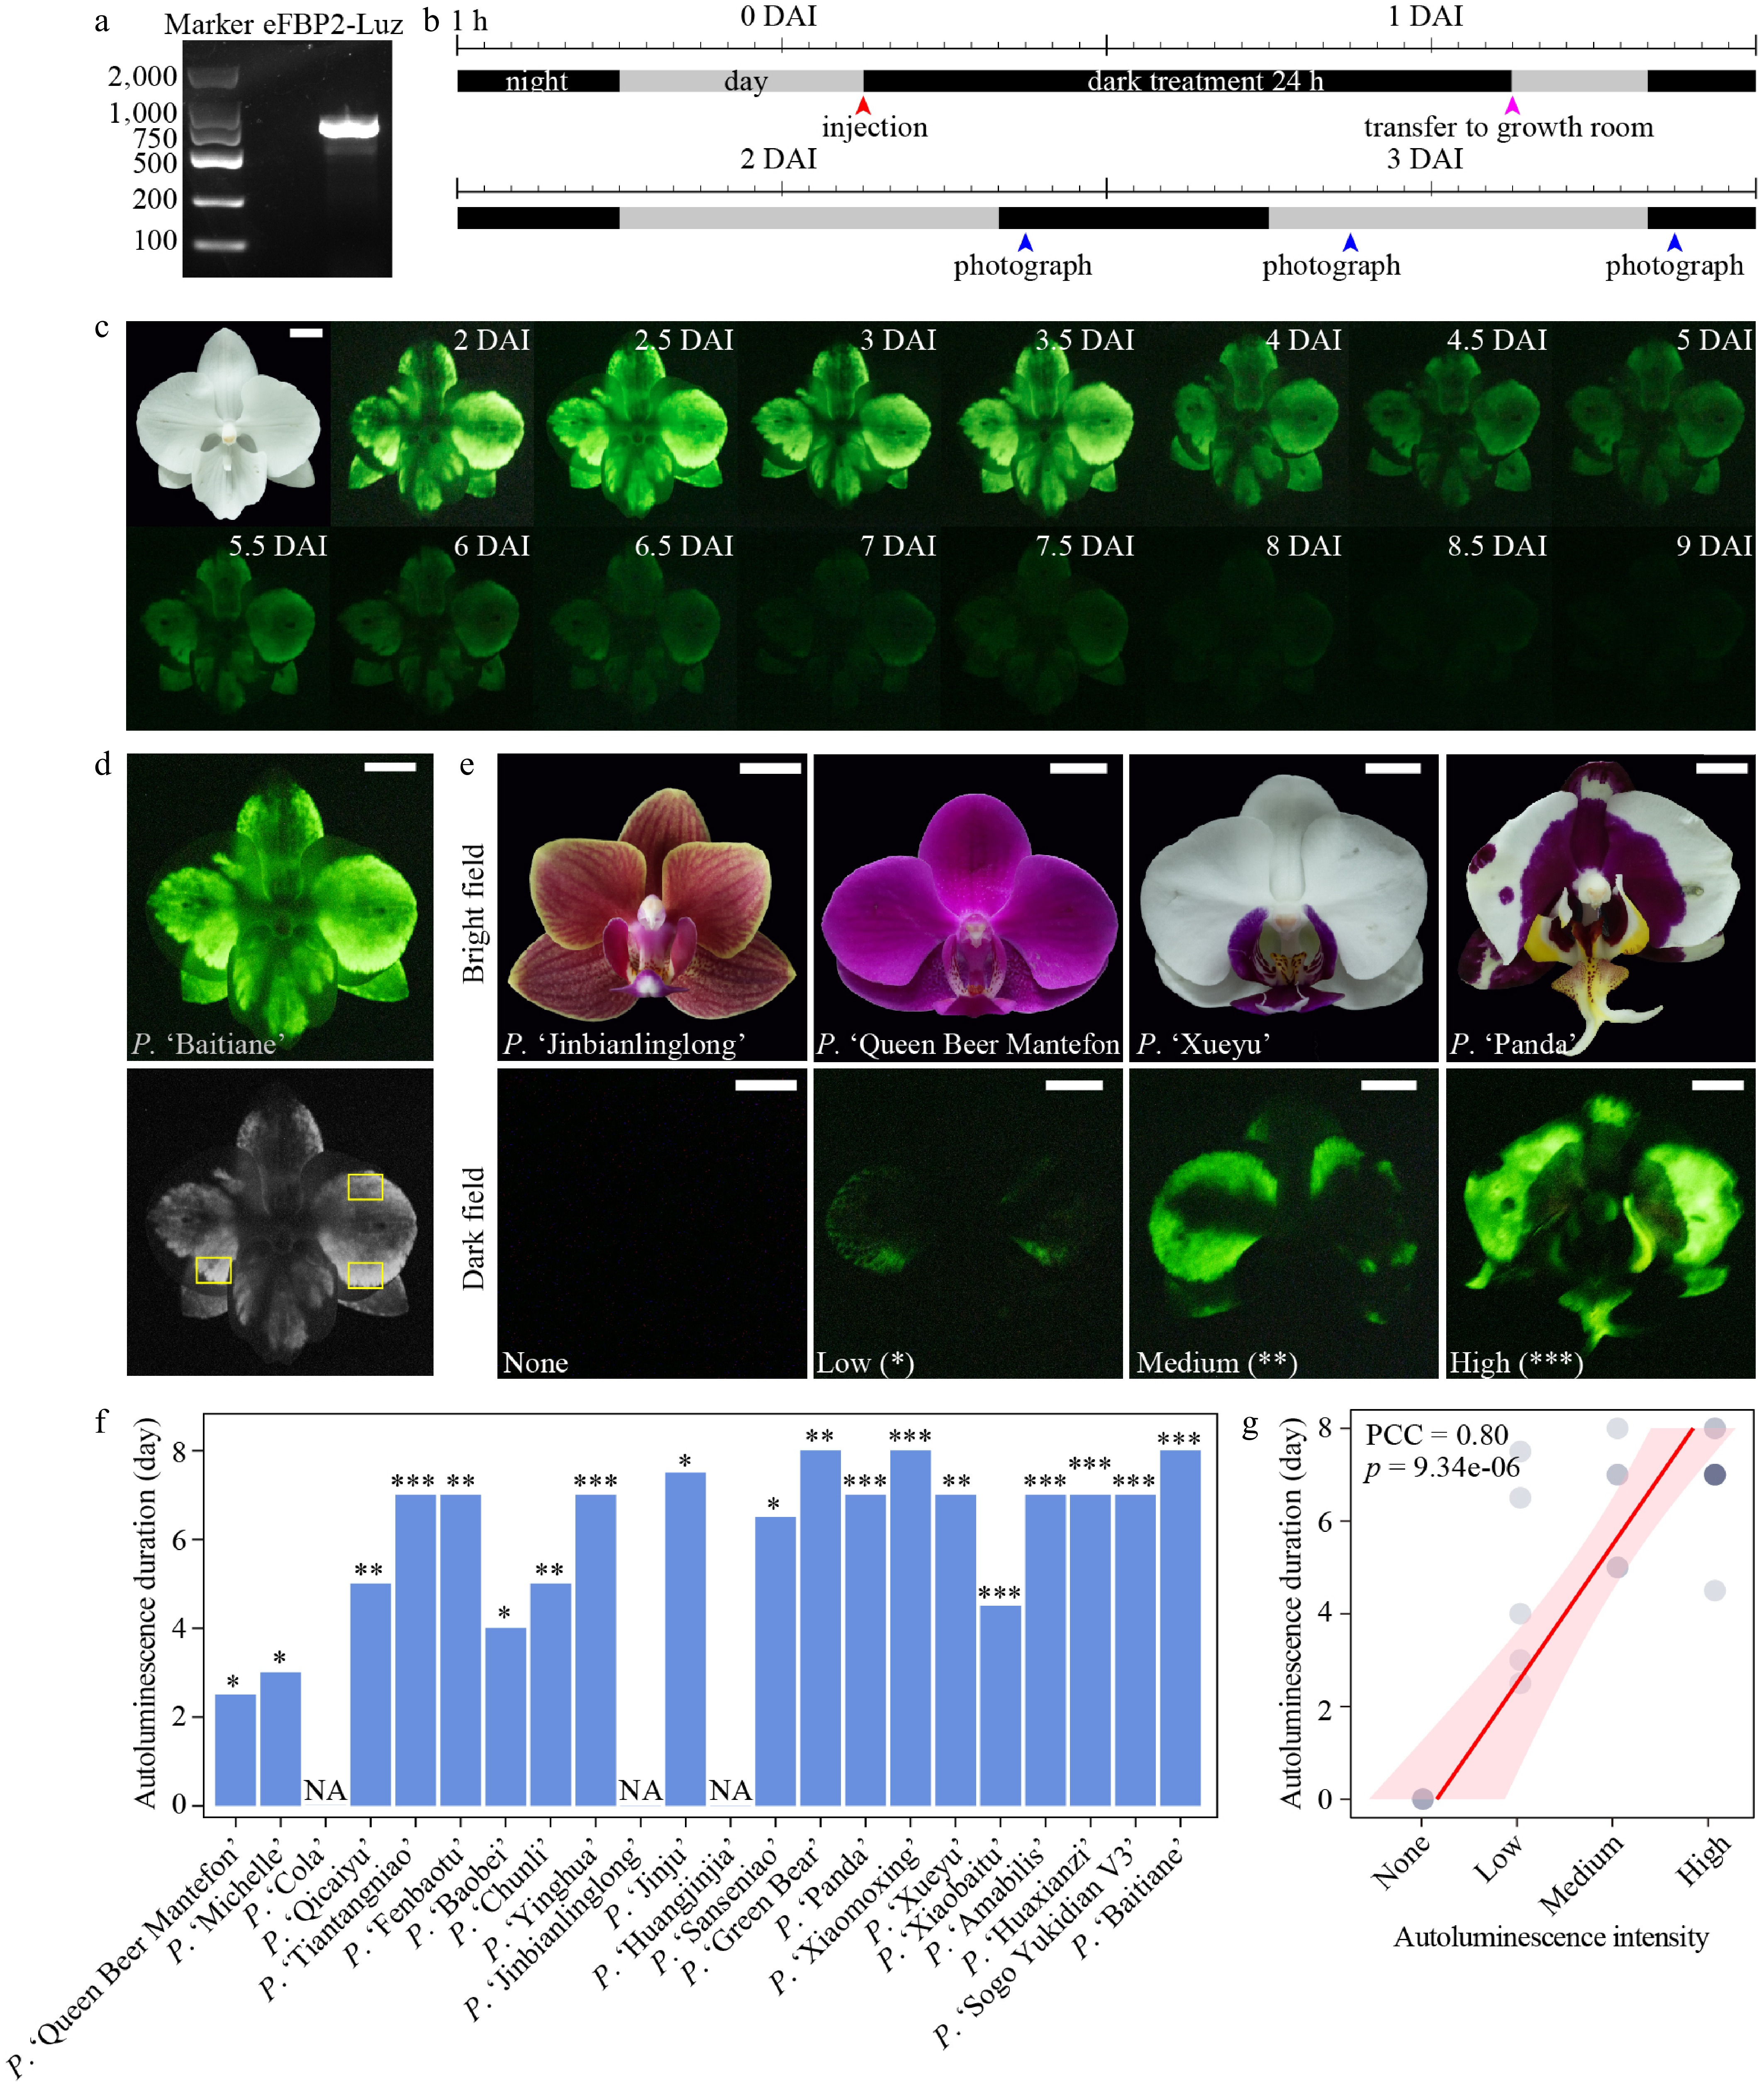
Figure 1.
Measure of autoluminescence characteristics. (a) Gel electrophoresis image showing the PCR production of eFBP2-Luz. (b) Schematic timeline illustrating the schedule of the injection of eFBP2-containing inoculation solution, dark treatment, transfer to growth room, and photography. DAI: day after injection. (c) Bright-field image of P. 'Baitiane', and dark-field images taken every 12 h after eFBP2 transient transformation. (d) The dark-field image of P. 'Baitiane' and its corresponding grayscale image. Three yellow rectangles indicate the brightest regions measured for the grayscale values. (e) Bright- and dark-field images of four cultivars, representing those with no, low, medium, and high autoluminescence, respectively. (f) Autoluminescence duration of 22 Phalaenopsis cultivars. Asterisk above each bar denotes the autoluminescence intensity of the corresponding cultivar: low (*), medium (**), and high (***). NA: not applicable. (g) Correlation between autoluminescence intensity and duration. PCC: Pearson correlation coefficient. Scale bar: 1 cm.
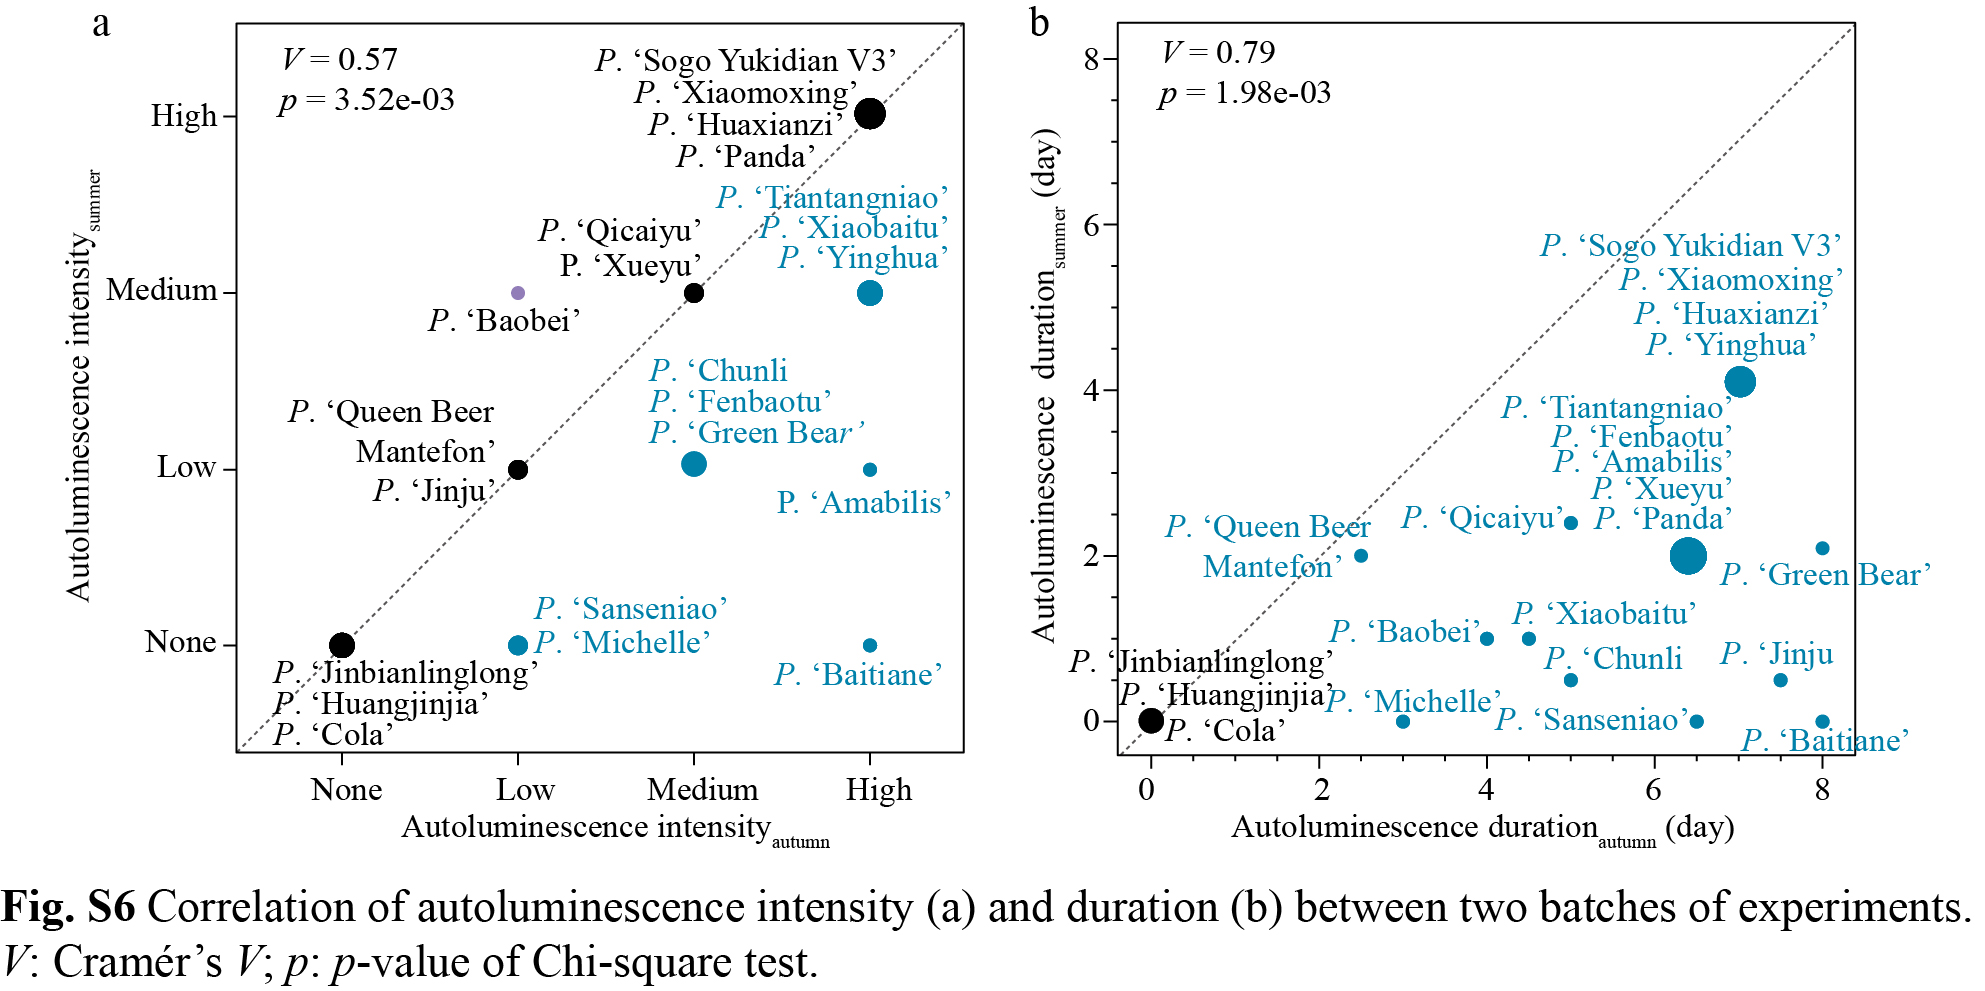
We found substantial differences in all three autoluminescence characteristics measured between two experimental seasons: capability, intensity, and duration. Among 22 cultivars (the remaining three cultivars were not available from the market in the autumn) examined in the autumn experiments, 9, 5, and 5 showed high, medium, and low bioluminescence intensity, respectively, while 3 failed to emit autoluminescence (Fig. 1f, Supplementary Fig. S2). On the other hand, among 25 cultivars examined in the summer experiments, the corresponding numbers were 4, 6, 7, and 8, respectively (Supplementary Figs S3, S5a). P. 'Cola', P. 'Jinbianlinglong', and P. 'Huangjinjia' were not autoluminescent regardless of room temperature. When comparing the autoluminescence characteristics of 22 overlapping cultivars, the autumn experiments had more cultivars with autoluminescence, higher intensity, and longer duration than the summer experiments (Supplementary Fig. S6). Particularly, P. 'Baitiane' failed to emit autoluminescence in all the summer experiments but had high intensity in the autumn ones; P. 'Michelle' and P. 'Sanseniao' were not autoluminescent in the summer experiments but had low intensity in the autumn experiments. Considering temperature was the only identified variable that differed between the two experimental seasons, although other uncontrolled factors cannot be entirely excluded, the temperature difference might be the most plausible explanation for the observed seasonal differences. Consistent with this, temperature effects on autoluminescence characteristics have also been documented in previous studies[10,12]. These findings underscore the need for optimizing experiments to identify suitable plant materials for genetic modification with FBPs. Nevertheless, the autoluminescence characteristics of these cultivars between two batches of experiments are positively correlated (Cramér's V ≥ 0.57, p of Chi-square test ≤ 3.52e-03, Supplementary Fig. S6). Unless otherwise specified, we focused on the results of autumn experiments to facilitate the following analyses.
The content of caffeic acid and tyrosine had limited effects on autoluminescence characteristics
-
Considering that the eFBP2 system used caffeic acid as the substrate to synthesize hispidin, and integrated the Rhodotorula glutinis TAL and HpaB, HpaC to convert tyrosine to caffeic acid[15], we asked whether the autoluminescence characteristics are mainly determined by the content of caffeic acid and tyrosine in floral organs. Given that flowers that were partially open or newly open (stage S3) tended to have higher autoluminescence intensity (Fig. 2a, Supplementary Table S1), we measured the content of these two compounds in petals at S3 for six representative cultivars without eFBP2 treatment (Fig. 2b, c, Methods). For P. 'Amabilis', petals at S4 and S5 were also examined to assess the dynamic fluctuation of tyrosine and caffeic acid content during flower development.
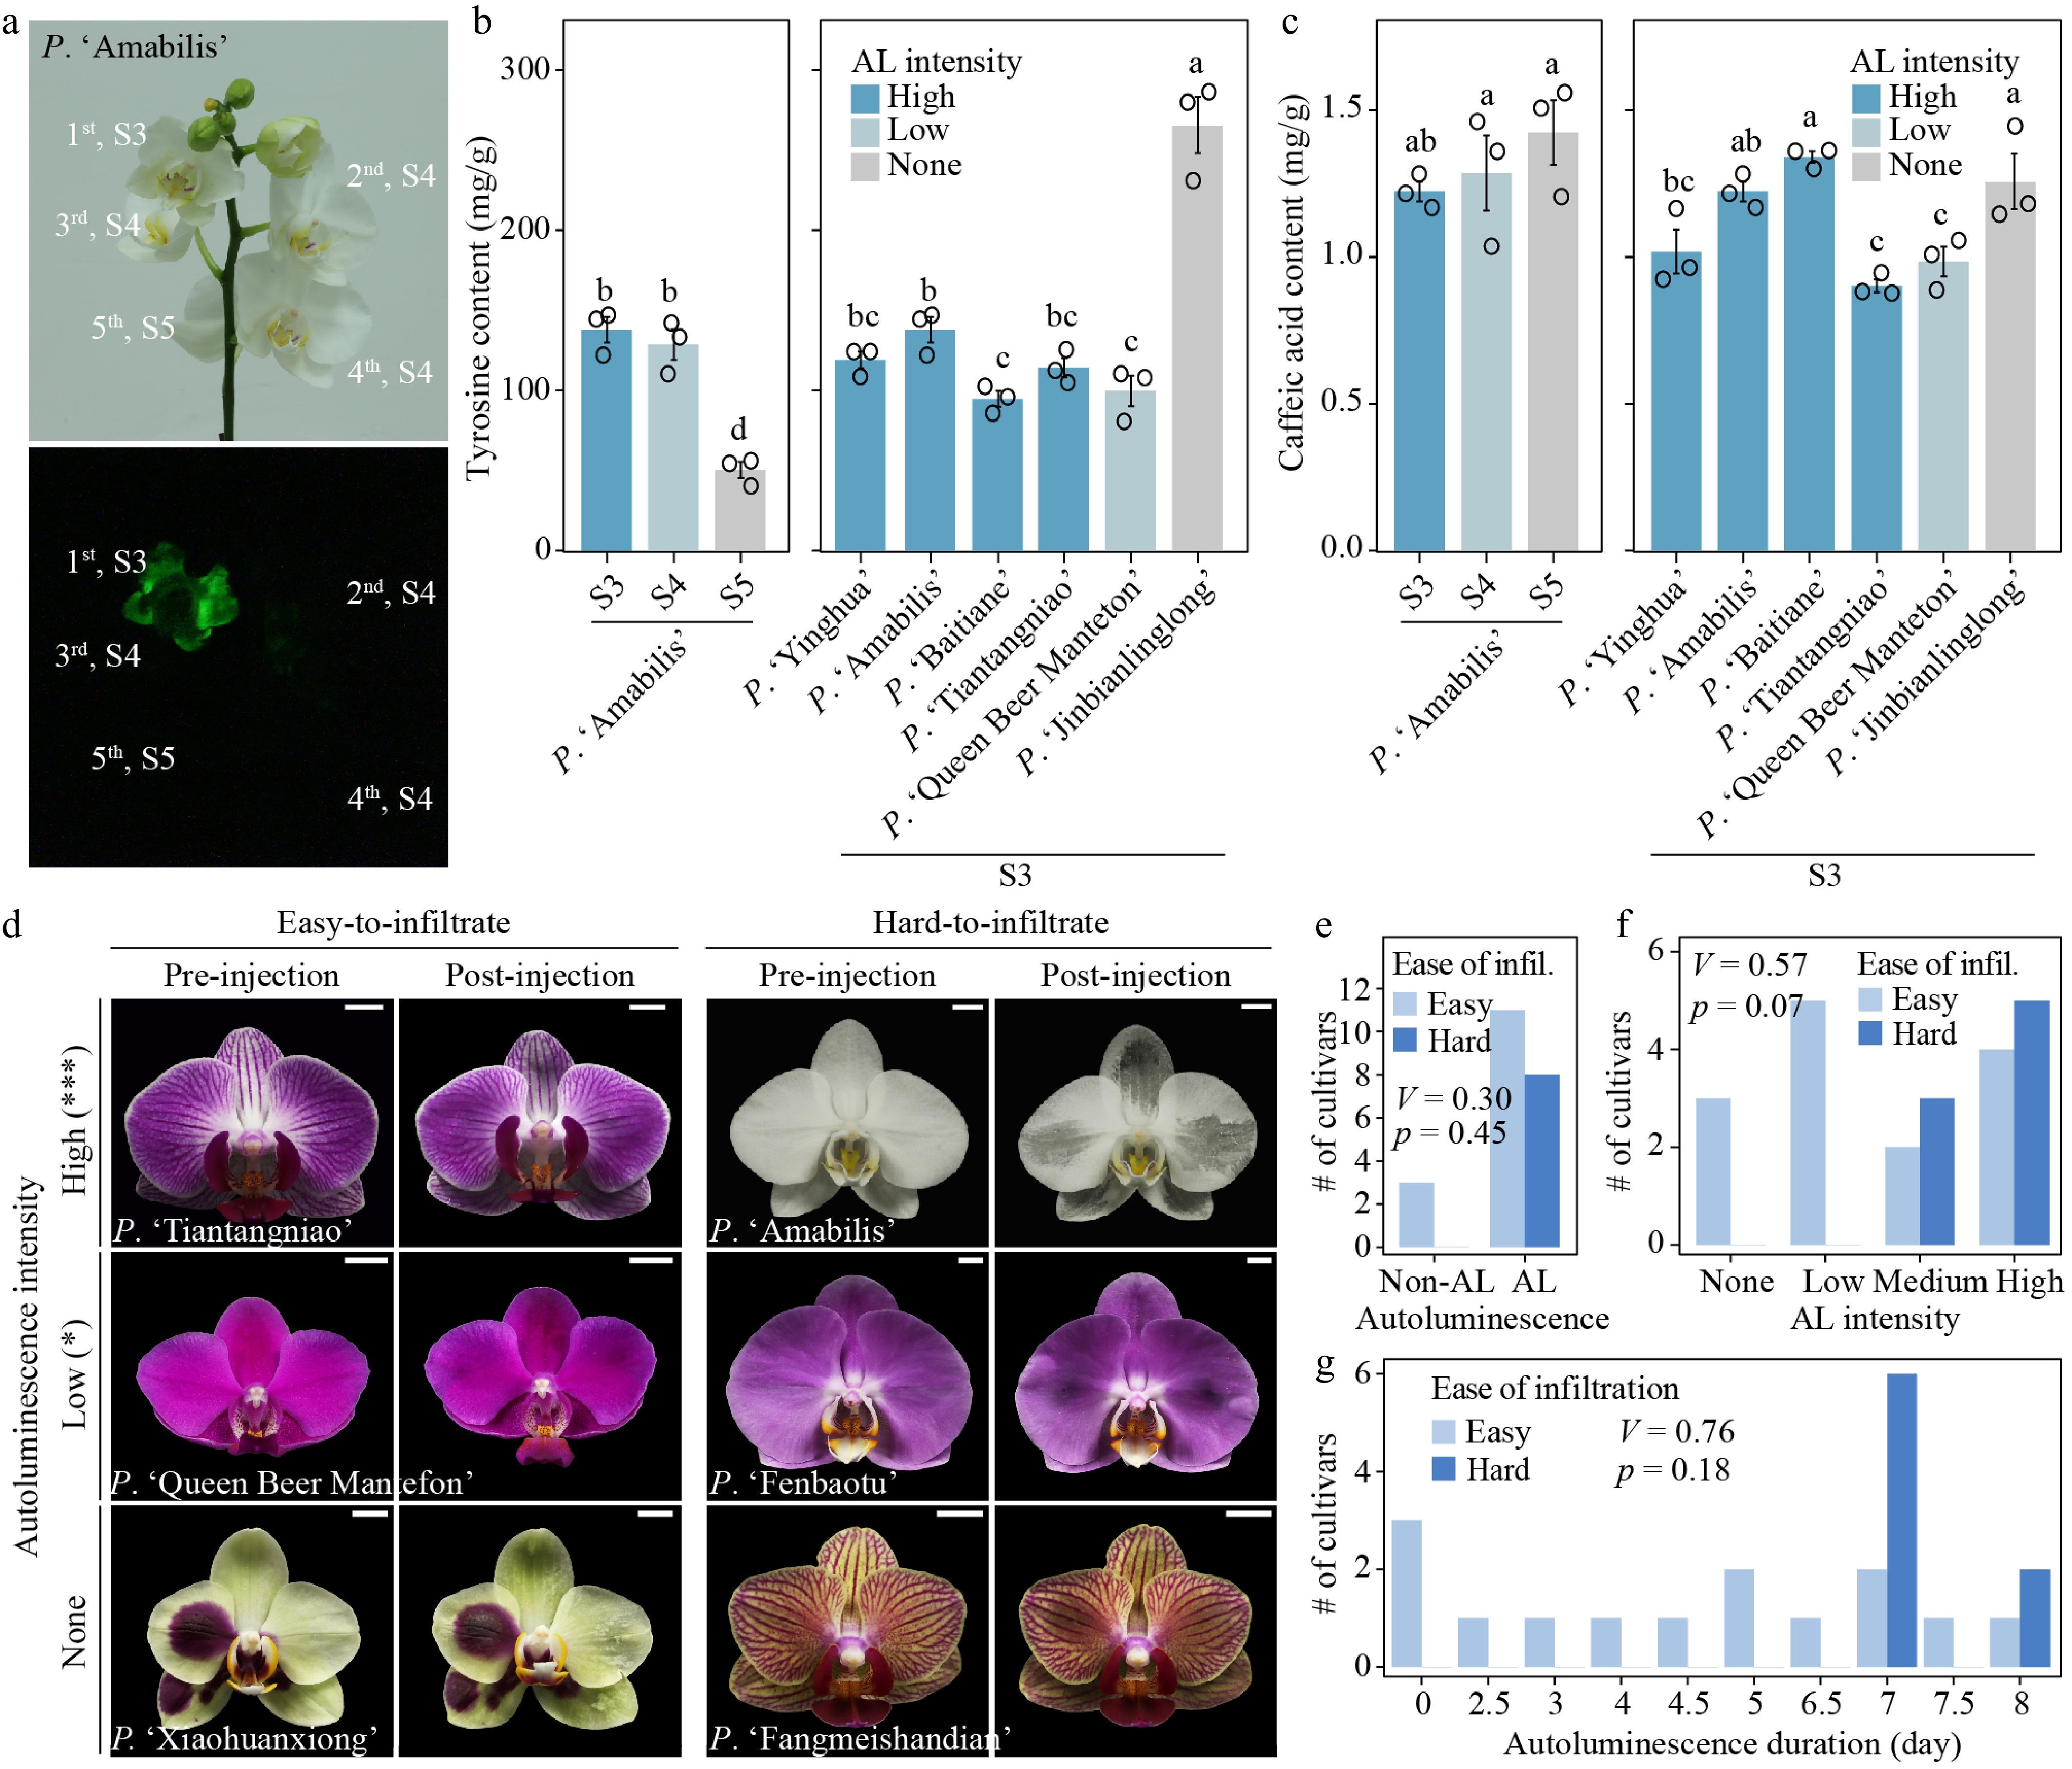
Figure 2.
Limited influences of caffeic acid and tyrosine content and the ease of infiltration on autoluminescence characteristics. (a) Bright-field (upper) and corresponding dark-field (lower) images of P. 'Amabilis' inflorescence, illustrating the position-dependent autoluminescence after eFBP2 transformation. (b), (c) The tyrosine and caffeic acid content in petals of six cultivars at stages S3, S4, and S5. Error bars: ± standard deviation (n = 3). Different lowercase letters indicate significant differences between groups (ANOVA, p < 0.05). (d) Images of six cultivars—with no (None), low (*) or high (***) autoluminescence intensity—before and after being injected with eFBP2-containing inoculation solution, showing differences in the ease of liquid infiltration into floral tissues. Results of the remaining 19 cultivars were shown in Supplementary Fig. S7. Scale bar: 1 cm. (e)–(g) Correlation between the ease of infiltration and autoluminescence capability (e), intensity (f), duration (g). AL: autoluminescence; V: Cramér's V; p: p value of Chi-square test.
Surprisingly, the content of these two compounds was not correlated with autoluminescence characteristics (Fig. 2b, c): the non-autoluminescent cultivar P. 'Jinbianlinglong' had higher content of tyrosine than all the other four cultivars with high autoluminescence intensity; the content of caffeic acid in P. 'Jinbianlinglong' was also higher than or comparable with those in other cultivars. In addition, although the tyrosine content decreased along flower development in P. 'Amabilis' (Fig. 2b), the caffeic acid content increased gradually (Fig. 2c). A possible explanation is that eFBP2 rewires the tyrosine → caffeic acid → hispidin → luciferin metabolic flux, and the caffeic acid and tyrosine contents in wild-type flowers may not fully represent the metabolite pool available for the hispidin and luciferin synthesis during transient transformation. These results suggest that other floral traits, rather than the substrate content in floral organs, determine the autoluminescence characteristics of Phalaenopsis orchids after eFBP2 transformation.
Relationships between autoluminescence characteristics and the ease of liquid infiltration into floral organs
-
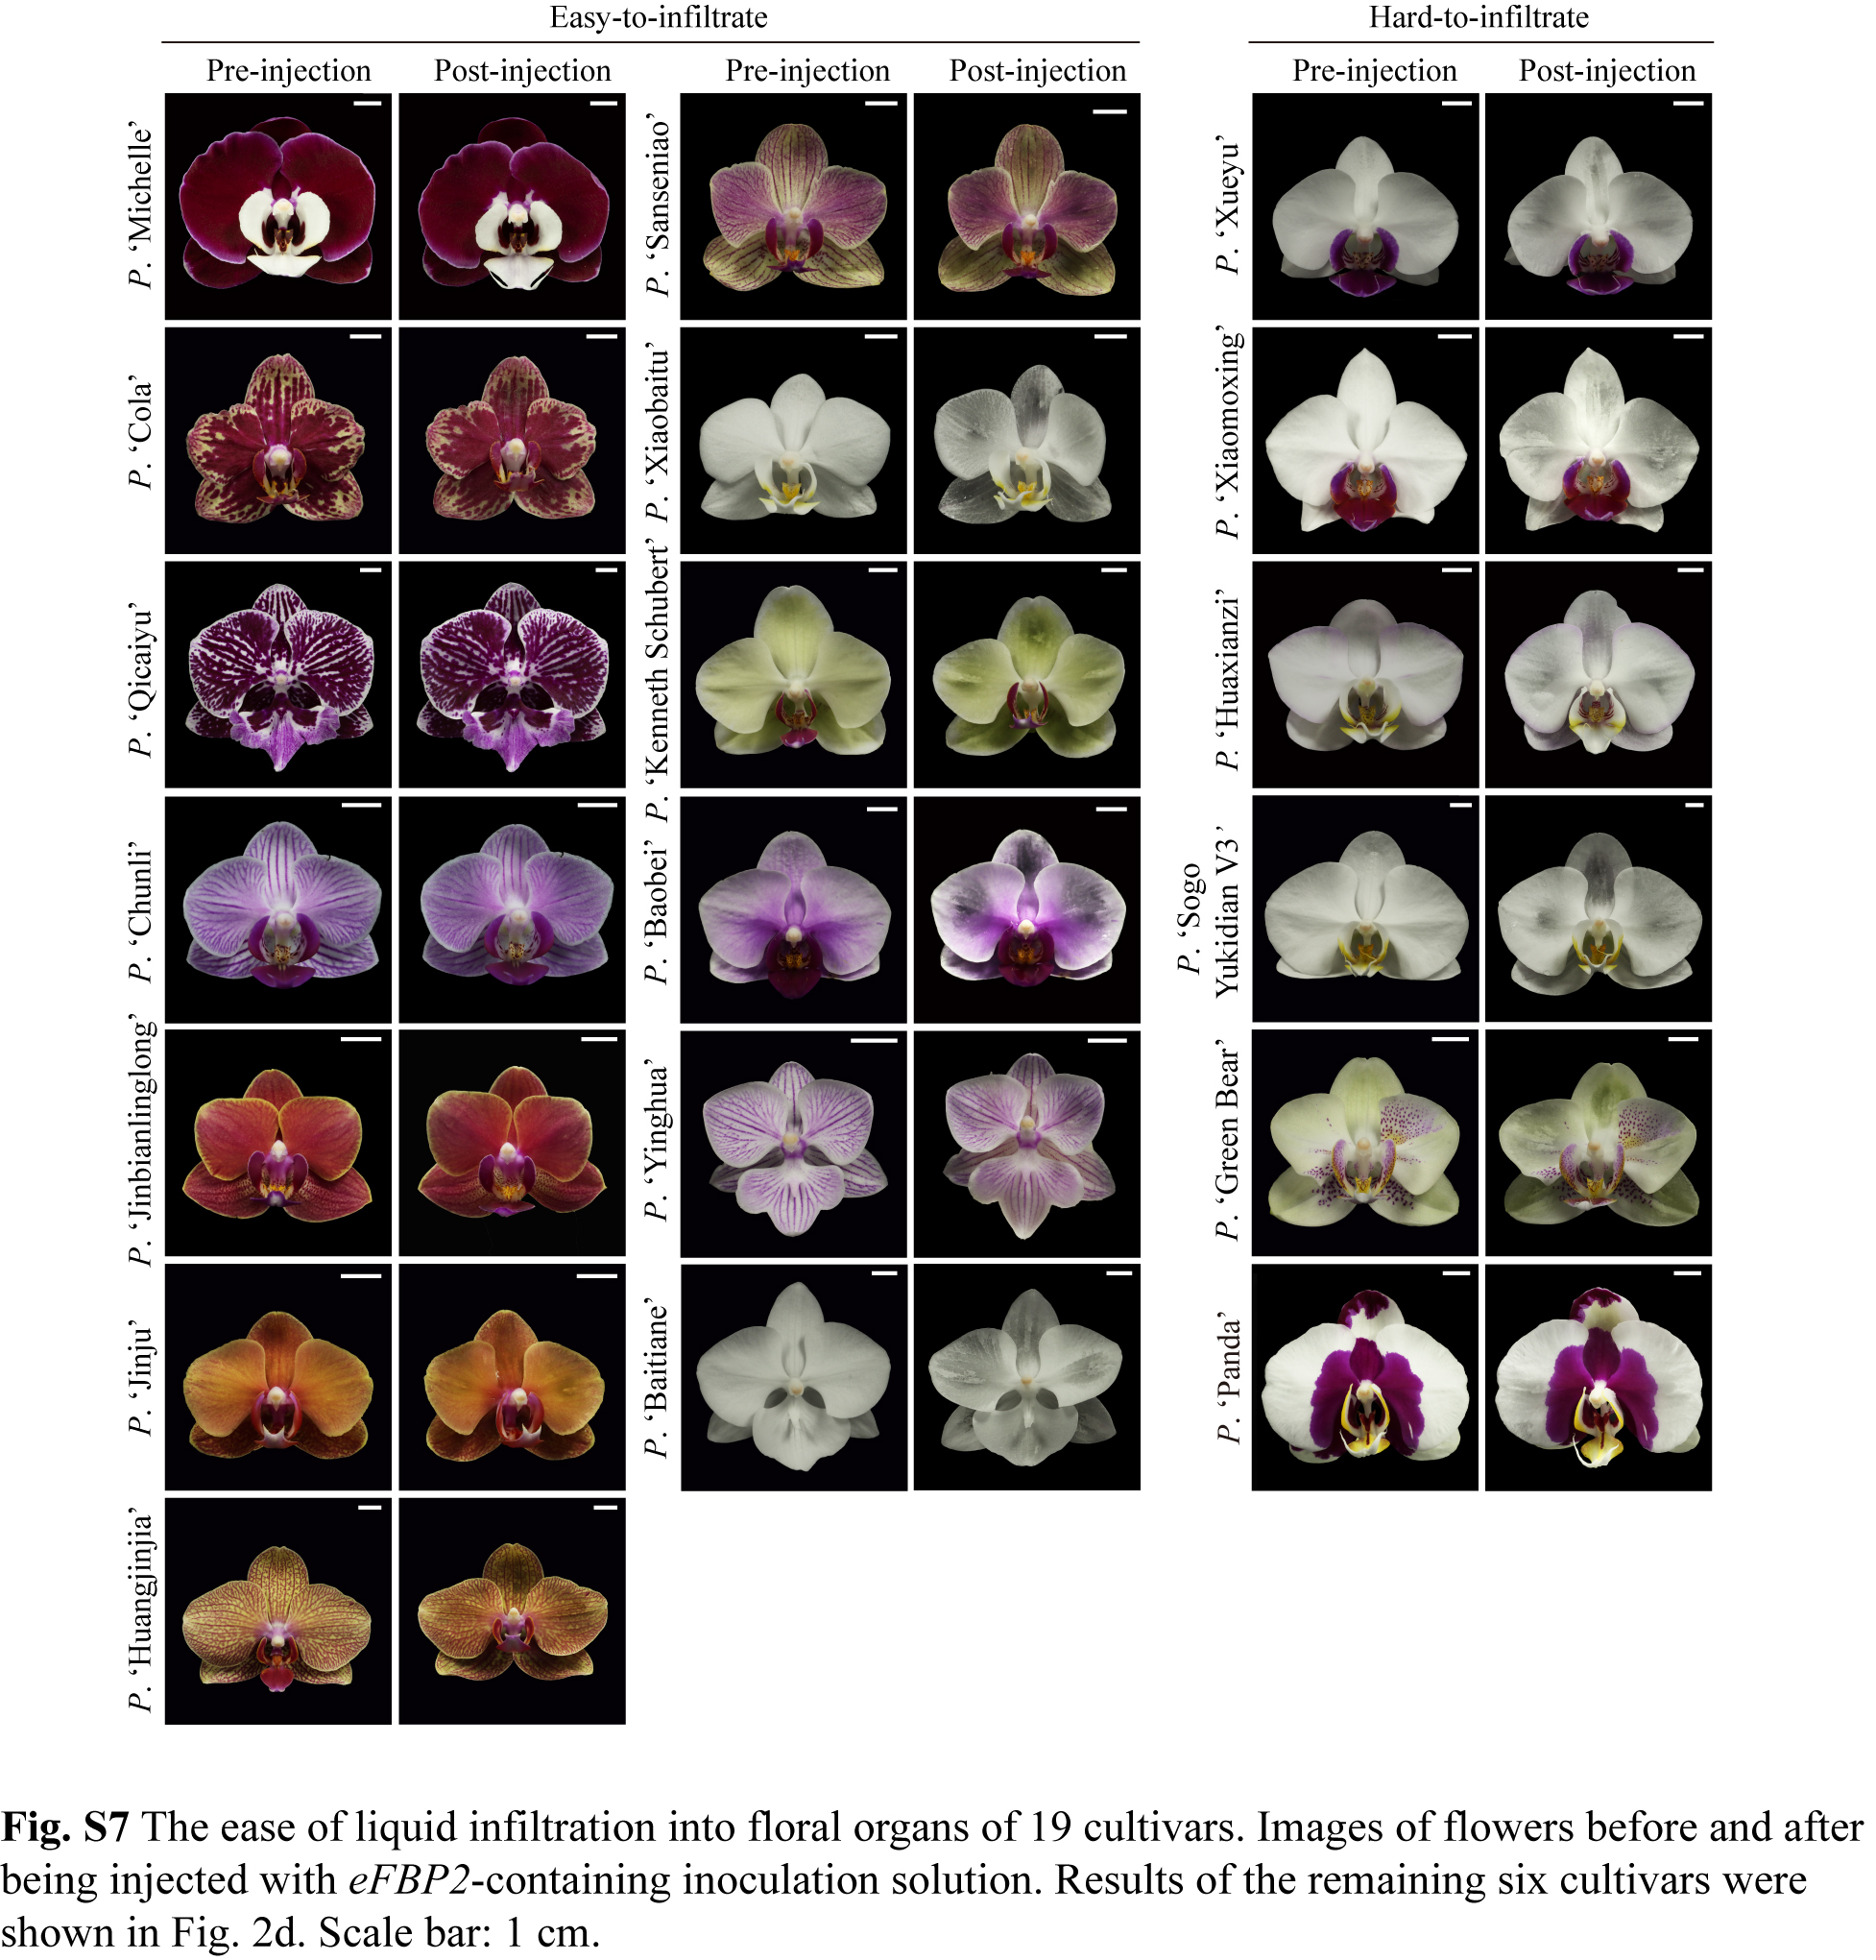
During the experiments, we noticed that floral organs of different cultivars differed in the ease of infiltration with the inoculation solution. In 16 cultivars, the inoculation solution spread readily and evenly throughout the tissues after injection ('easy-to-infiltrate'), while in the other nine cultivars, the inoculation solution tended to remain localized near the injection site ('hard-to-infiltrate') (Fig. 2d, Supplementary Fig. S7). The variation in ease of infiltration reflected the differences in cell composition and arrangement in these floral organs, which might influence the diffusion of eFBP2-containing bacteria in these organs as well. For the hard-to-infiltrate cultivars, the liquid diffusion area varied across infiltration events and cultivars, and this area itself was difficult to measure accurately. Therefore, we did not assign further gradations among these hard-to-infiltrate cultivars, but adopted a binary classification—easy vs hard to infiltrate. In addition, to ensure a valid comparison, more injection attempts were performed for these hard-to-infiltrate cultivars to achieve a relatively uniform distribution of inoculation solution, which may diminish the vitality of floral organs and consequently lead to a reduction in autoluminescence potential. We detected strong (Cramér's V = 0.57 and 0.76 for autoluminescence intensity and duration, respectively), but not significant (p value = 0.07 and 0.18), correlations between the ease of infiltration and autoluminescence characteristics (Fig. 2e–g). Surprisingly, the eight hard-to-infiltrate cultivars tended to show medium or high autoluminescence intensity lasting 7–8 d, whereas the remaining 14 easy-to-infiltrate cultivars exhibited more even distribution across intensity and duration levels. This is contrary to our initial hypothesis—harder to infiltrate, more injections, lower vitality, and lower autoluminescence potential. These results suggest that the observed variation in autoluminescence characteristics may not be primarily attributable to treatment differences, at least under our experimental conditions.
Correlation between autoluminescence characteristics and other floral traits
Flower size
-
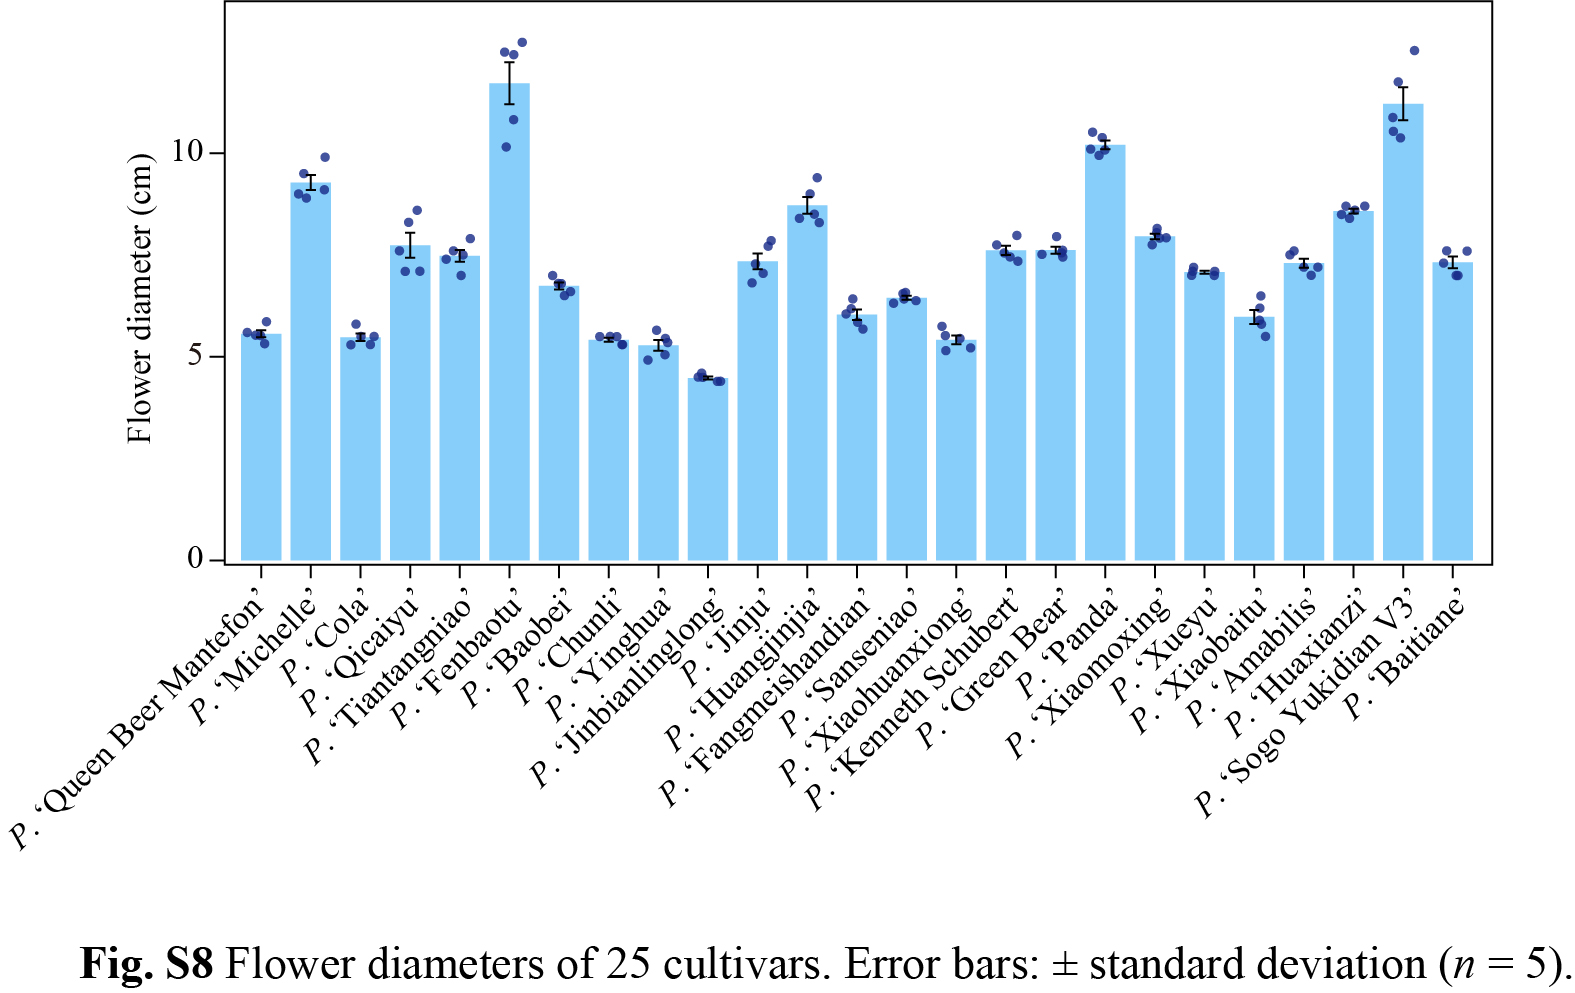
Among 25 cultivars, three, 12 and ten had large (diameter > 10 cm), medium (7 cm ≤ diameter ≤ 10 cm) and small (< 7 cm) flowers, respectively (Supplementary Fig. S8, Supplementary Tables S2, S3). We identified weak to moderate but not significant correlations (Cramér's V ≤ 0.65, p ≥ 0.44) between autoluminescence characteristics and flower sizes (Fig. 3a–d) for 22 cultivars examined in the autumn experiments. All three cultivars with large flowers had medium or high autoluminescence intensity lasting 7 d. Flowers with medium sizes also tended to have higher intensity and longer duration, while those with small sizes exhibited relatively even distribution across intensity and duration levels. A similar tendency was also observed in the summer experiments (Supplementary Fig. S5f–h).
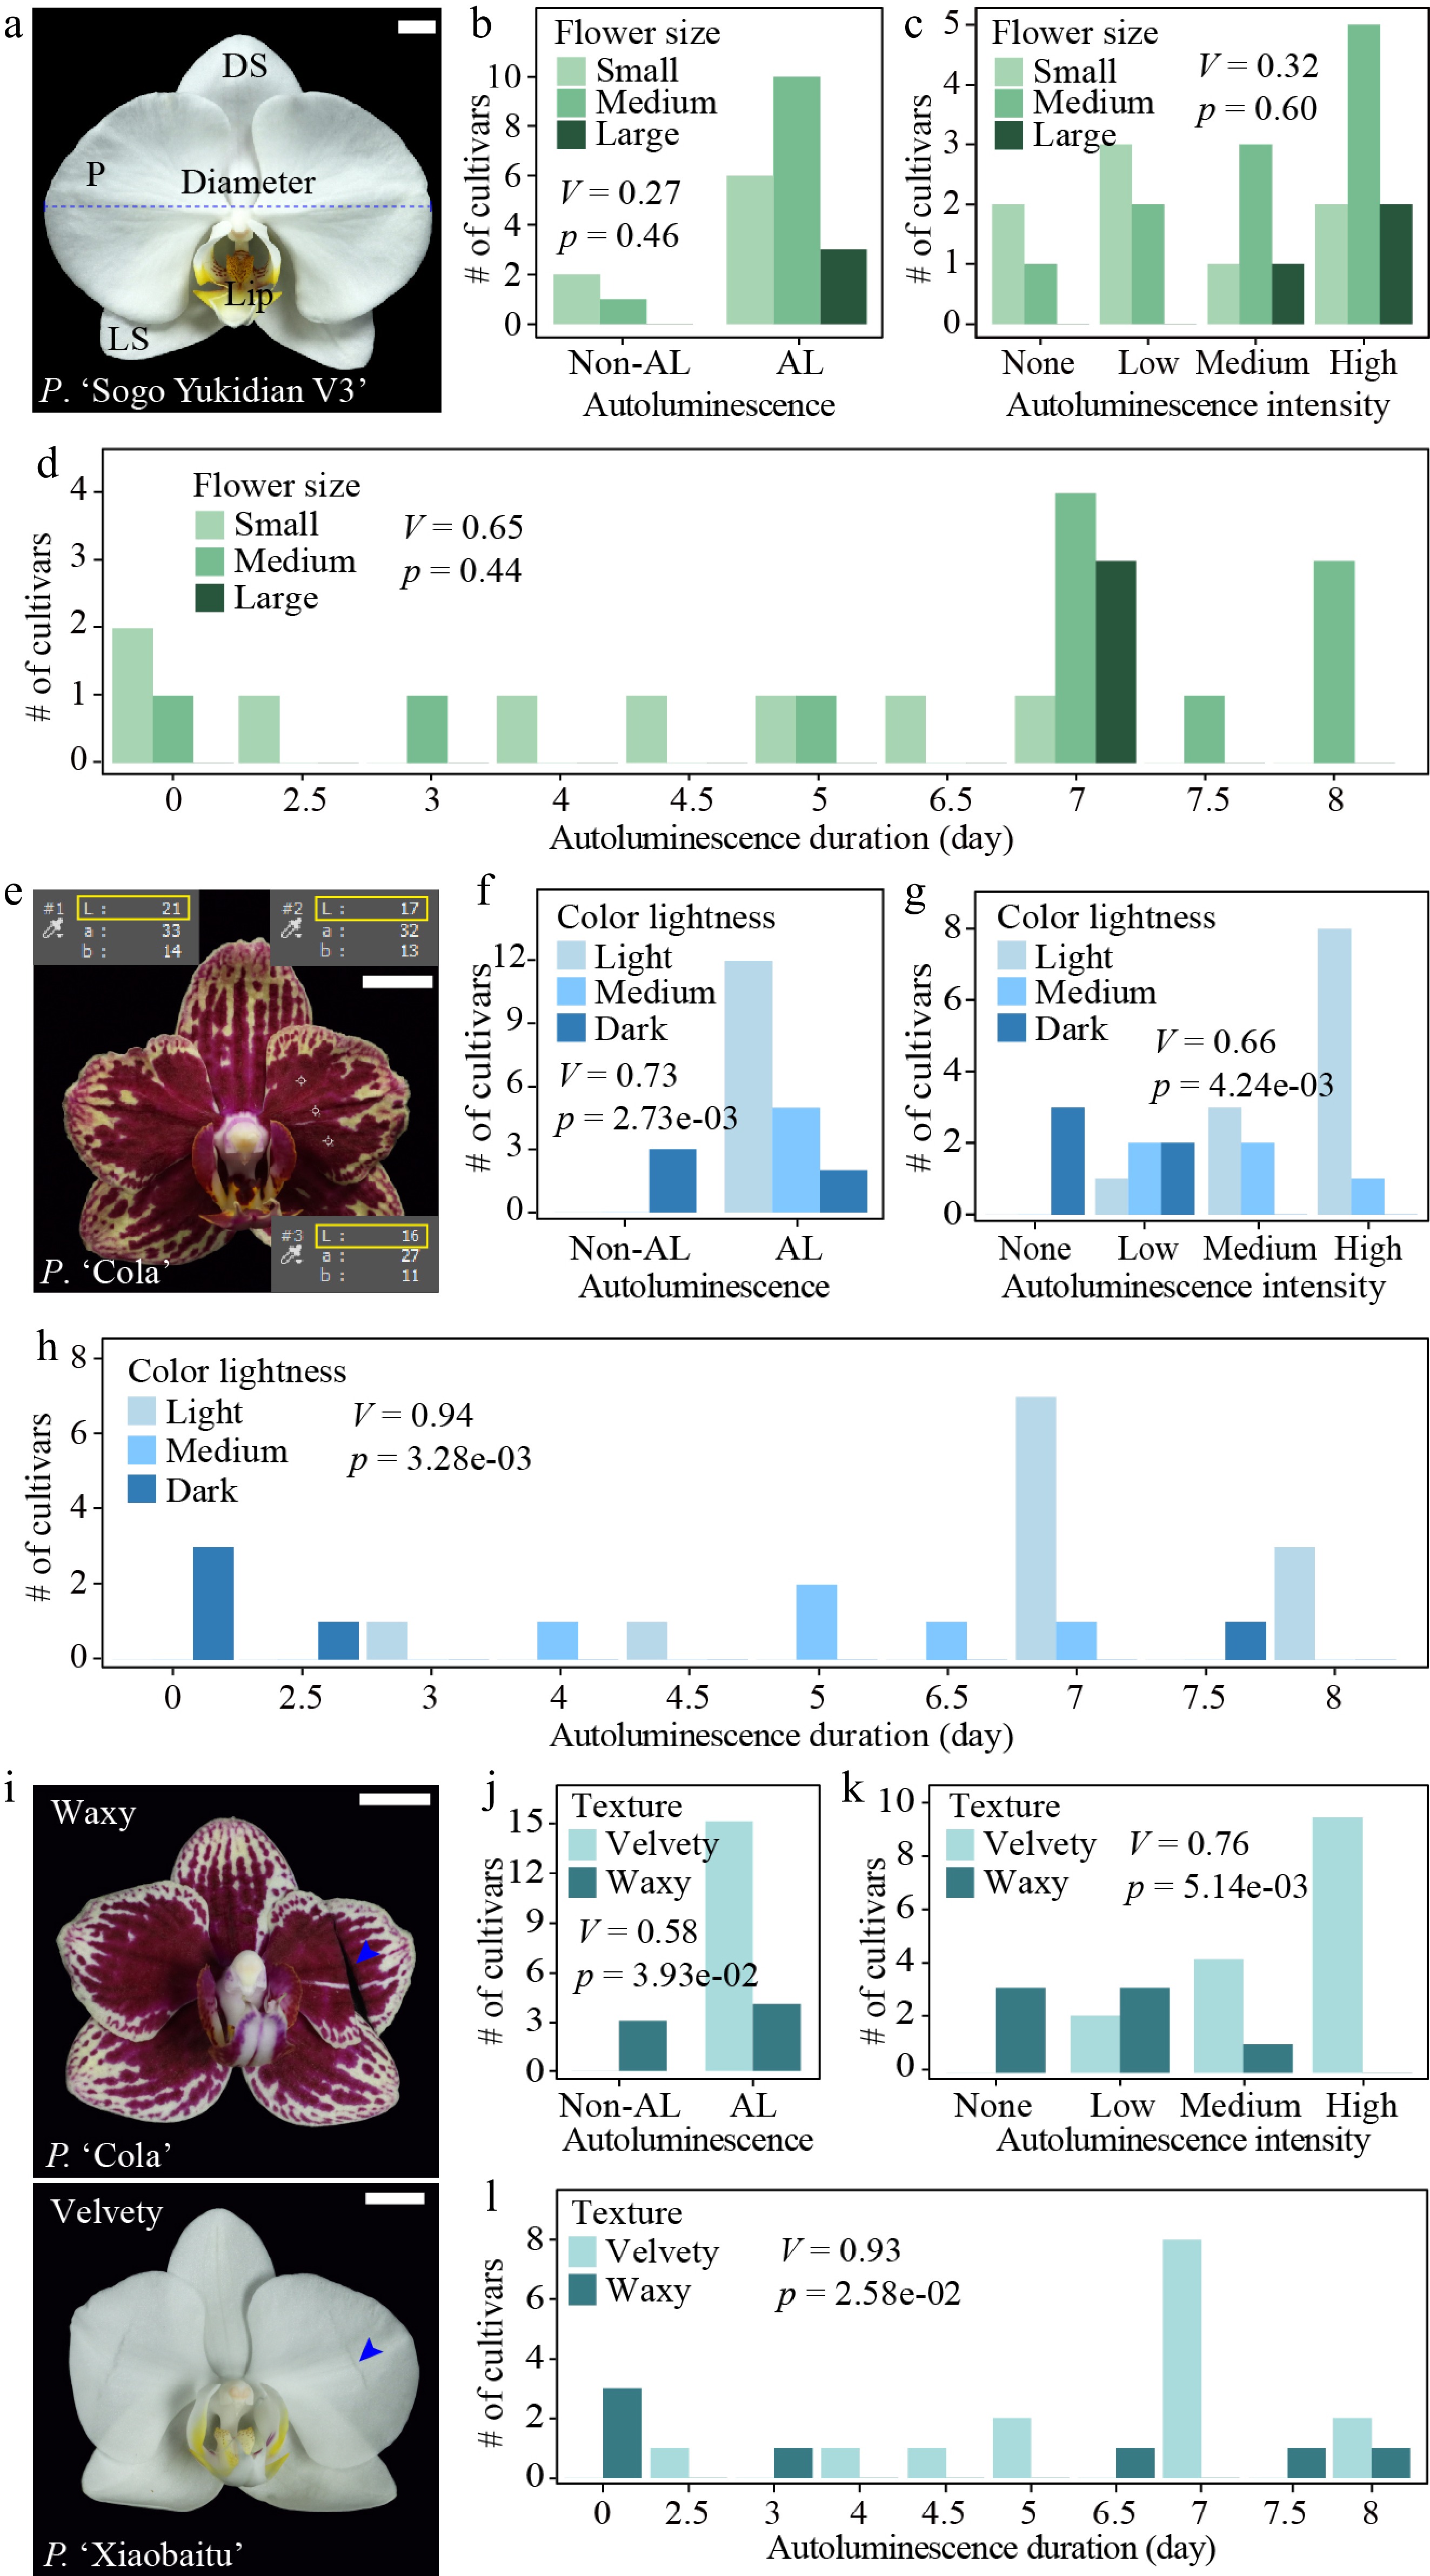
Figure 3.
Correlation between autoluminescence characteristics and three floral traits. (a) Image of P. 'Sogo Yukidian V3' showing how the flower diameter (flower size) is measured. DS: dorsal sepal; P: petal; LS: lateral sepal. (b)–(d) Correlation between the autoluminescence characteristics and flower sizes. (e) Image of P. 'Cola' showing the measurement of color lightness (L) of three representative regions on its petals. (f)–(h) Correlation between the autoluminescence characteristics and color lightness of petals. (i) Images of P. 'Cola' and P. 'Xiaobaitu' after gentle folding, illustrating cultivars with waxy and velvety petals, respectively. (j)–(l) Correlation between the autoluminescence characteristics and texture of floral organs. AL: autoluminescence; V: Cramér's V; p: p value of Chi-square test. Scale bar: 1 cm.
Floral color lightness
-
Considering the extraordinary complexity of color patterning in Phalaenopsis orchids (Supplementary Fig. S1a), to facilitate the analysis, we measured the color lightness of these flowers (Fig. 3e, Methods) instead of the color per se. Flowers with light colors (average Lab values ≥ 70) tended to be autoluminescent, with higher intensity and longer durations (Cramér's V ≥ 0.66, p ≤ 4.24e-03, Fig. 3f–h). Particularly, in flowers with venation-associated stripes—such as those of P. 'Yinghua', P. 'Tiantangniao', and P. 'Qicaiyu', and flowers with patches—such as P. 'Panda', the dark colored stripes and patches tended to have much lower autoluminescence intensity than their neighboring regions (Supplementary Fig. S2). In flowers of P. 'Fenbaotu', only the base of sepals and petals and the whiskers had detectable autoluminescence, where the colors were lighter than other regions (Supplementary Fig. S2). In addition, the white sepals and petals of P. 'Xueyu' were autoluminescent while the violet lip was not; the white lip of P. 'Michelle', rather than the dark red sepals and petals, had detectable autoluminescence. These results suggest that dark colors may obstruct the emission of autoluminescence—a possibility that requires cytological and spectral absorbance data to confirm—and that color lightness of the floral organs is a relatively good indicator of autoluminescence potential after genetic modification. There were also exceptions, such as flowers of P. 'Queen Beer Mantefon', which were dark purple across the whole flower but had detectable, albeit weak, autoluminescence, indicating that other factors should also contribute to the autoluminescence characteristics.
Floral organ texture
-
Floral organs in Phalaenopsis orchids can be roughly classified into waxy and velvety ones according to their textures[17]. Waxy organs are normally thicker and more brittle, covered with thicker cuticles, compared with velvety ones[17,25]. To simplify the analysis, we classified these 25 cultivars into waxy and velvety based solely on the tendency of their petals to break when gently folded (Fig. 3i, Supplementary Table S2). We found strong and significant correlations (Cramér's V ≥ 0.58, p ≤ 2.58e-02) between all three autoluminescence characteristics and the floral organ texture (Fig. 3j–l). All 15 cultivars with velvety floral organs were autoluminescent after eFBP2 transformation, nine of which had high intensity (Fig. 3j, k). In contrast, seven cultivars with waxy floral organs were not autoluminescent (three) or had low intensity (four). A similar correlation was also observed for the summer experiments (Supplementary Fig. S5l–n). These results suggest that the thick cuticle on the surface of floral organs may also hinder the emission of autoluminescence, which should be taken into account in the selection of suitable cultivars.
Epidermal cell types on floral organs
-
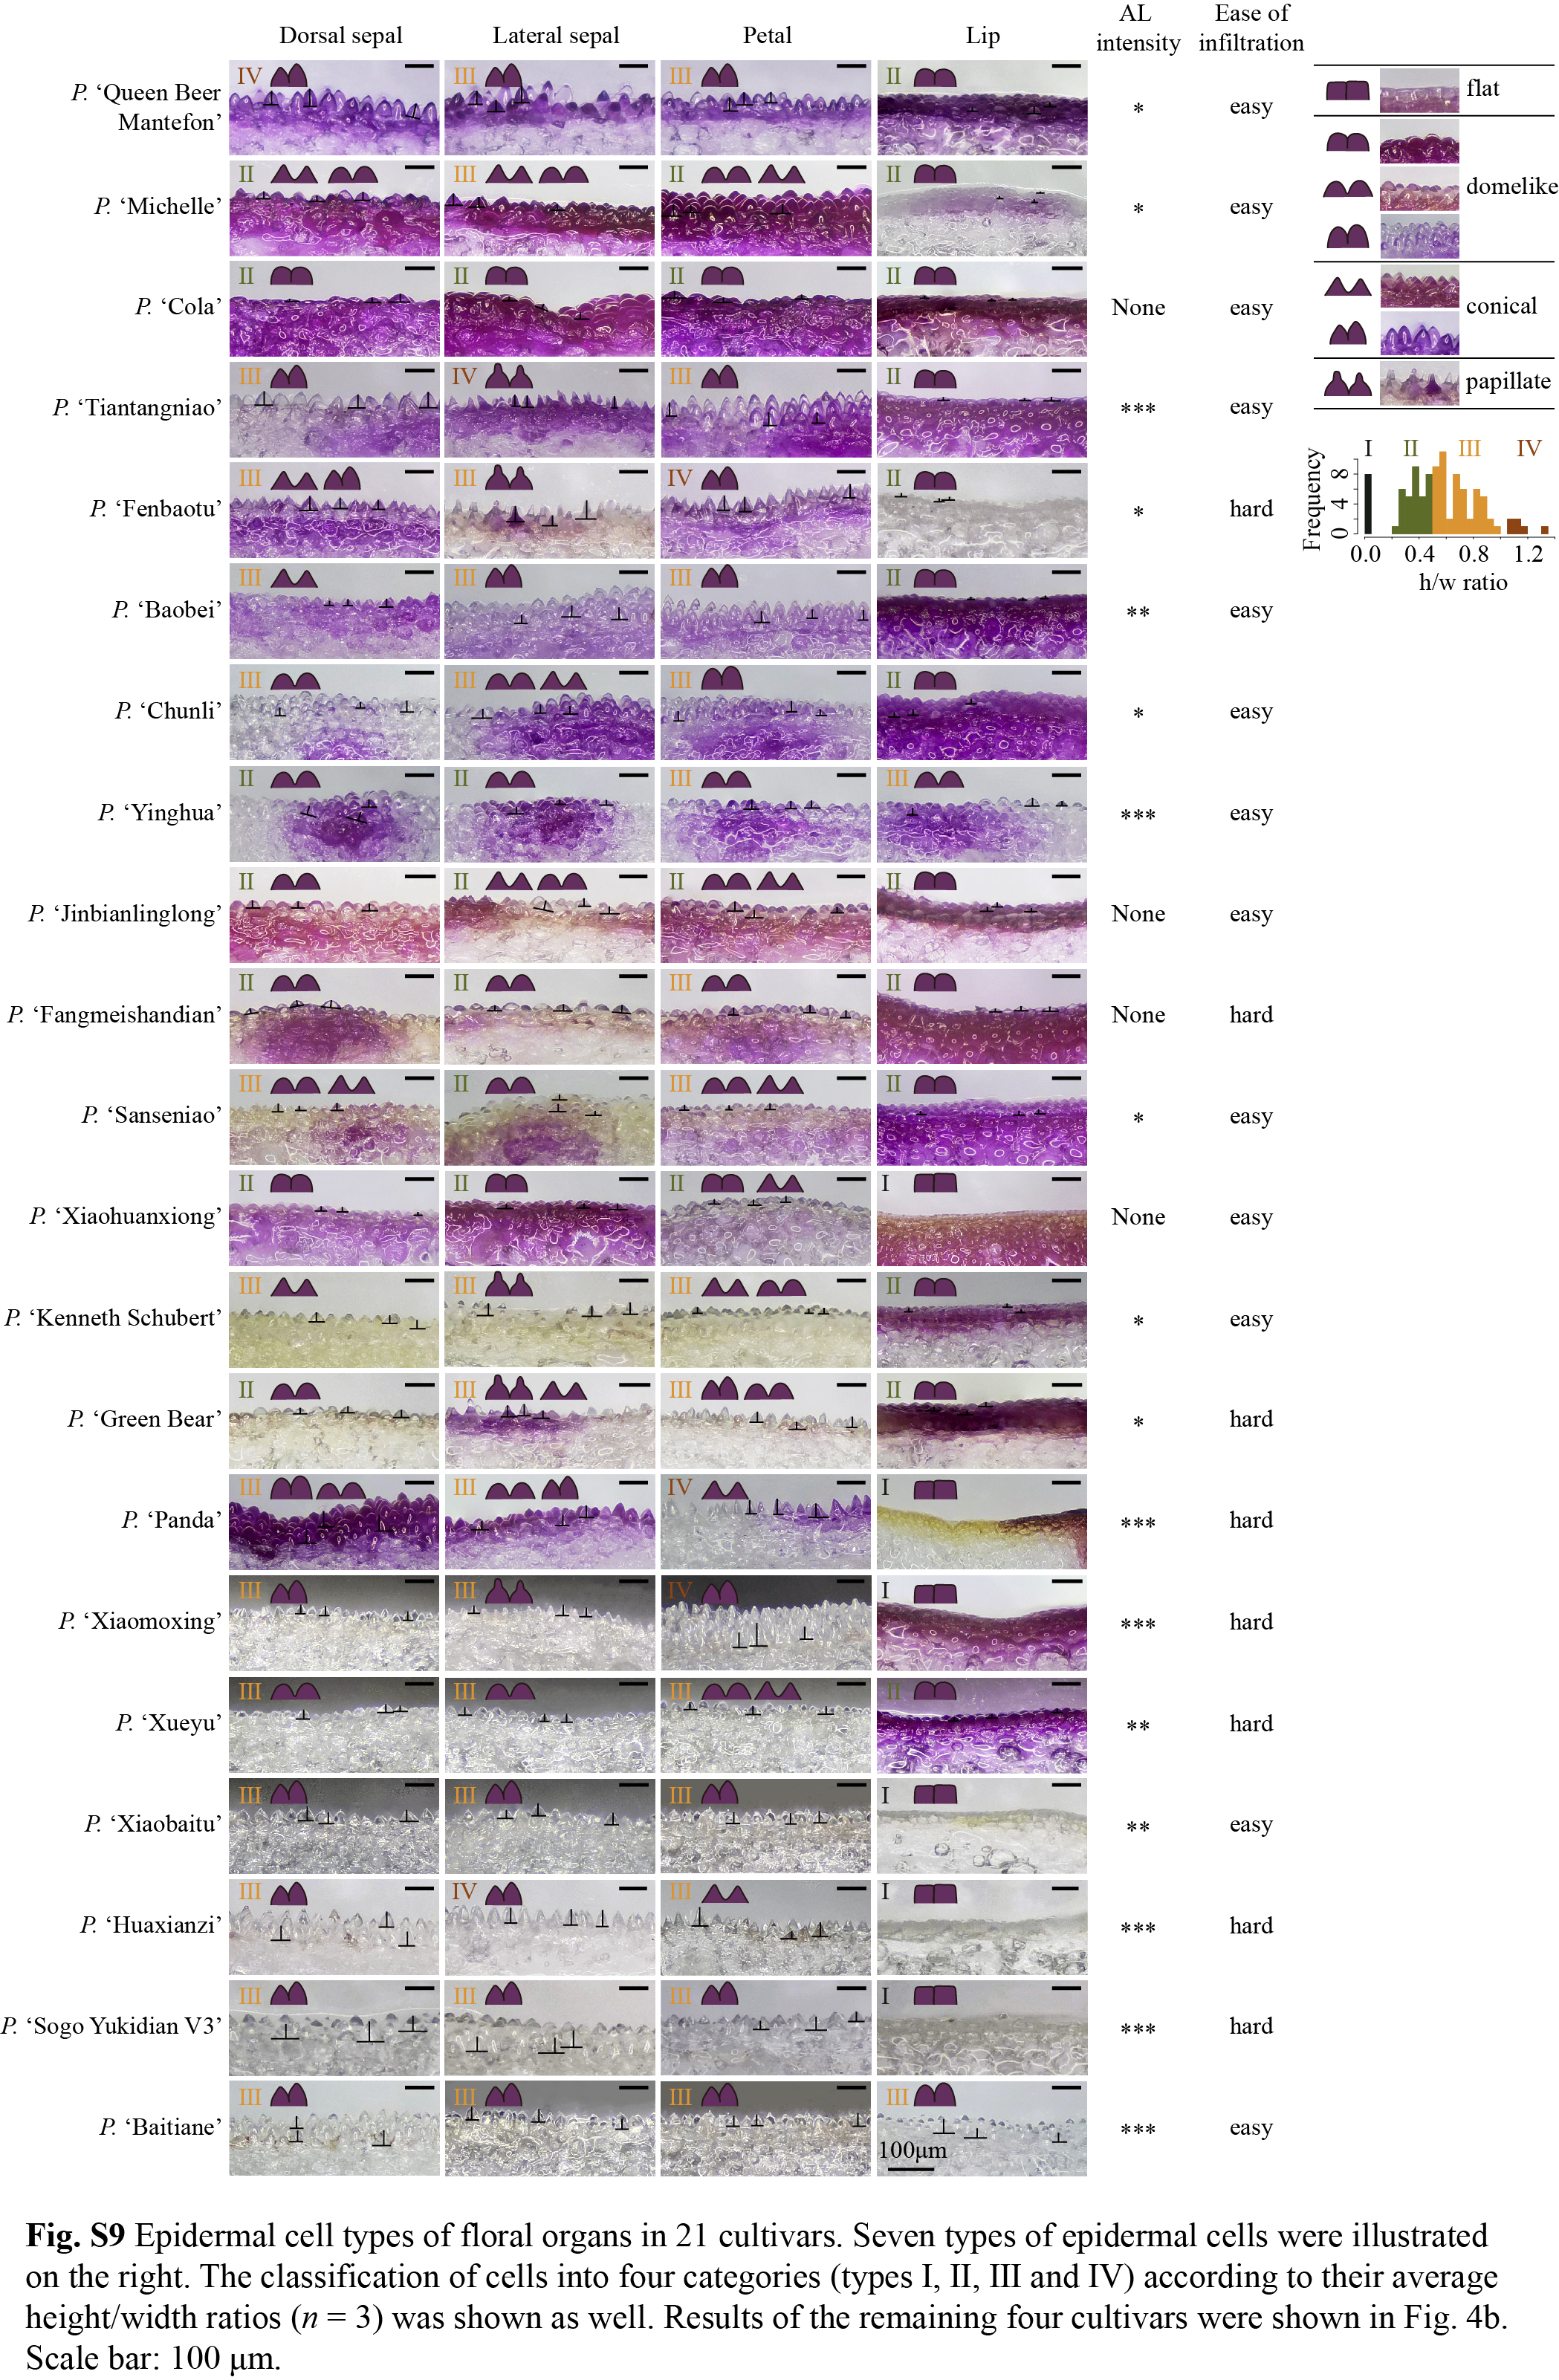
We examined the freehand sections of four types of perianth—dorsal and lateral sepals, petals, and the lip—and photographed the epidermal cell types in the center region of each organ (Fig. 4a). Given that only the autoluminescence characteristics on the adaxial surfaces of floral organs were recorded, we only examined the epidermal cells on the adaxial surfaces as well. Phalaenopsis cultivars examined in this study displayed extraordinary diversity in epidermal cell types (Fig. 4b, Supplementary Fig. S9). These cell types can be classified into several categories according to their shapes and height[26]: flat, domelike with different heights, conical with different shapes, and papillate. Different cell types may coexist in some cultivars, such as domelike and conical cells on the petals of P. 'Qicaiyu' (Fig. 4b). In addition, cells of these cultivars displayed a somewhat continuous range of shapes, making it difficult to classify them into distinct types, particularly for domelike cells. Jointly considering these concerns, we further divided the cells into four categories according to their height/width (h/w) ratios (averaged across three representative cells): type I (h/w = 0), corresponding to the flat cell type; type II (0 < h/w ≤ 0.5), including the flat domelike cells and some of the conical cells with pyramid-like shape; type III (0.5 < h/w ≤ 1.0), the most prevalent type on sepals and petals among Phalaenopsis orchids; type IV (h/w > 1.0), including partial elongated domelike, conical and papillate cells (Fig. 4b, Supplementary Fig. S9, Supplementary Table S4). Type I cells were never observed on sepals and petals, while type IV cells were absent from the lips (Fig. 4c).
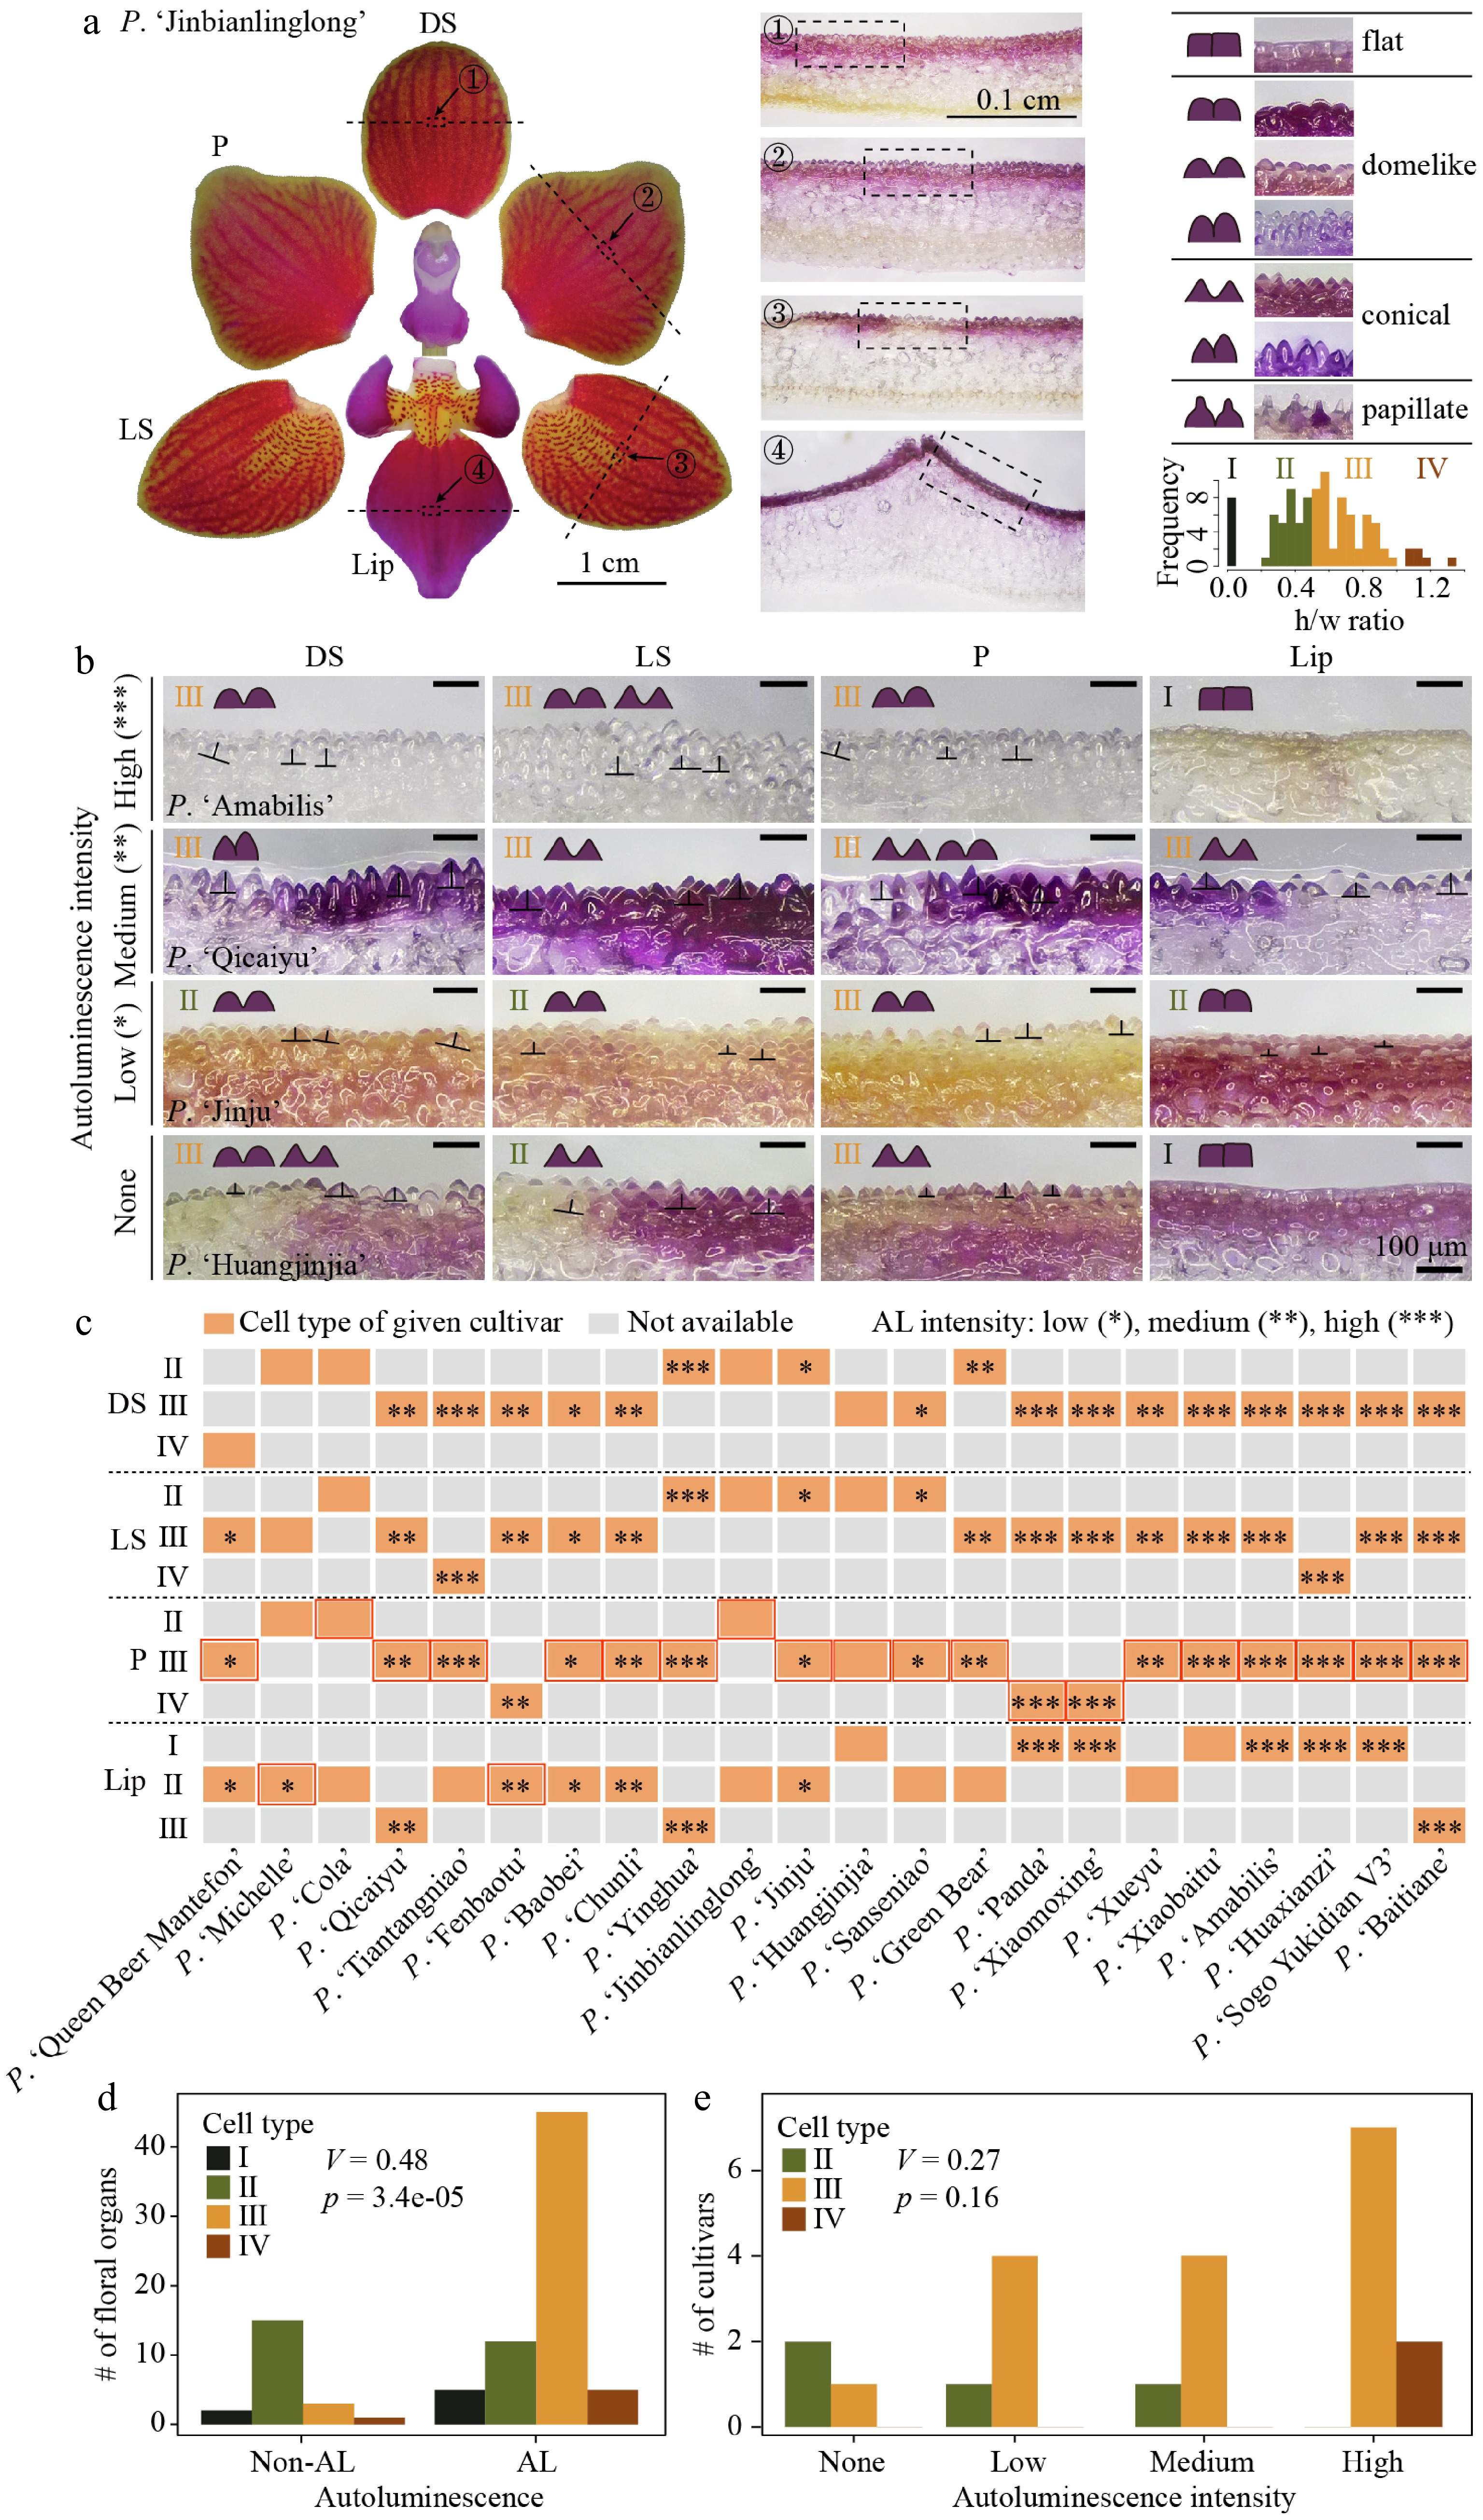
Figure 4.
Correlation between autoluminescence characteristics and epidermal cell types of floral organs. (a) P. 'Jinbianlinglong' floral organ images showing positions of transverse sections (dash lines) and the locations of epidermal cells examined. Scale bar: 1 cm for the organ images and 1 mm for the transverse section images. (b) Images of floral organ epidermal cells from four cultivars exhibiting no (None), low (*), medium (**), and high (***) autoluminescence intensity, respectively. Seven epidermal cell types are illustrated above. The classification of cells into four categories (types I–IV) based on their average height/width ratios (n = 3) was shown as well. Scale bar: 100 μm. Results of the remaining 21 cultivars were shown in Supplementary Fig. S9. (c) Distribution of epidermal cell types on different floral organs of 22 cultivars. Results of the remaining three cultivars were shown in Supplementary Fig. S5o. Orange rectangle: the cell type of the floral organ in a given cultivar. Rectangles with *, **, and *** indicate organs with low, medium, and high autoluminescence intensity, respectively. DS, dorsal sepal; LS, lateral sepal; P, petal. A red rectangle indicates the floral organ with the highest autoluminescence intensity per flower, or the petal if the cultivar was not autoluminescent. (d) Correlation between autoluminescence capability and epidermal cell types in all floral organs. (e) Correlation between autoluminescence intensity and cell types in the representative floral organ with the highest intensity per cultivar. V: Cramér's V; p: p value of Chi-square test.
We found a moderate but significant correlation (Cramér's V = 0.48, p = 3.4e-06) between cell types and autoluminescence capability (Fig. 4d). Floral organs whose epidermal cells exhibited high h/w ratios tended to show autoluminescence following eFBP2 transformation (Fig. 4c). In contrast, organs with flattened epidermal cells did not. The only floral organ with type IV but having no autoluminescence was the dorsal sepal of P. 'Queen Beer Mantefon', which had dark purple floral organs. Petals of this cultivar showed weak autoluminescence, and only restricted regions on the lateral sepals and the lip were autoluminescent.
Since different floral organs of a single flower exhibited distinct autoluminescence intensity and cell types (Supplementary Figs S2, S3, S7), the association analysis between cell type and autoluminescence intensity was performed only on the floral organ with the highest autoluminescence intensity per cultivar (red rectangles in Fig. 4c). No significant correlation (Cramér's V = 0.27, p = 0.16) was identified (Fig. 4e). Nevertheless, two cultivars with type IV epidermal cells had high autoluminescence intensity on their petals, and cultivars with type III cells also tended to have higher intensity than those with type II cells.
Prediction of autoluminescence characteristics from floral traits via multivariate modeling
-
When showing different floral traits and autoluminescence characteristics of 22 cultivars within a single heatmap (Fig. 5a), we found all three autoluminescence characteristics were clustered with floral color lightness and organ texture, consistent with what we have found above. Three non-autoluminescent cultivars, namely P. 'Huangjinjia', P. 'Cola' and P. 'Jinbianlinglong', shared common floral traits: waxy textures, dark colors, type II or III epidermal cells, small or medium size, and easy to infiltrate. On the contrary, cultivars with high or medium autoluminescence intensity tended to have light-colored, velvety, medium-sized or large flowers, with epidermal cells exhibiting relatively high height/width (h/w) ratios. Then, we asked if the autoluminescence potential of a cultivar after being transformed with FBPs can be predicted jointly from all the floral traits examined here. Considering the relatively small sample size (n = 22), we simply built regression models using the lm function in R[19] to estimate the contribution of each floral trait to the autoluminescence characteristics, rather than established machine learning models to predict the autoluminescence characteristics in a training/test split scheme. The variance inflation factors (VIFs) for all five floral traits were smaller than 2.5 (Fig. 5b), indicating that multicollinearity among the five floral traits was negligible.
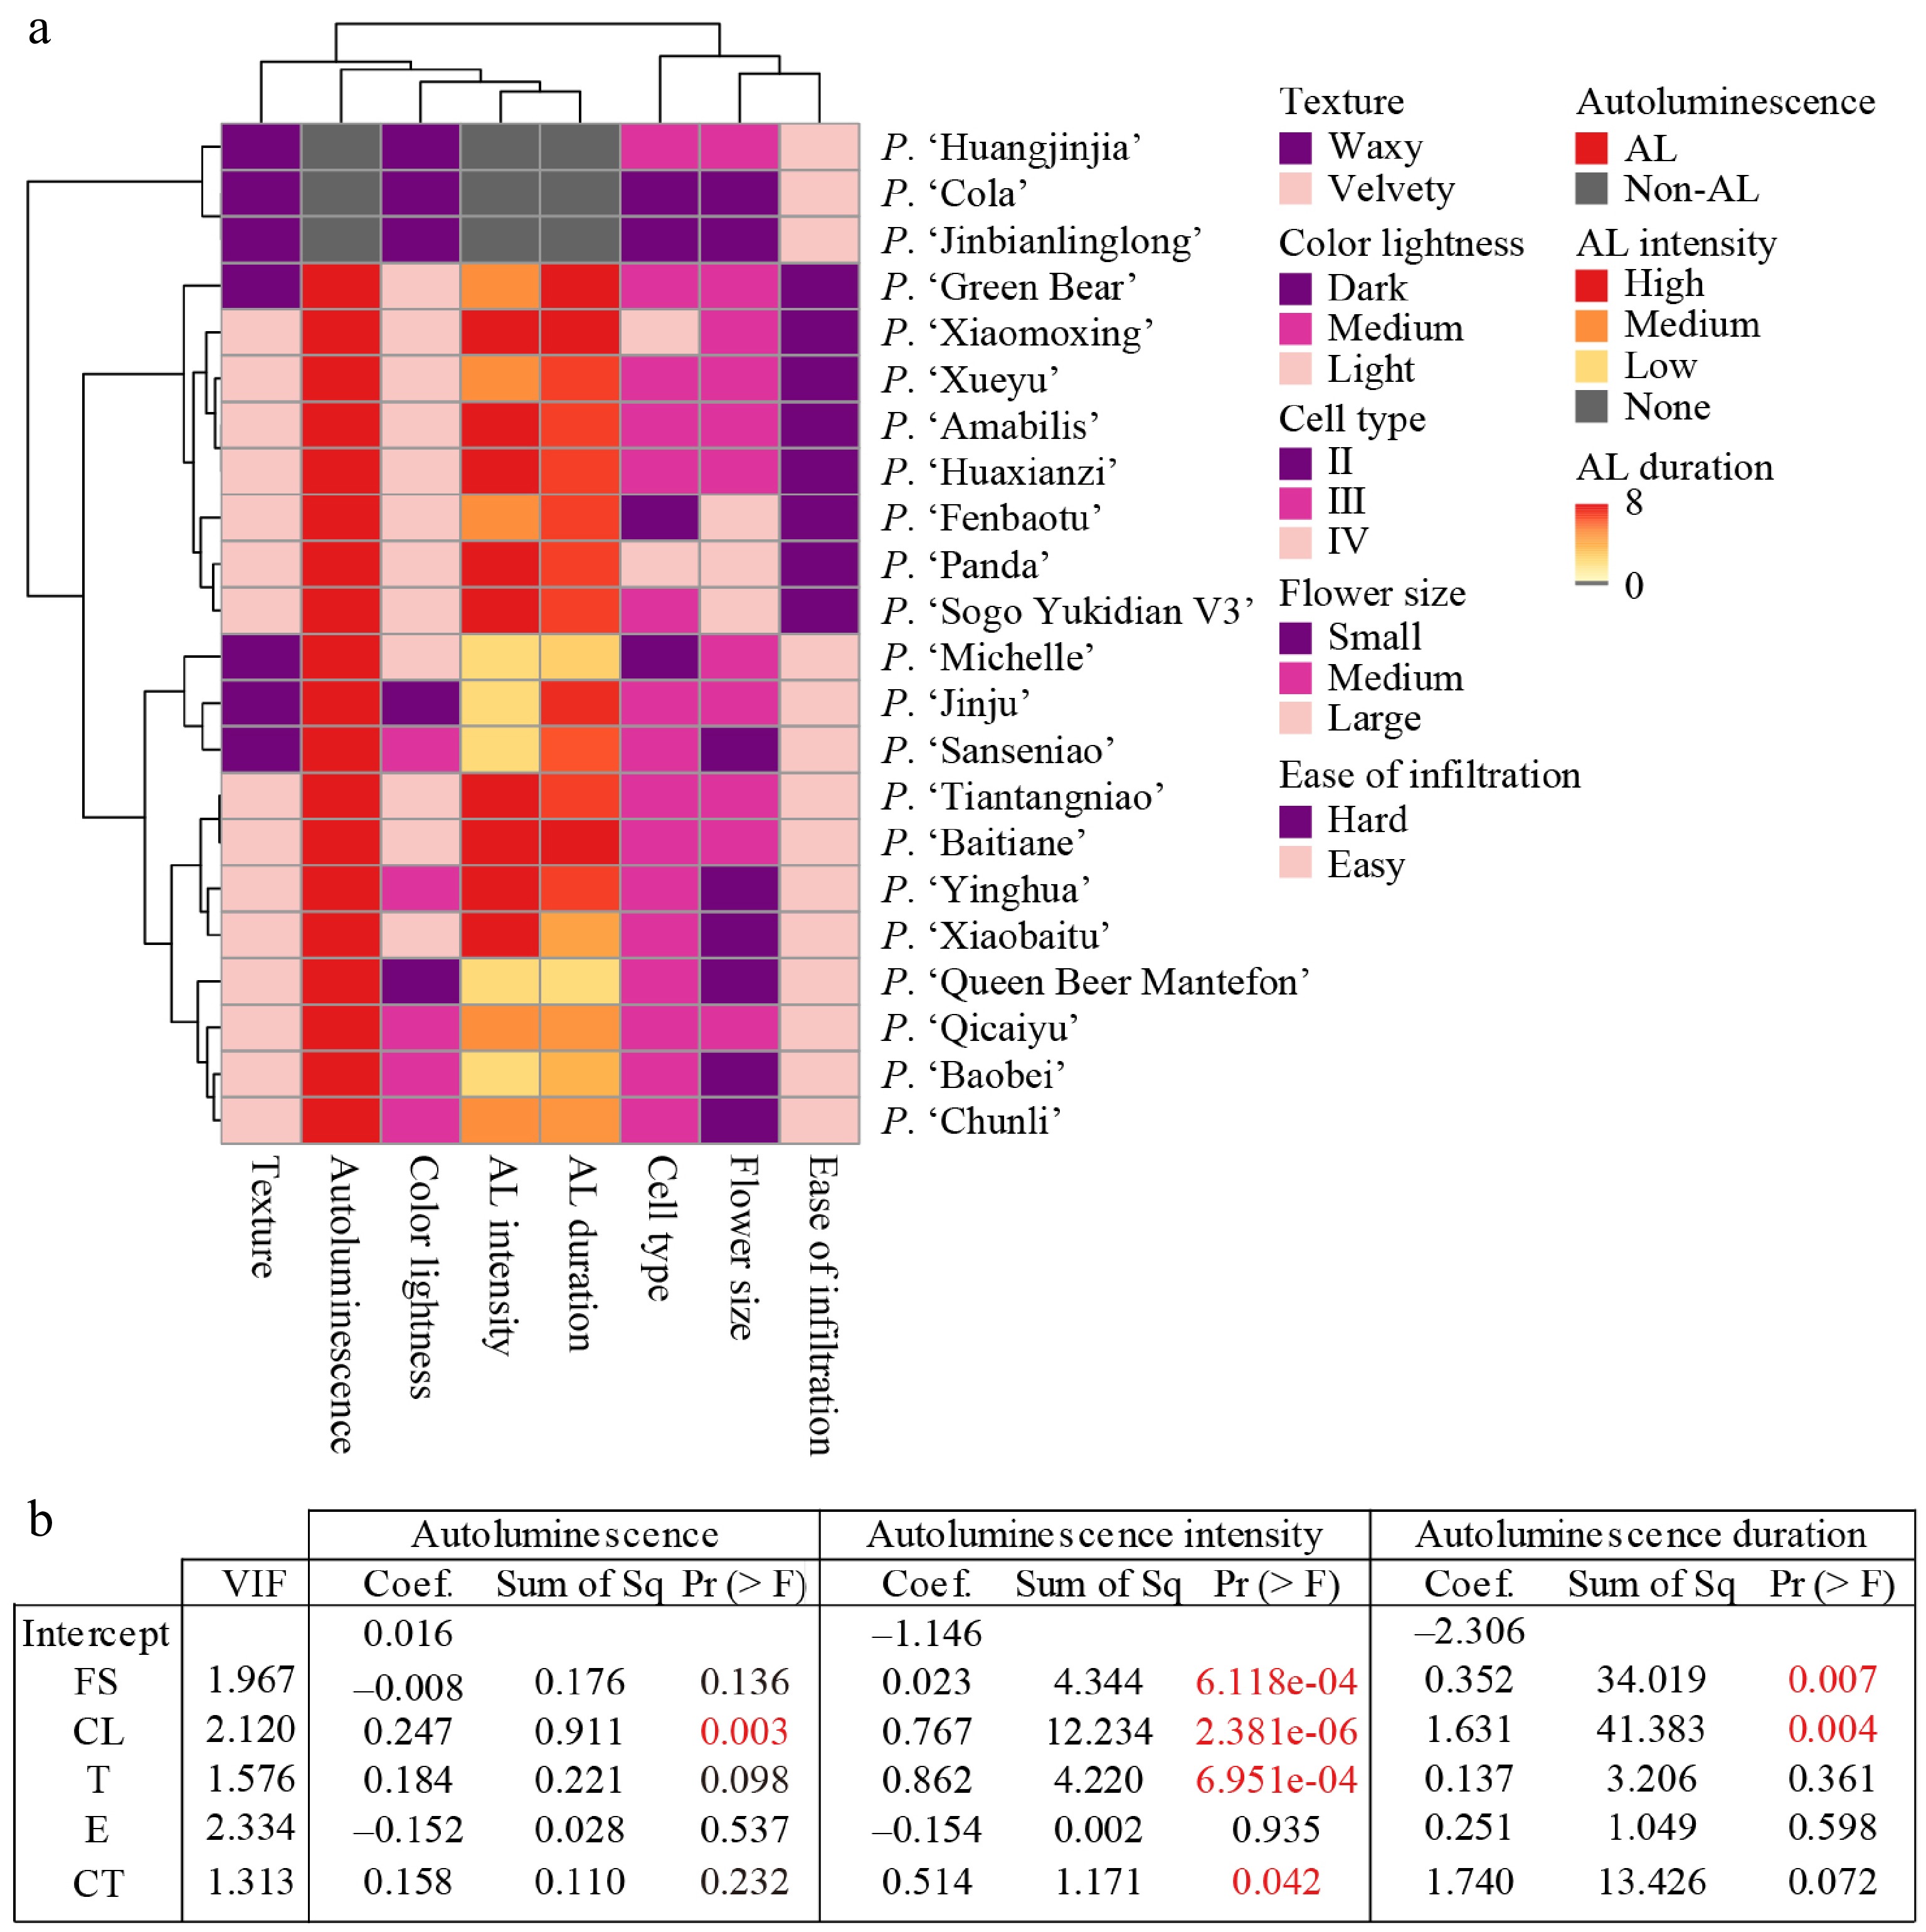
Figure 5.
Prediction of autoluminescence characteristics using floral traits. (a) Clustering heatmap among autoluminescence characteristics and floral traits of 22 Phalaenopsis cultivars. Color scale: corresponding categories or values of different autoluminescence characteristics and floral traits, as illustrated in the legend. (b) Regression models for three autoluminescence characteristics. Sum of Sq: the additional explained variation in autoluminescence characteristics when a given floral trait was added to the regression models. AL: autoluminescence; FS: flower size; CL: color lightness; T: texture of floral organs; E: ease of infiltration; CT: cell type on the representative floral organ, as indicated in Fig. 4c; VIF: variance inflation factor; Sq: Squares; Pr (> F): Probability (greater than F), namely p value.
For the capability of autoluminescence after eFBP2 transformation, the regression model was: AL = 0.016 – 0.008FS + 0.247CL + 0.184T – 0.152E + 0.158CT (Fig. 5b), where AL: autoluminescence; FS: flower size; CL: color lightness; T: texture of floral organs; E: ease of infiltration; CT: cell type on the representative floral organ. The adjusted R2 of this model was 0.421 (F-statistic = 4.047, p = 0.014), indicating that 42.1% of the variation in autoluminescence capability can be explained by variation in these floral traits across cultivars. Among these traits, only floral color lightness had a significant contribution to the prediction. For the autoluminescence intensity, more variation can be explained using floral traits (adjusted R2 = 0.804, F-statistic = 18.27, p = 4.164e-06). Flower size, color lightness, organ texture, and cell type on the representative floral organ contributed significantly to the prediction. For the autoluminescence duration, 49.6% of the variation was explained using floral traits (F-statistic = 5.135, p = 5.343e-03). Flower size and color lightness contributed significantly to the prediction. These results demonstrate that color lightness consistently contributed to the prediction of three autoluminescence characteristics, while other floral traits contributed to predictions of one or two characteristics, and infiltration ease contributed to none of the predictions.
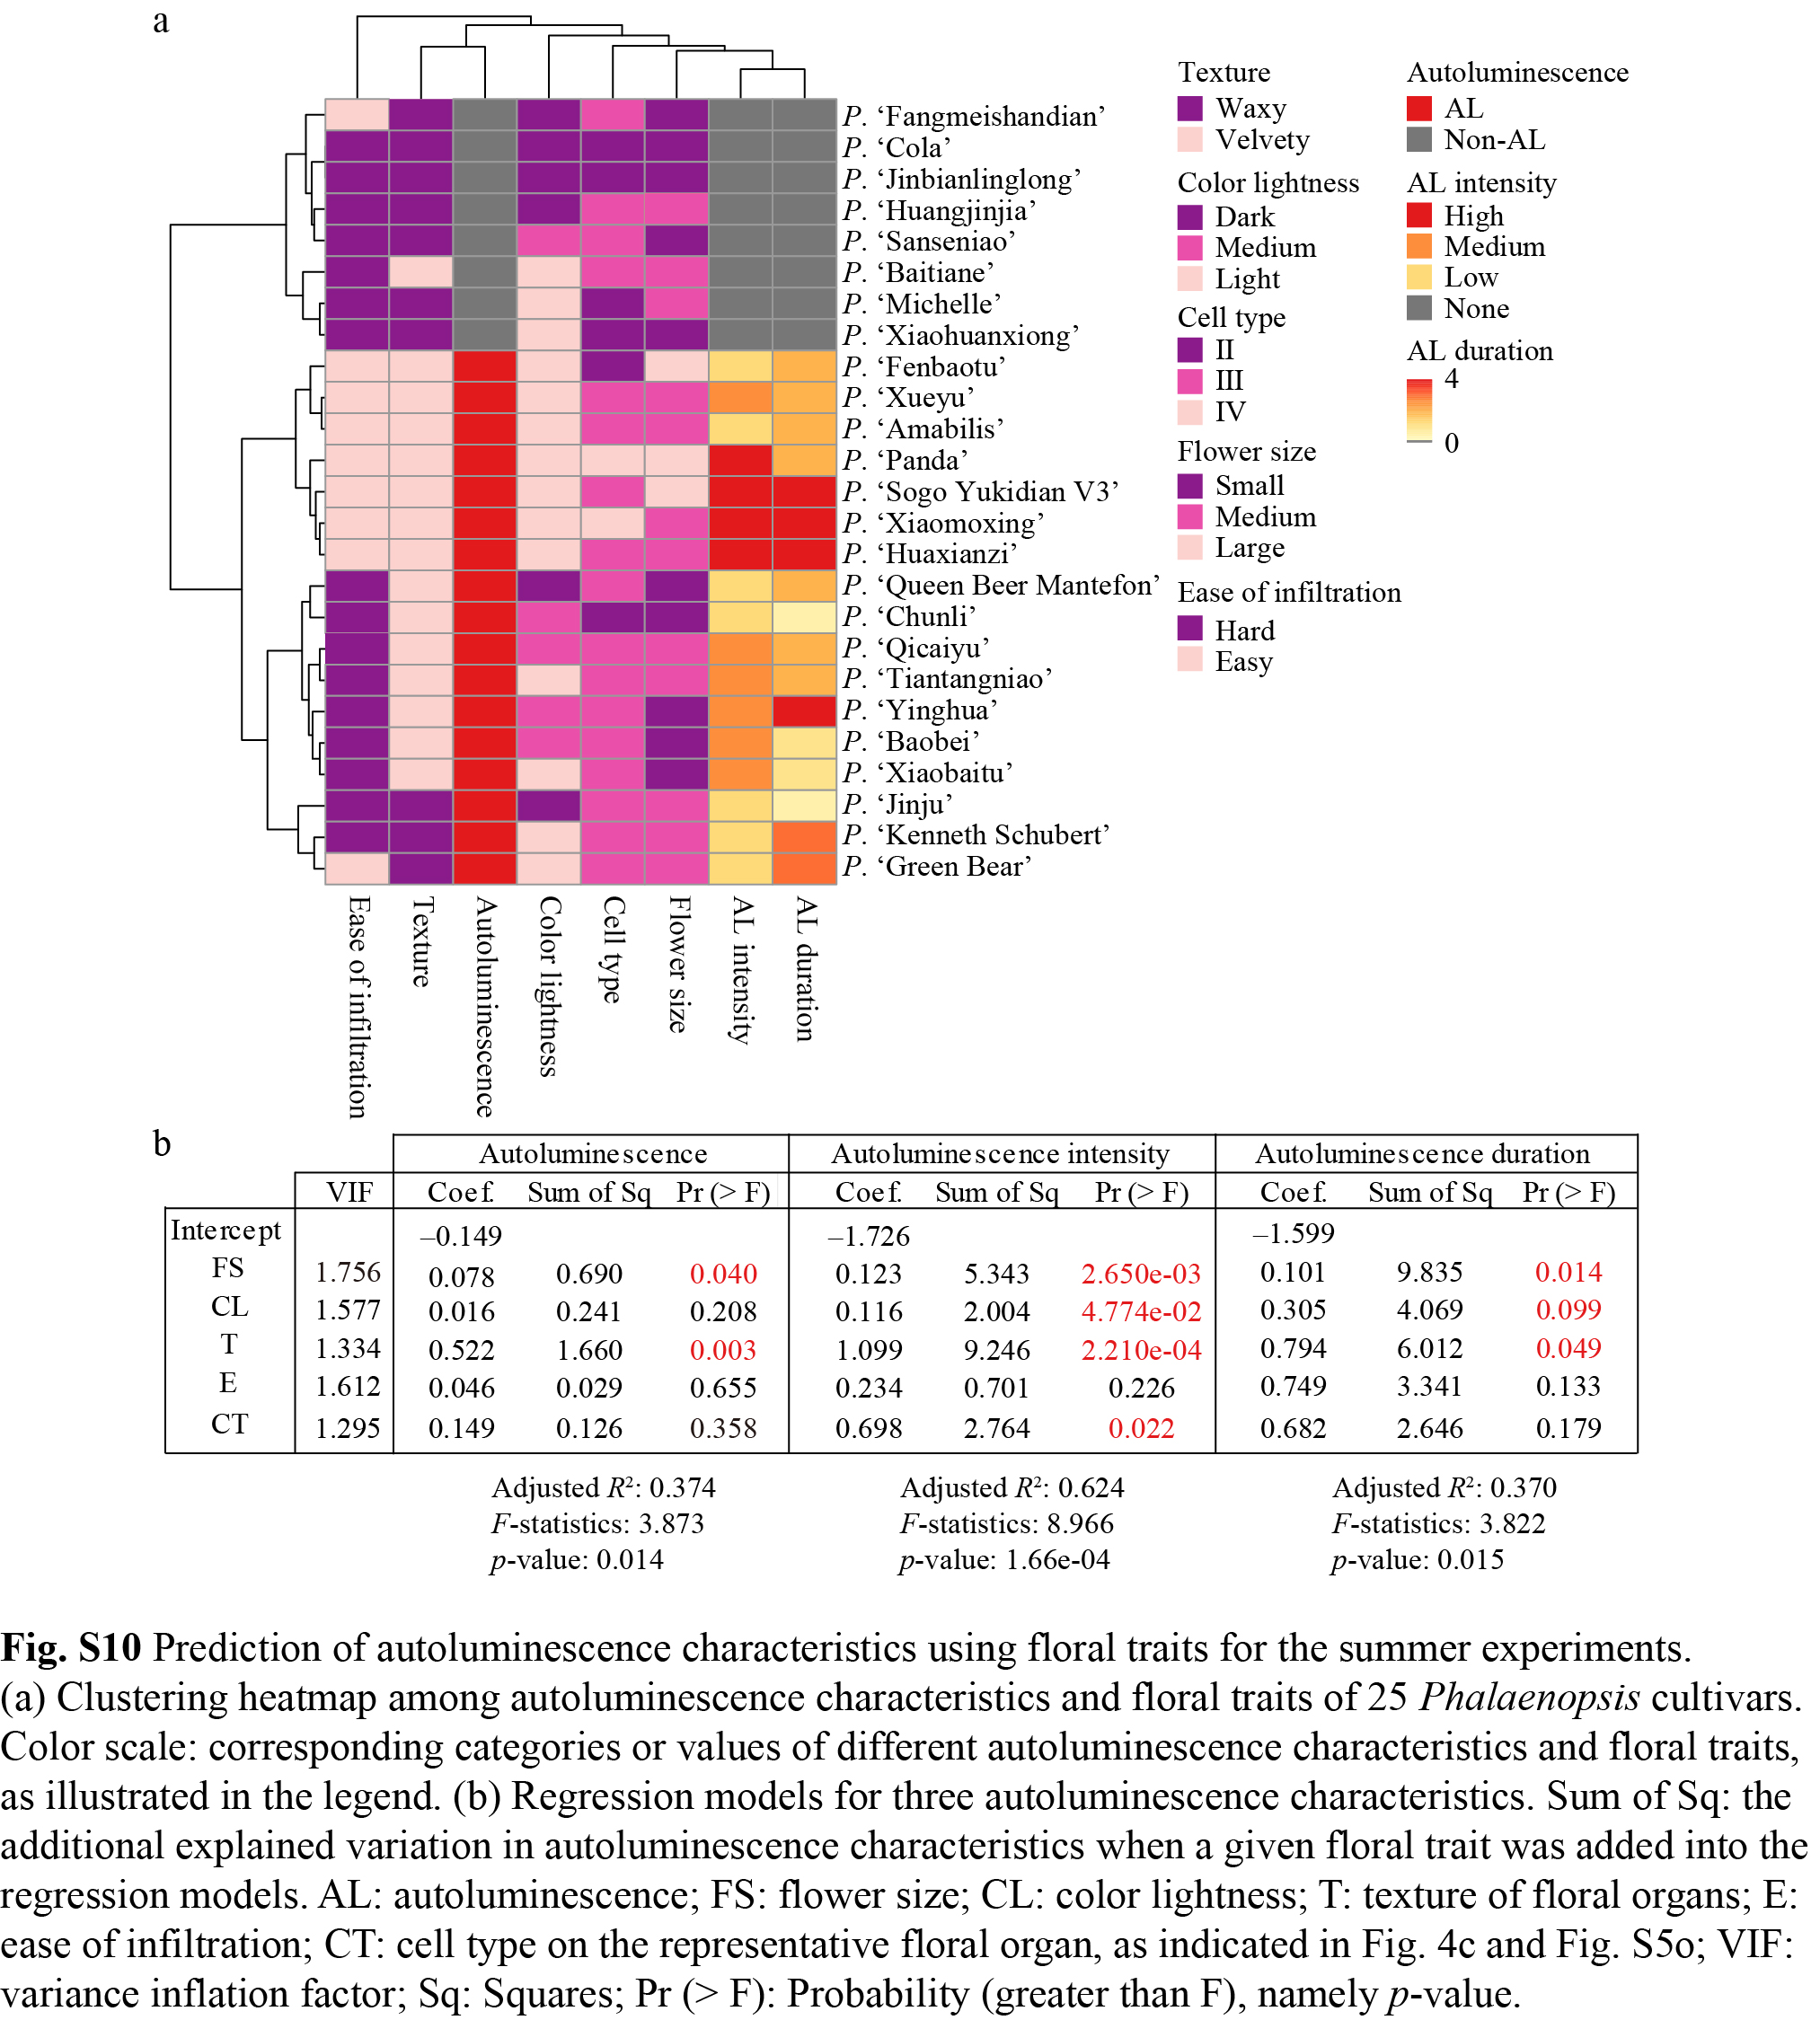
Models for the summer experiments led to poorer predictions for all three autoluminescence characteristics (adjusted R2 = 37.4%, 62.4% and 37.0% for autoluminescence capability, intensity and duration, respectively), potentially due to the influence of higher temperatures. The contributions of floral traits to predictions in summer experiments were similar to those in autumn experiments, except that flower size and organ texture contributed significantly to predictions of all three autoluminescence characteristics, while color lightness did not contribute to the prediction of autoluminescence capability in the summer experiments (Supplementary Fig. S10). Taken together, all three autoluminescence characteristics, especially autoluminescence intensity, can be reasonably predicted or explained by these five floral traits.
-
By assessing the autoluminescence characteristics of 25 Phalaenopsis cultivars after transient eFBP2 transformation in two batches of experiments, we demonstrated the potential influences of environmental temperatures on autoluminescence, as higher temperatures might decrease autoluminescence capability, intensity, and duration. These temperature-sensitive autoluminescence characteristics have also been reported in other studies[10,12]. Zheng et al. found that the autoluminescence intensity decreased rapidly upon high-temperature treatment, although the caffeic acid amount increased[12]. Kotlobay et al. demonstrated that the luciferase loses its activity at temperatures above 30 °C[10]. In addition, high temperatures above 30 °C reduced the efficiency of T-DNA transfer to plants due to the thermosensitivity of Agrobacterium tumefaciens[27−29]. Nevertheless, the association between autoluminescence characteristics and floral traits was similar across two experimental batches conducted under different environmental temperatures, suggesting that the observed tendency in our study is relatively robust.
Association between floral traits and autoluminescence characteristics
-
Phalaenopsis flowers with light colors tended to be capable of autoluminescence, with high autoluminescence intensity and long duration. In flowers with dark-colored stripes or patches, these stripes or patches showed significantly lower autoluminescence intensity than their neighbouring regions. Anthocyanins have been reported to have an in vivo absorption maximum near 550 nm[30], whereas the emission spectrum of fungal luciferin ranges from approximately 430 to 600 nm, with a peak at 520 nm[9]. Thus, the lower autoluminescence intensity observed in dark-colored flowers and regions is likely attributable, at least in part, to absorption by anthocyanins. Flower size also contributed to the prediction of autoluminescence intensity and duration. Cultivars with large flowers are mainly progenies of P. amabilis and P. aphrodite[31], and large flowers in Phalaenopsis are normally associated with light colors and velvety textures. Flower size may serve as a useful indicator for selecting potential Phalaenopsis materials for modification with FBPs, but this indicator may not be directly applicable to other horticultural crops.
Floral organ texture and epidermal cell type contributed to the prediction of autoluminescence intensity in both experimental batches. The association between epidermal cell morphology and optical properties has been documented previously[32]. In the Mandevilla sanderi corolla, the flat cells on the abaxial side reflect a greater fraction of incident light than the conical epidermal cells on the adaxial side, resulting in a glossy appearance on the abaxial surface and a matt finish on the adaxial surface, respectively[32]. In addition, Phalaenopsis cultivars with waxy organ texture tended to have relatively flat epidermal cells and thick cuticles[17], while the folds of cuticles have been reported to diffract light in Hibiscus trionum[33]. Therefore, it is likely that intracellular autoluminescence is reflected and/or diffracted by the thick cuticles on the flat epidermal cells, thereby reducing the amount of light escaping to the exterior. These also suggest that the floral organ texture and epidermal cell type should be taken into account in the selection of candidate materials as well.
Limited effects of infiltration ease on autoluminescence potential
-
On the contrary, infiltration ease had the least contribution to the predictions of autoluminescence characteristics among other floral traits. Infiltration ease was not used as a proxy of Agrobacterium infection efficiency, since the physical fluid spread does not capture T-DNA delivery, bacterial attachment, or host compatibility. Instead, the ease of infiltration affected flower treatment: hard-to-infiltrate flowers required more injection attempts to achieve a relatively uniform distribution of the inoculation solution. Different treatments may therefore affect floral organ vitality and, consequently, autoluminescence potential. The absence of a significant association between autoluminescence characteristics and infiltration ease suggests that the different autoluminescence characteristics we recorded for these Phalaenopsis orchids are unlikely to result from treatment fluctuation or non-uniform delivery of the inoculation solution across floral tissues.
Methodological limitations
-
It is worth noting that the screening results from transient eFBP2 transformation in this study might not directly predict the suitability for stable autoluminescent line development, due to several potential reasons. First, during transient eFBP2 transformation, not all cells of the floral organs are capable of expressing eFBP2 and producing luciferin, whereas every single cell in a stable autoluminescent line—including epidermal cells—is expected to have that capability. Second, autoluminescent characteristics in transient transformation are affected by multiple factors, such as flower stage and condition, experimental temperature, Agrobacterium infection efficiency, substrate availability, and potentially other unrecognized factors. Finally, eFBP2 rewires the tyrosine → caffeic acid → hispidin → luciferin metabolic flux, which is thought to differ significantly between transiently transformed wild-type flowers and stable transgenic flowers. This might explain why no correlation was identified between autoluminescence characteristics and caffeic acid/tyrosine content in this study. A more robust and generalizable conclusion could be refined after stable transgenic experiments on representative cultivars.
-
In this study, we demonstrated that not all flowers possess the potential for autoluminescence after transient eFBP2 transformation, and that flowers of different Phalaenopsis cultivars differ in autoluminescence capability, intensity, and duration. Furthermore, owing to the considerably high diversity and complexity in color patterning and epidermal cell types in Phalaenopsis orchids, different flowers on a single plant, different organs within a single flower, and even different regions of a single floral organ exhibit distinct autoluminescence characteristics. Generally, floral organs with light colors, velvety textures, and raised epidermal cells show high autoluminescence potential. Our findings shed light on the selection of potential materials for the time- and labor-consuming transgenic experiments required to create autoluminescent horticultural plants.
This work was supported by the National Natural Science Foundation of China (Grant No. 32370241), the collaborative project (Grant No. HXQS2024009 from Ruan J) to Wang P; the Innovation Program of Chinese Academy of Agricultural Sciences to Ruan J; the Natural Science Foundation of Guangdong Province, China (Grant No. 2026A1515011083) to Wang J; National Key R&D Program of China (Grant No. 2023YFD1600505) to Jia R.
-
The authors confirm contribution to this study as follows: study conception and design: Wang P, Li Z, Wang J; eFBP2 construct provision: Du H; plant material provision: Jia R; transient transformation experiments: Wang Z, Ma J, Li Z, Lin L, Qiu J, Chen L, Wang X, Zhang Y, Xie T; flower diameter measurements and floral organ texture assessment: Wang Z, Ma J, Li Z; bright- and dark-field imaging: Wang Z, Ma J; flower image collection: Wang Z, Li Z, Lin L, Qiu J; autoluminescence data collection: Wang Z, Li Z, Ma J, Qiu J, Lin L; statistical analysis scripts: Ma J; draft manuscript preparation: Wang P, Wang Z, Ma J, Li Z, Lin L, Qiu J; manuscript inputs: Du H, Chen L, Wang X, Jia R, Xie T, Zhang Y, Ruan J. All authors reviewed the results and approved the final version of the manuscript.
-
All the raw data used in this study have been submitted in the supplementary information.
-
The authors declare that they have no conflict of interest.
-
accompanies this paper online at: https://doi.org/10.48130/opr-0026-0023.
-
# Authors contributed equally: Zhiqing Wang, Jingwei Ma, Zhimei Li
- Supplementary Table S1 Autoluminescent data statistics of 25 Phalaenopsis cultivars.
- Supplementary Table S2 Floral traits of 25 Phalaenopsis cultivars.
- Supplementary Table S3 Flower diameters of 25 Phalaenopsis cultivars.
- Supplementary Table S4 Classification of epidermal cells of 25 Phalaenopsis cultivars.
- Supplementary Fig. S1 Flowers of 25 Phalaenopsis cultivars and the definition of flowering stages.
- Supplementary Fig. S2 Dark-field images of 19 cultivars that were autoluminescent after transient eFBP2 transformation in the autumn experiments.
- Supplementary Fig. S3 Dark-field images of 20 cultivars that were autoluminescent after transient eFBP2 transformation in the summer or autumn experiments.
- Supplementary Fig. S4 Correlation of autoluminescence characteristics between two autoluminescent flowers per cultivar in the autumn experiments.
- Supplementary Fig. S5 Results of the summer experiments.
- Supplementary Fig. S6 Correlation of autoluminescence intensity (a) and duration (b) between two batches of experiments.
- Supplementary Fig. S7 The ease of liquid infiltration into floral organs of 19 cultivars.
- Supplementary Fig. S8 Flower diameters of 25 cultivars.
- Supplementary Fig. S9 Epidermal cell types of floral organs in 21 cultivars.
- Supplementary Fig. S10 Prediction of autoluminescence characteristics using floral traits for the summer experiments.
- Copyright: © 2026 by the author(s). Published by Maximum Academic Press, Fayetteville, GA. This article is an open access article distributed under Creative Commons Attribution License (CC BY 4.0), visit https://creativecommons.org/licenses/by/4.0/.
-
About this article
Cite this article
Wang Z, Ma J, Qiu J, Lin L, Wang X, et al. 2026. Impact of floral traits on autoluminescence potential in Phalaenopsis orchids. Ornamental Plant Research 6: e032 doi: 10.48130/opr-0026-0023 

Impact of floral traits on autoluminescence potential in Phalaenopsis orchids
- Received: 23 May 2026
- Revised: 13 July 2026
- Accepted: 11 August 2026
- Published online: 14 September 2026
Abstract: Engineering autoluminescent plants, especially horticultural crops, has recently emerged as a promising research area, with one current approach involving the transgenic introduction of fungal bioluminescence pathway (FBP) genes. Although autoluminescent plants such as tobacco and petunia have been created, it remains unclear whether all horticultural plants can be autoluminescent after genetic modification, especially those with dark-colored flowers and thick cuticles. To understand whether, and what, if any, floral traits affect autoluminescence potential, we assess the autoluminescence characteristics of 25 representative Phalaenopsis cultivars following transient transformation with the enhanced FBP construct (eFBP2), alongside several key morphological and biochemical traits. Our results demonstrate that autoluminescence characteristics are correlated with floral color lightness, organ textures, and epidermal cell types. In contrast, the content of the substrates of luciferin—caffeic acid and tyrosine—and the ease of infiltration of the inoculation solution into floral organs after injection have limited effects on autoluminescence characteristics. Autoluminescence intensity can be reasonably predicted using the five floral traits investigated, as 80.4% of variation can be explained by these traits. Our study not only identifies specific Phalaenopsis cultivars with high potential for developing autoluminescent lines but also provides a selection framework applicable to other horticultural crops.