-
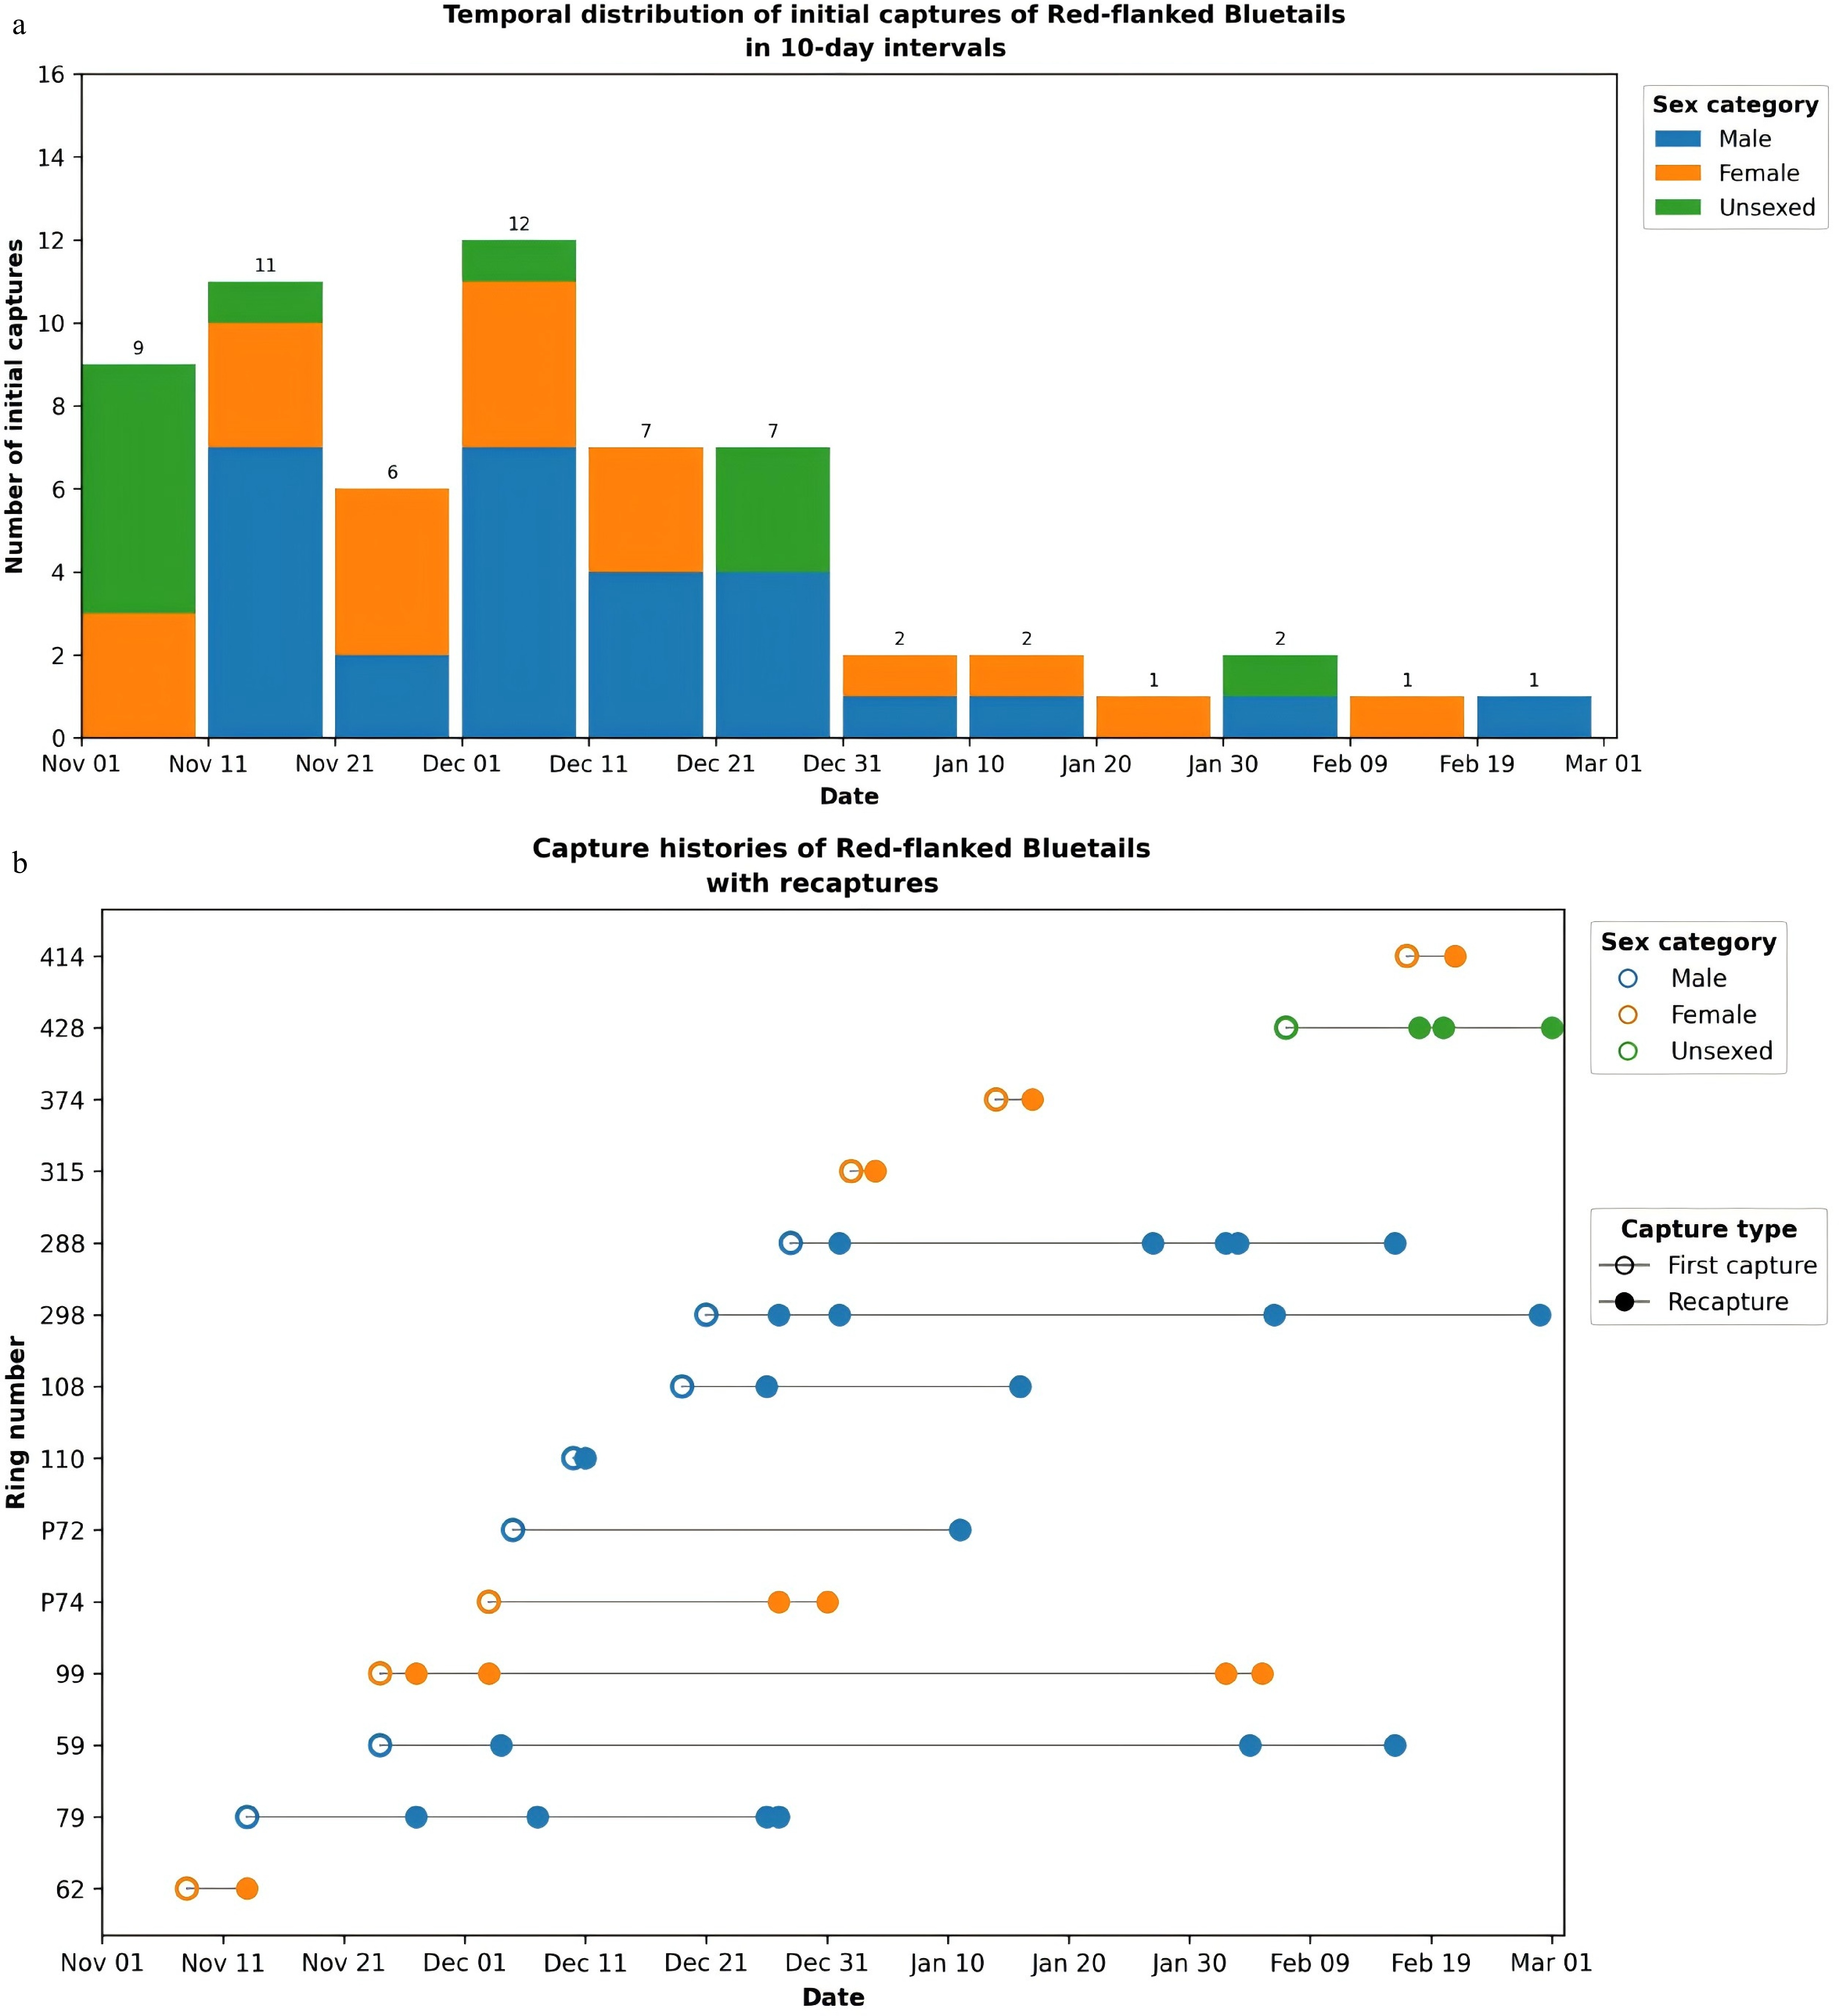
Figure 1.
Temporal distribution of Red-flanked Bluetail captures during the study period. (a) The distribution of initial captures of males, females, and unsexed individuals grouped into 10-day intervals. (b) Capture histories of individuals with recaptures. Each horizontal line represents one ringed individual.
-
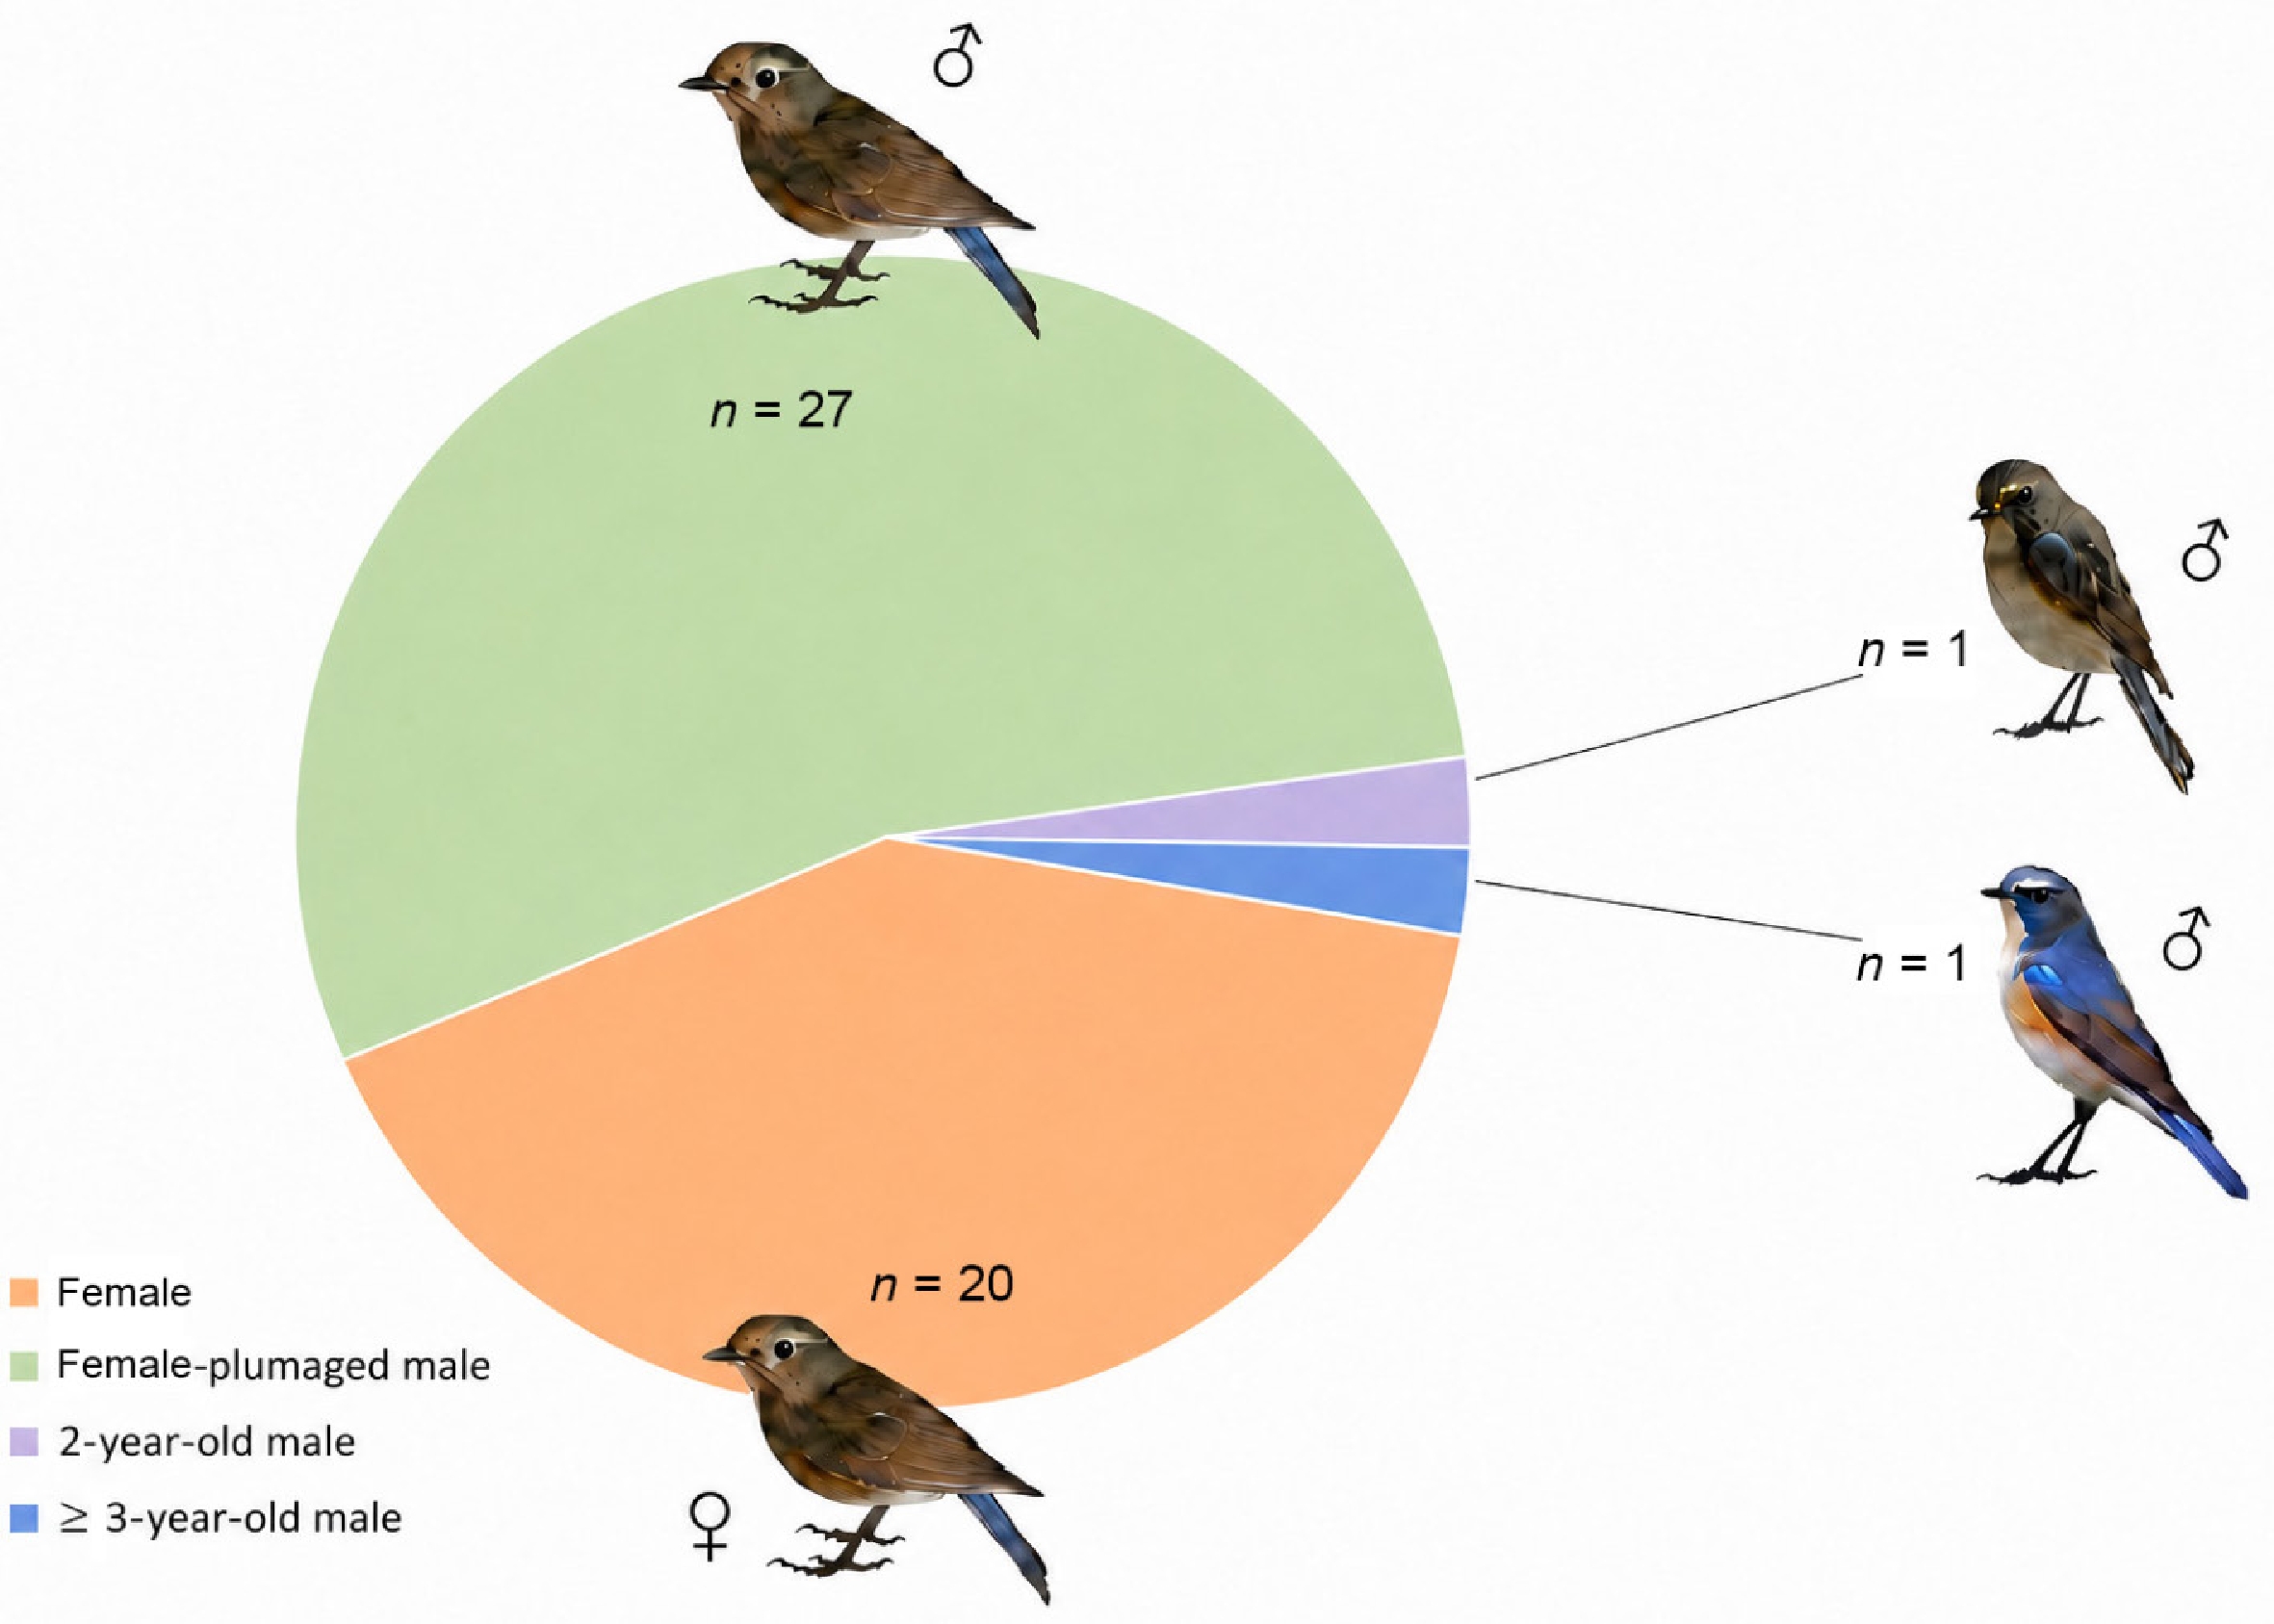
Figure 2.
The composition of wintering Red-flanked Bluetails in Dujiangyan based on morphological and molecular identification.
-
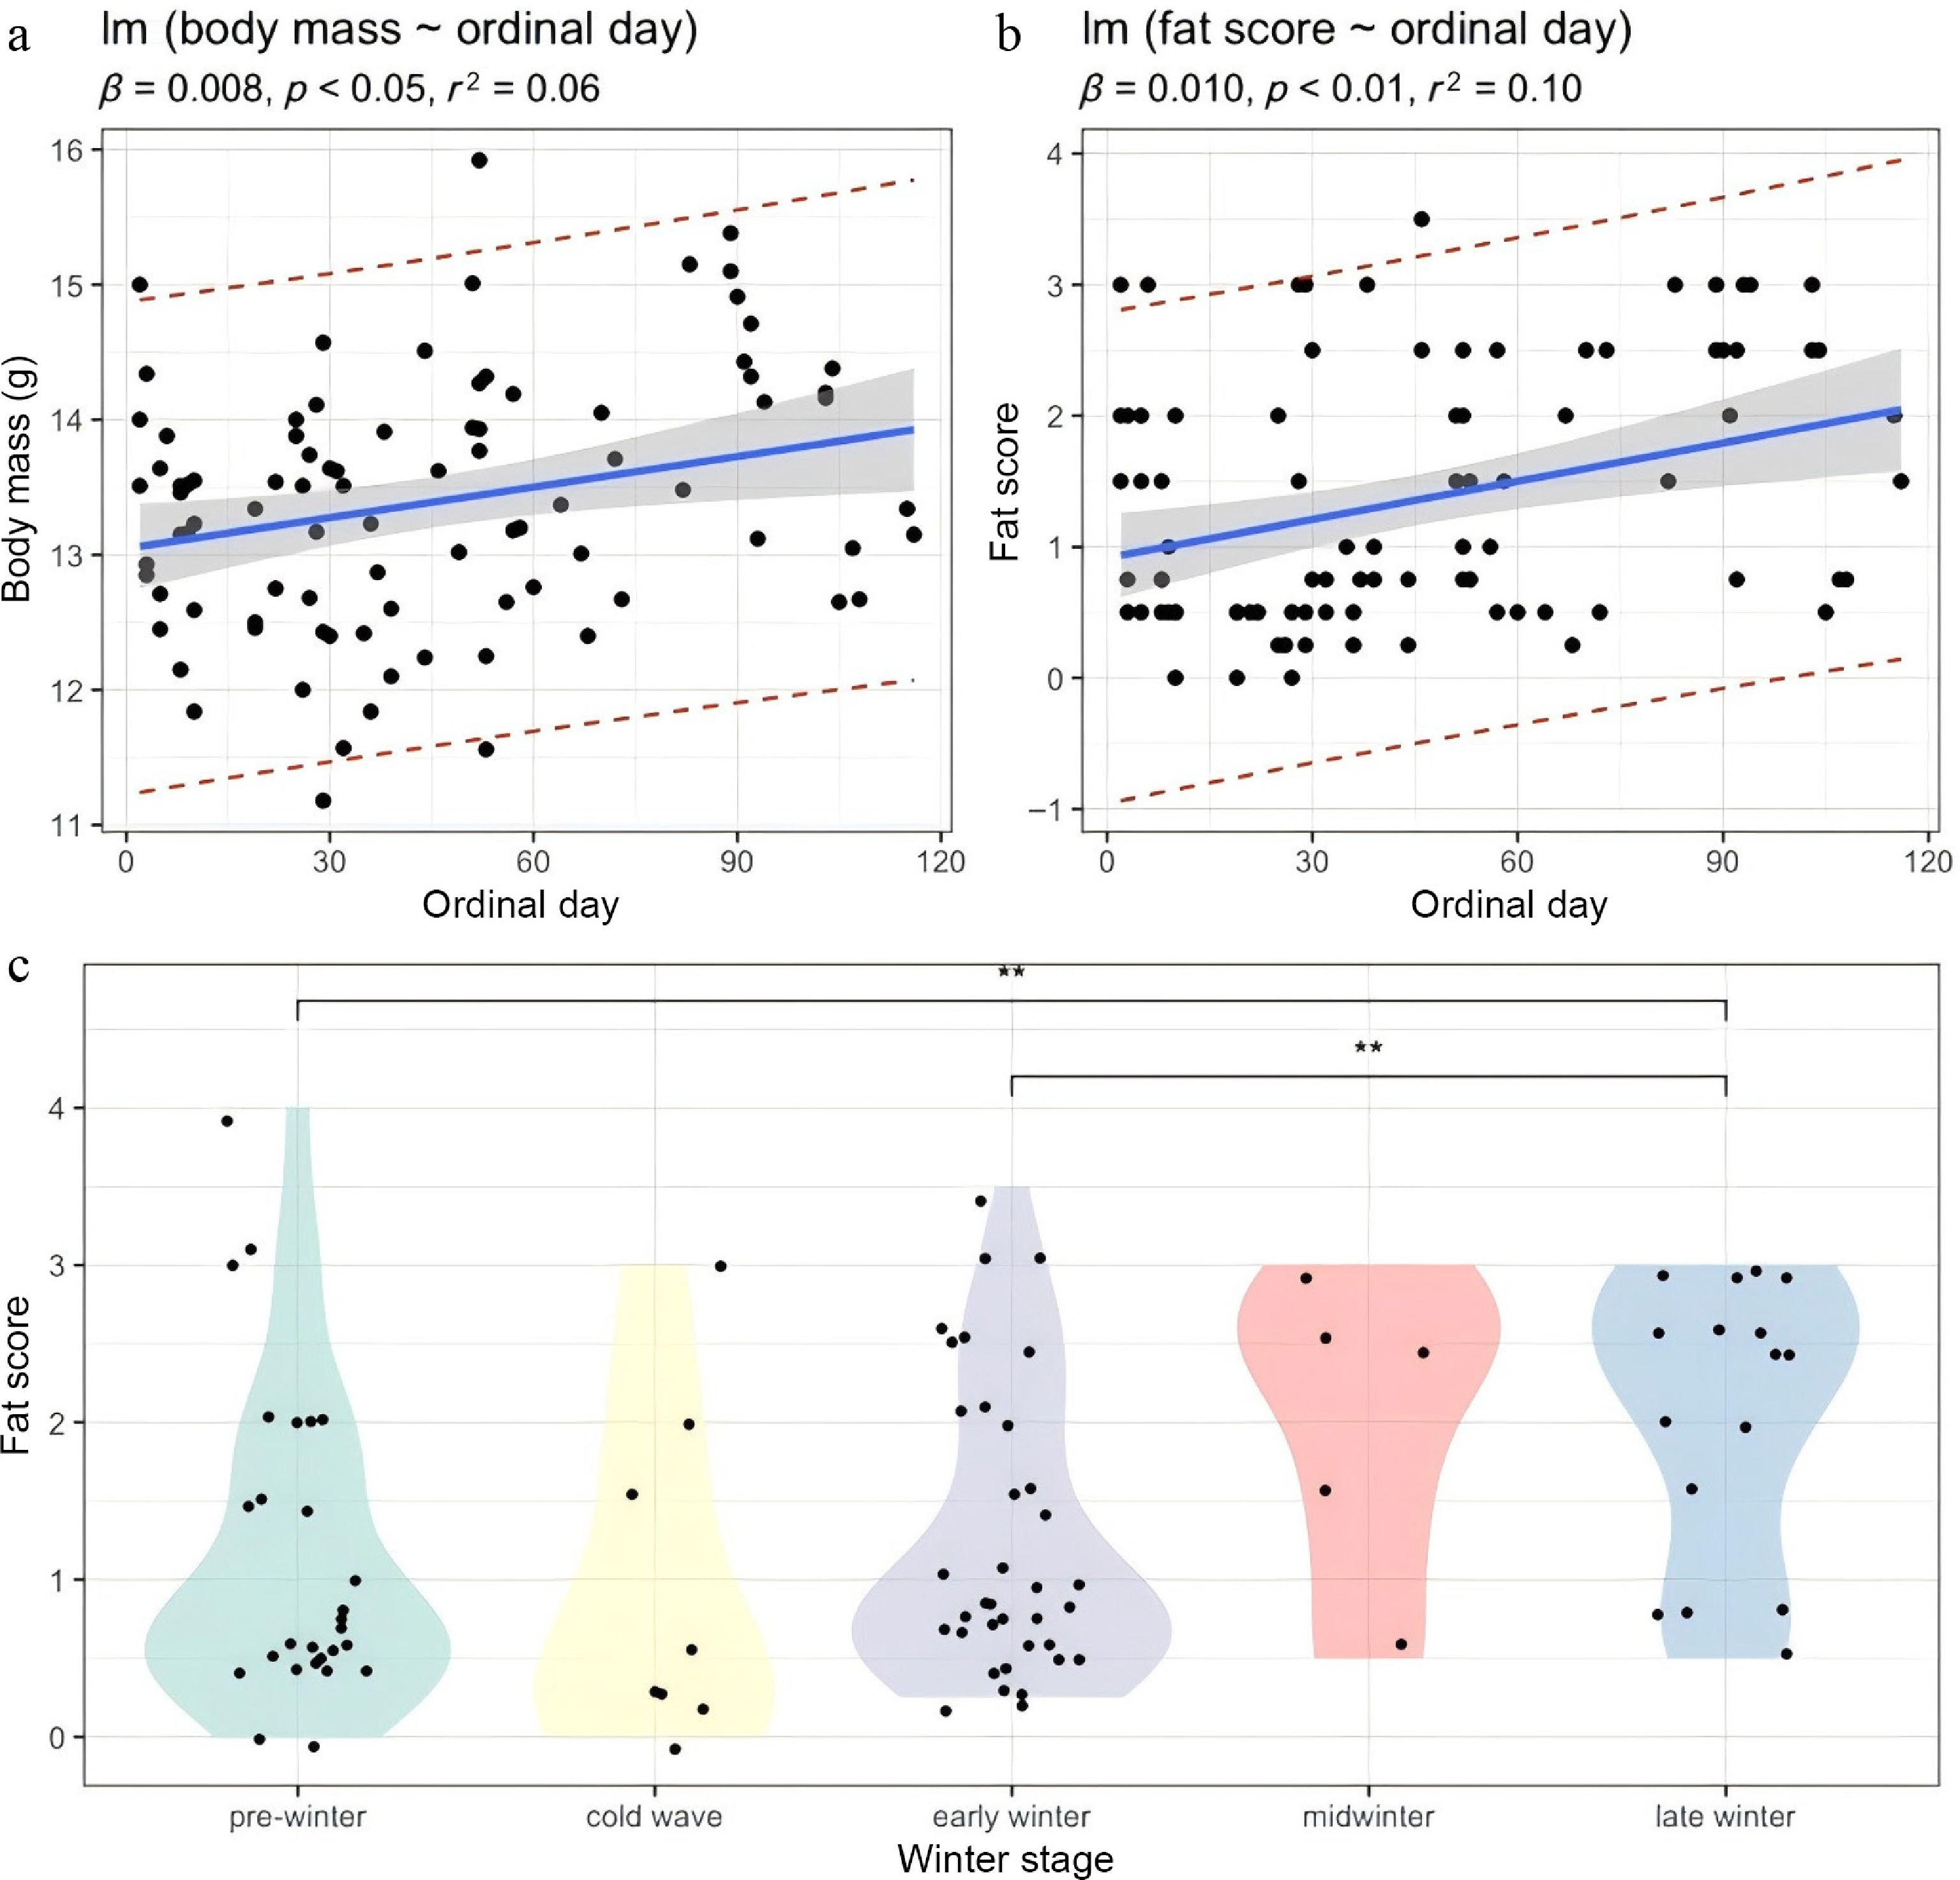
Figure 3.
The regression relationship between ordinal day and (a) body mass, and (b) fat score, respectively. (c) The comparison of fat scores among different winter stages, in which late winter had a significantly higher fat reserve compared with pre- and early winter. Significance code: ** p < 0.01.
-
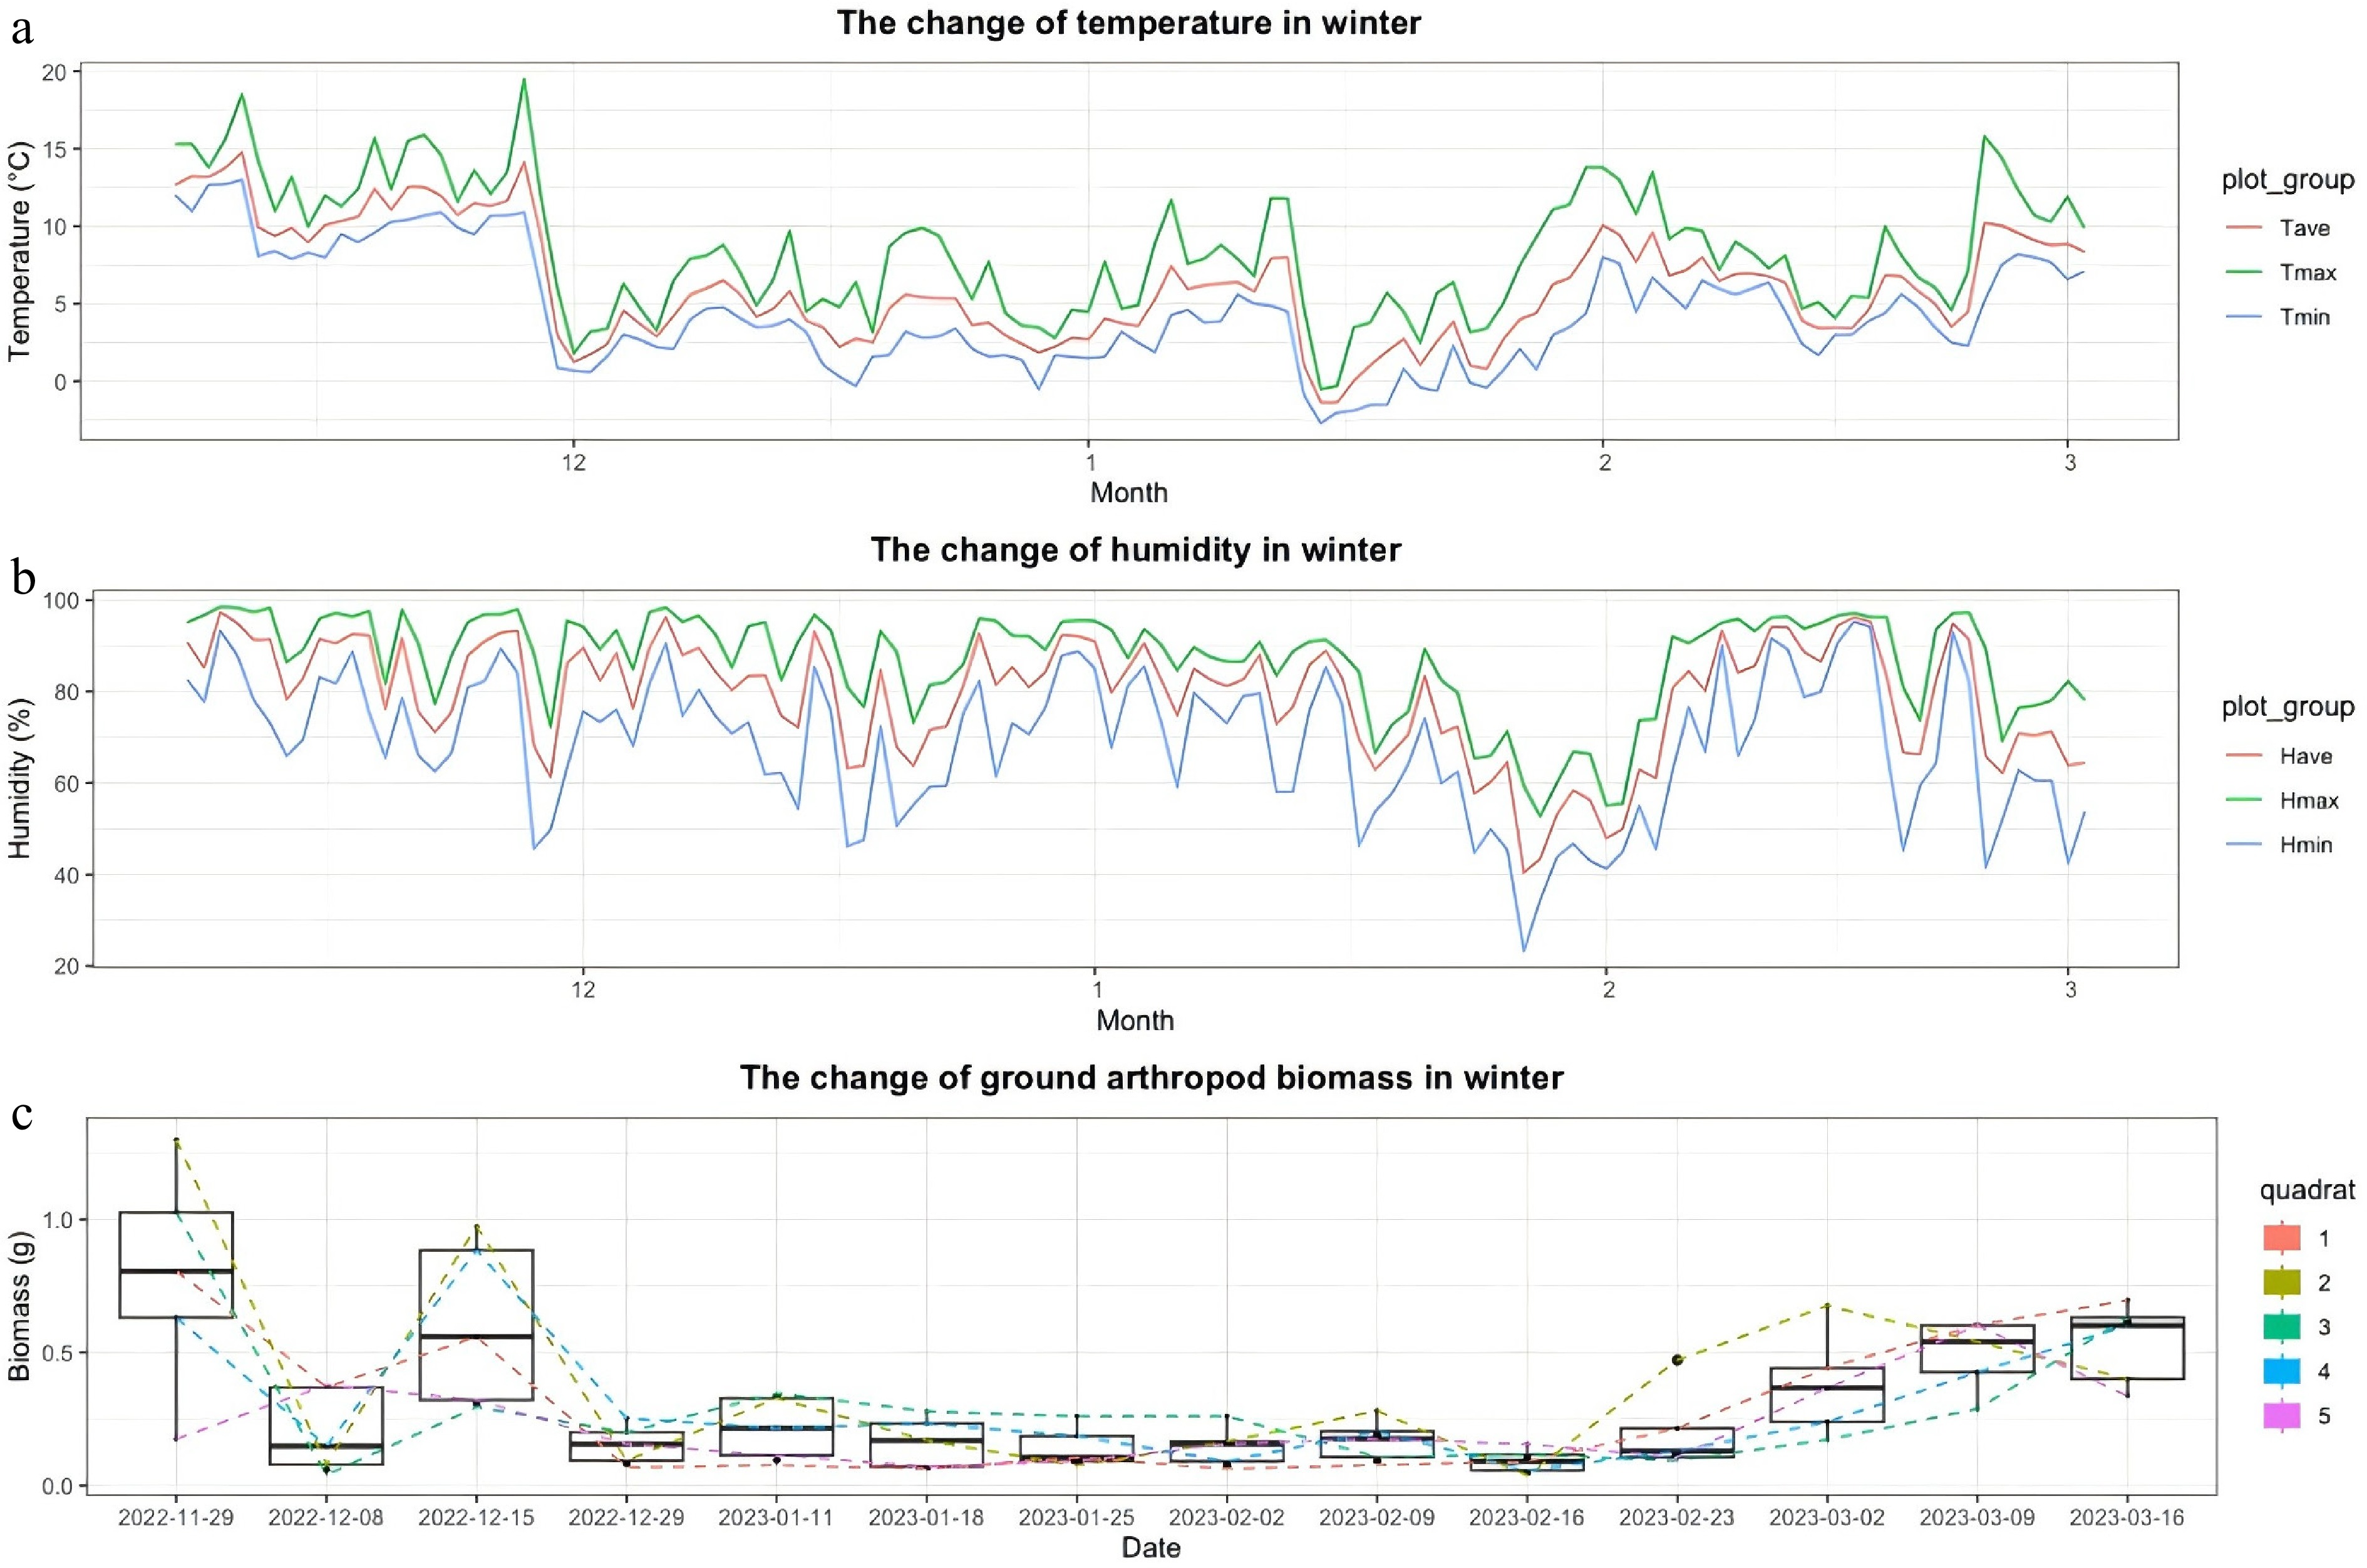
Figure 4.
Dynamic changes in (a) temperature, (b) humidity, and (c) ground arthropod biomass during winter.
-
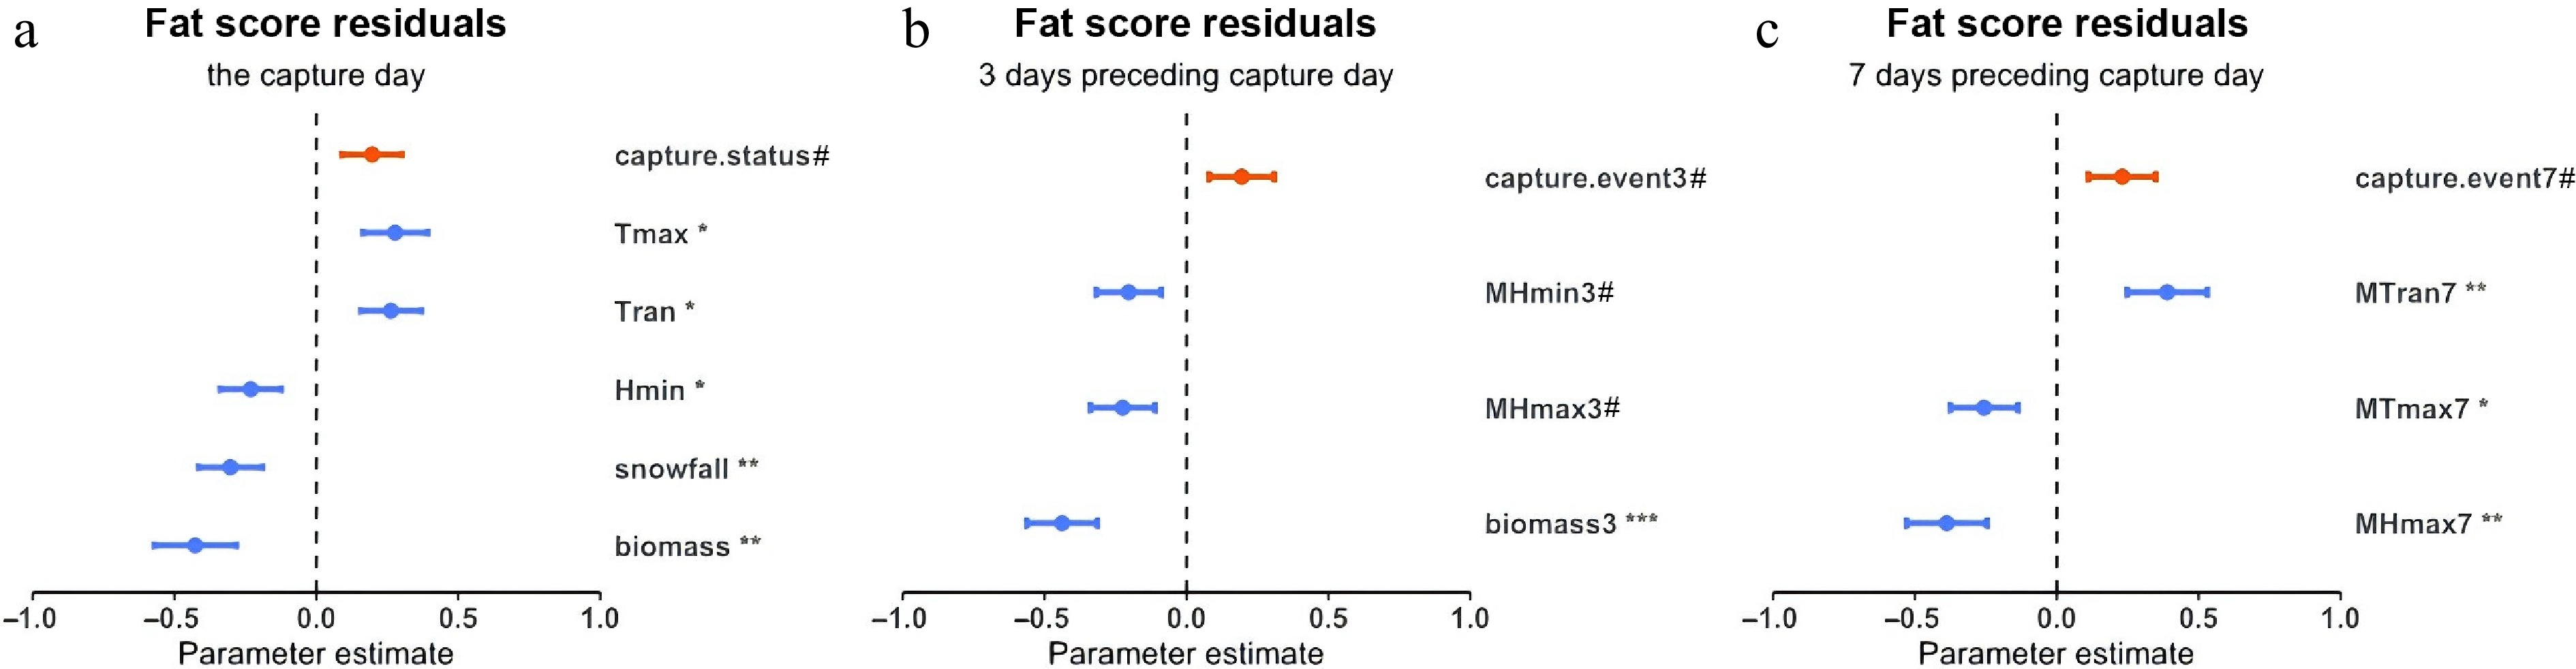
Figure 5.
Standardized regression coefficient estimates from model-averaged multiple linear regression models explaining variation in fat score residuals. Fat score residuals were obtained after removing the effect of daily capture time from fat score. The x-axis represents standardized regression coefficient estimates; positive values indicate positive associations with fat score residuals, whereas negative values indicate negative associations. Panels show models based on predictors measured on (a) the capture day, (b) the mean values during the 3-d preceding capture, and (c) the mean values during the 7-d preceding capture. Only predictors retained in the optimal model-averaged results are shown; therefore, the number of predictors differs among panels. The figure includes retained predictors regardless of whether their individual coefficients reached statistical significance. Bars represent 95% confidence intervals. Red bars indicate biotic factors, and blue bars indicate abiotic factors. Significance codes: *** p < 0.001; ** p < 0.01; * p < 0.05; p < 0.10.
Figures
(5)
Tables
(0)