-
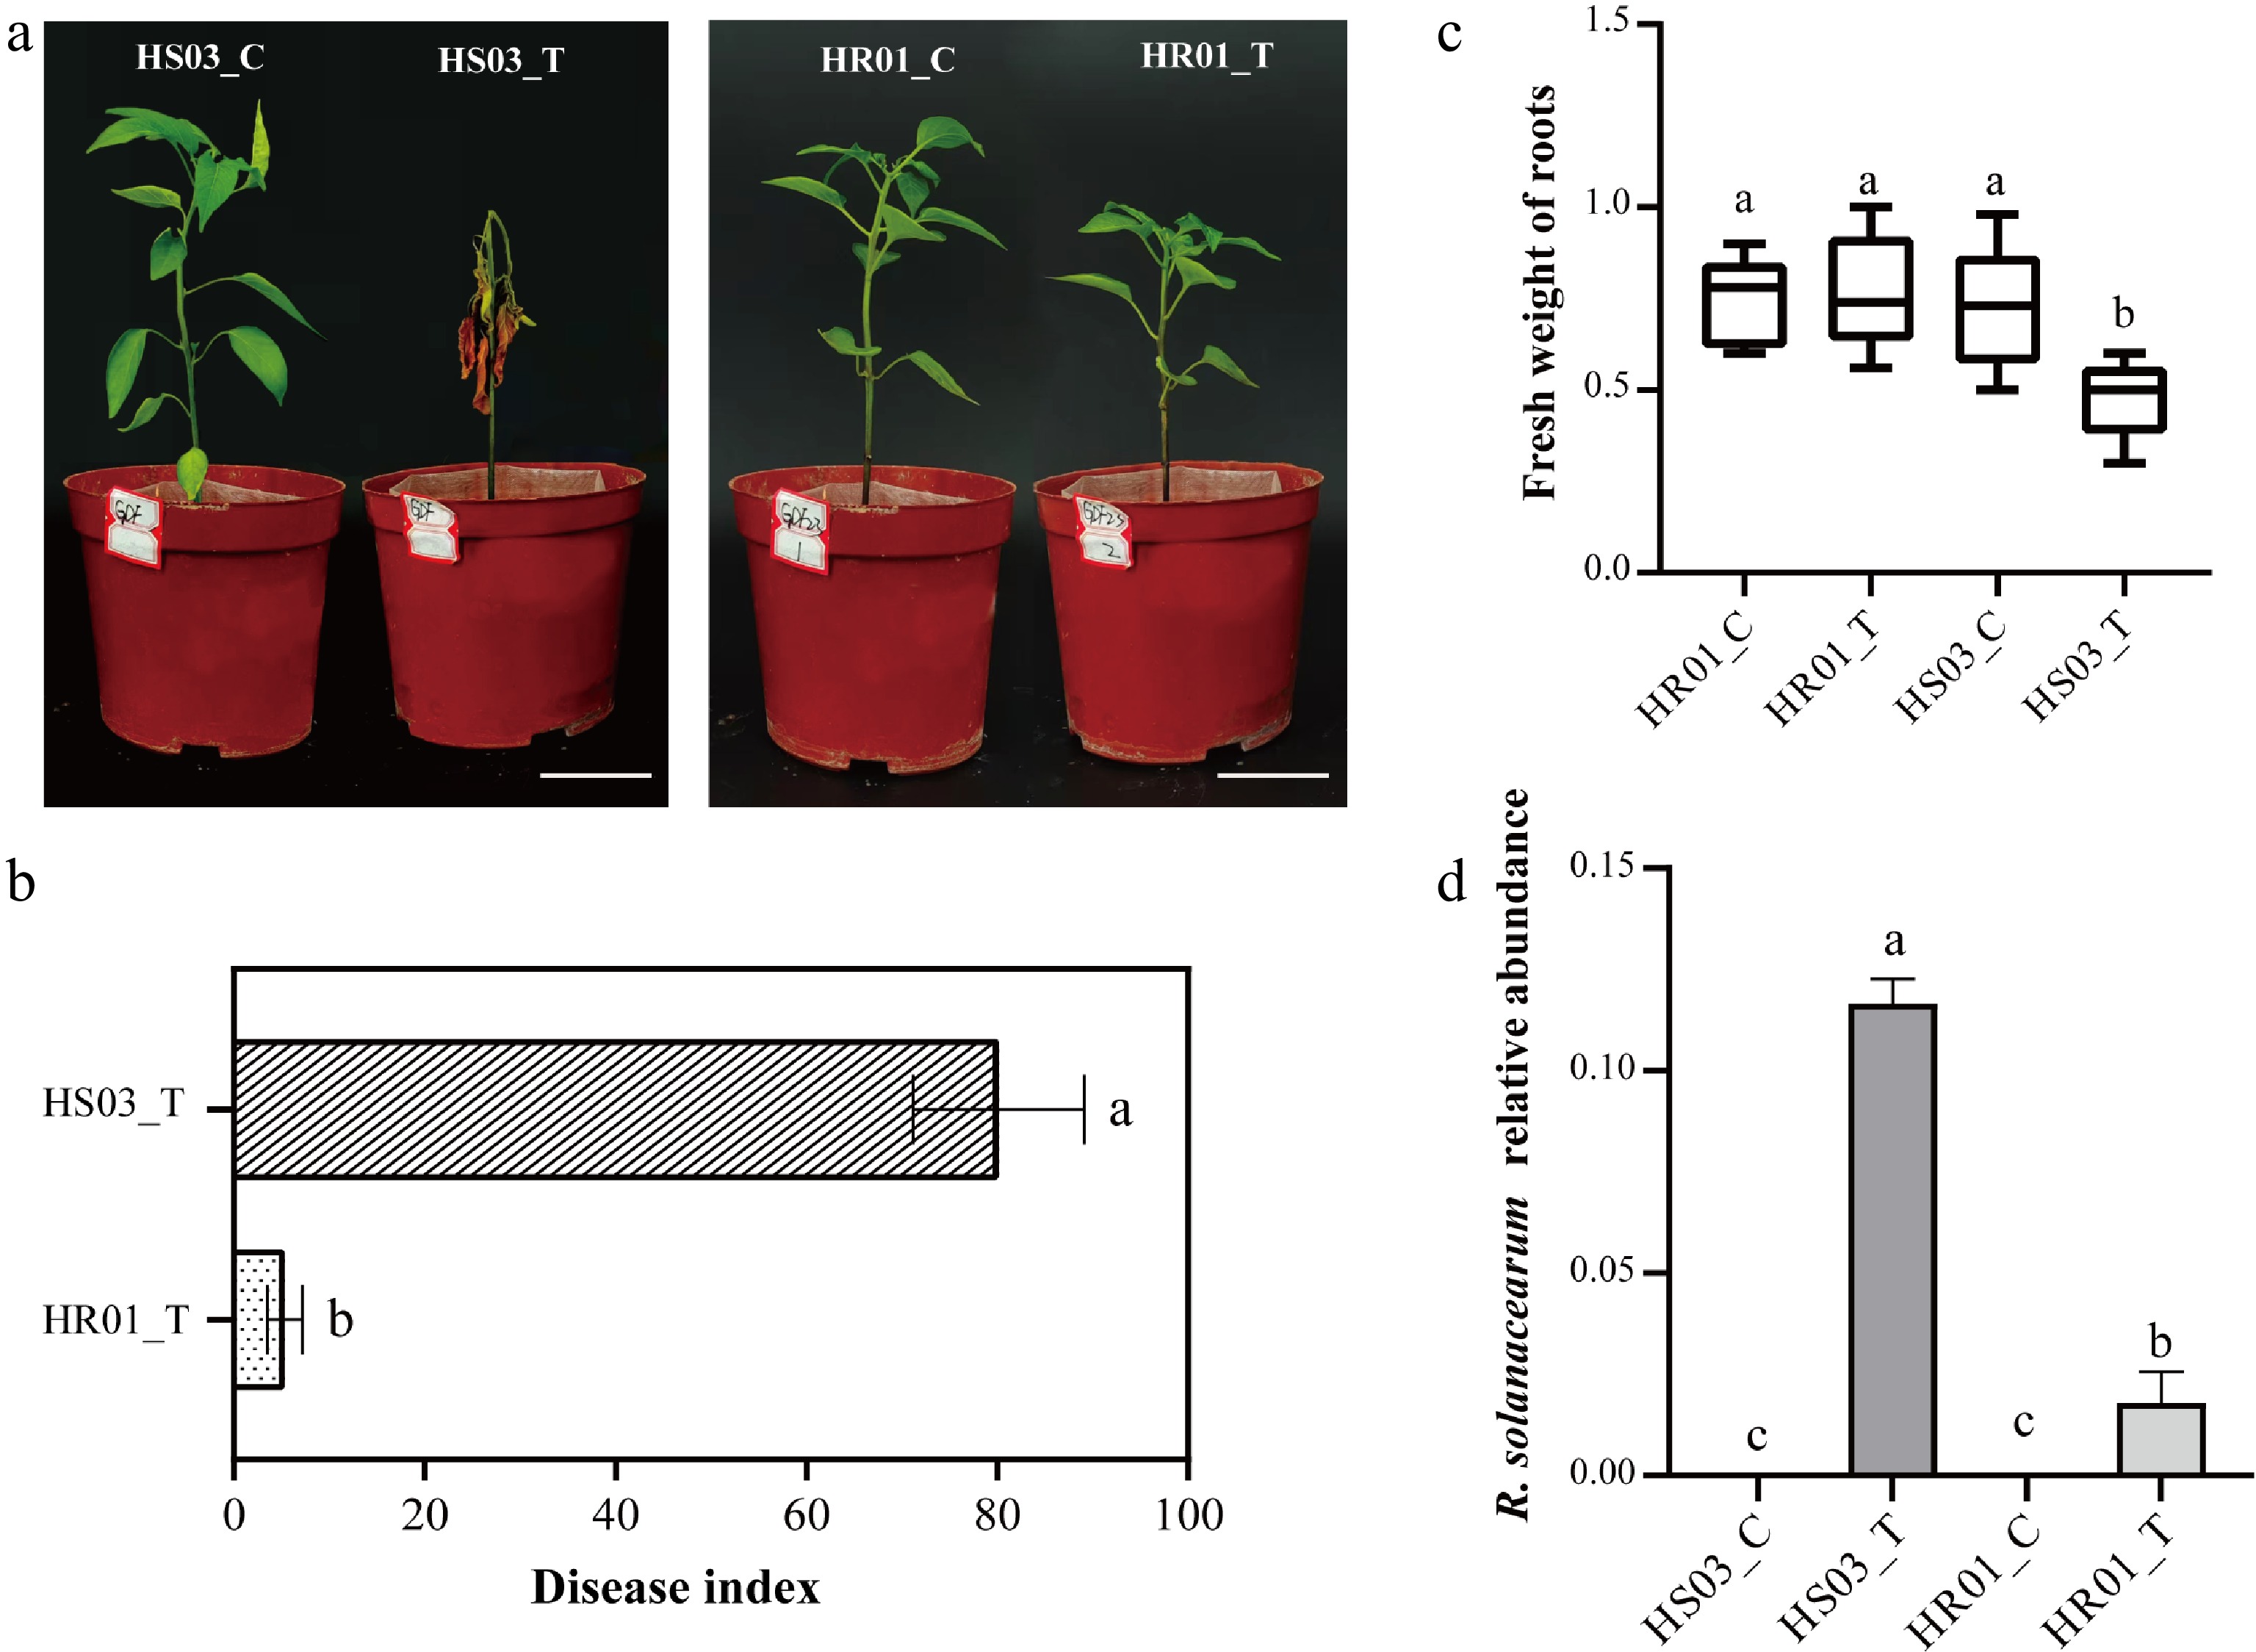
Figure 1.
Phenotypic characteristics of HR01 and HS03 following R. solanacearum inoculation. (a) Disease symptoms of HR01 and HS03 at 14 dpi. (b) Disease index of HR01 and HS03 at 14 dpi. (c) Fresh weight of roots of HR01 and HS03 at 14 dpi. (d) The relative abundance of R. solanacearum in the roots of HR01 and HS03 at 14 dpi. Data are presented as mean ± SD (n = 6). Statistical analyses were performed using the independent-samples t-test and one-way ANOVA followed by Tukey's post hoc test for normally distributed data, or the Kruskal–Wallis test followed by Dunn's post hoc test for non-normally distributed data. Different letters indicate a significant difference (p < 0.05). HR01_C, control group of the resistant cultivar HR01; HR01_T, inoculated group of the resistant cultivar HR01; HS03_C, control group of the susceptible cultivar HS03; HS03_T, inoculated group of the susceptible cultivar HS03. Scale bar = 5 cm.
-
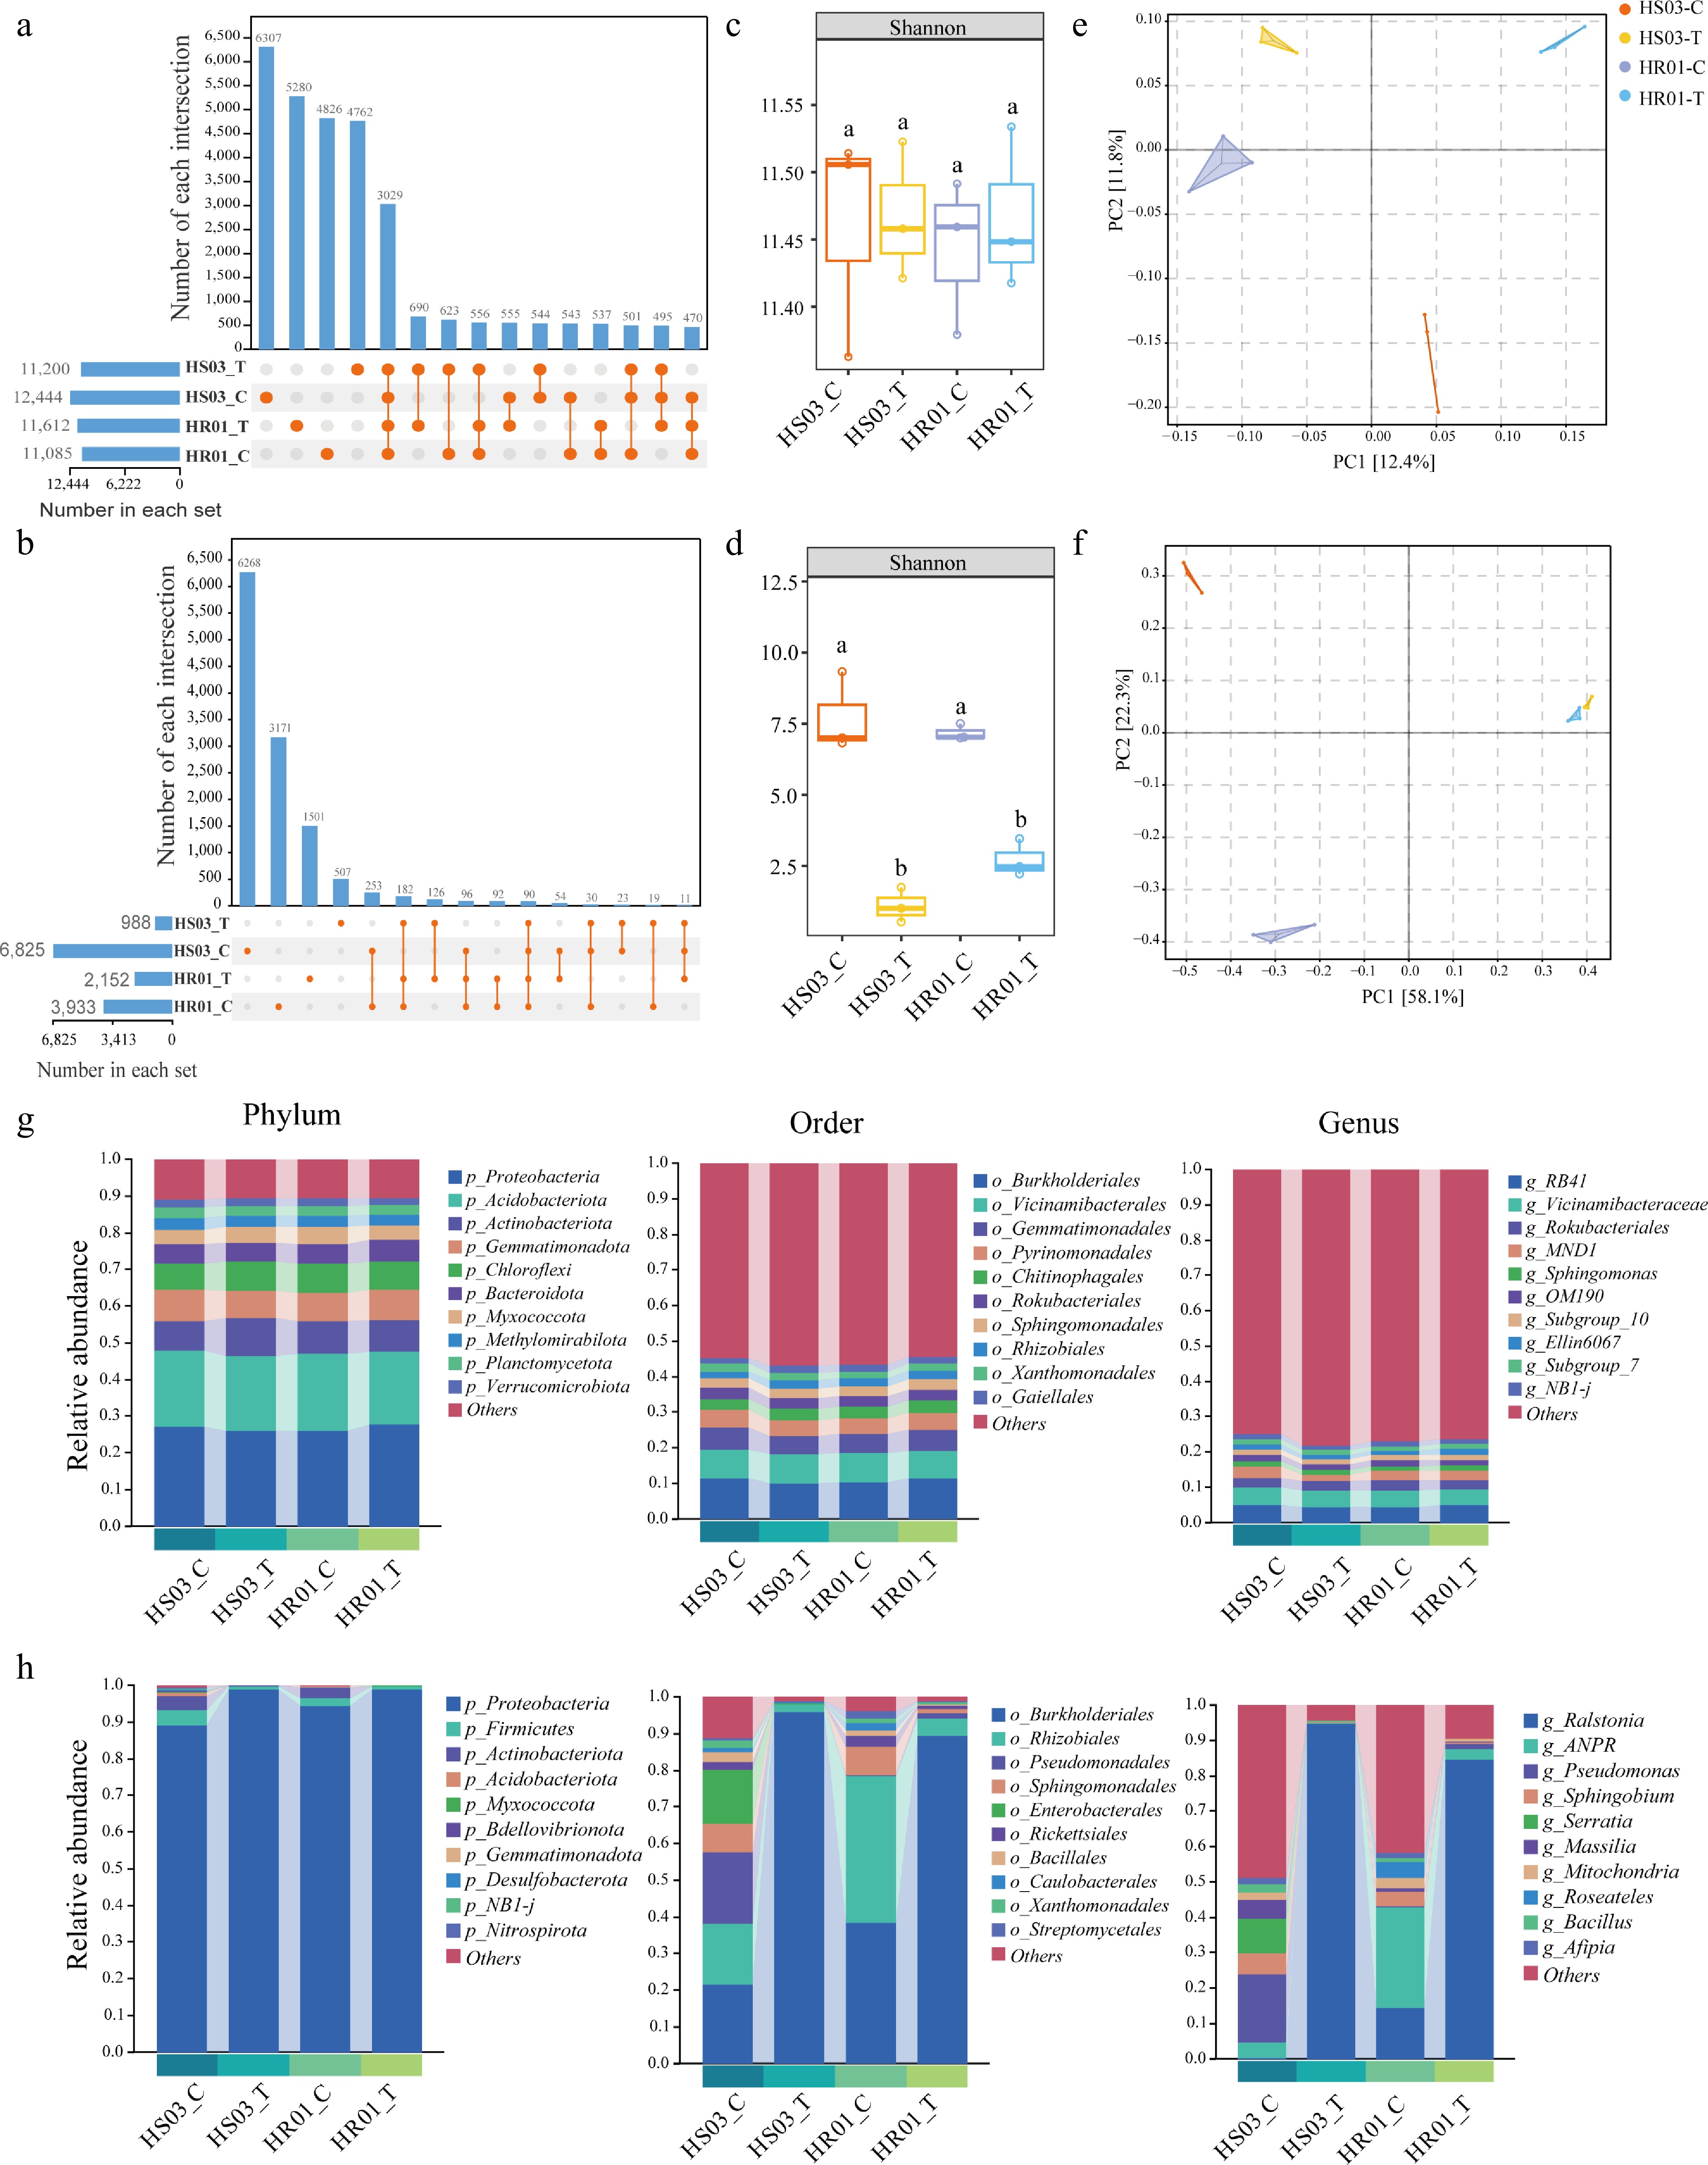
Figure 2.
Diversity and composition of rhizosphere and root bacterial communities in HR01 and HS03. (a), (b) Upset plots showing the number of ASVs detected in the rhizosphere (a) and root (b) bacterial communities. The bar plot on the left indicates the total number of taxa in each group; the matrix with orange (present) and gray (absent) dots below represents intersections among groups; the top bar plot displays the number of shared taxa in each intersection. (c), (d) Shannon index in the rhizosphere (c) and roots (d). (e), (f) PCA analysis in the rhizosphere (e) and roots (f). (g), (h) Relative abundances at the phylum, order, and genus level in the rhizosphere (g) and roots (h). Data are presented as mean ± SD from three biological replicates (n = 3). Statistical analyses were performed using the Kruskal–Wallis test followed by Dunn's post hoc test. Different letters indicate a significant difference (p < 0.05). HR01_C, control group of the resistant cultivar HR01; HR01_T, inoculated group of the resistant cultivar HR01; HS03_C, control group of the susceptible cultivar HS03; HS03_T, inoculated group of the susceptible cultivar HS03.
-
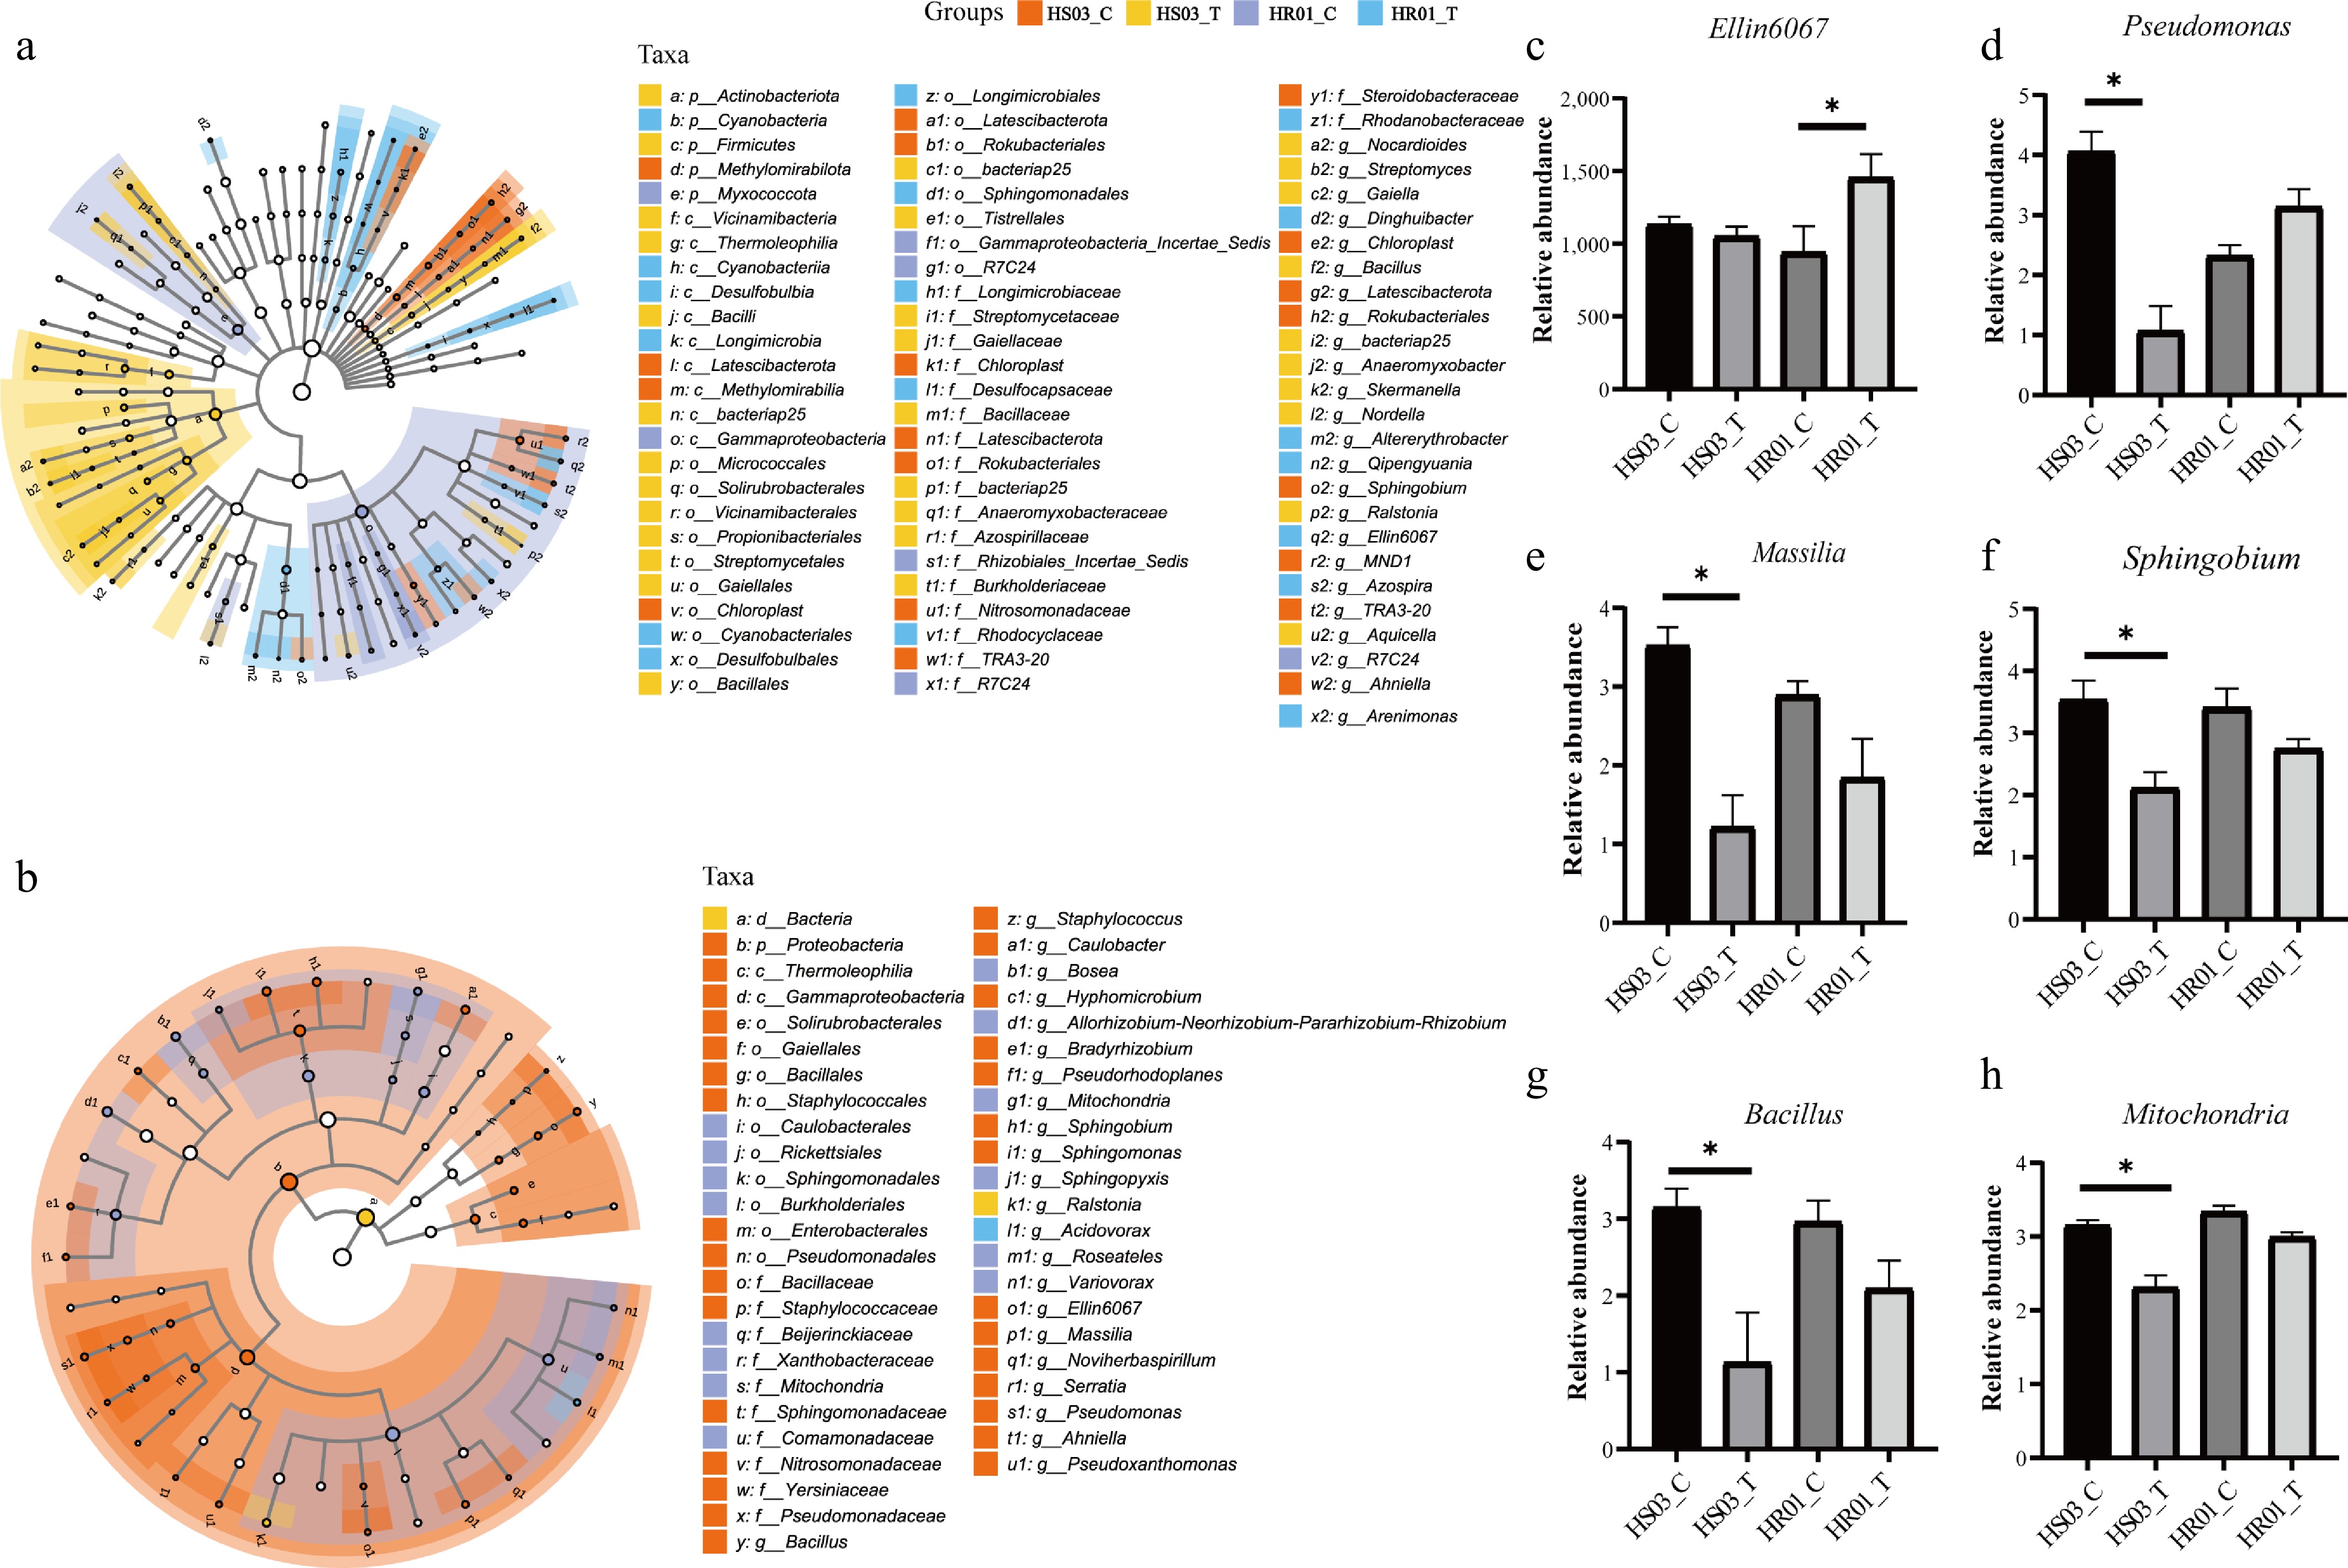
Figure 3.
Differential bacterial biomarkers in rhizosphere and root communities. (a), (b) LEfSe cladograms showing the phylogenetic distribution of bacterial lineages in the rhizosphere soil (a) and roots (b). (c) The relative abundance of significantly enriched genera in the rhizosphere soil. (d)–(h) The relative abundance of significantly enriched genera in the roots. Taxonomic annotations: p, phylum; c, class; o, order; f, family; g, genus; s, species. HR01_C, control group of the resistant cultivar HR01; HR01_T, inoculated group of the resistant cultivar HR01; HS03_C, control group of the susceptible cultivar HS03; HS03_T, inoculated group of the susceptible cultivar HS03. Data were log10-transformed and expressed as mean ± SD from three biological replicates (n = 3). Statistical analyses were performed using the Kruskal–Wallis test with Dunn's post hoc pairwise comparisons (*p < 0.05).
-
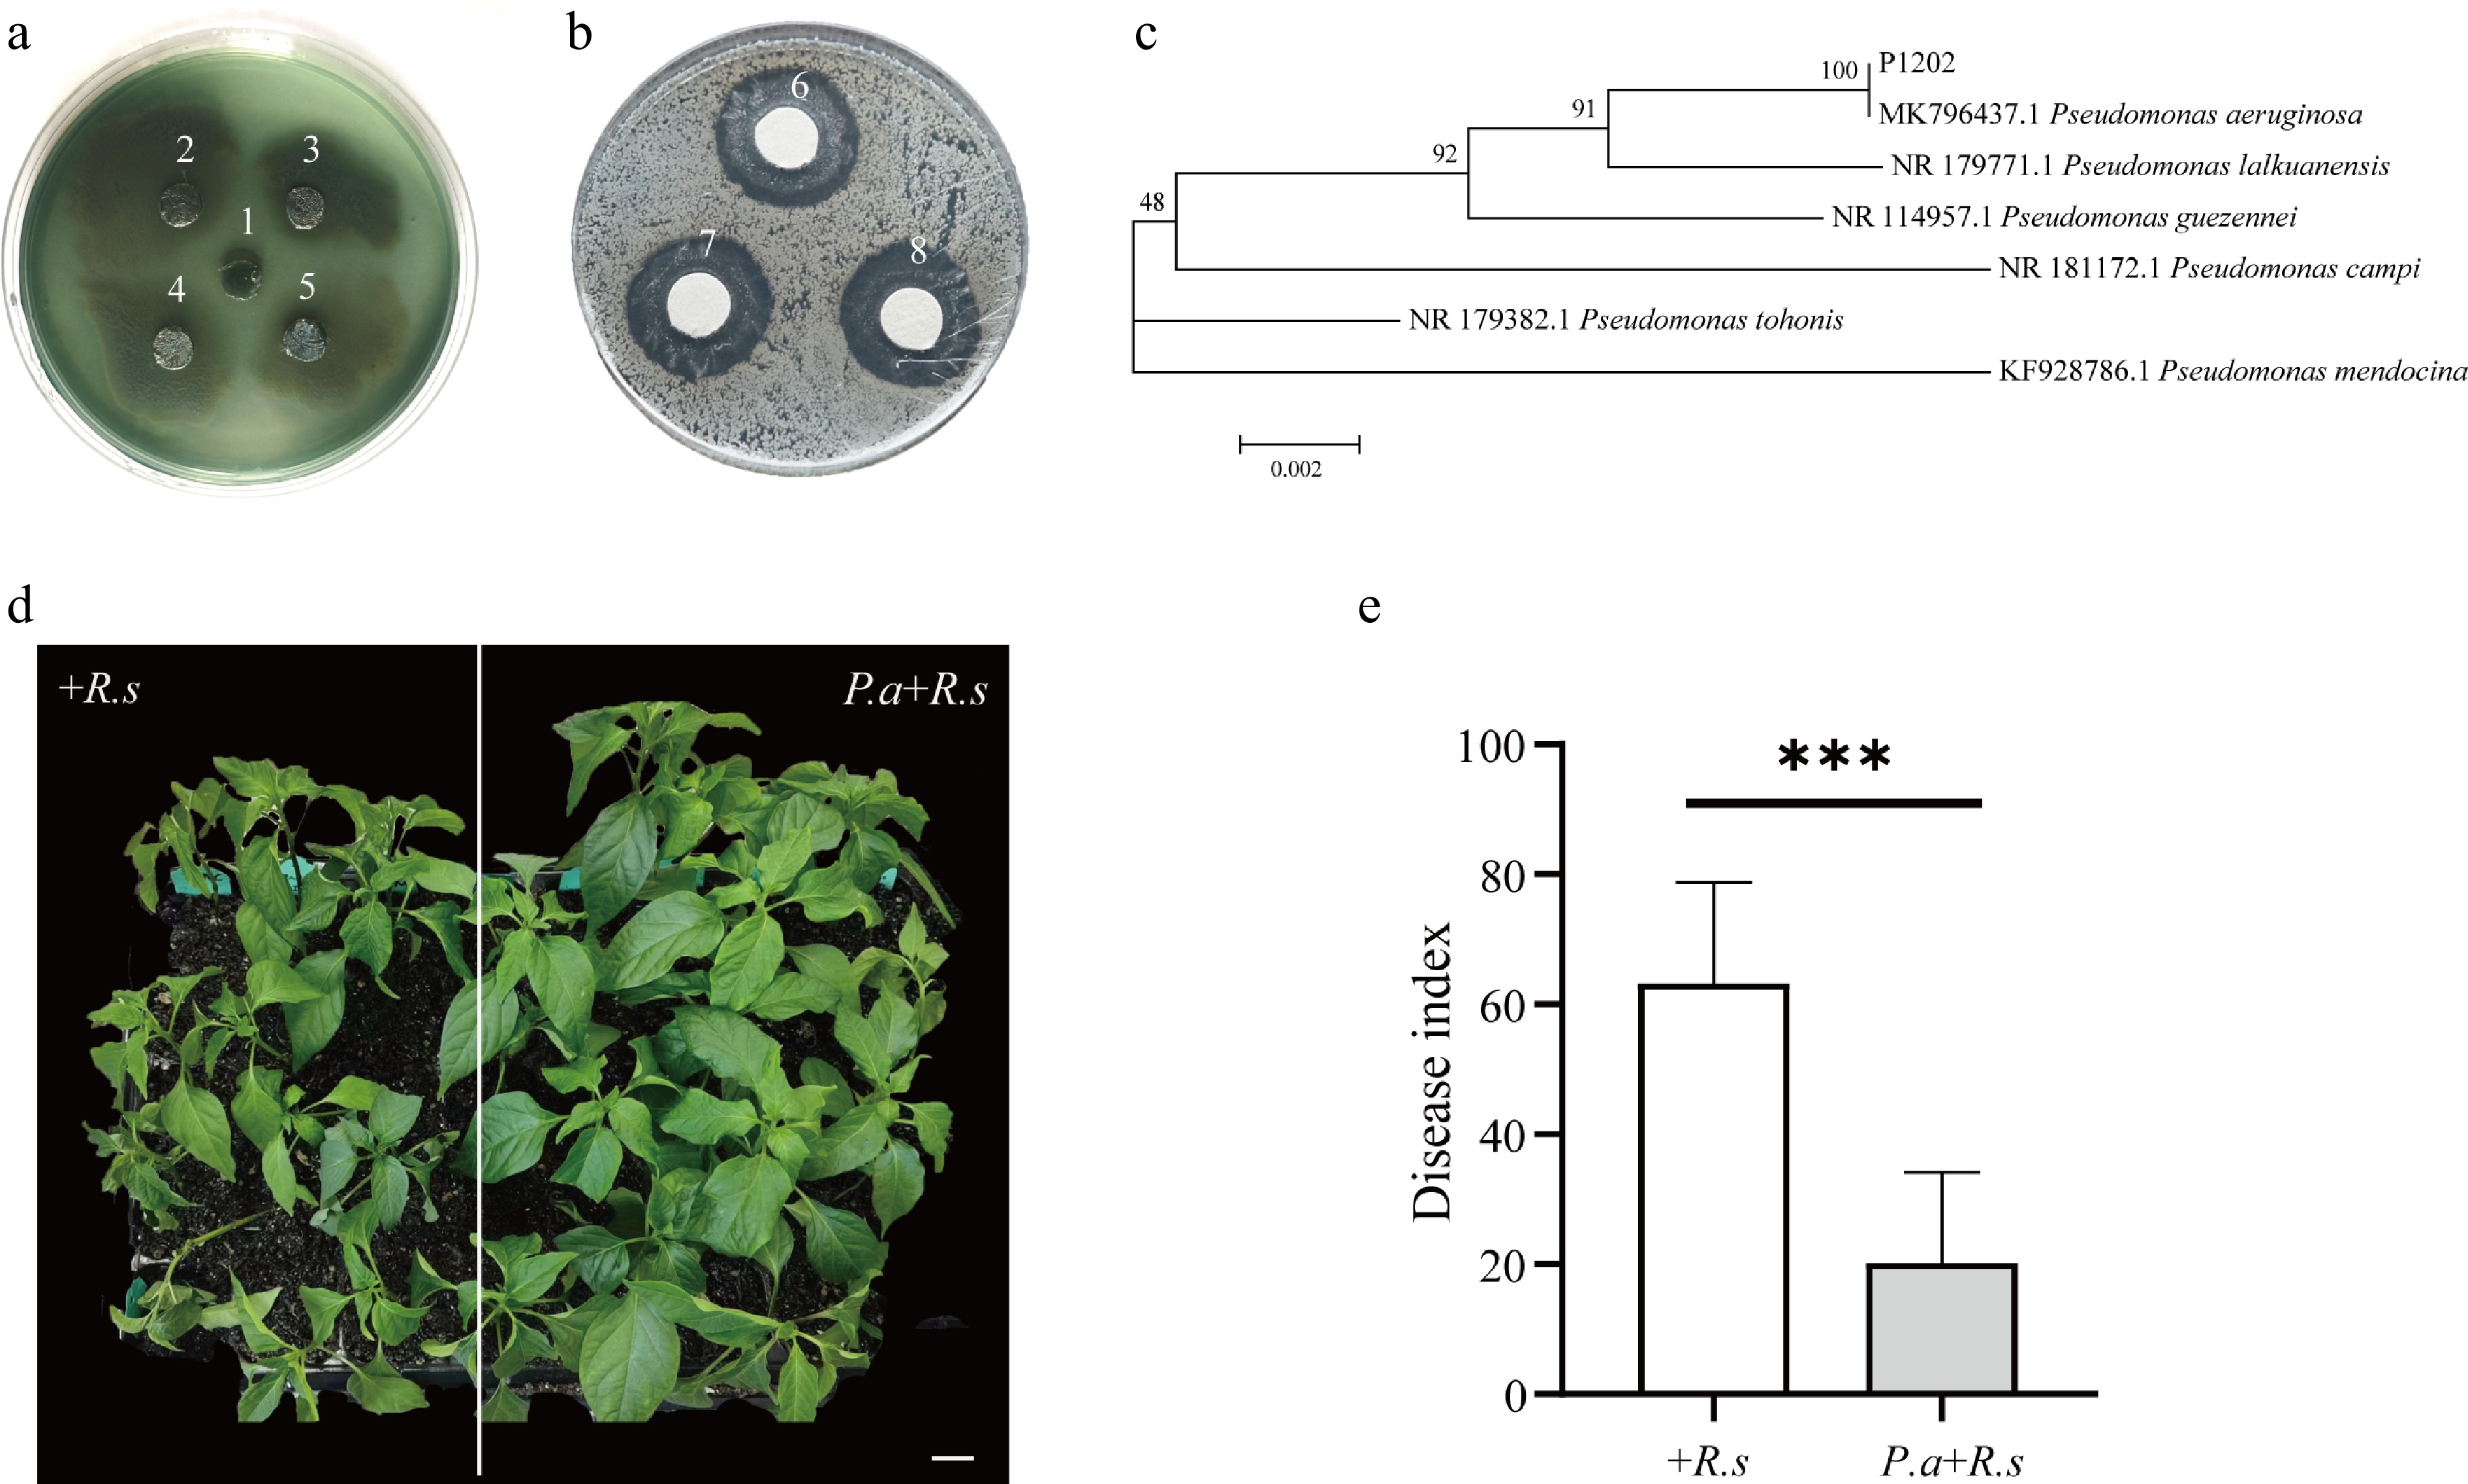
Figure 4.
Antagonistic activity and biocontrol potential of P. aeruginosa strain P1202. (a) Antagonistic activity of strain P1202 against R. solanacearum in a dual-culture assay. (b) Inhibitory effect of the cell-free fermentation broth of strain P1202 against R. solanacearum. In panels (a) and (b): 1, R. solanacearum; 2–5, P. aeruginosa strain P1202; 6–8, R. solanacearum exposed to the cell-free fermentation broth of P1202. (c) Phylogenetic tree based on the 16S rRNA sequence of strain P1202. (d) Disease symptoms of pepper plants in control (+R.s) and strain P1202 treatment groups (P.a+R.s) at 7 dpi. (e) Disease index of pepper plants in control (+R.s) and strain P1202 treatment groups (P.a+R.s) at 7 dpi. Data are presented as mean ± SD. Statistical analysis was performed using a two-tailed Student's t-test (n = 3 independent experiments, ***p < 0.001). Scale bar = 3 cm.
-
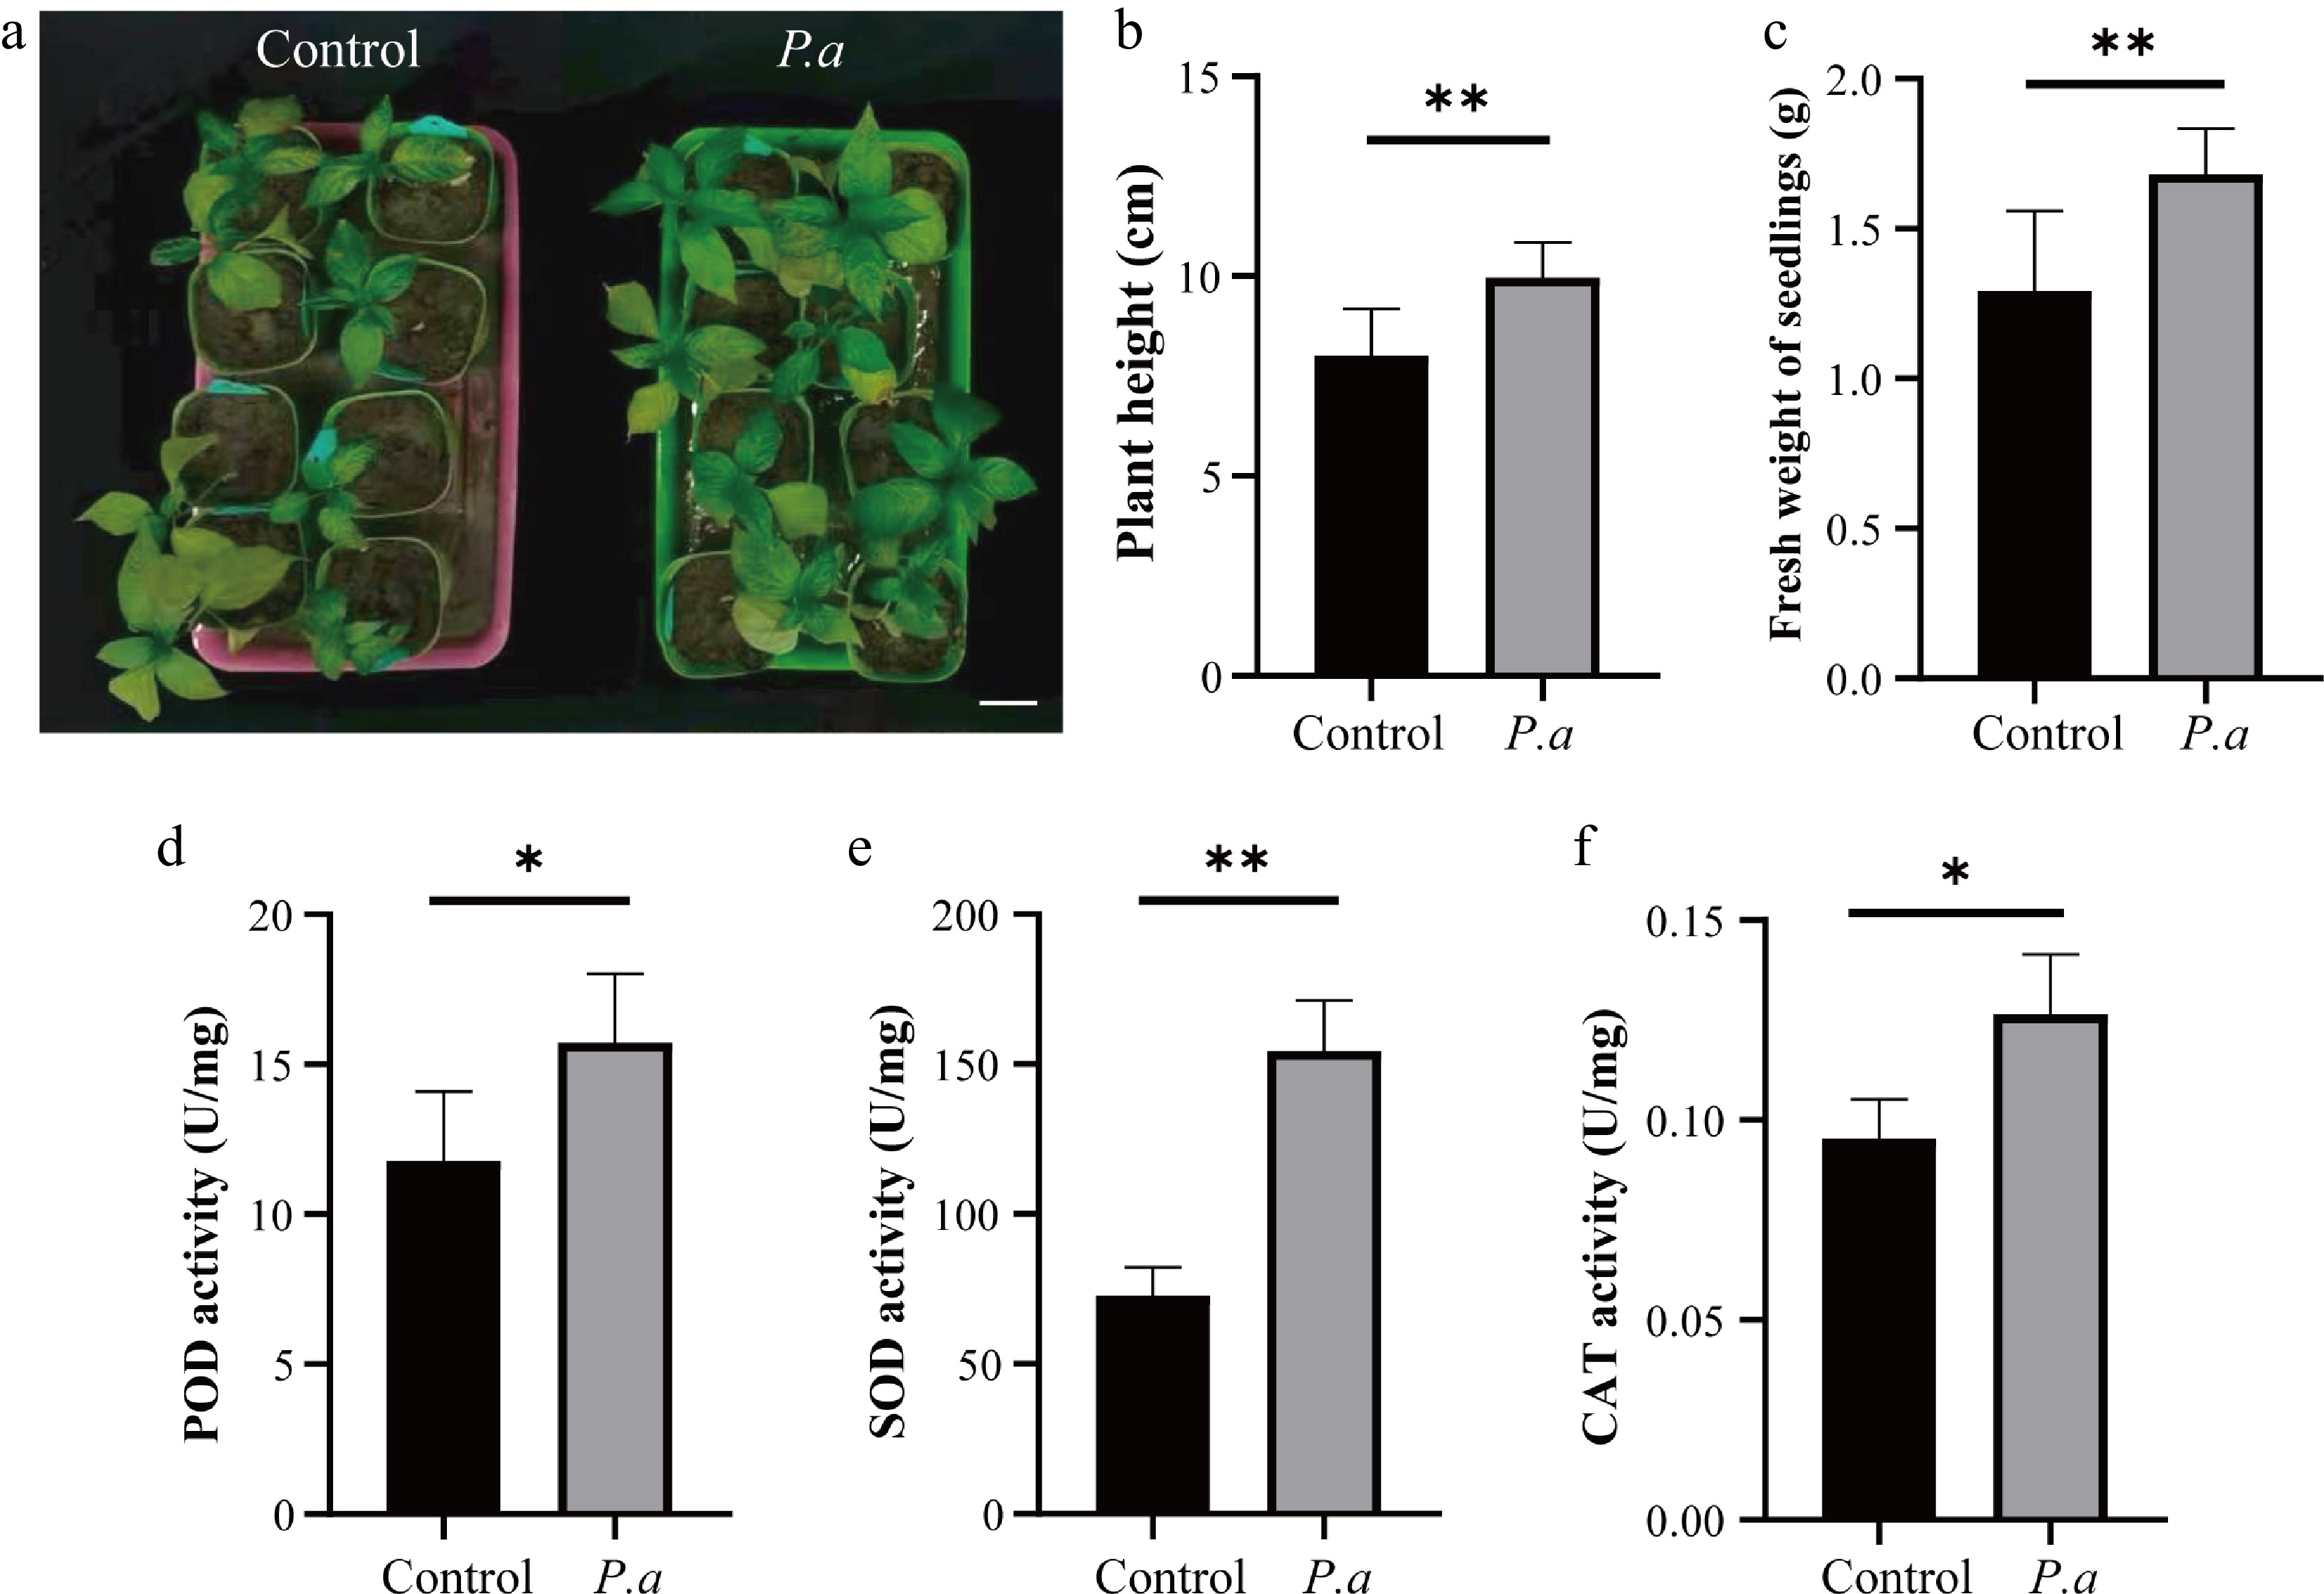
Figure 5.
Pseudomonas aeruginosa promotes plant growth and enhances antioxidant enzyme activities in pepper plants. (a) Phenotypes of control plants and plants pretreated with P. aeruginosa for two weeks (P.a). (b) Plant height of control and P.a plants. (c) Fresh weight of seedlings of control and P.a plants. (d) POD activity in control and P.a plants. (e) SOD activity in control and P.a plants. (f) CAT activity in control and P.a plants. Data are presented as mean ± SD from eight biological replicates (n = 8). Statistical analysis was performed using a two-tailed Student's t-test (*p < 0.05, **p < 0.01). Scale bar = 3 cm.
-
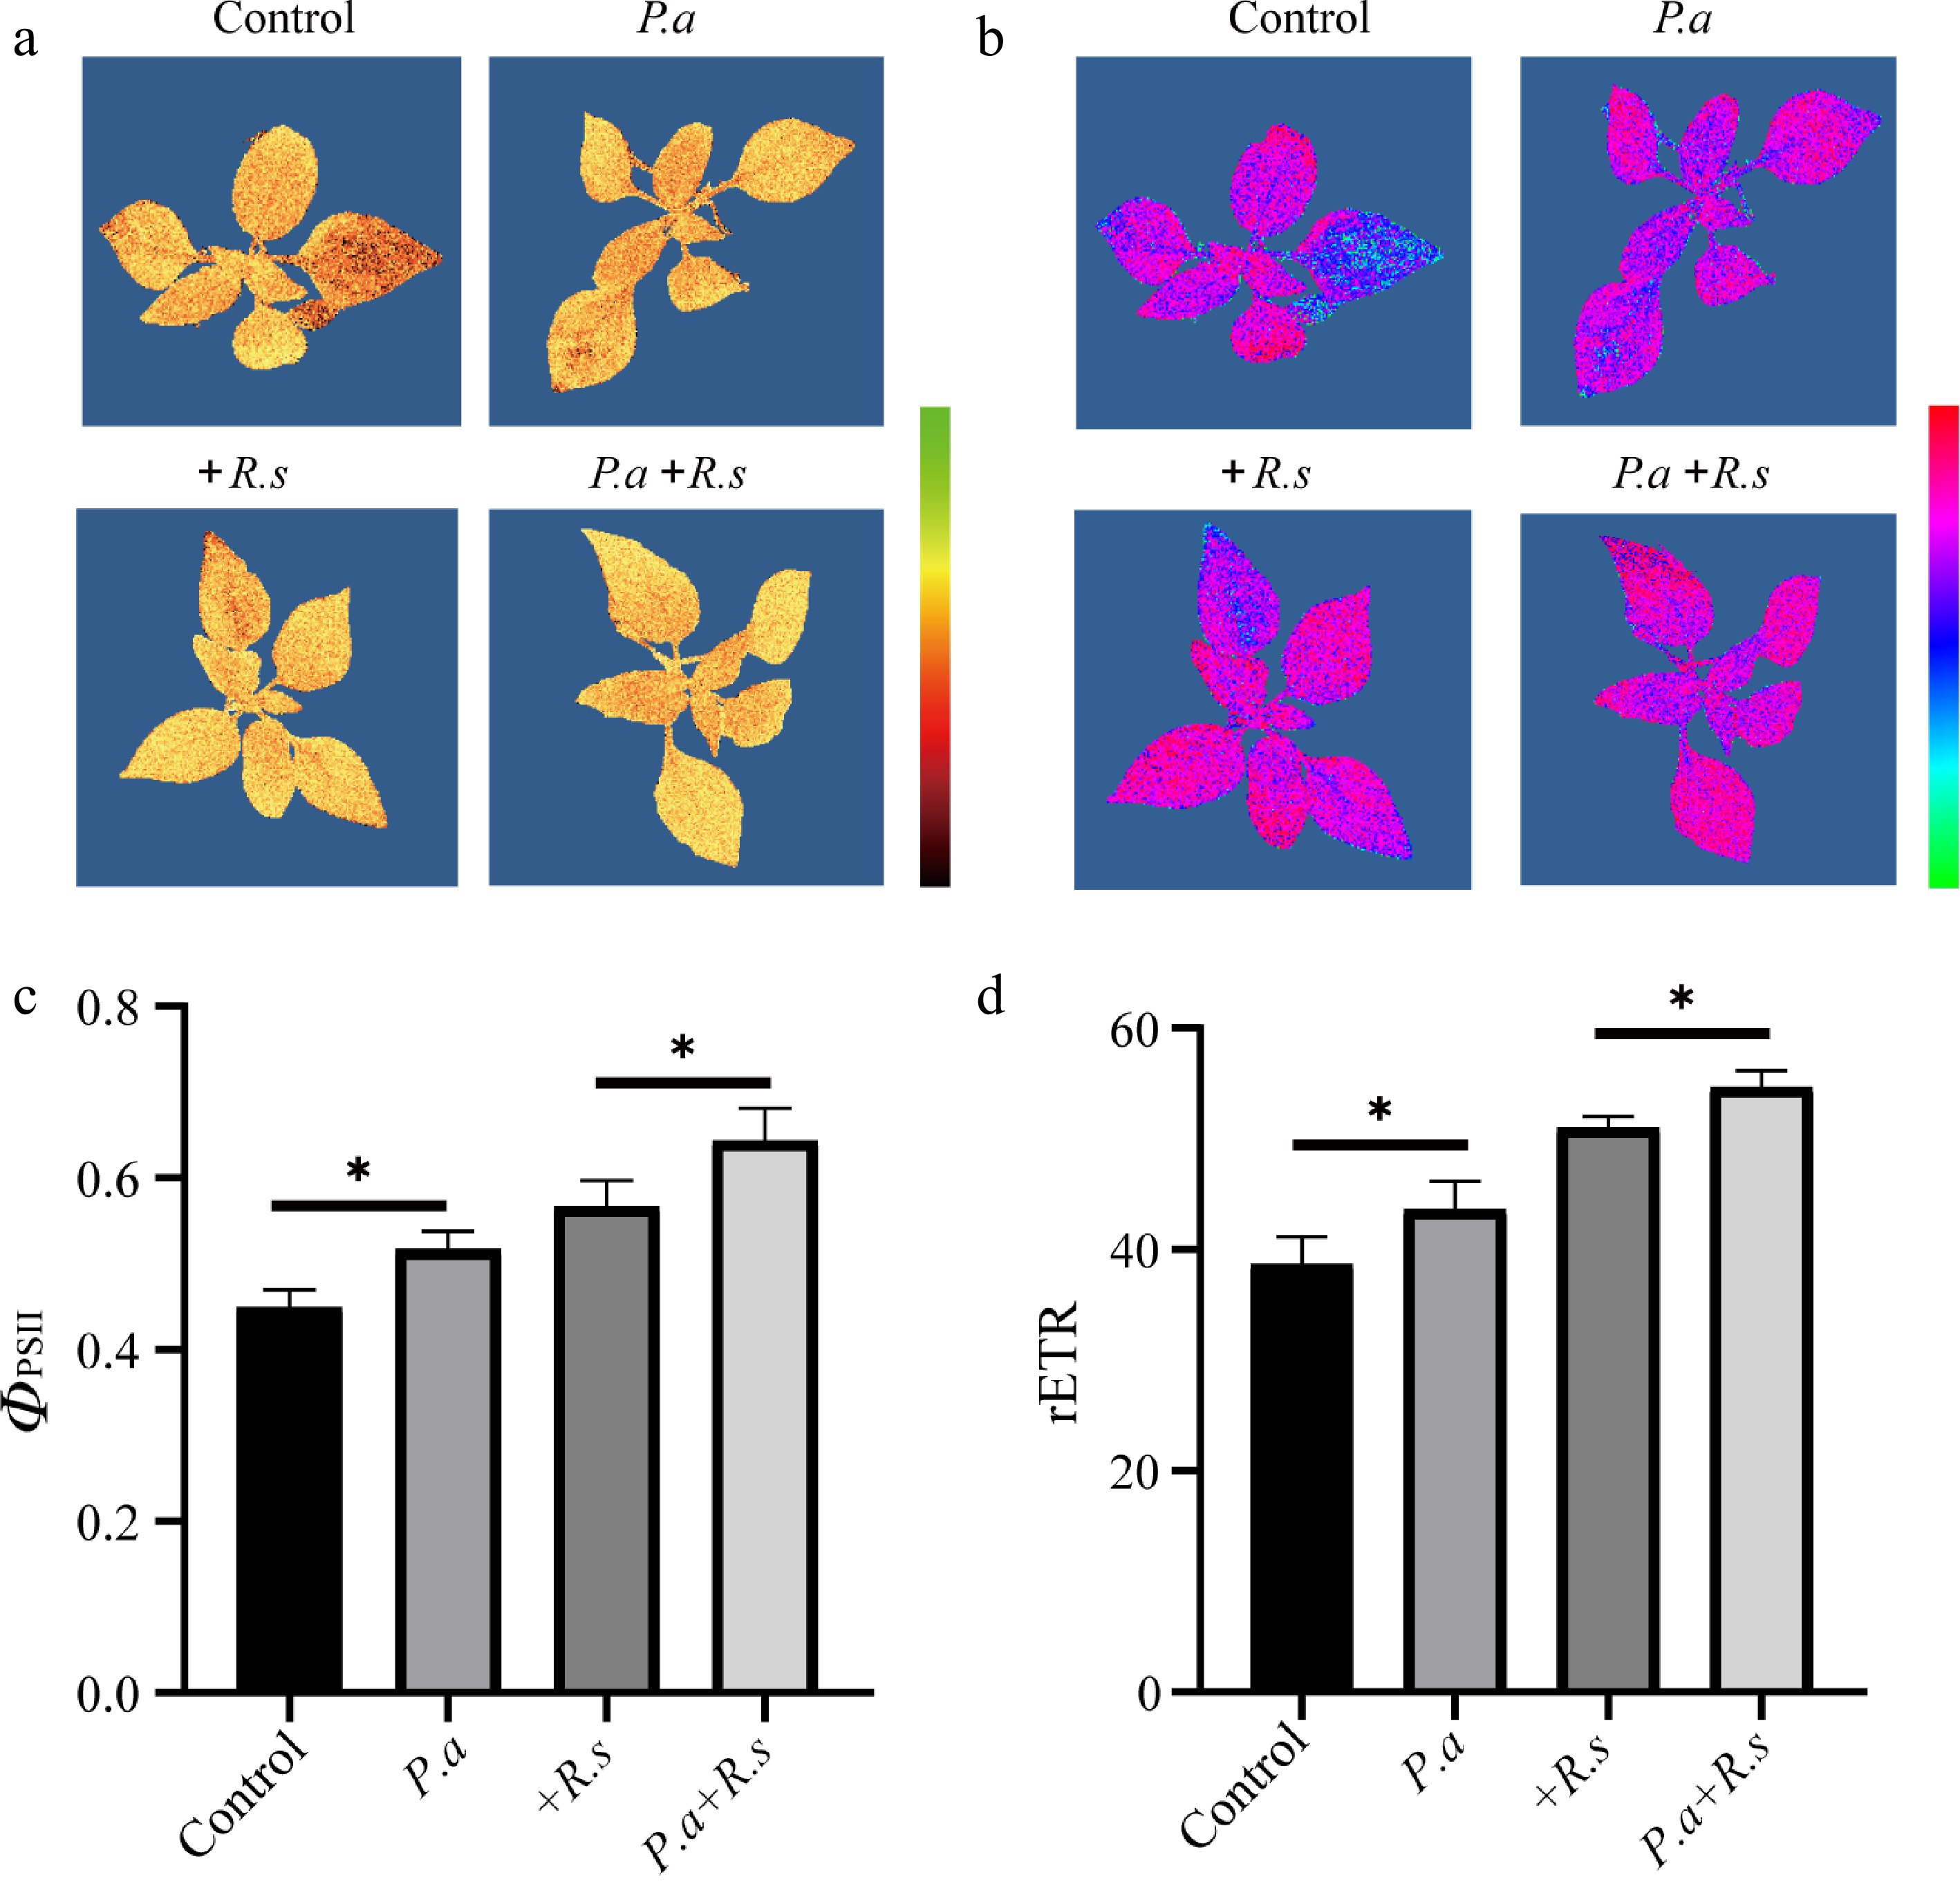
Figure 6.
Chlorophyll fluorescence responses of pepper plants under different treatments. (a), (b) Pseudocolor images of ΦPSII (a) and rETR (b) in four treatments: control plants, plants inoculated with R. solanacearum for 16 h (+R.s), plants pretreated with P. aeruginosa for 2 weeks (P.a), and plants pretreated with P. aeruginosa for 2 weeks followed by R. solanacearum inoculation for 16 h (P.a+R.s). (c), (d) Quantitative analysis of ΦPSII (c) and rETR (d) in control, +R.s, P.a, and P.a+R.s plants. Color cards indicate that the value gradually decreases from top to bottom. Data are presented as mean ± SD from eight biological replicates (n = 8). Statistical analysis was performed using a two-tailed Student's t-test (*p < 0.05).
-
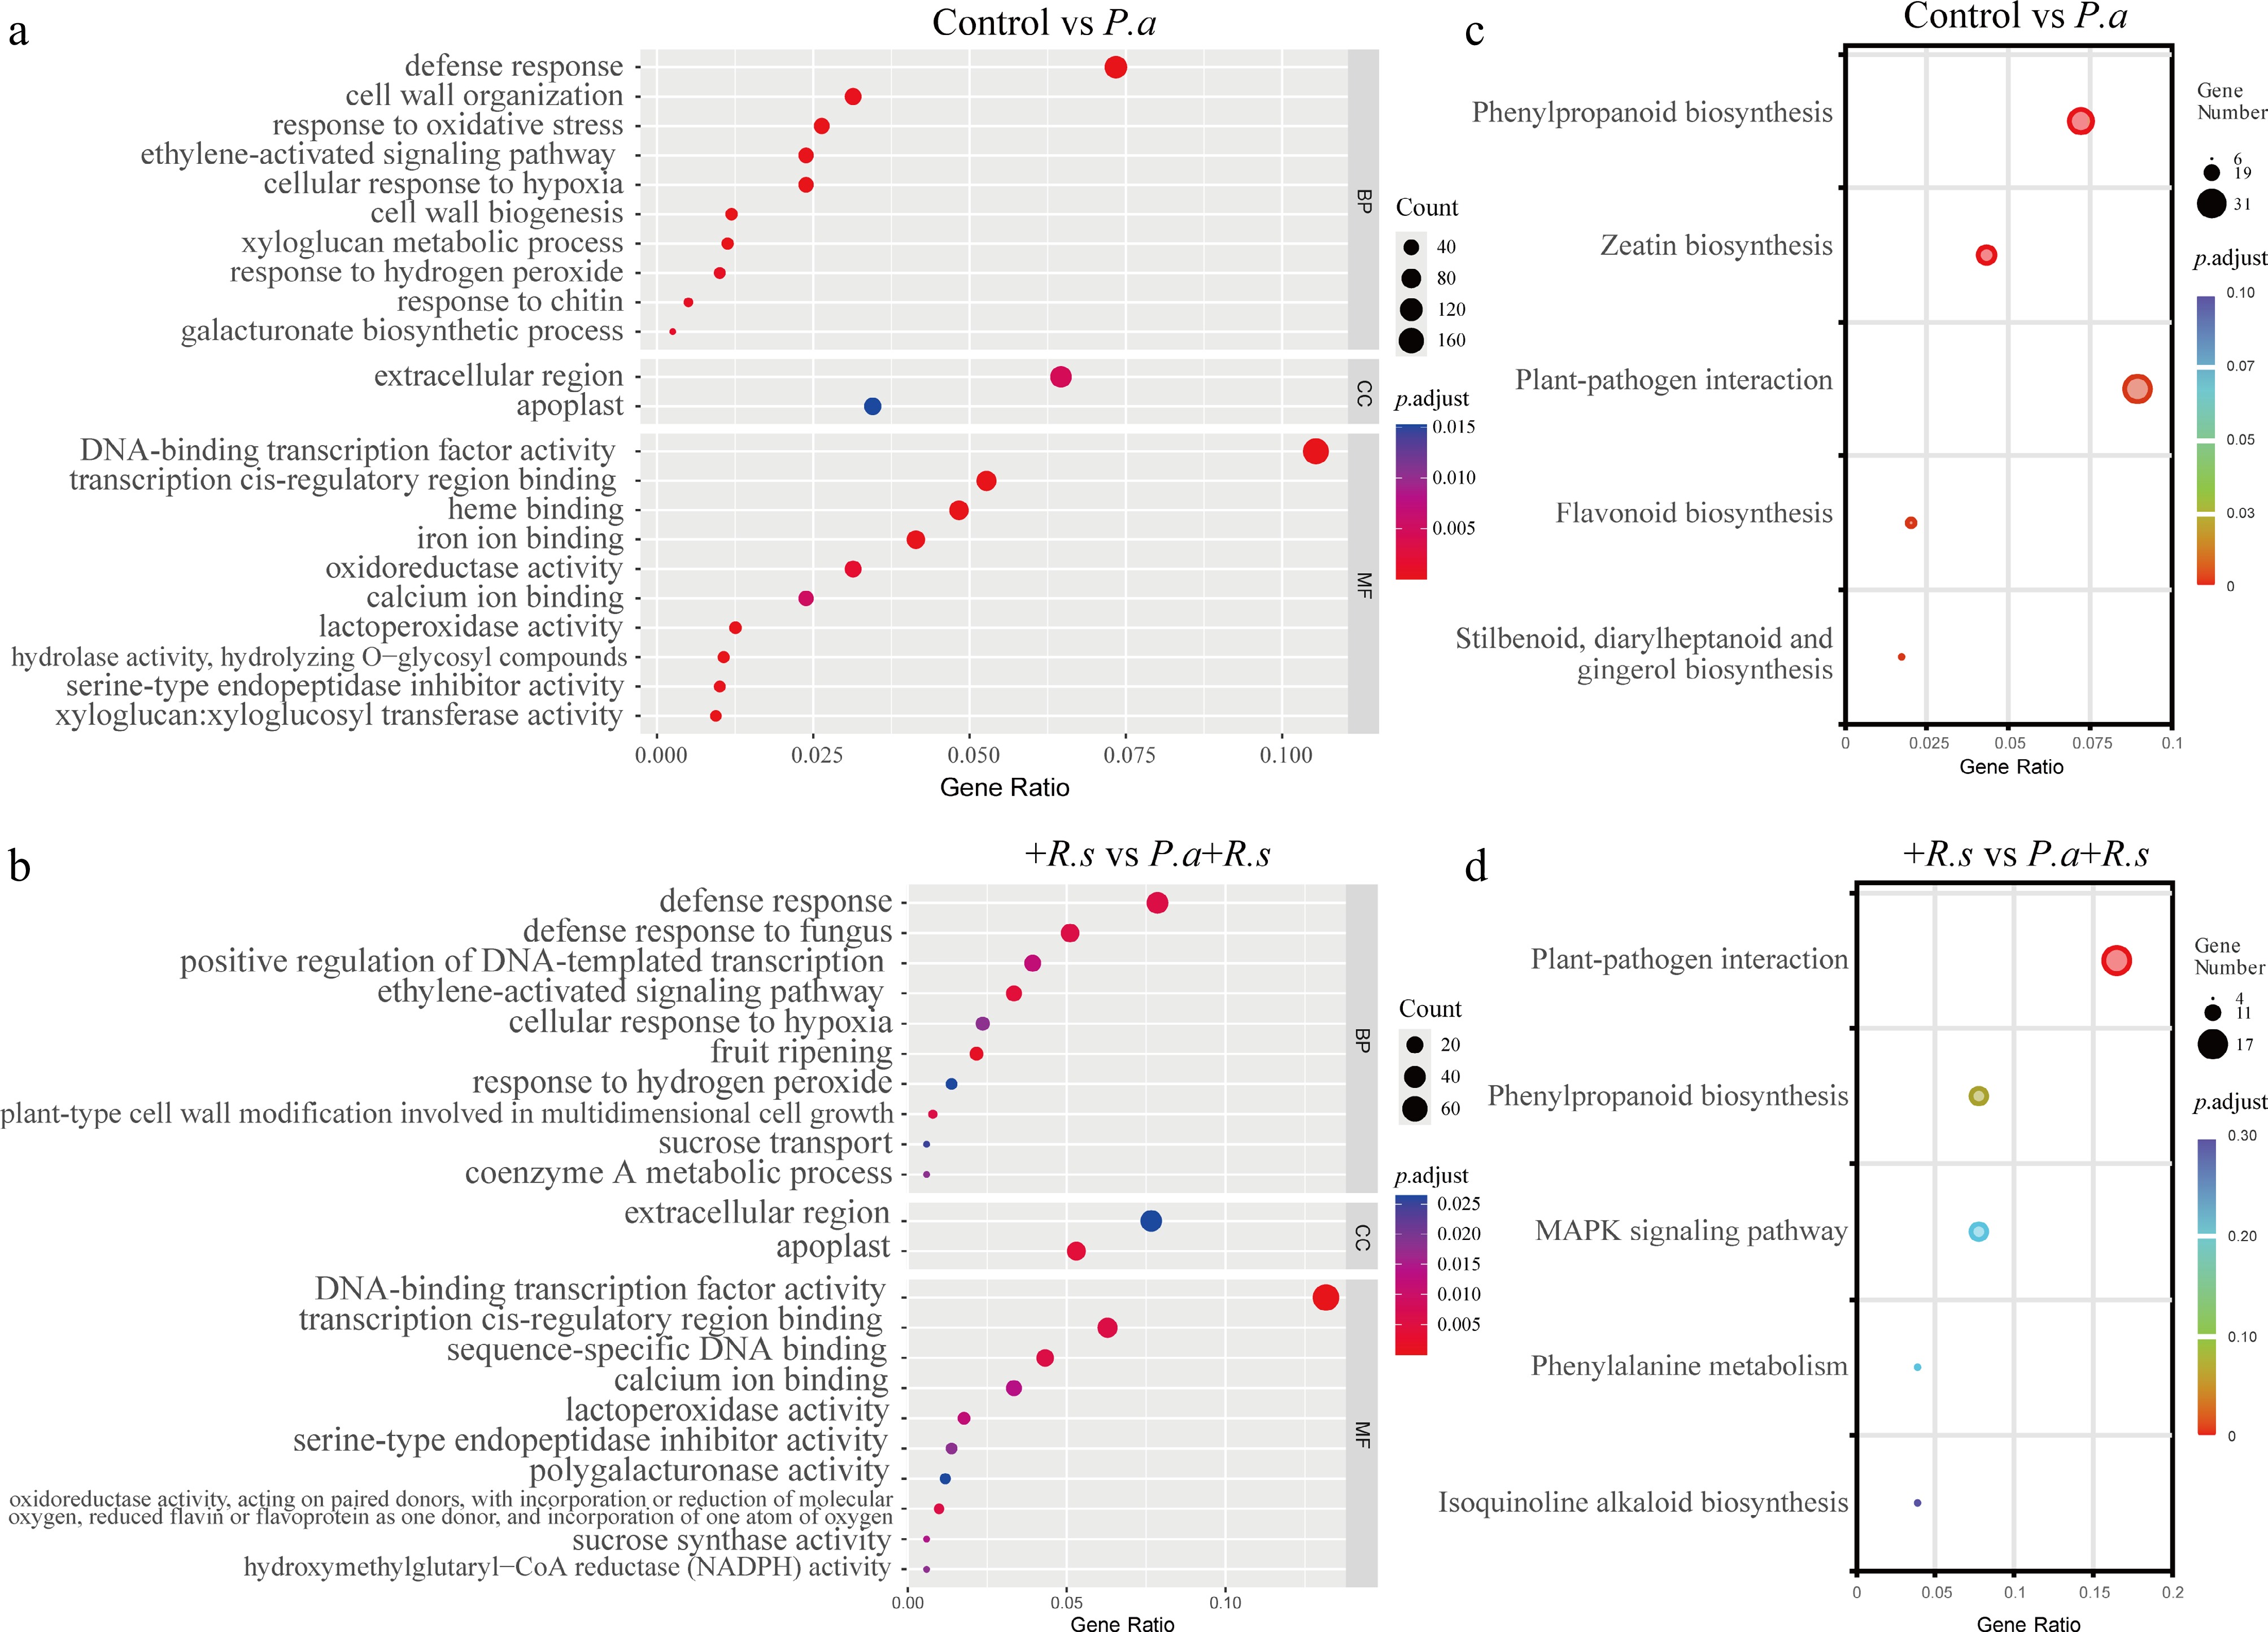
Figure 7.
Functional enrichment analysis of DEGs. (a), (b) GO enrichment analysis of DEGs between the control group and the group pretreated with P. aeruginosa for 2 weeks (control vs P.a) (a), and between the group inoculated with R. solanacearum for 16 h and the group pretreated with P. aeruginosa for 2 weeks followed by R. solanacearum inoculation for 16 h (+R.s vs P.a+R.s) (b). (c), (d) KEGG enrichment analysis of DEGs between the control group and the group pretreated with P. aeruginosa for 2 weeks (control vs P.a) (c), and between the group inoculated with R. solanacearum for 16 h and pretreated with P. aeruginosa for 2 weeks followed by R. solanacearum inoculation for 16 h (+R.s vs P.a+R.s) (d).
-
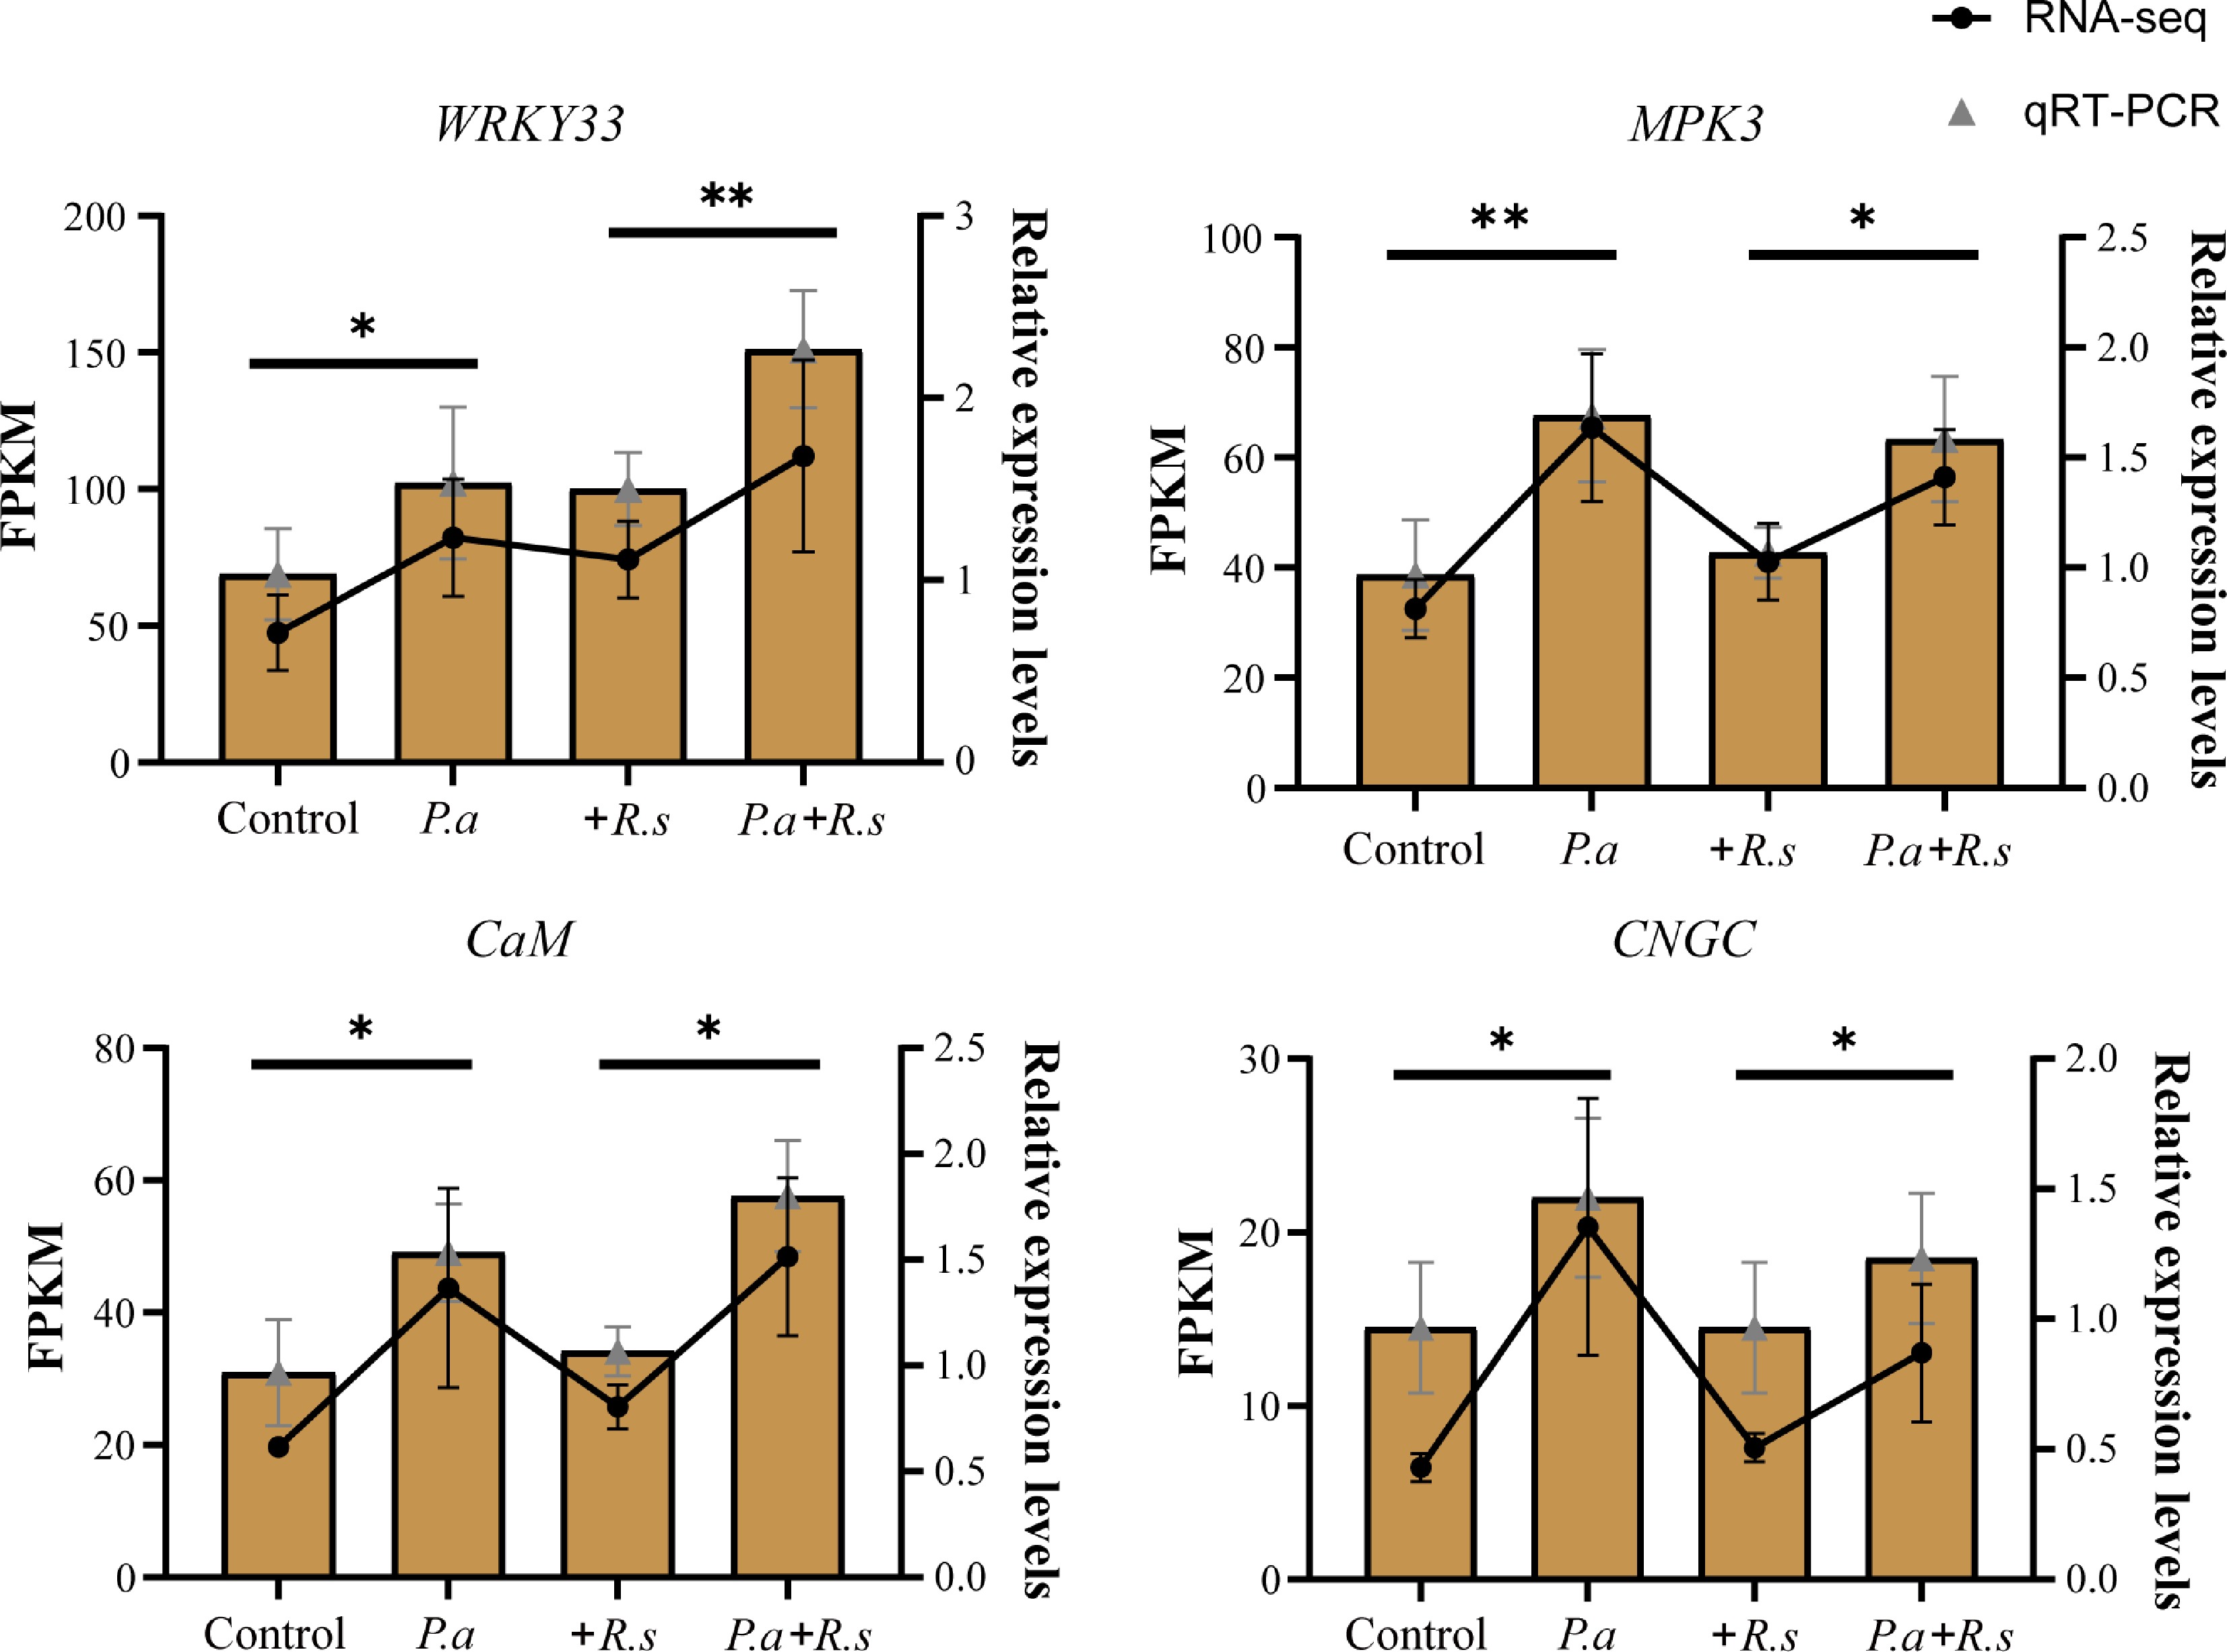
Figure 8.
Expression patterns of defense-related genes in pepper roots under different treatments. Expression patterns of key genes (WRKY33, MPK3, CaM, and CNGC) under different treatments (control, P.a, +R.s, and P.a+R.s). FPKM values were log-normalized and clustered by rows. Lines represent transcriptome (RNA-seq) data, and bars represent qRT-PCR data. Data are presented as mean ± SD from three biological replicates (n = 3). Statistical significance was determined using a two-tailed Student's t-test (*p < 0.05, **p < 0.01).
-
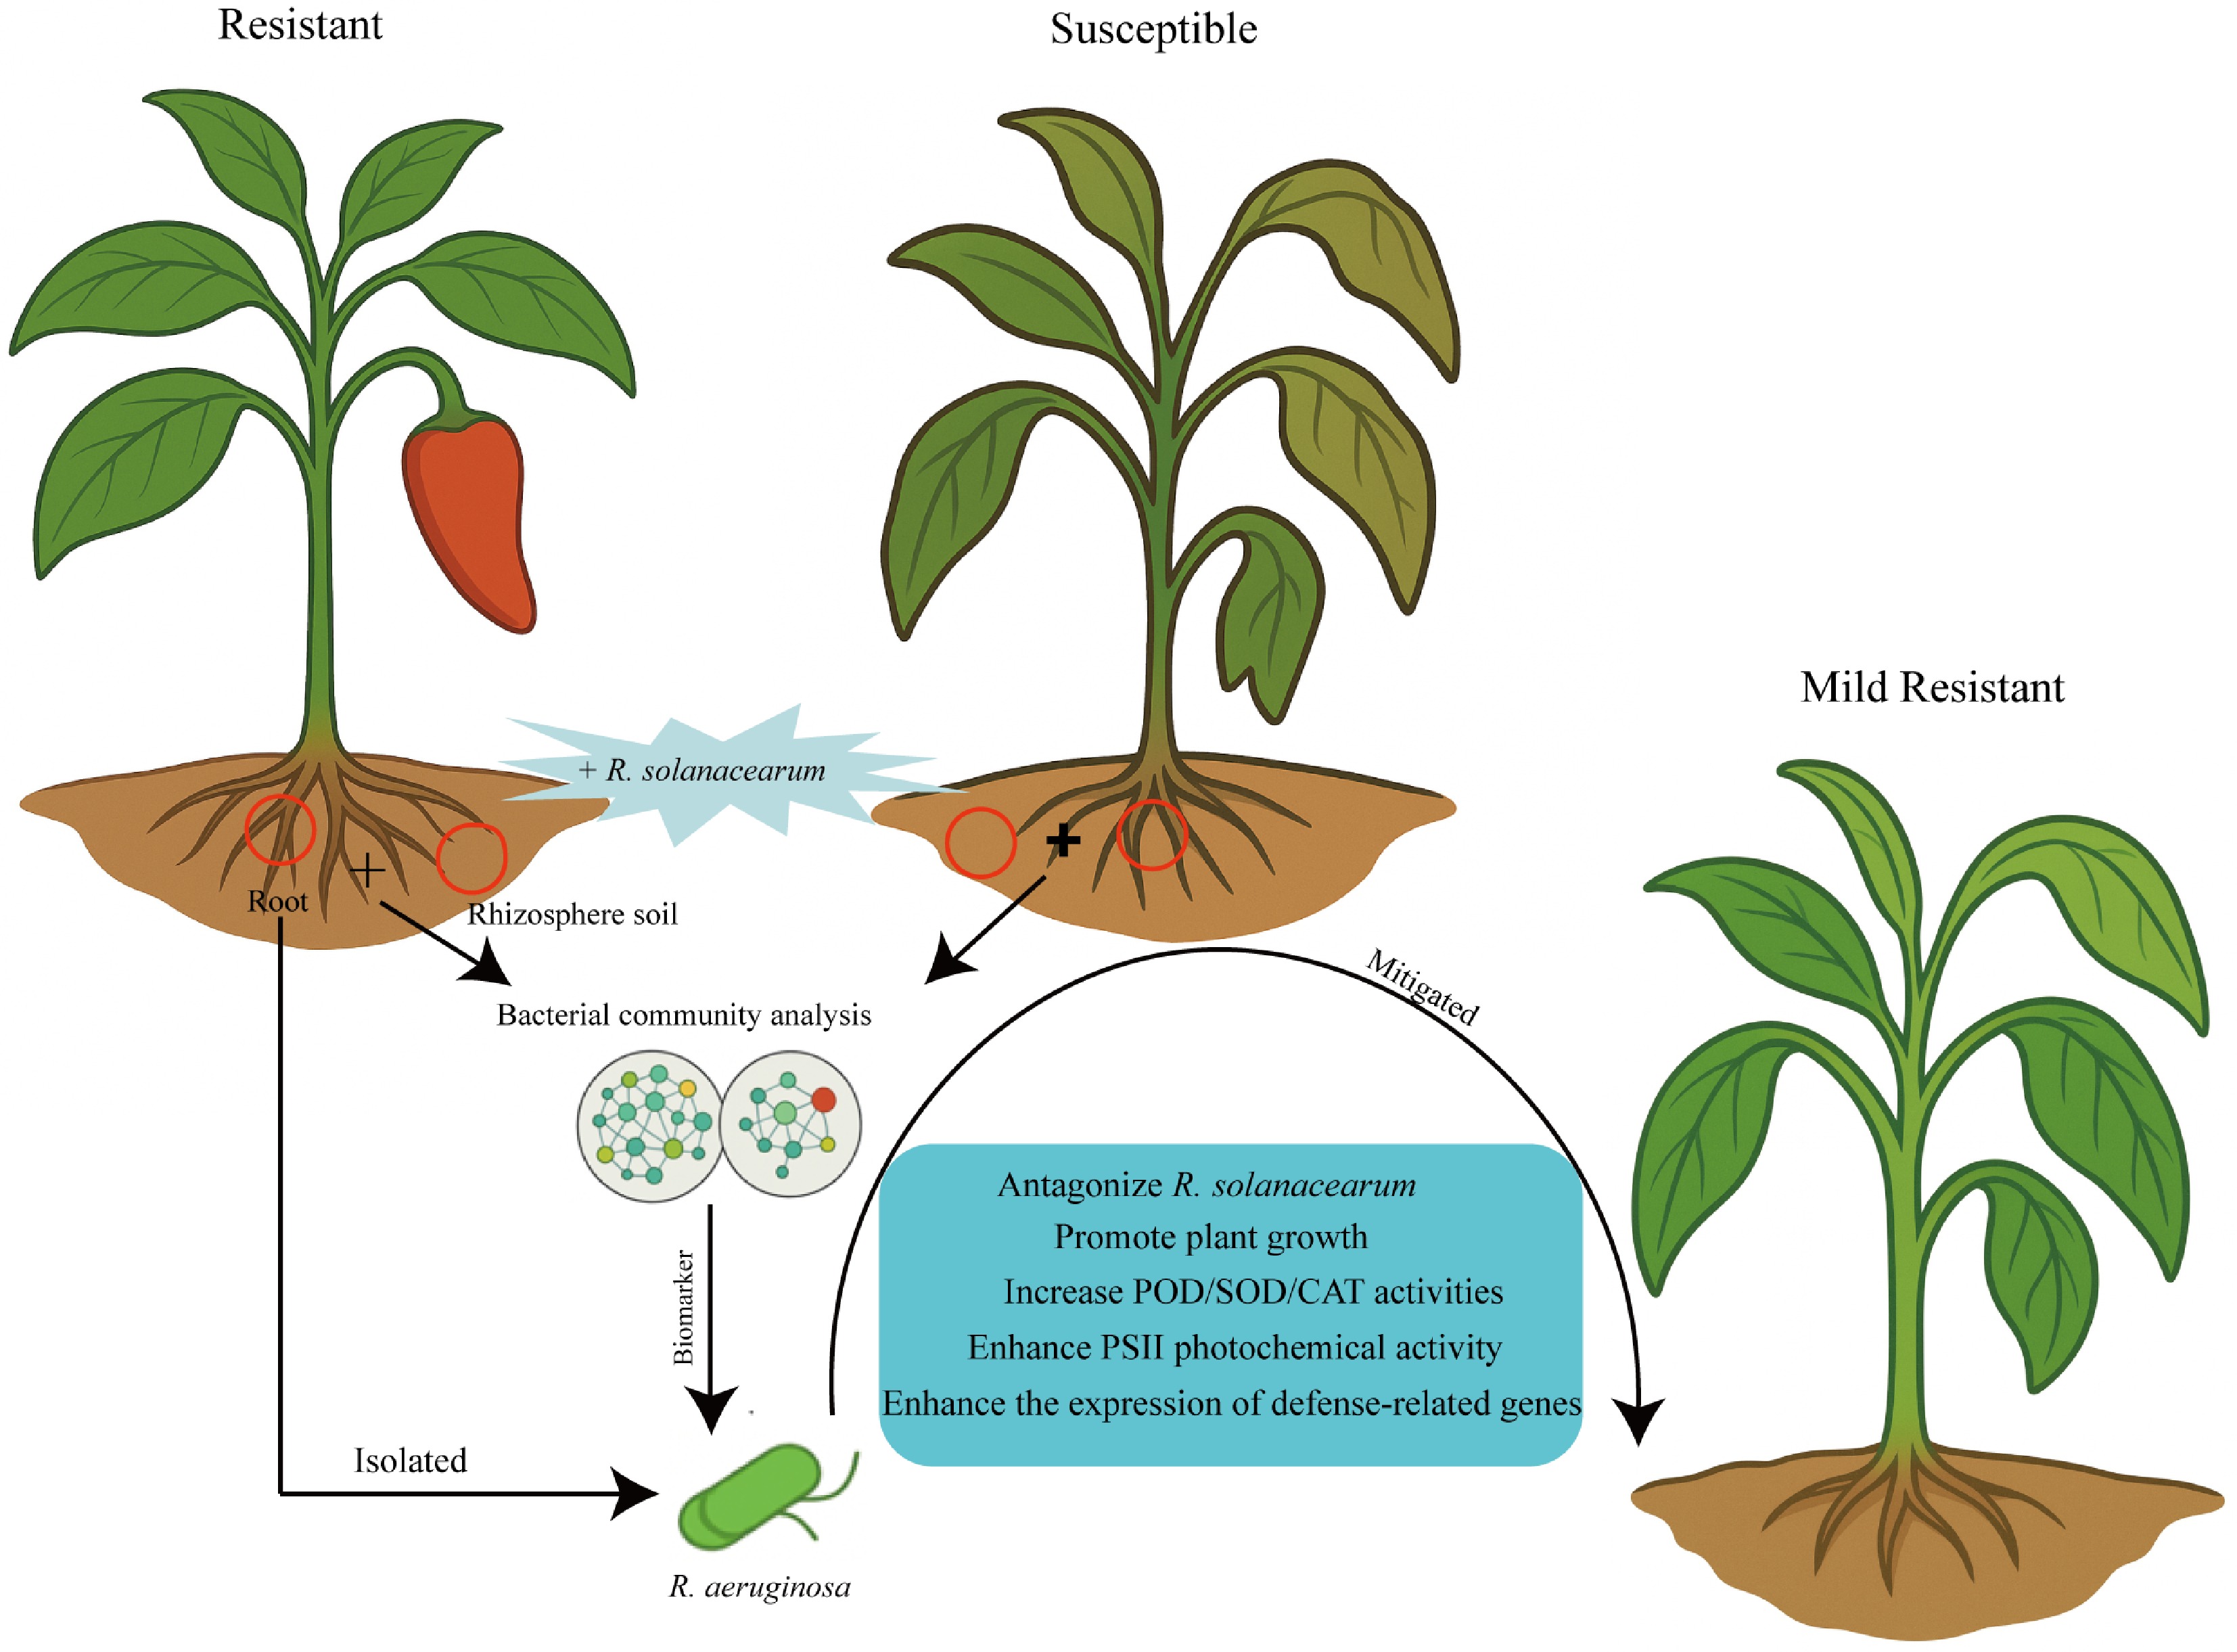
Figure 9.
Schematic diagram of the enhancement of pepper resistance to bacterial wilt by P. aeruginosa. The model illustrates cultivar-dependent differences in root-associated bacterial communities during R. solanacearum infection, as well as the biocontrol mechanisms by which P. aeruginosa application enhances resistance in susceptible pepper plants.
Figures
(9)
Tables
(0)