-
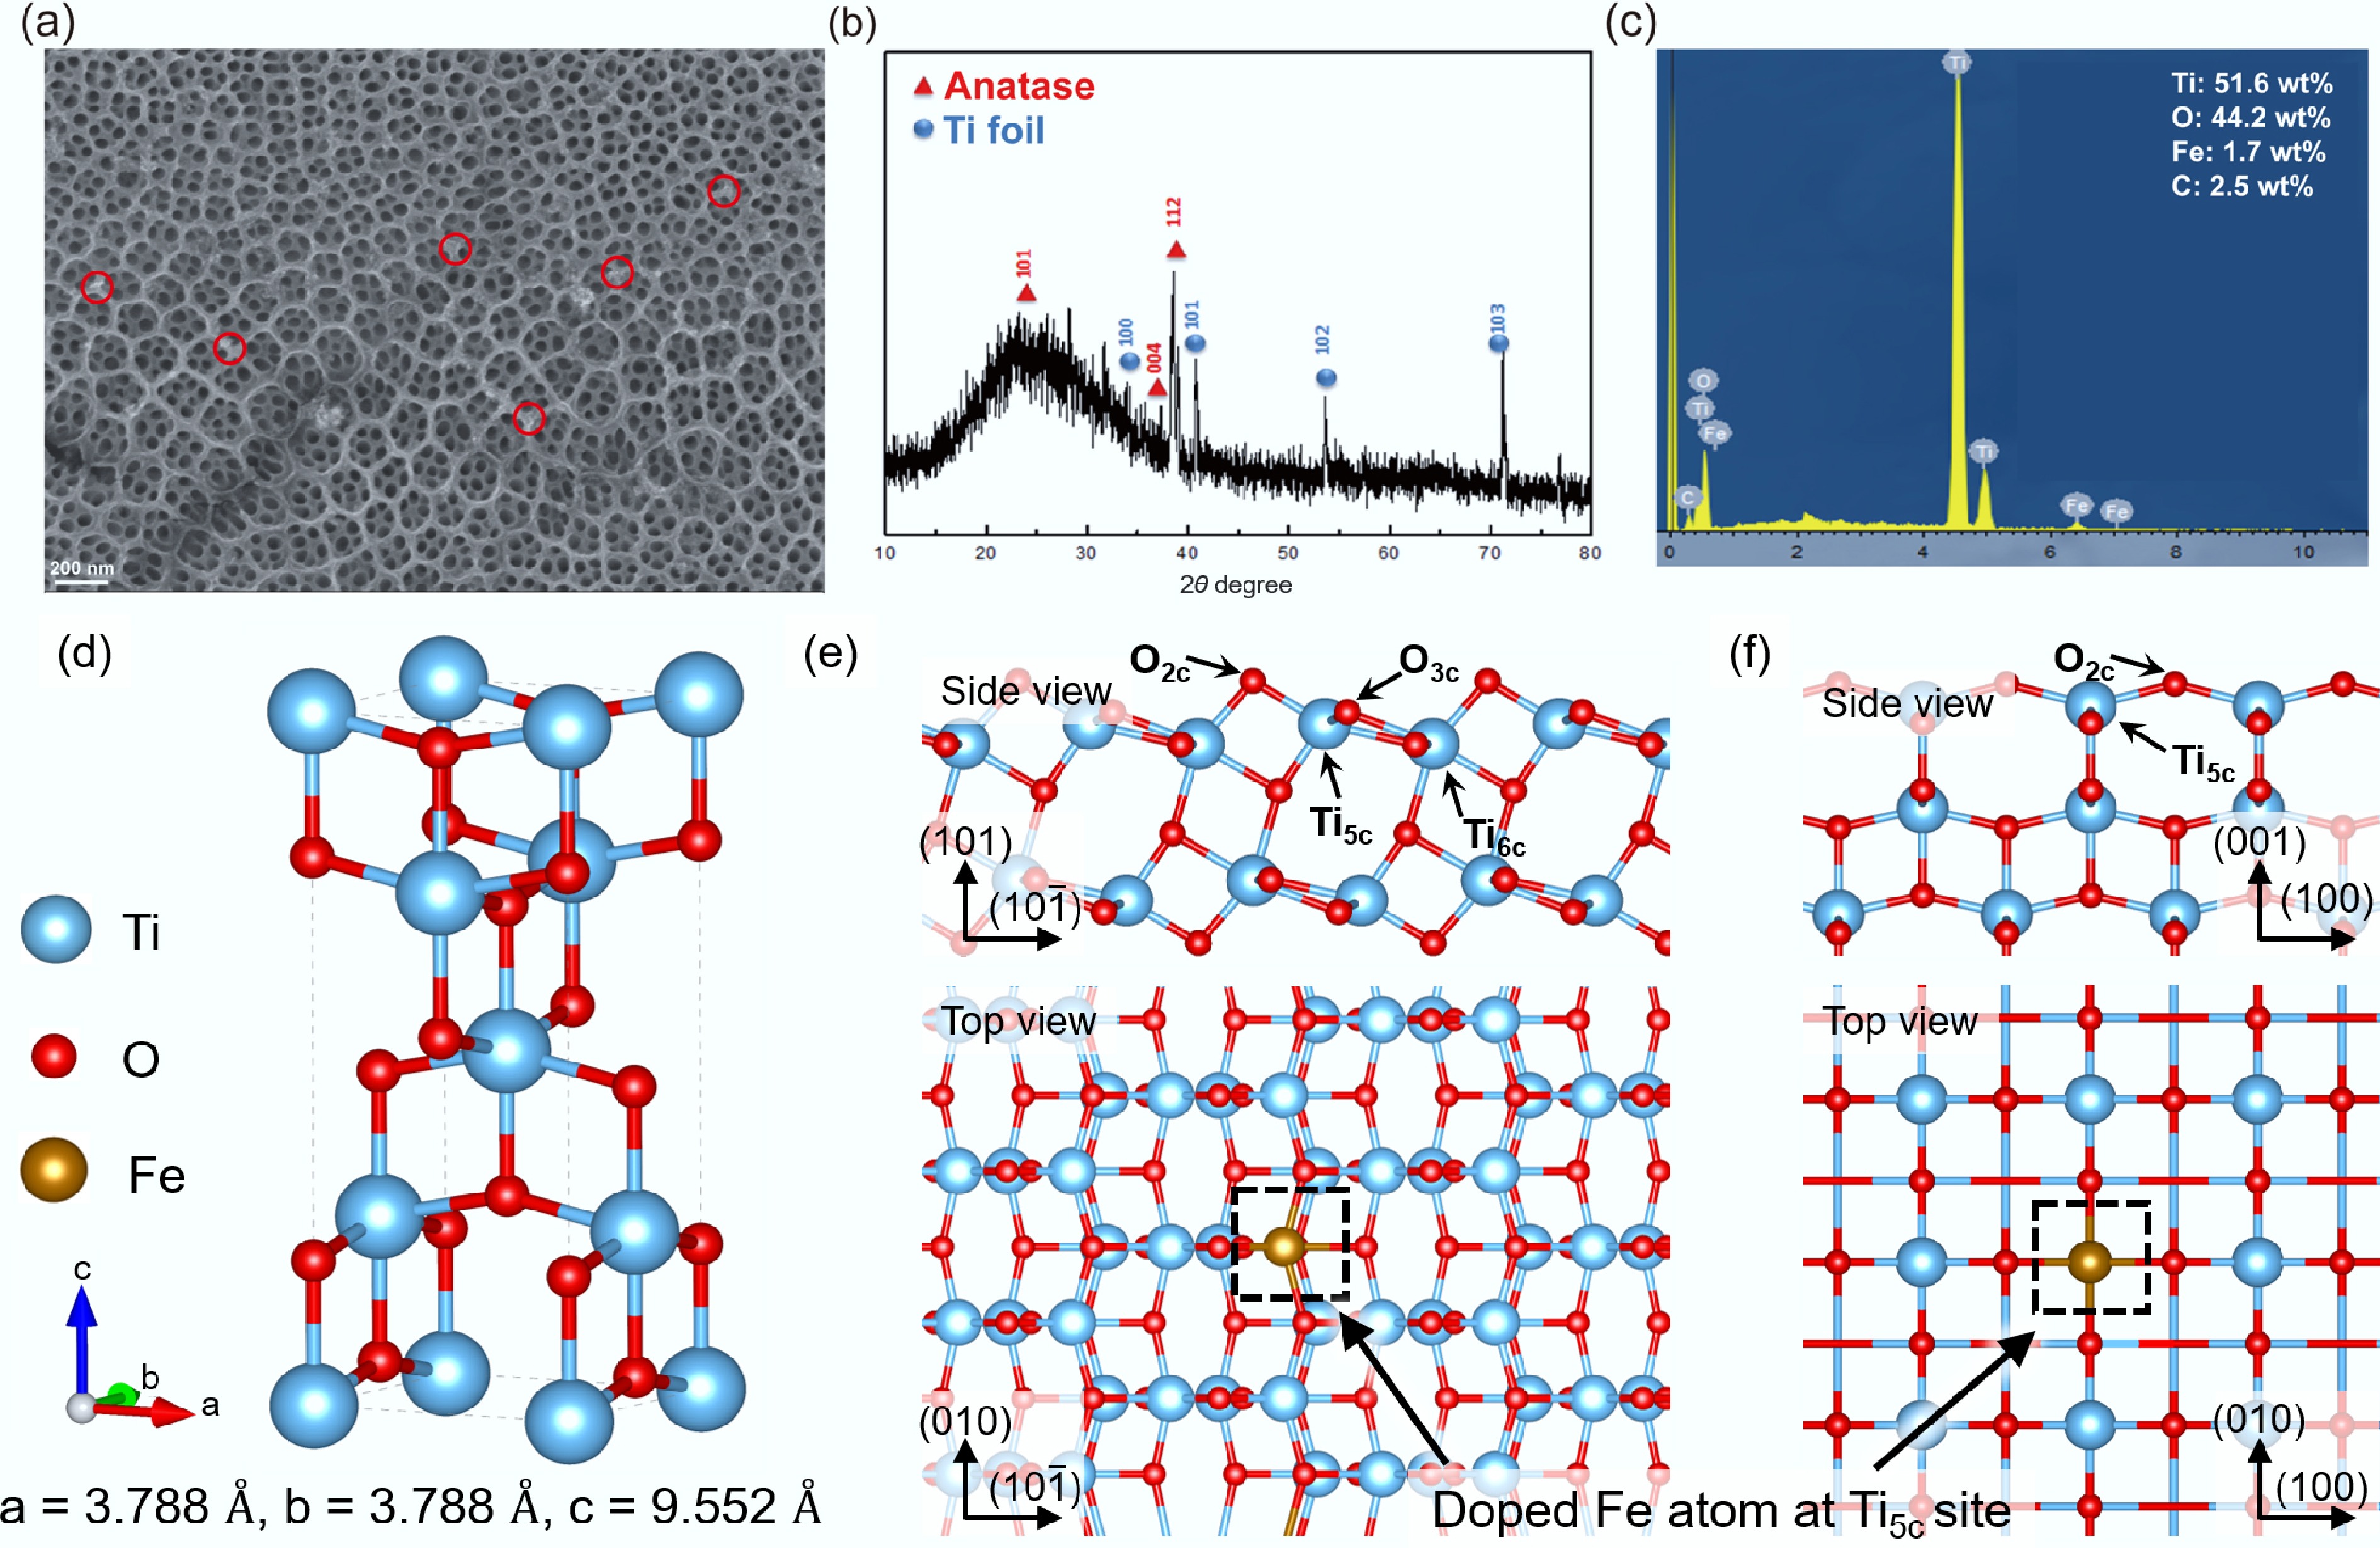
Figure 1.
(a) SEM images of the surface morphology of Fe(III)/TiO2 NTs; (b) XRD pattern of Fe(III)/TiO2 NTs; (c) EDS spectra of Fe(III)/TiO2 NTs; (d) crystal model of bulk anatase TiO2; (e) representative Fe-substituted anatase TiO2 (101) surface (FexTi1-xO2, x = 0.0625); (f) representative Fe-substituted anatase TiO2 (001) surface (FexTi1-xO2, x = 0.0625).
-
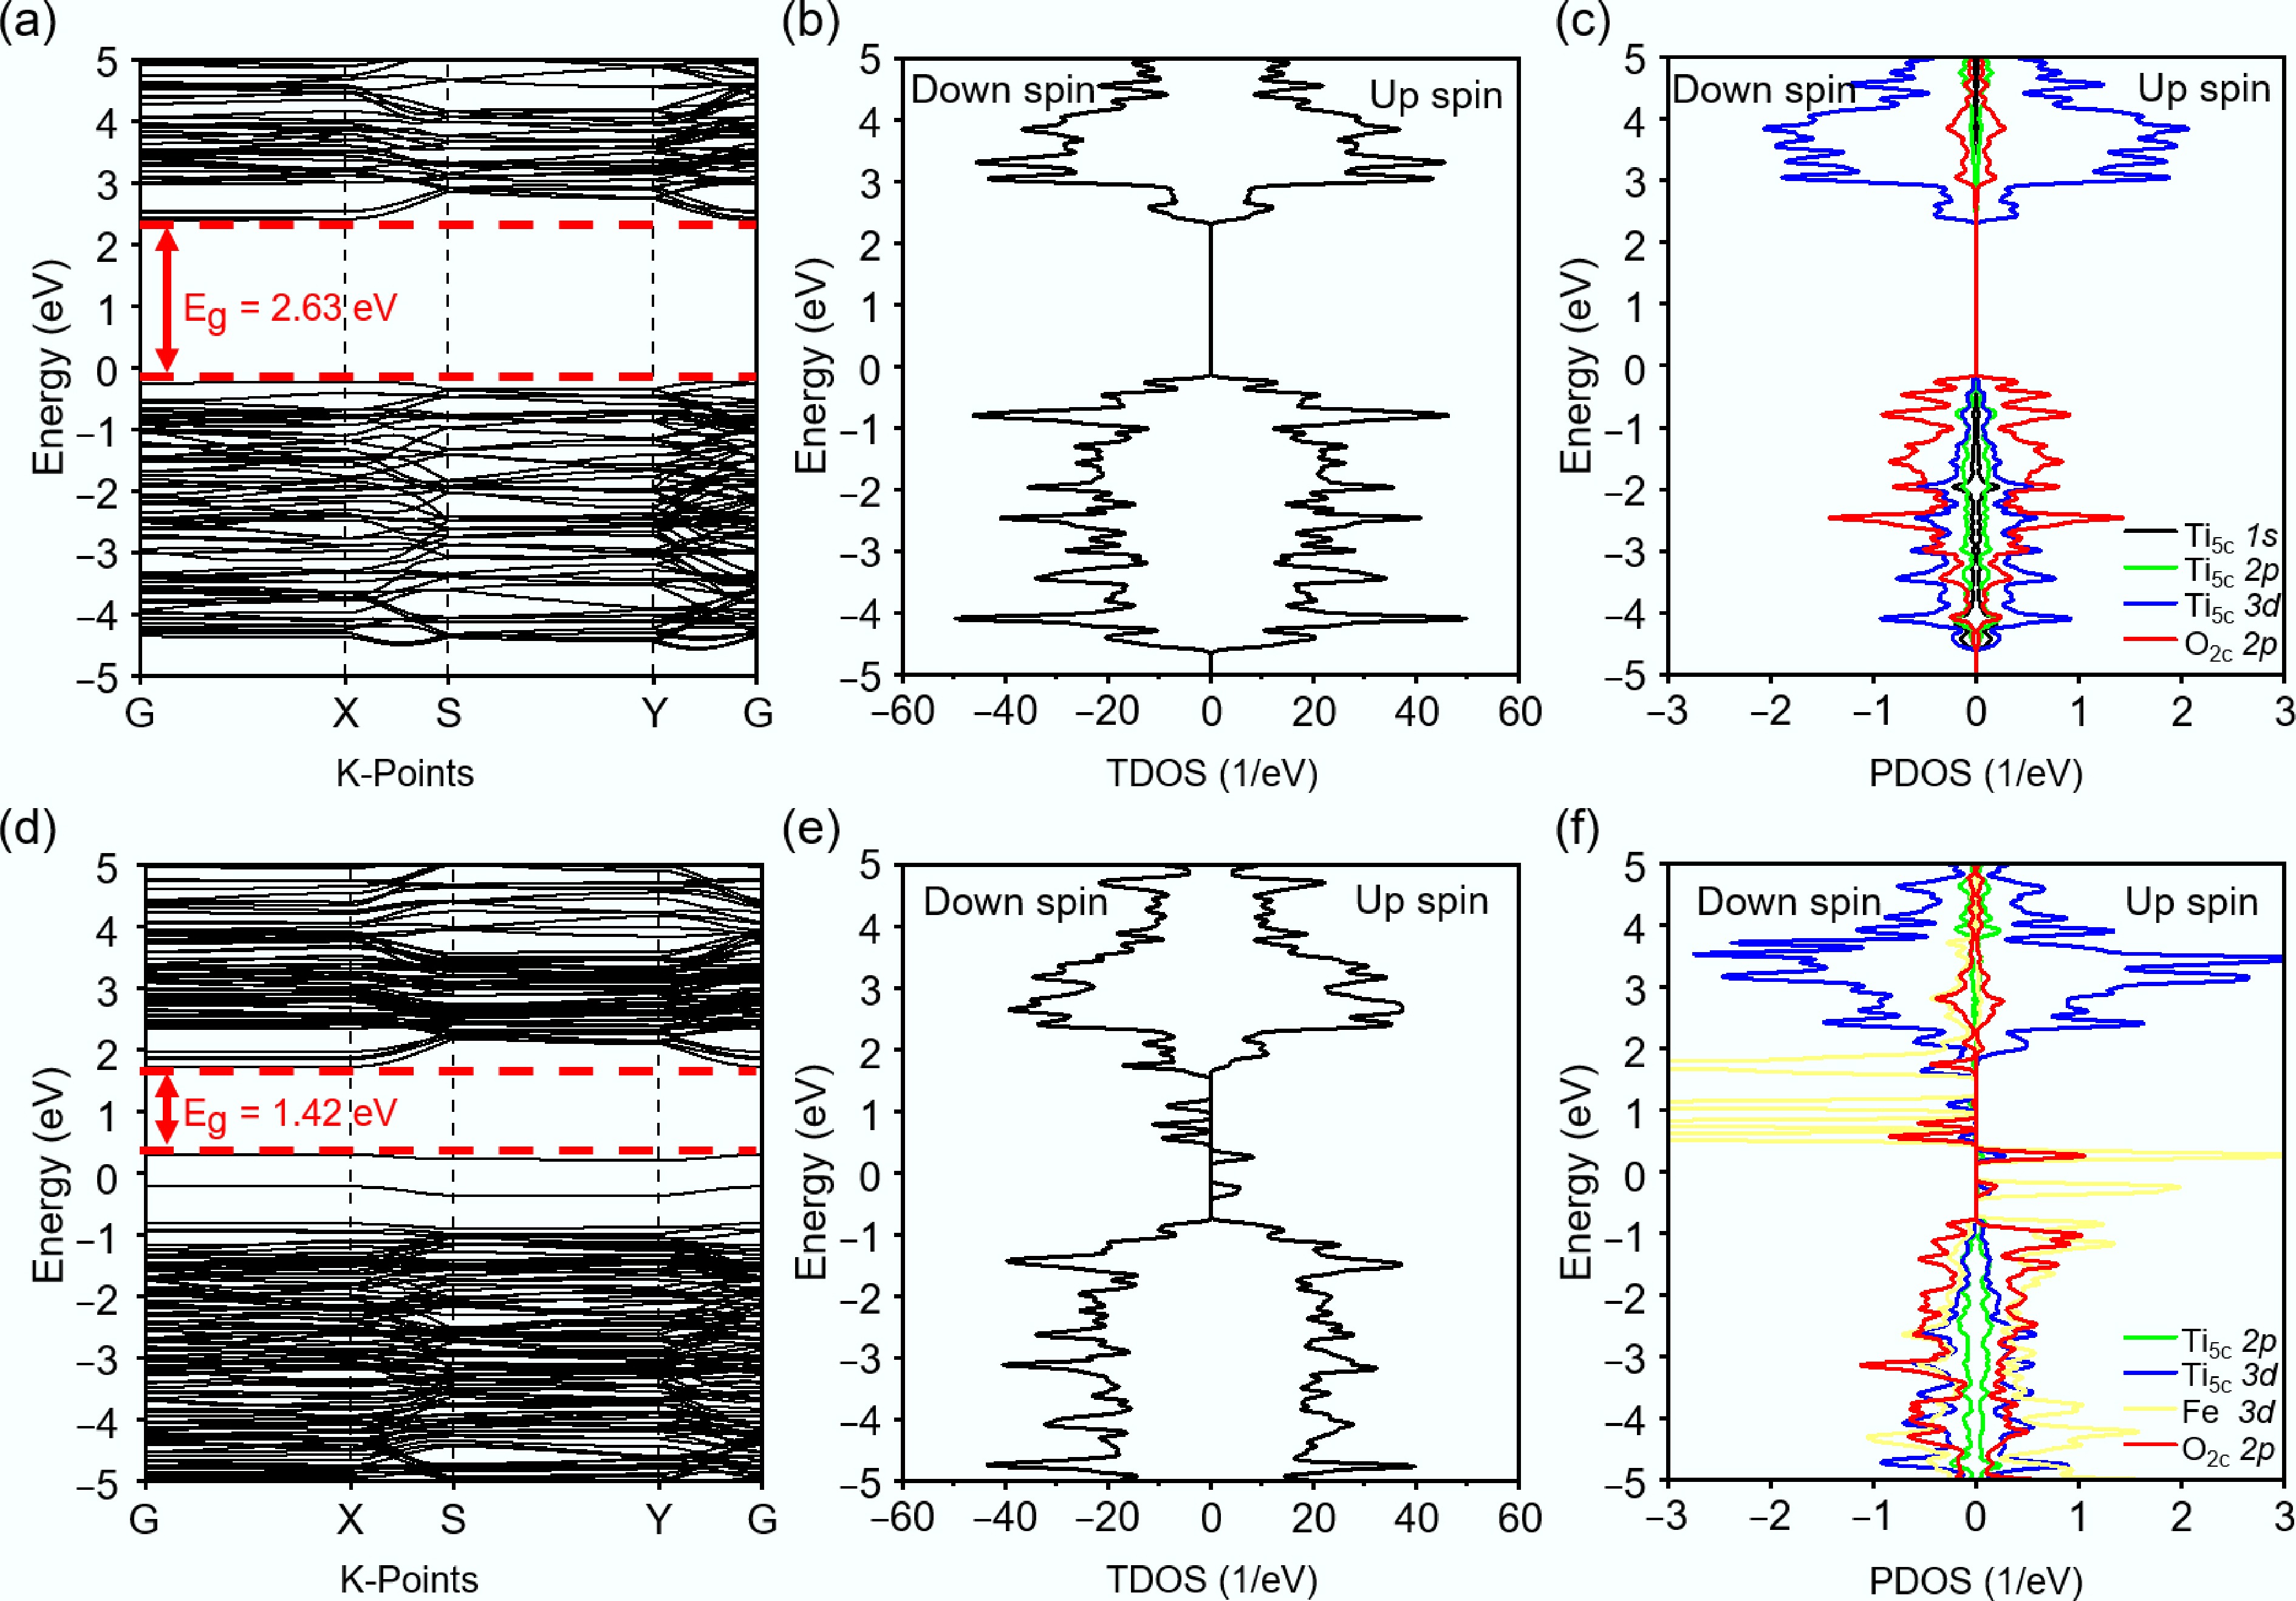
Figure 2.
Electronic structure of pristine anatase TiO2 (101) slab: (a) band structures (the bandgap is 2.63 eV), (b) total density of states (TDOS), and (c) projected density of states (PDOS) of the atomic types that construct the structure. Electronic structure of representative Fe-substituted anatase TiO2 (101) slab: (d) Band structures (the bandgap is 1.42 eV), (e) TDOS, and (f) PDOS. Fermi level was shifted to zero. All electronic-gap values shown in the figure are calculated using GGA-PBE and are provided only for relative comparison between the two models; they are not experimentally measured optical bandgaps.
-
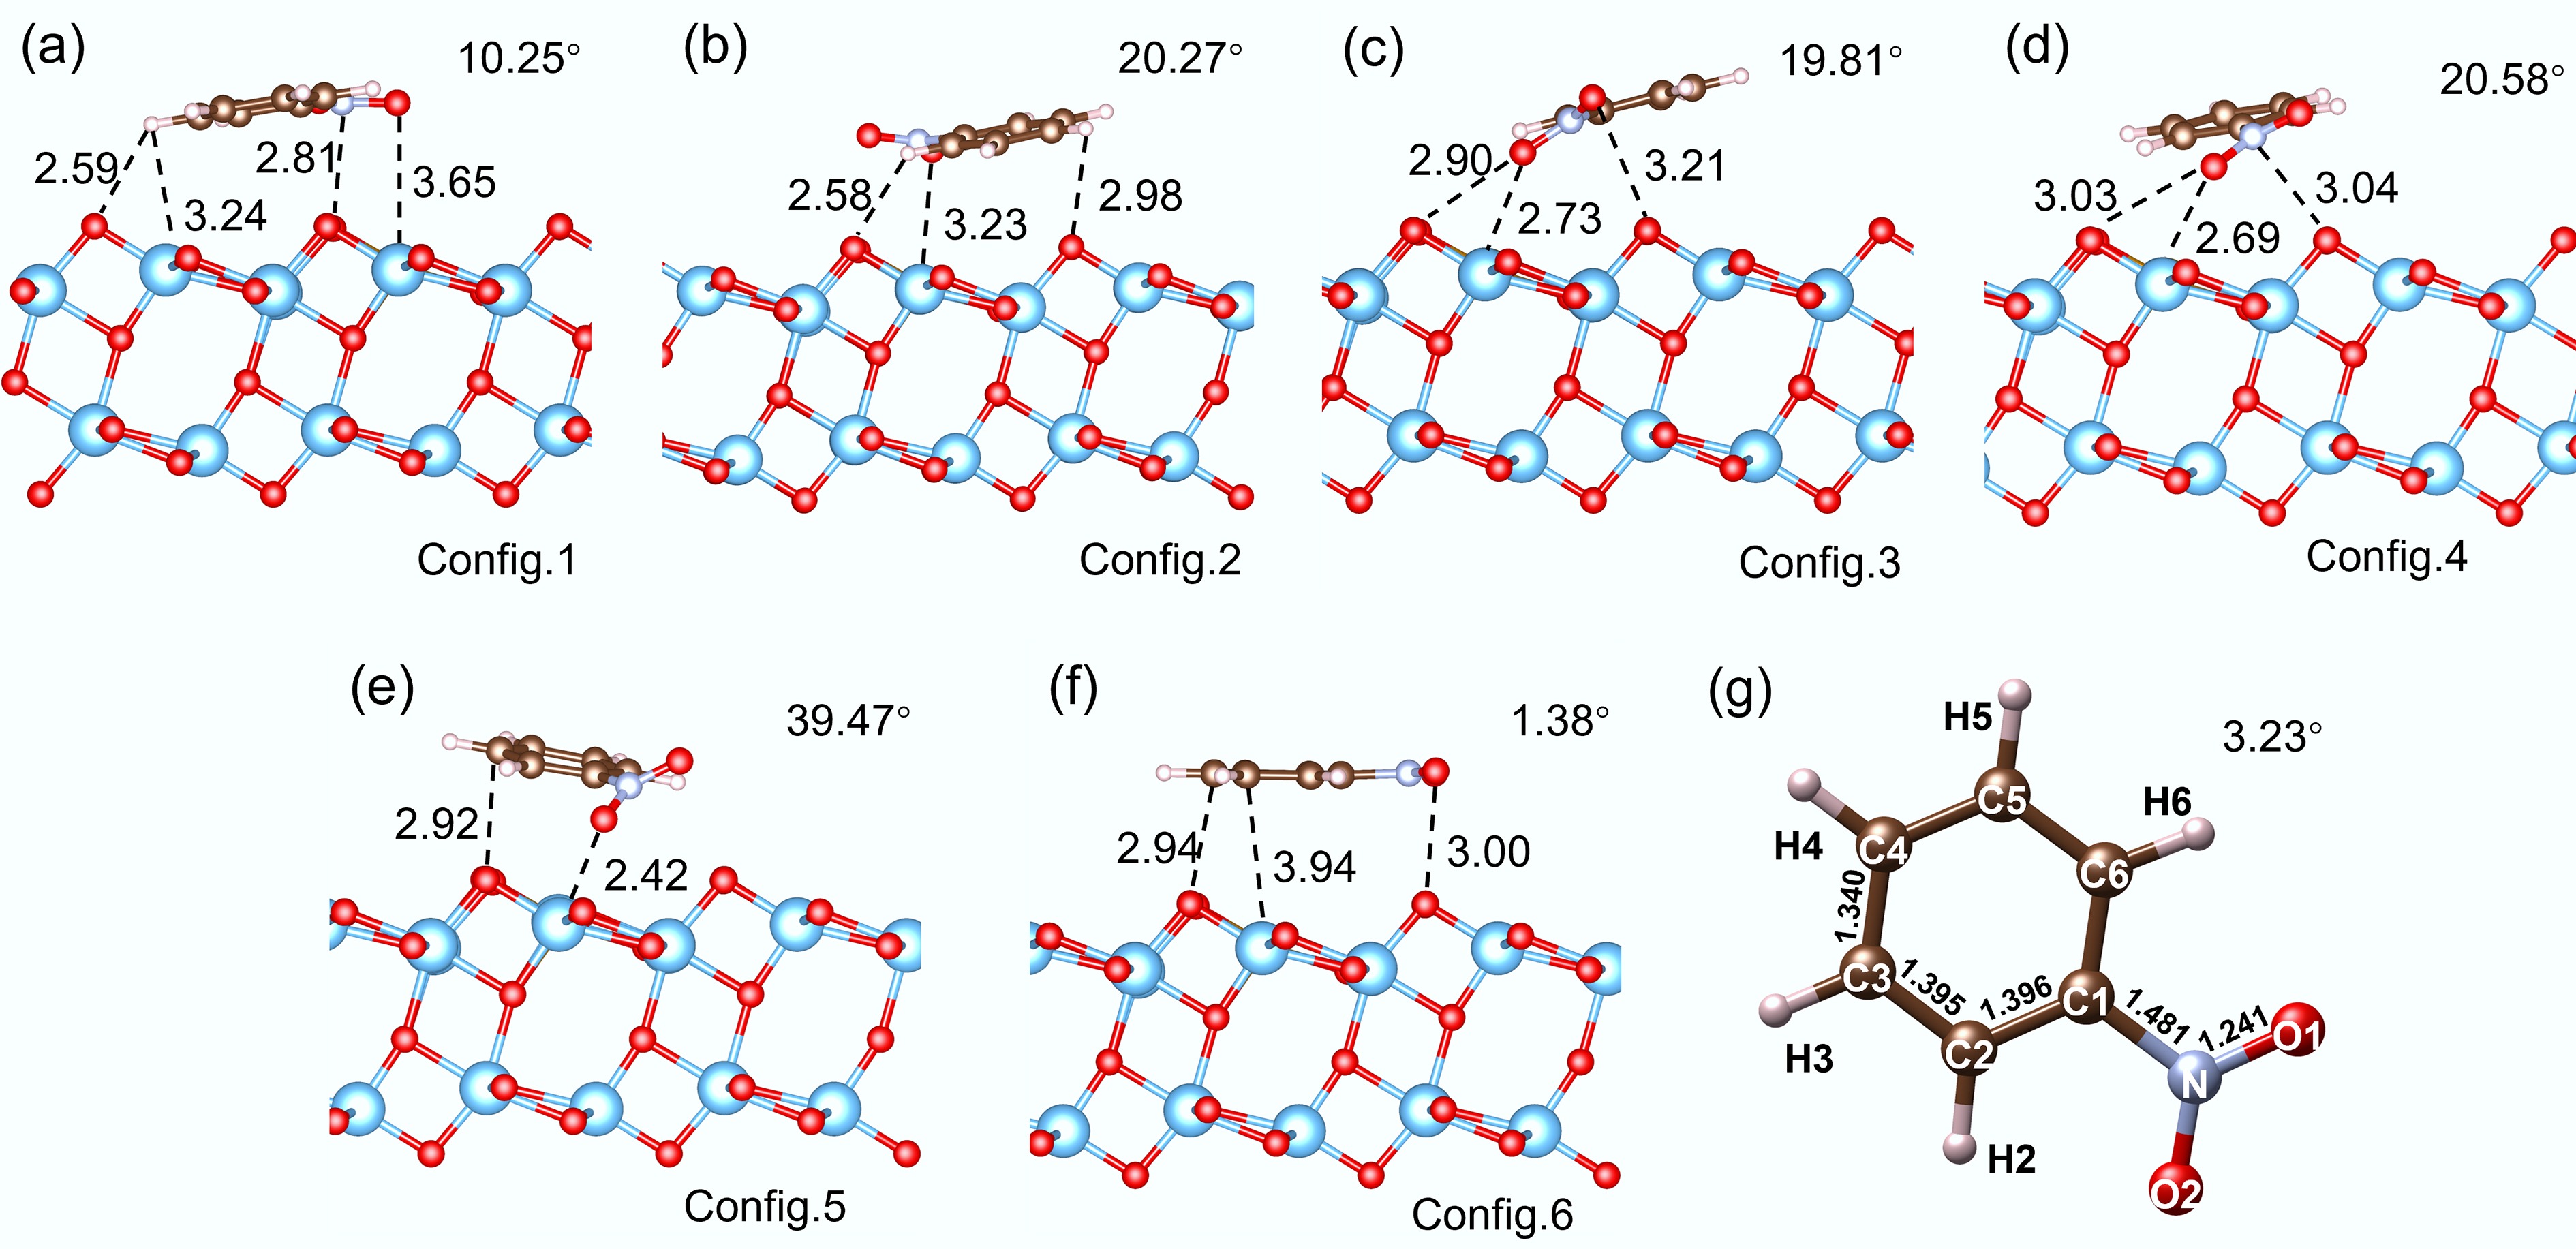
Figure 3.
The side view of optimized adsorption configurations and important distances (in Å) of NB on a representative Fe-substituted anatase TiO2 (101) surface. The torsion of the nitro group is represented by the angle between plane C2–C1–C6 and plane O1–N–O2. Fe atoms are obscured in the structure. The Fe atom is included in all optimized adsorption models but is partially obscured from the selected side-view direction by neighboring surface atoms. The Fe-substituted site is shown clearly in Fig. 1e, with Fe represented by the golden sphere.
-
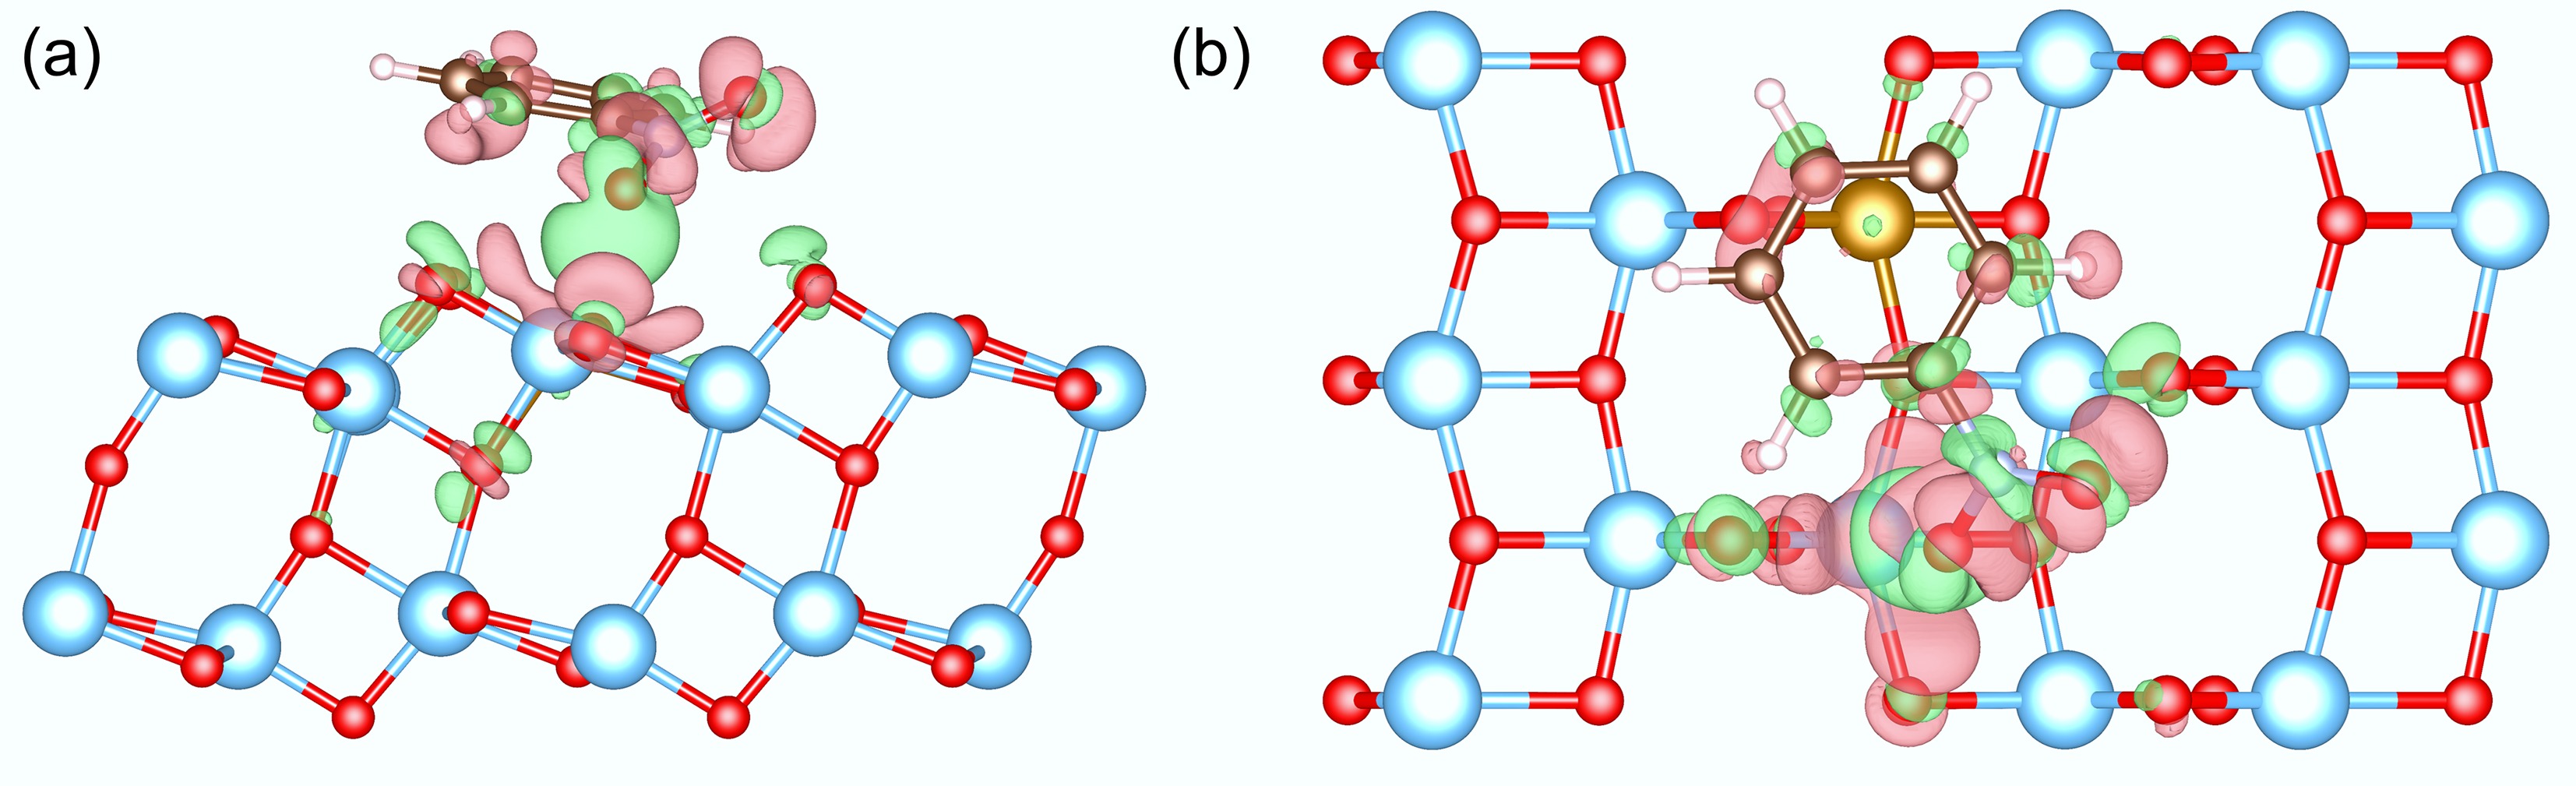
Figure 4.
The charge density difference profiles between the NB and Fe-substituted TiO2 surface in optimized adsorption configuration 5 (green: charge accumulation, red: charge depletion). Isosurfaces are plotted at a level of 0.001 Bohr−3. The Fe atom is represented by the golden sphere and is visible in the top-view panel.
-
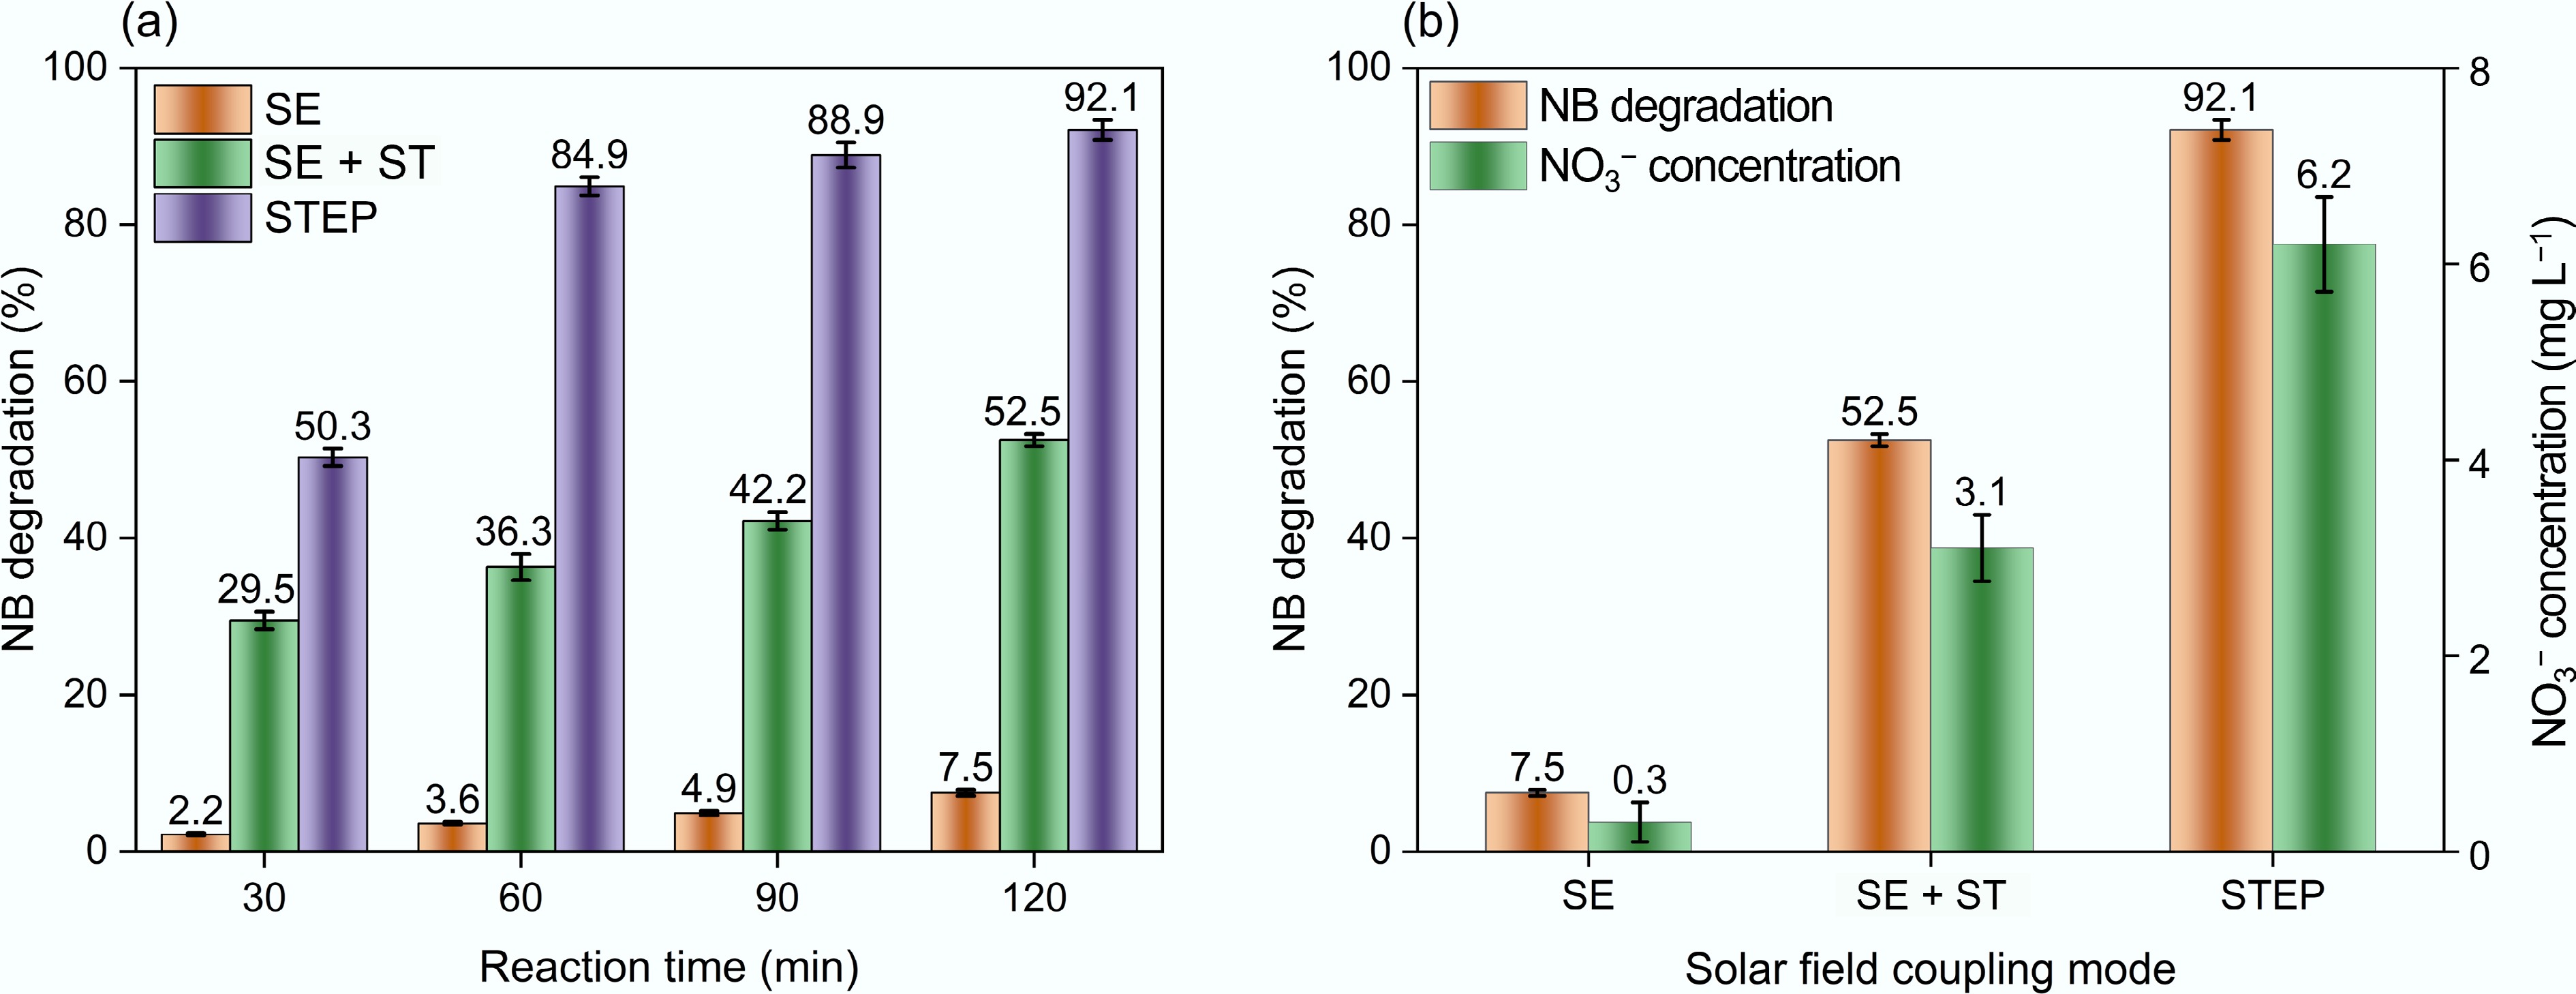
Figure 5.
Nitrobenzene (NB) removal and nitrate formation under different operation modes. (a) Time-dependent NB removal after 30, 60, 90, and 120 min; (b) NB removal efficiency and NO3− concentration after 120 min, from which mineralization efficiency was calculated. The key comparison is the enhanced NB removal and nitrate formation achieved under STEP conditions relative to SE and SE + ST.
-
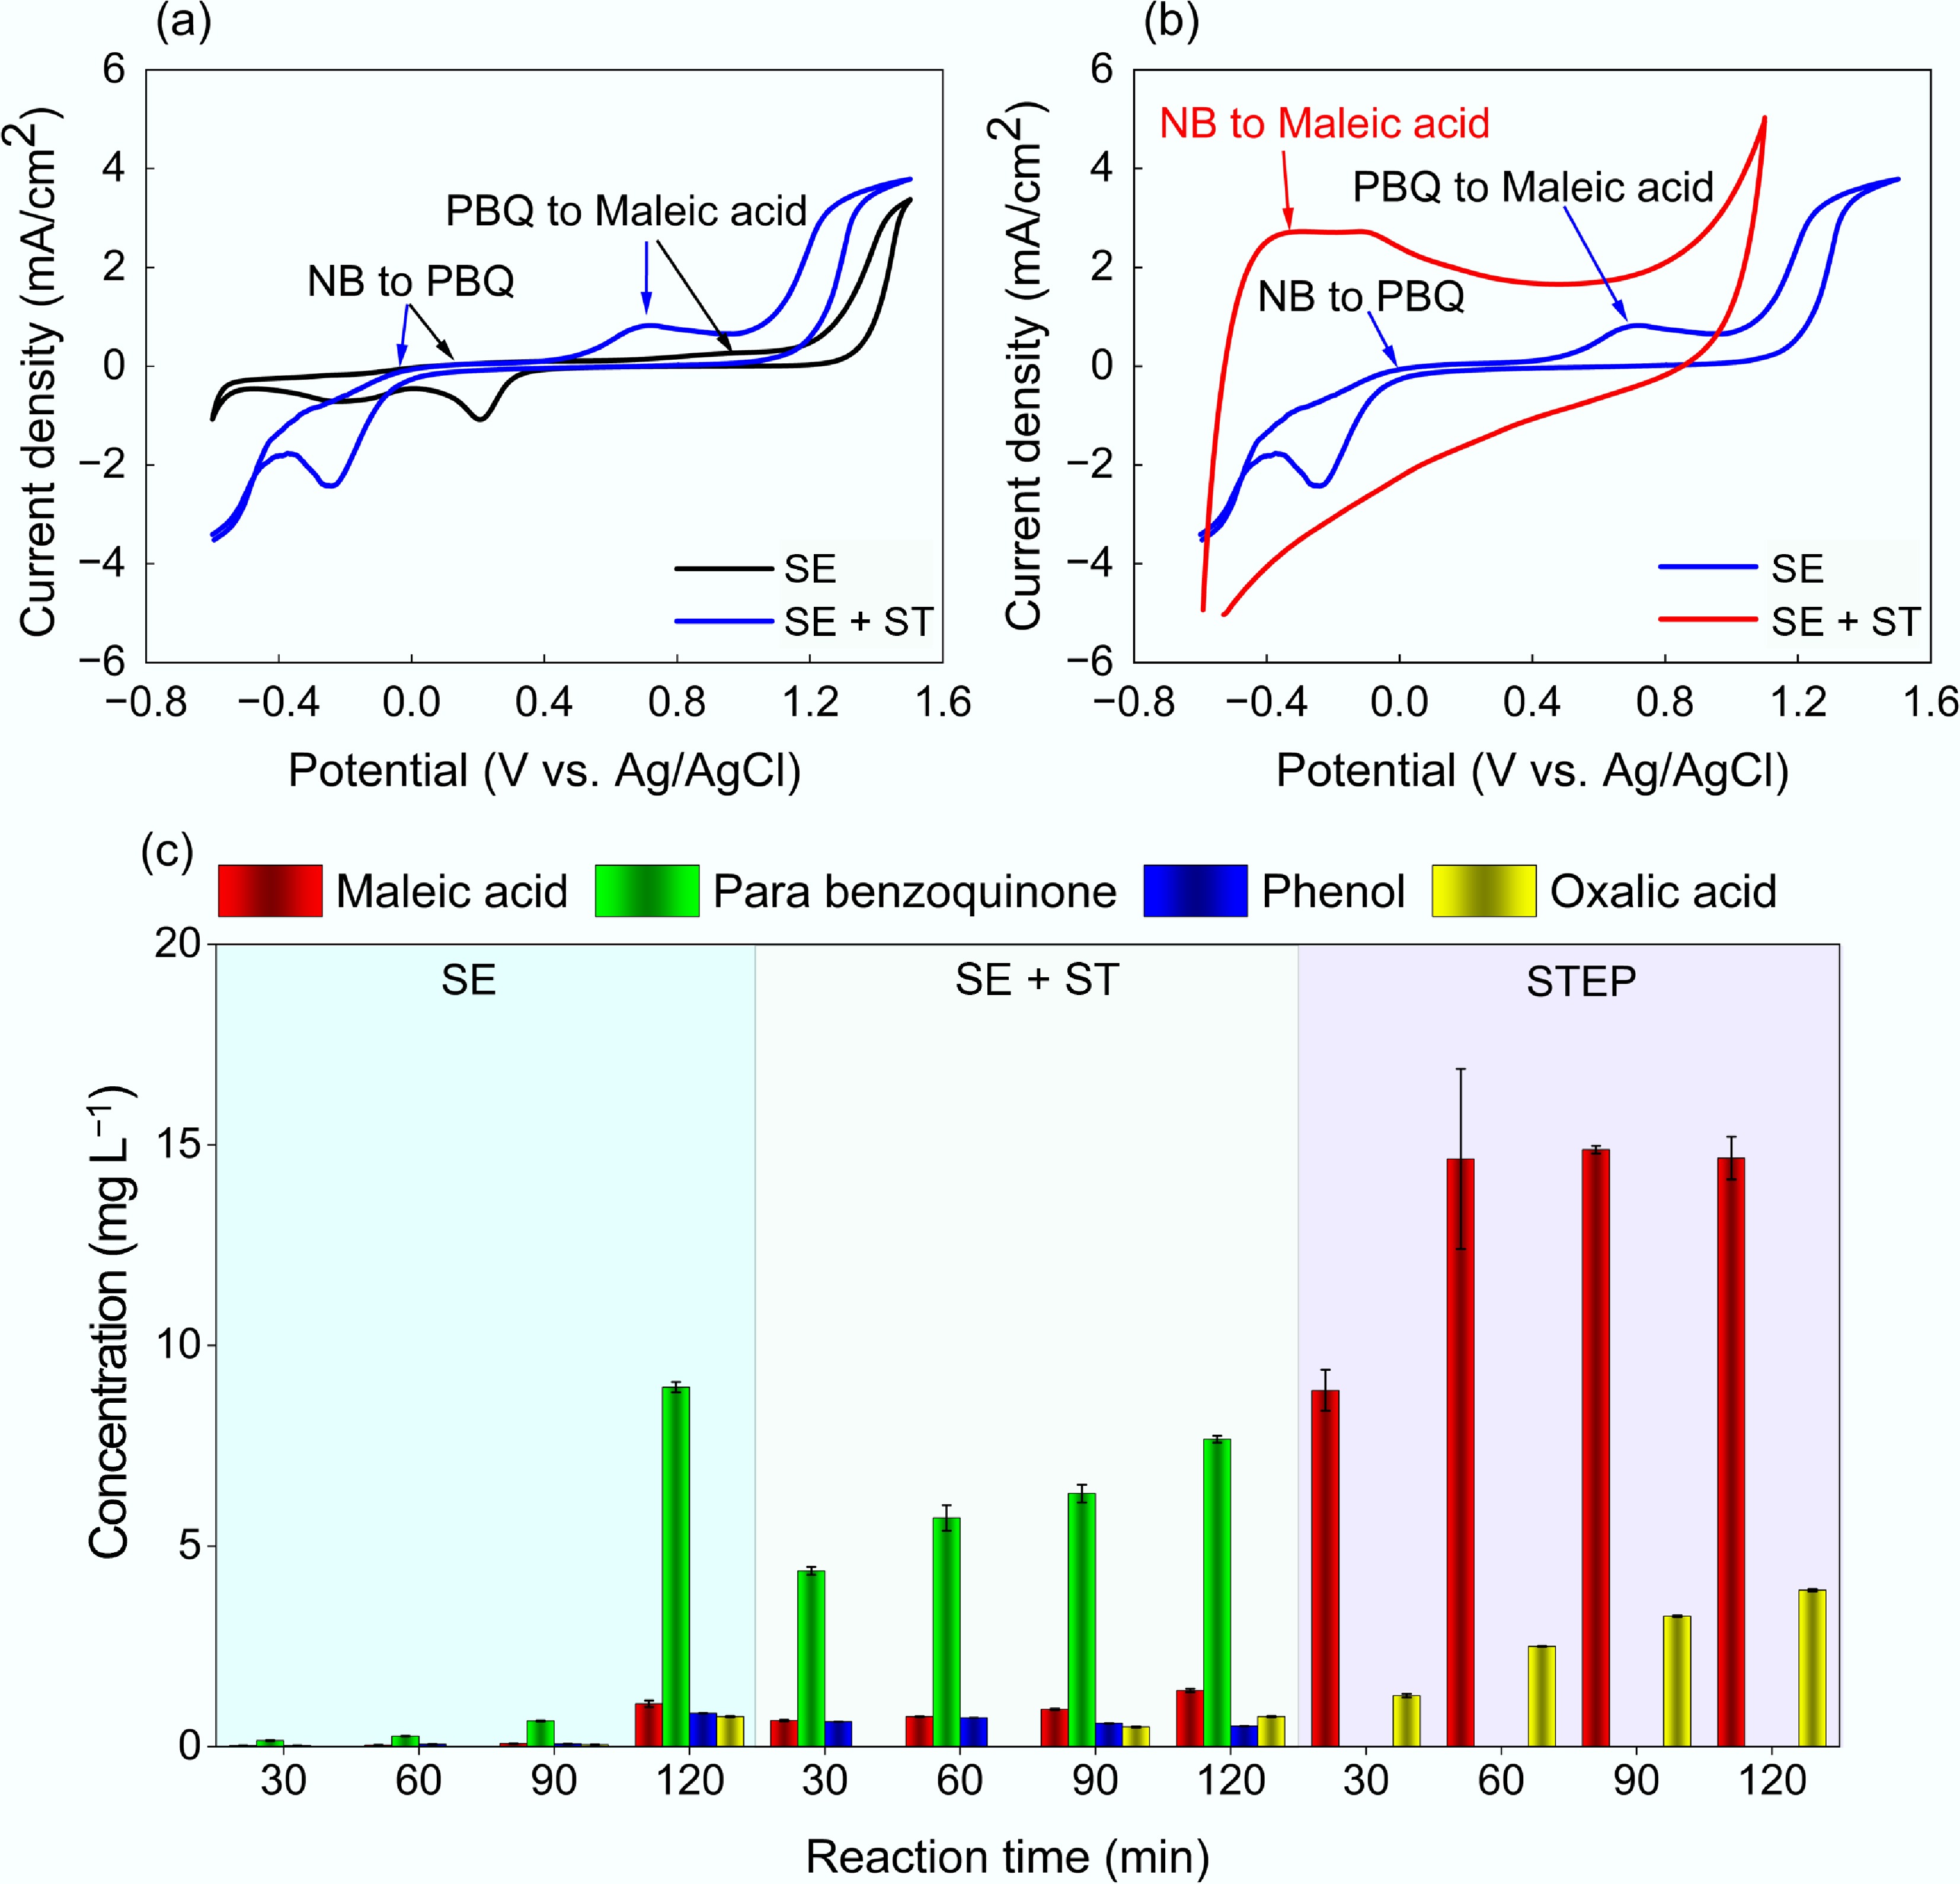
Figure 6.
Electrochemical responses and detected intermediates during nitrobenzene (NB) degradation under different operation modes. (a) Cyclic voltammetry (CV) curves comparing SE and SE + ST conditions; (b) CV curves comparing SE + ST and STEP conditions; (c) high-performance liquid chromatography (HPLC)-based detection of intermediate products after 30, 60, 90, and 120 min, including phenol, para-benzoquinone (PBQ), maleic acid, and oxalic acid.
-
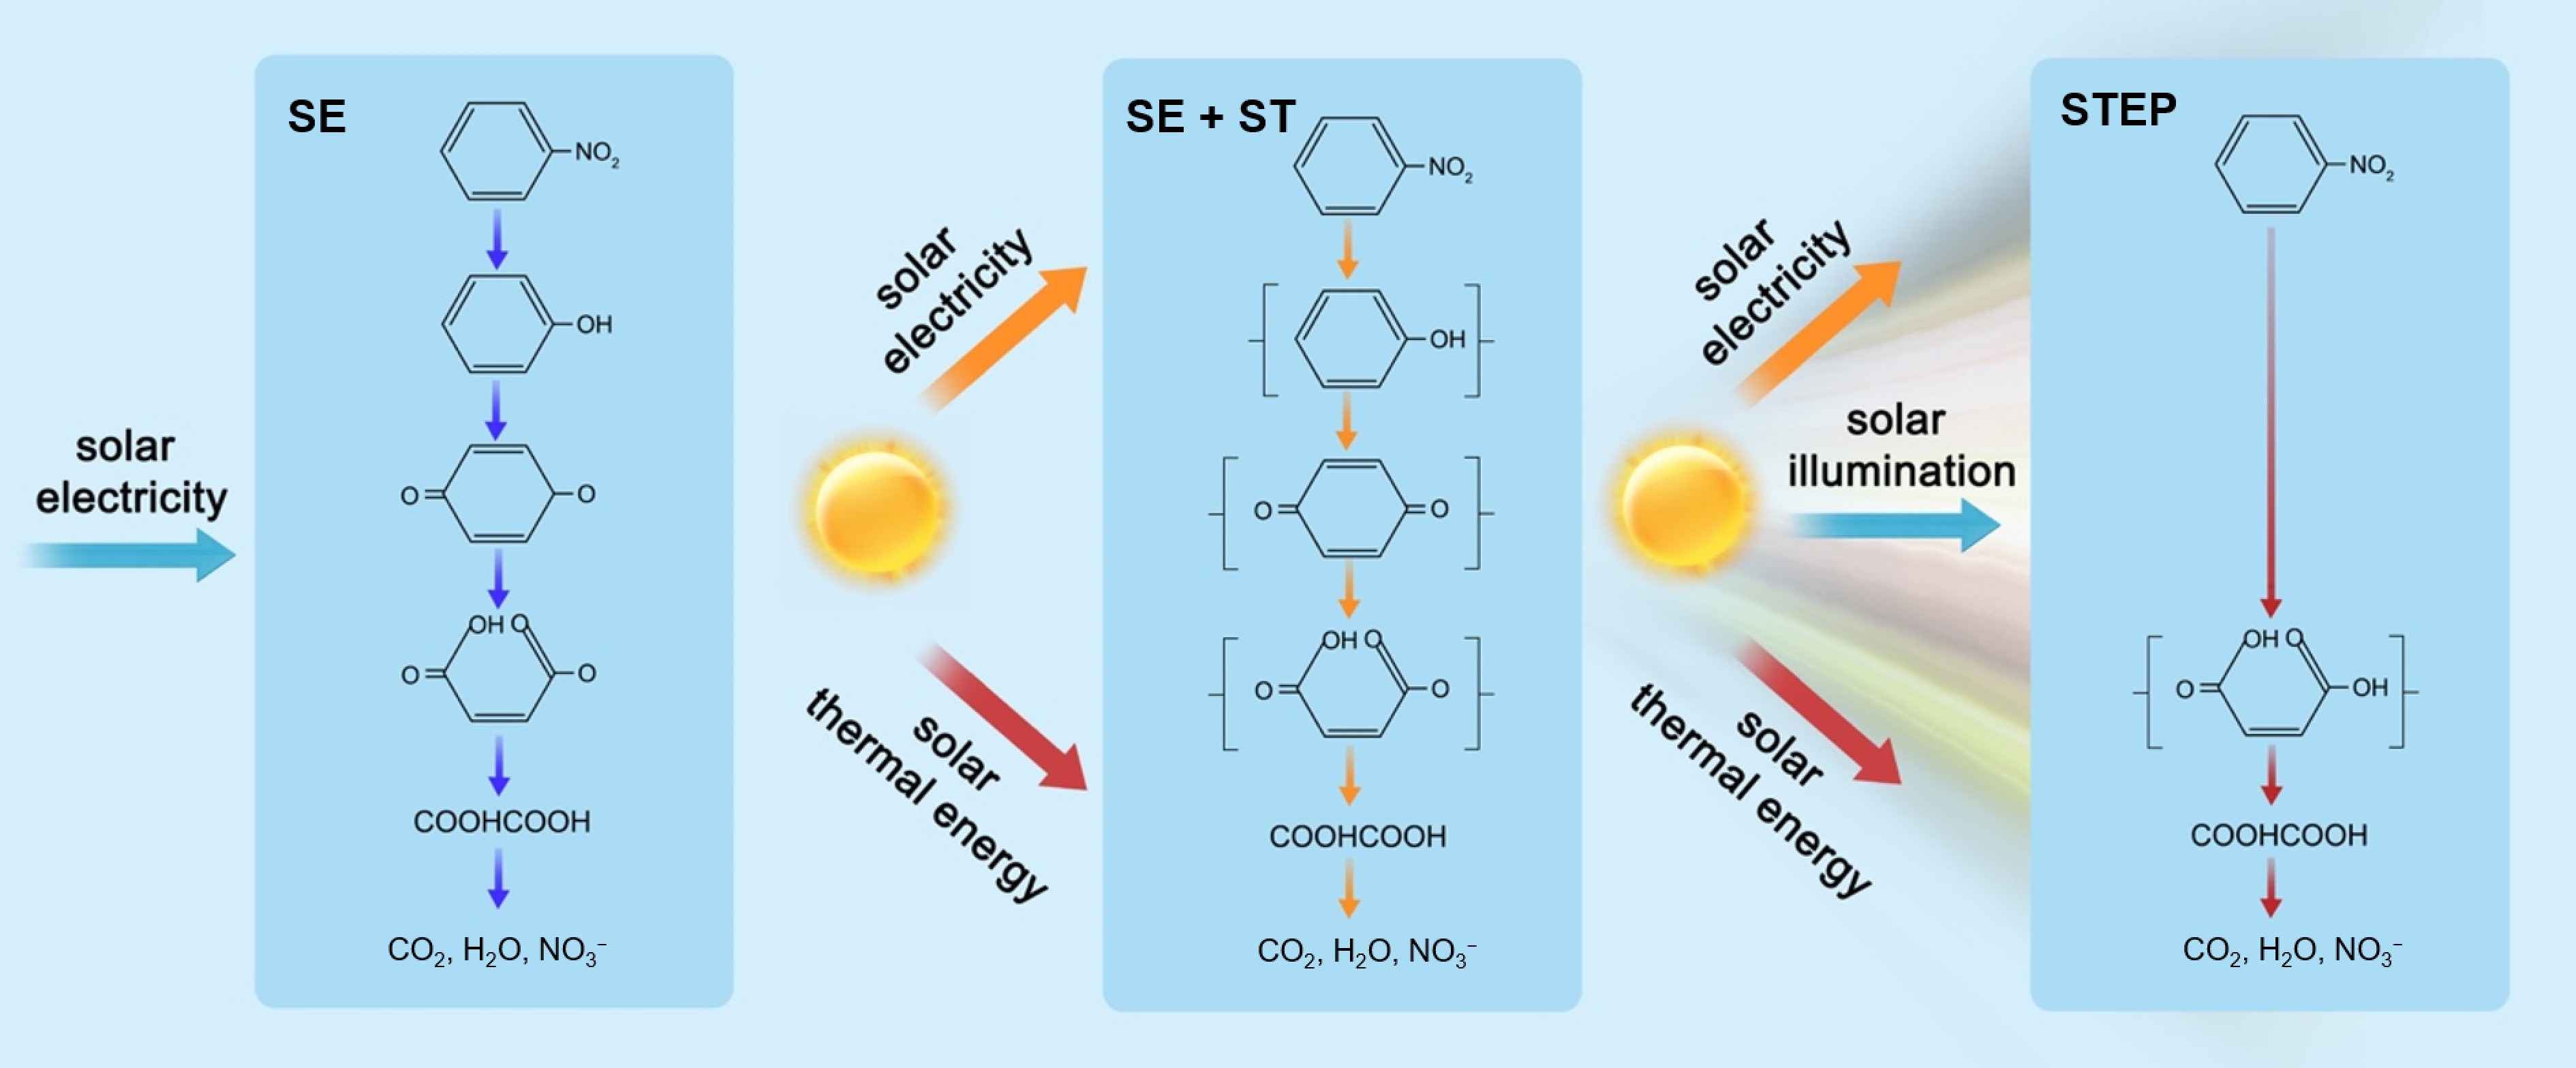
Figure 7.
Comparison of degradation and partial mineralization pathways of nitrobenzene (NB) under solar-electrochemical (SE), solar-thermal-electrochemical (SE + ST), and solar thermal electrochemical photocatalytic (STEP) conditions.
Figures
(7)
Tables
(0)