-
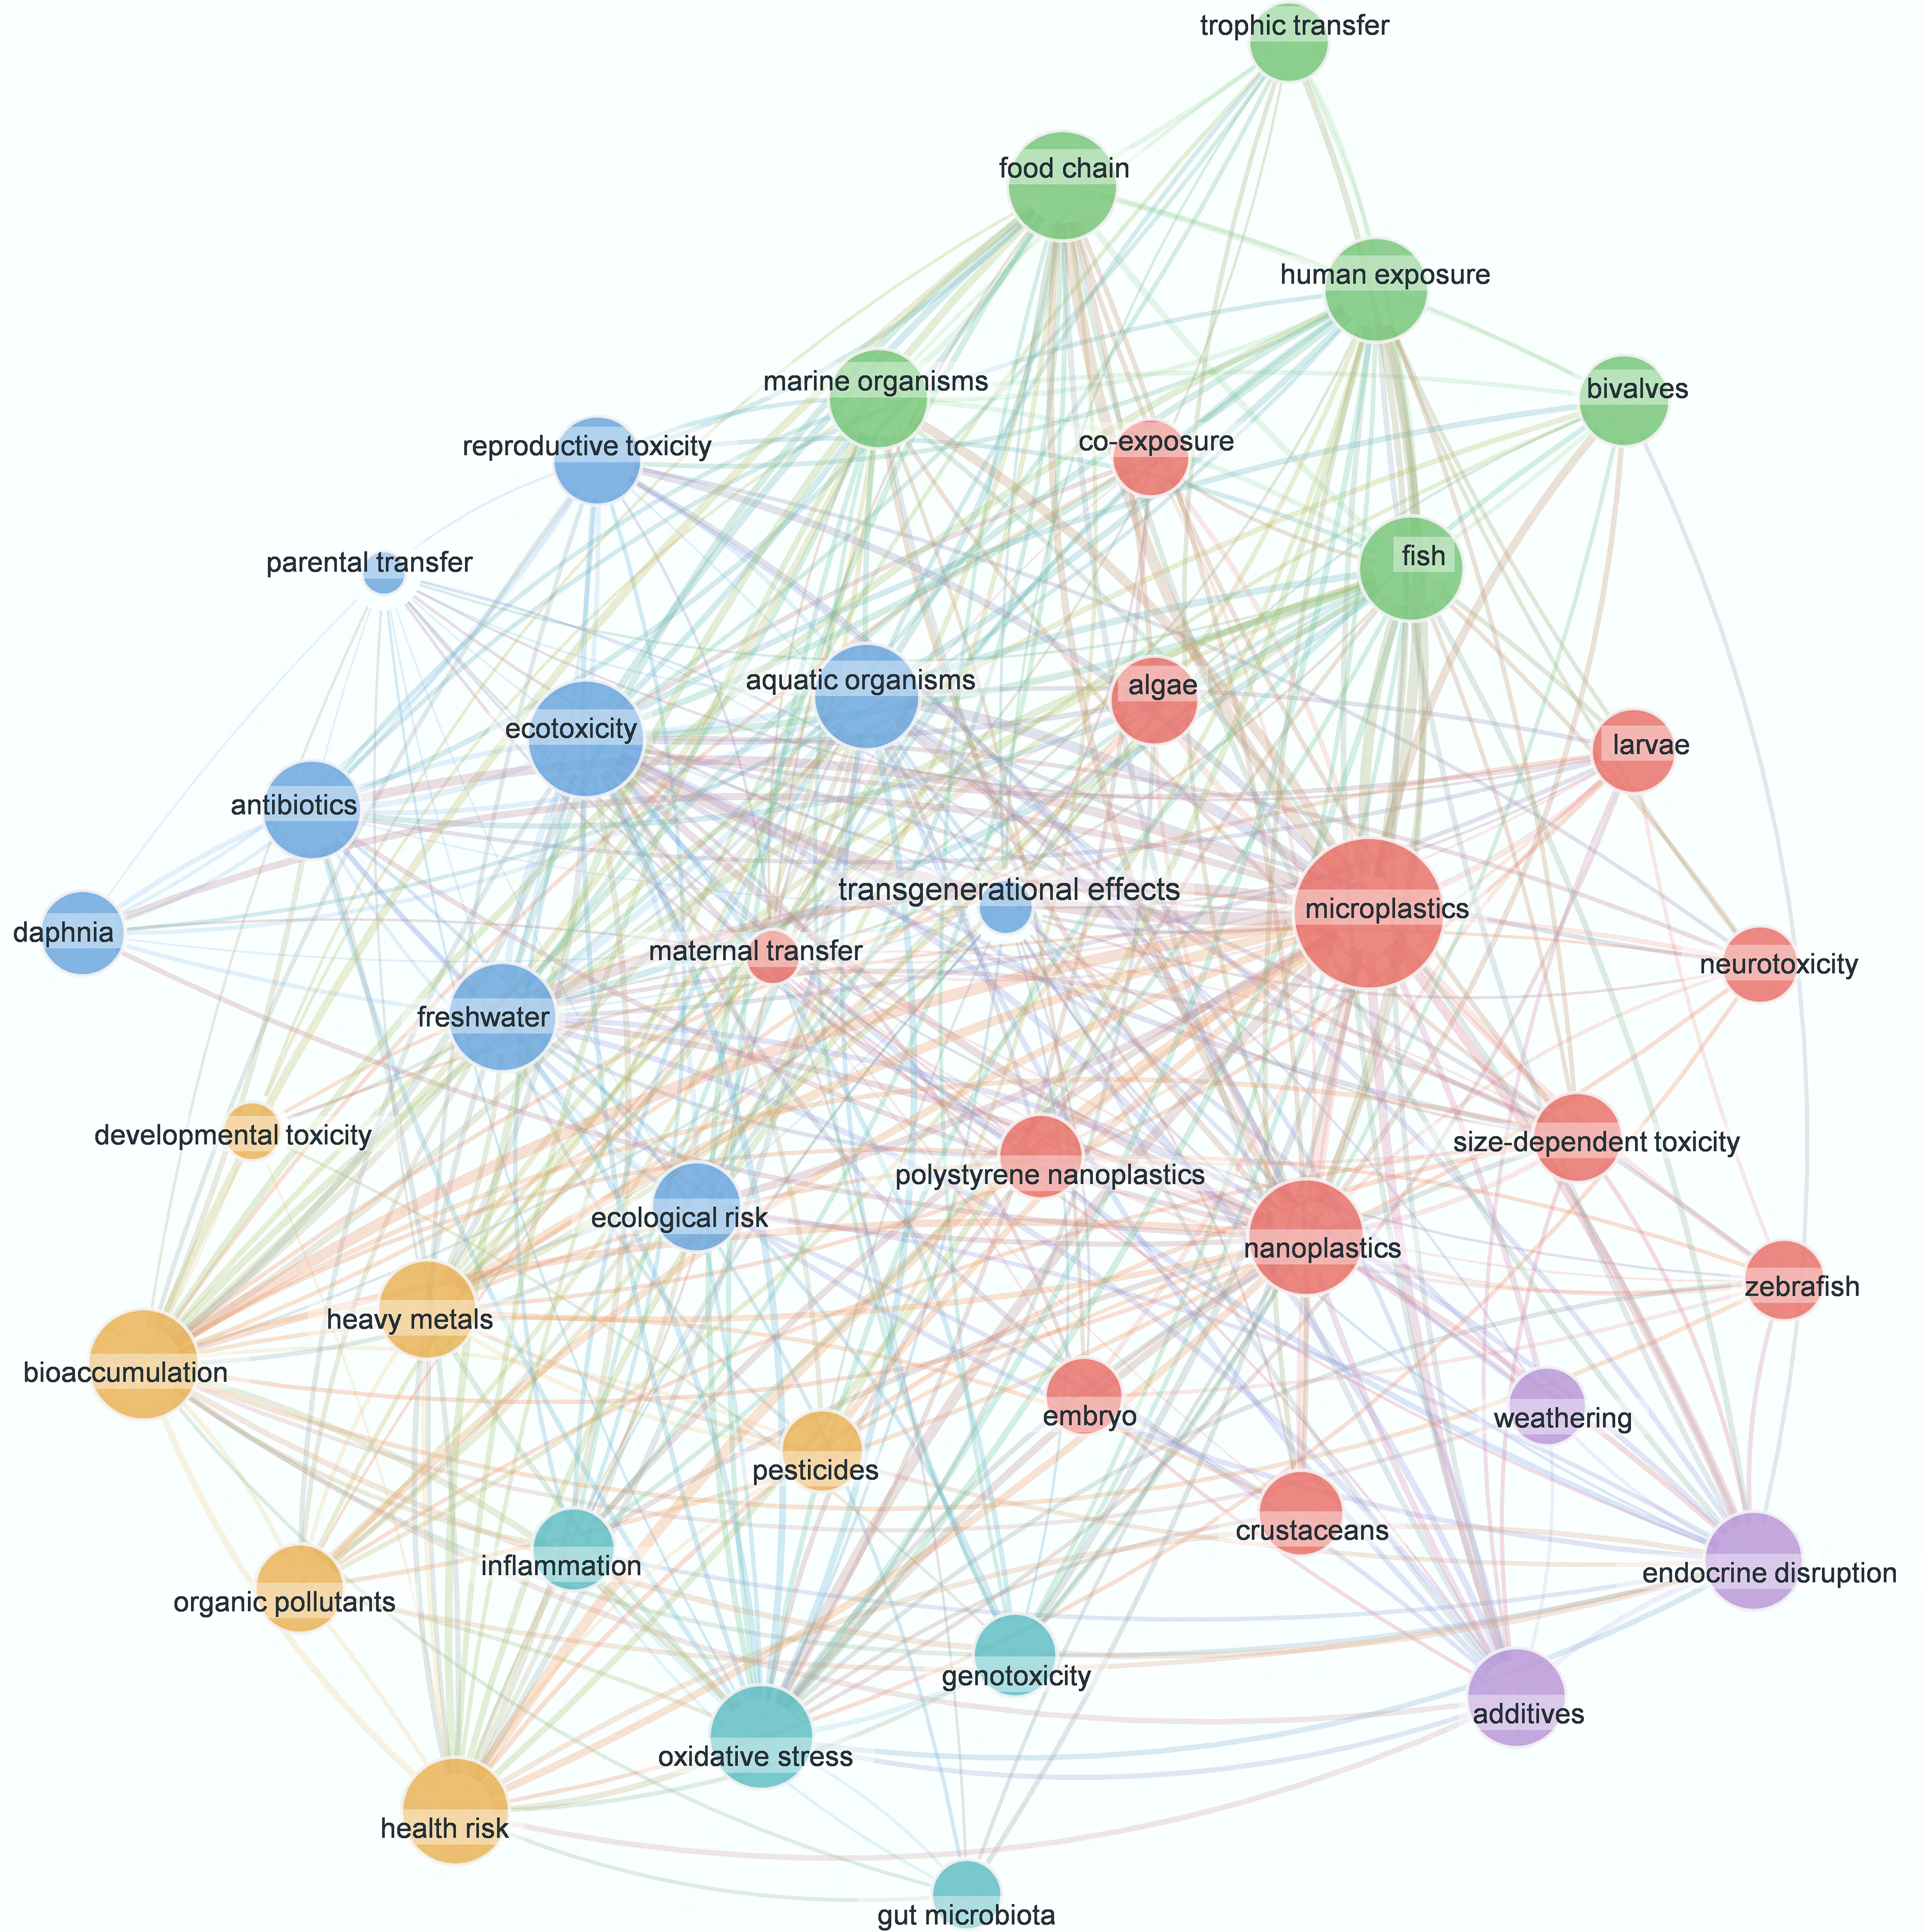
Figure 1.
Keyword co-occurrence network showing the research landscape of MNP ecotoxicology from 2010 to 2026. The network contains 40 keywords and 395 co-occurrence links distributed across six clusters. Node size indicates keywords' occurrence frequency, edge thickness indicates co-occurrence strength, and colors represent keyword clusters. The network is used only to position cross-generational transfer-related research within the broader MNP ecotoxicology field and does not provide causal evidence for particle transfer.
-
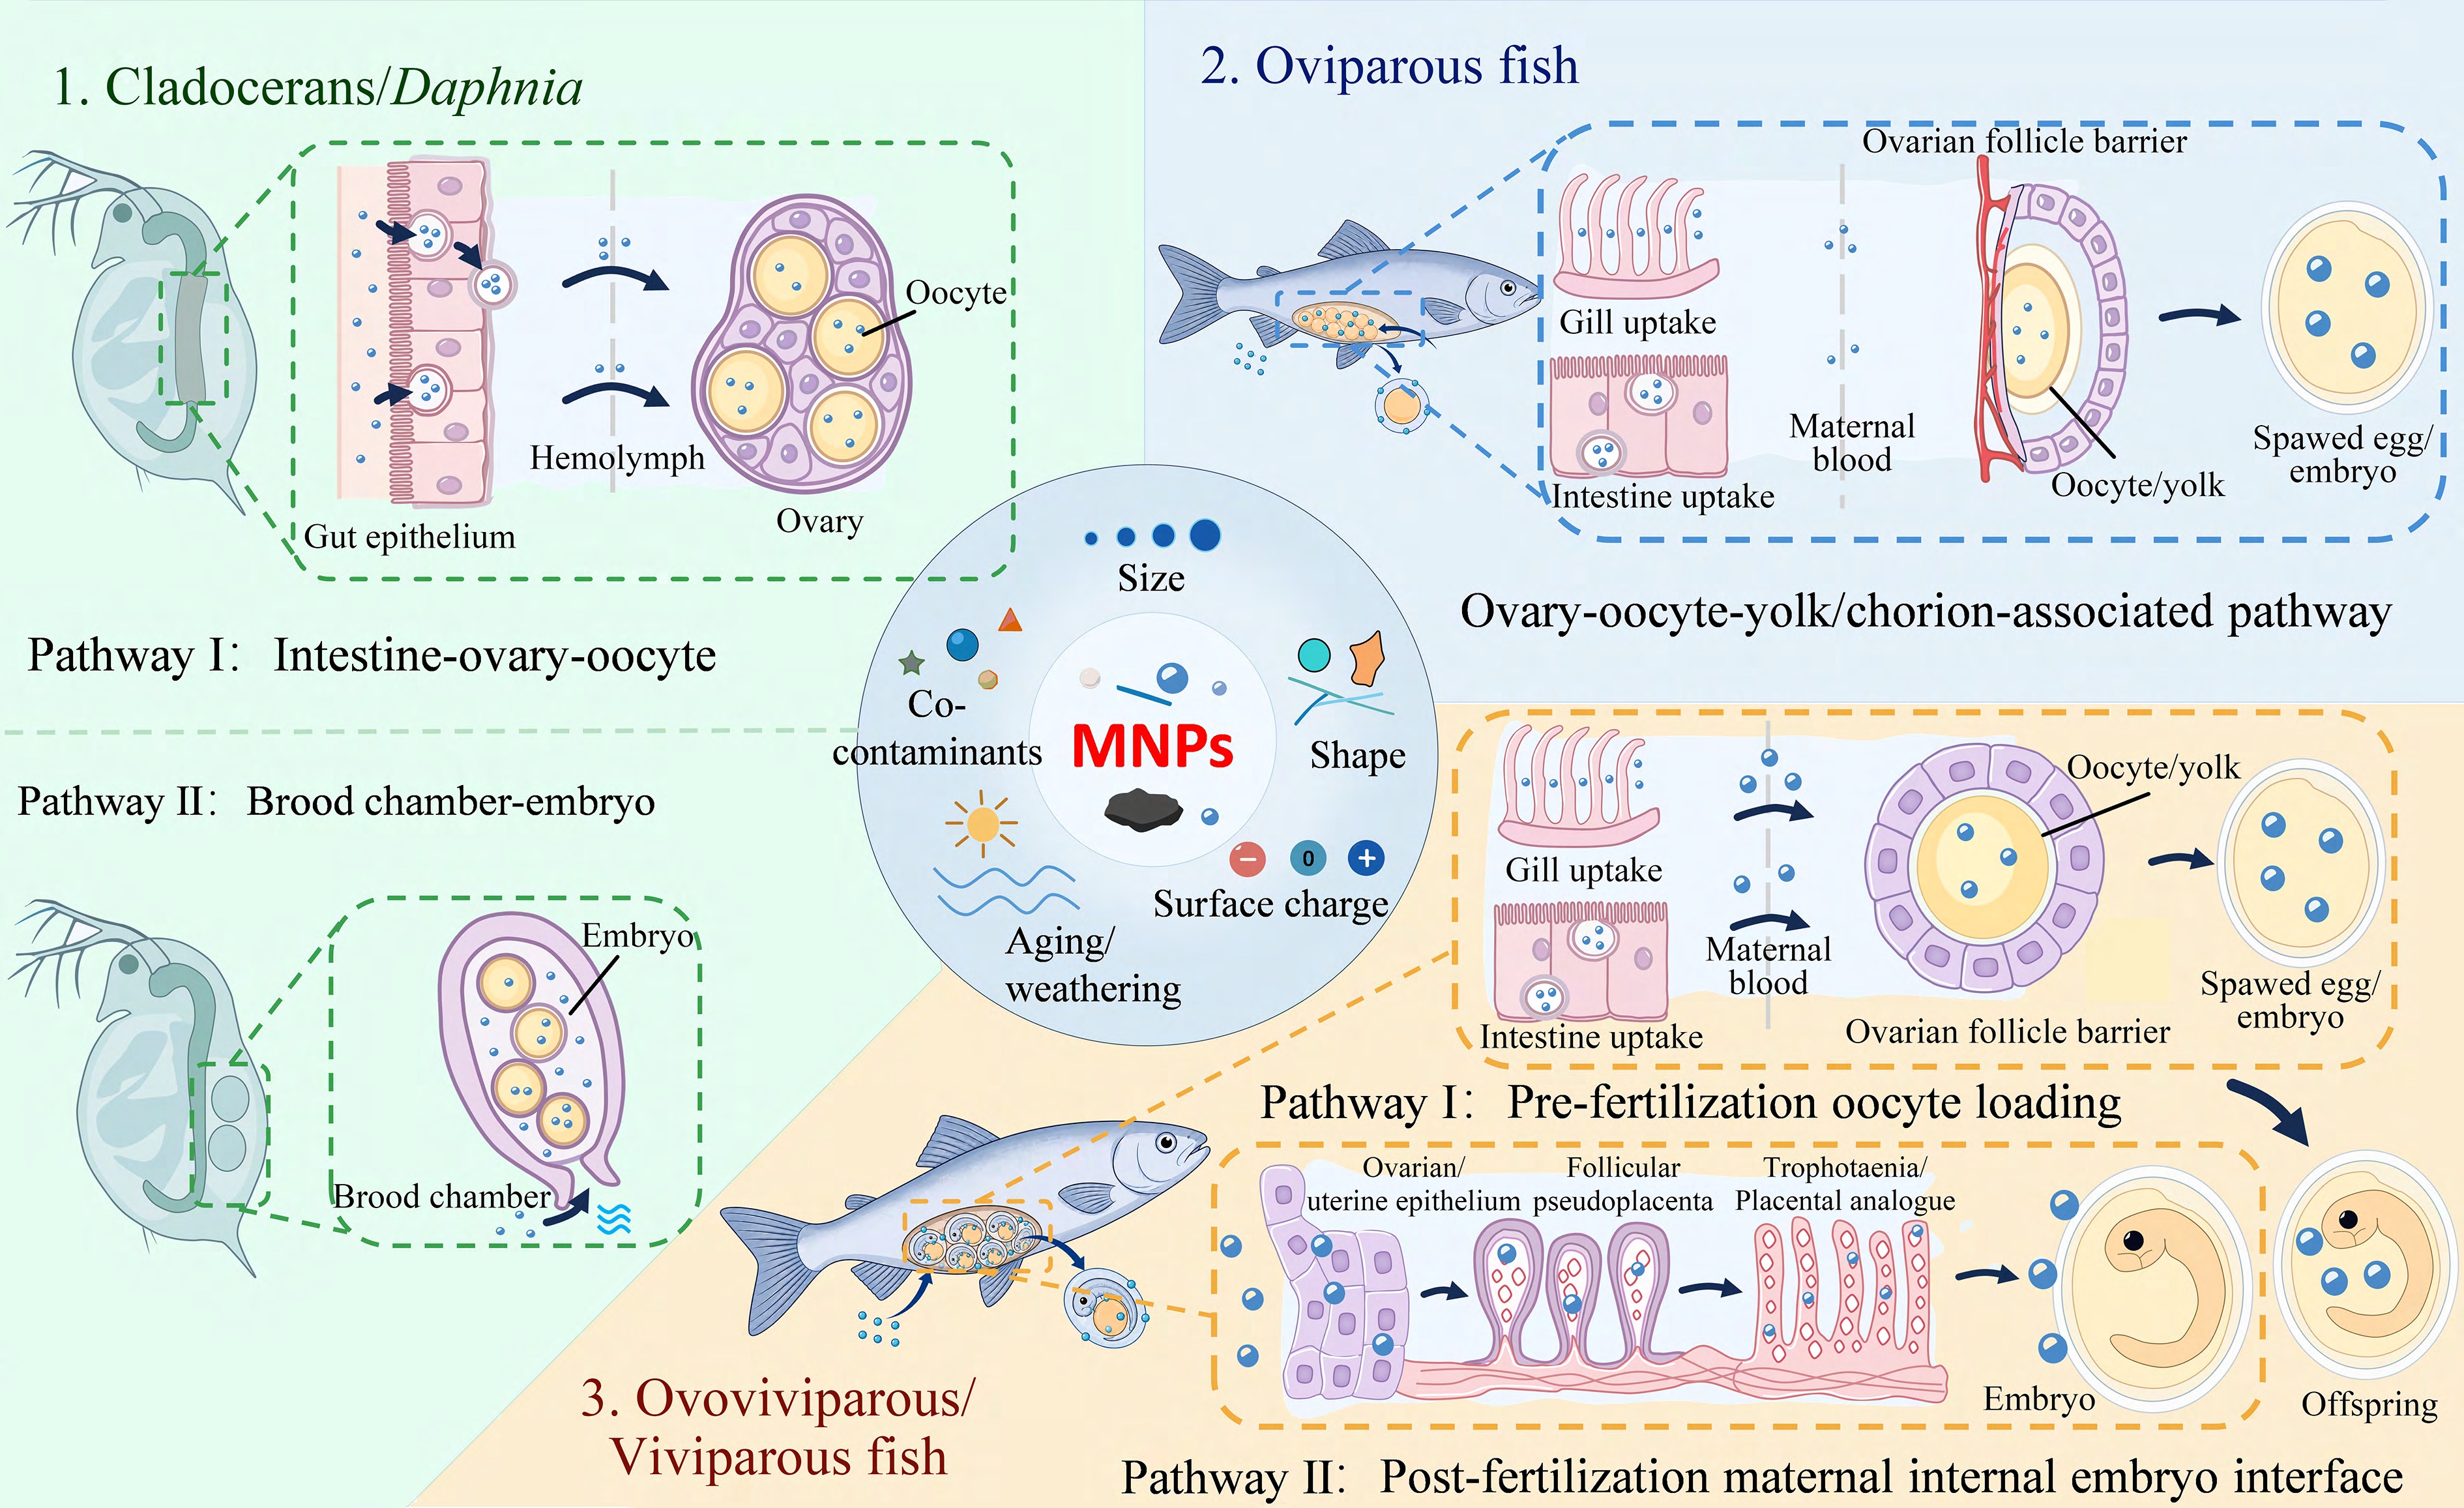
Figure 2.
Conceptual summary of taxon-specific maternal particle transfer and embryo exposure interfaces of MNPs in aquatic organisms. Background colors distinguish cladocerans, oviparous fish, and ovoviviparous/viviparous fish. Arrows indicate proposed directions of particle movement or embryo exposure. In cladocerans, Pathway I represents intestine–ovary–oocyte transfer and Pathway II brood chamber-mediated embryo exposure. In ovoviviparous/viviparous fish, Pathways I and II represent prefertilization oocyte loading and post-fertilization maternal internal embryo exposure, respectively. MNPs, micro(nano)plastics.
-
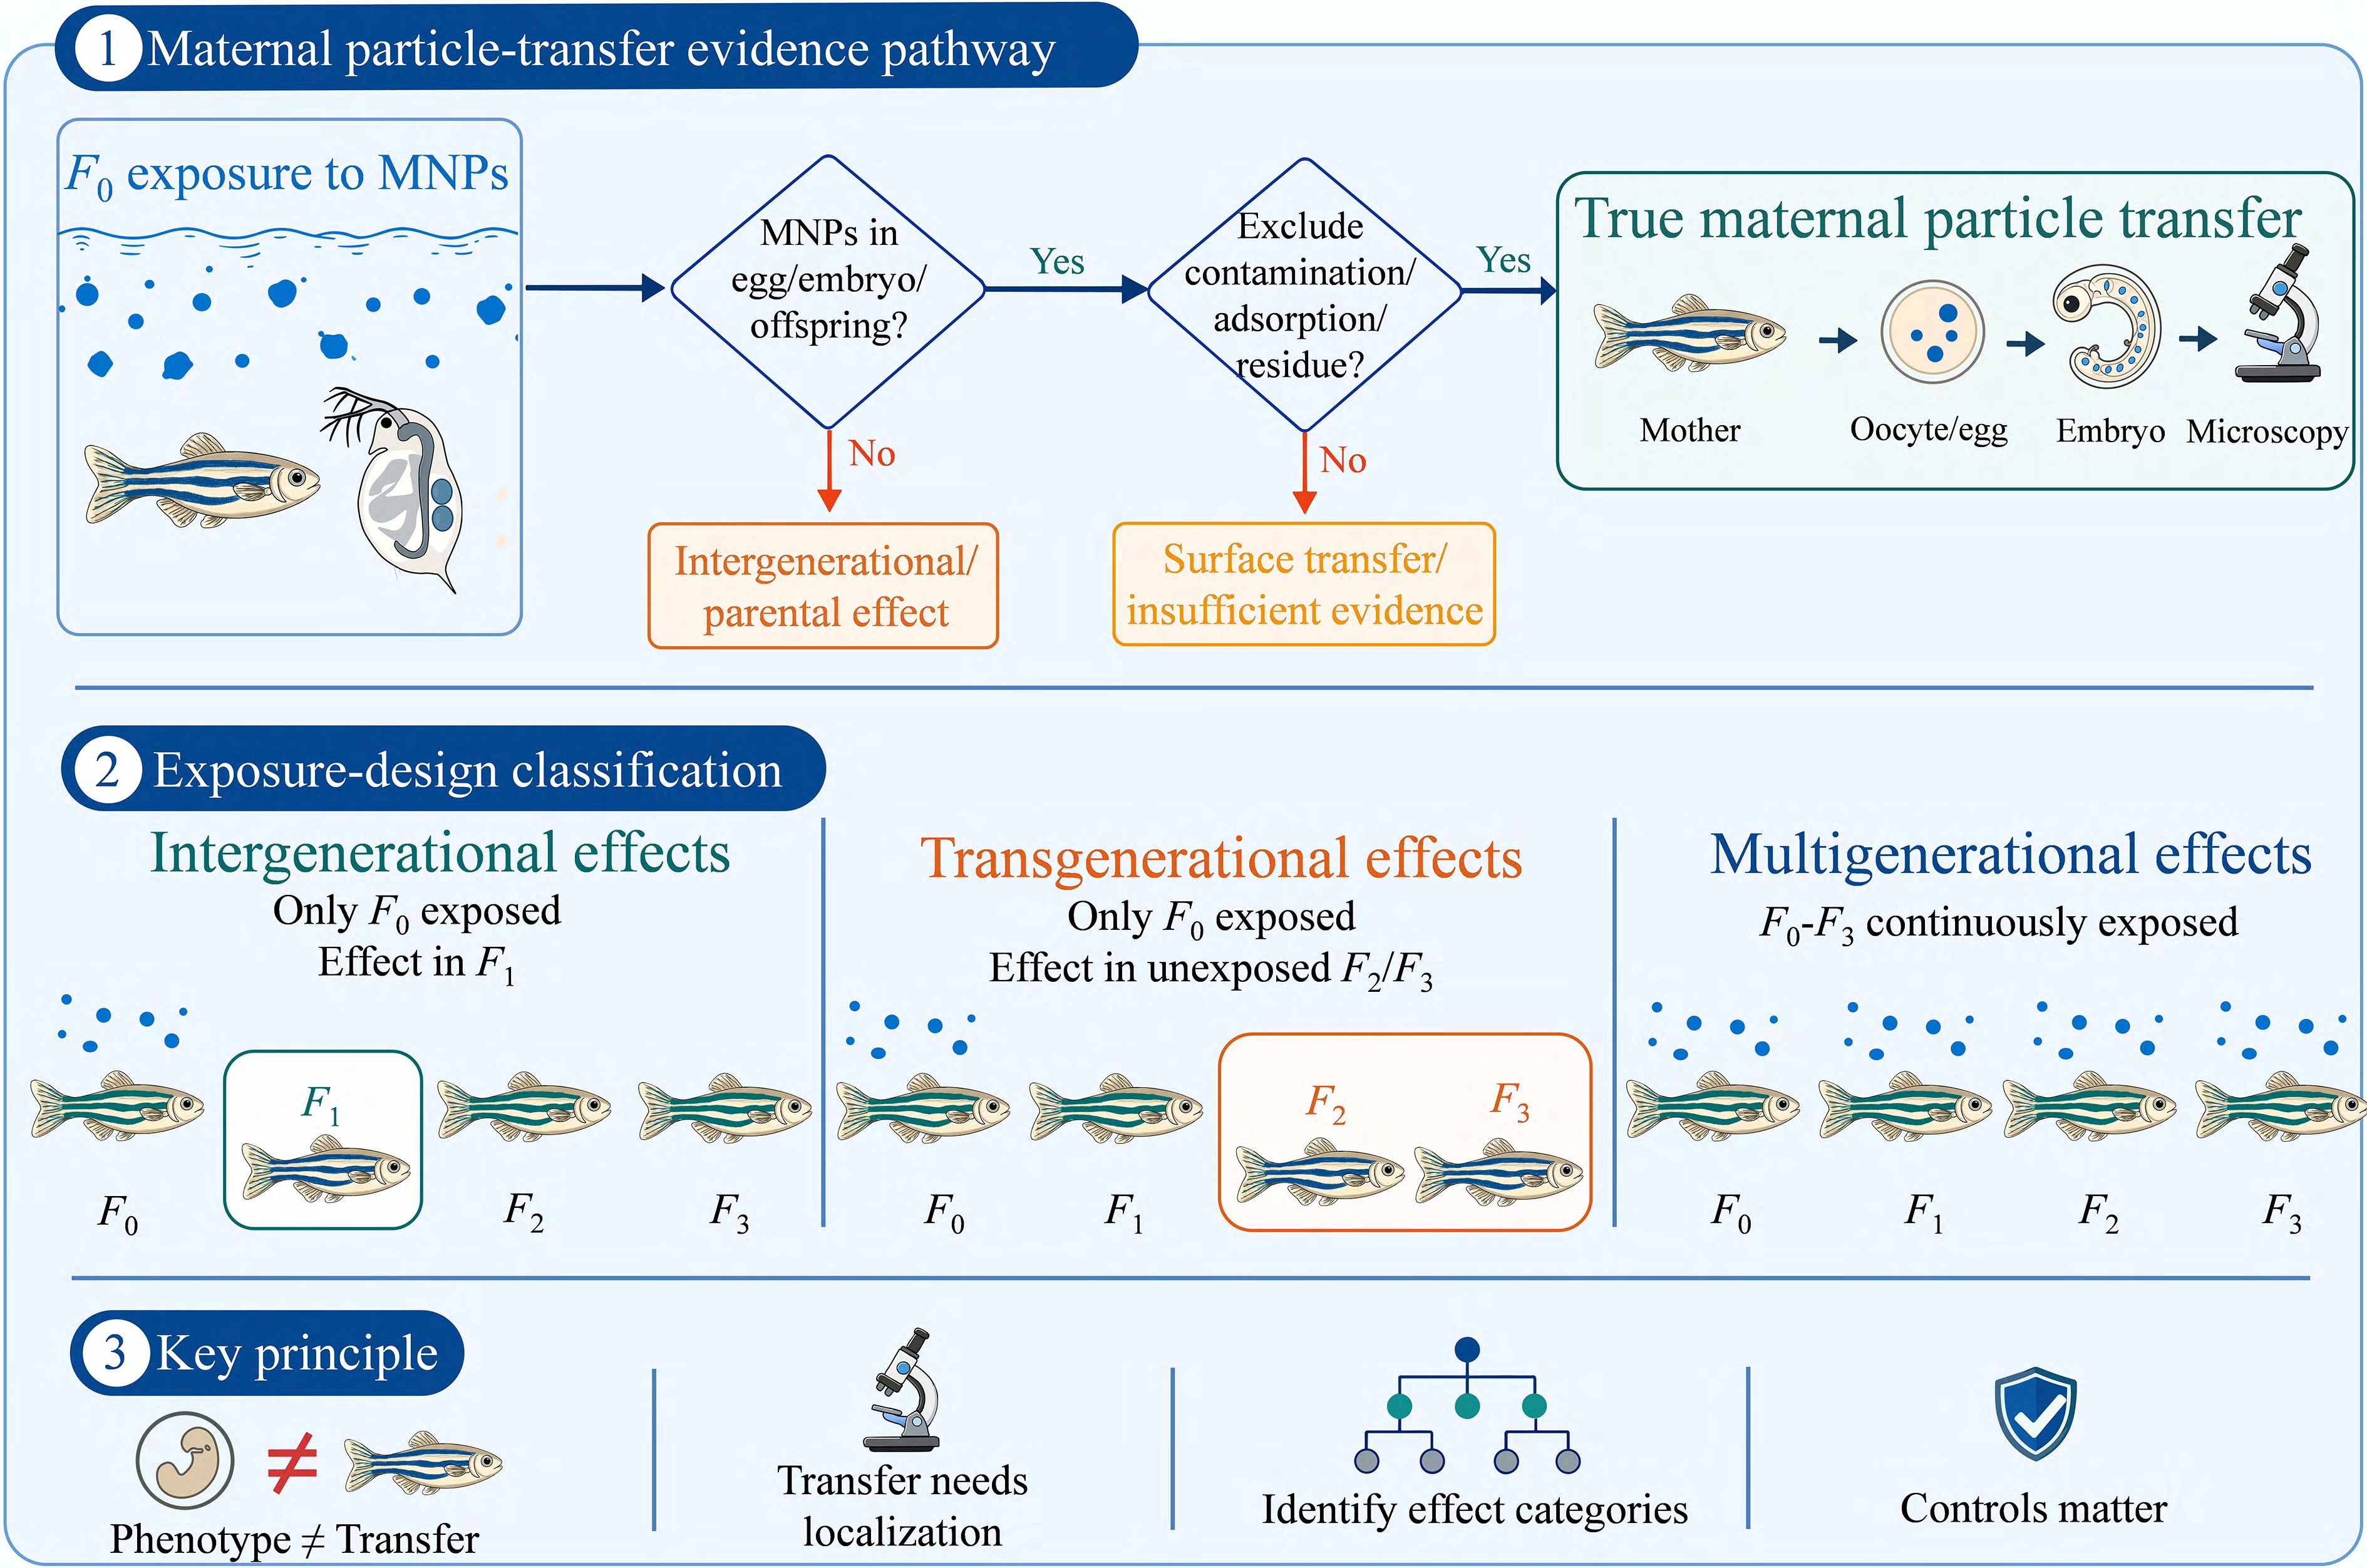
Figure 3.
Evidence-classification framework distinguishing true maternal particle transfer from intergenerational evidence, multigenerational evidence, and transgenerational evidence. The diagram separates transfer confidence from exposure design: True particle transfer requires particle localization in eggs, embryos, or offspring's tissues plus the controls for contamination, adsorption, dye leakage, and renewed exposure, whereas continuous exposure across generations is interpreted as multigenerational evidence unless a clean-generation or recovery design is present.
-
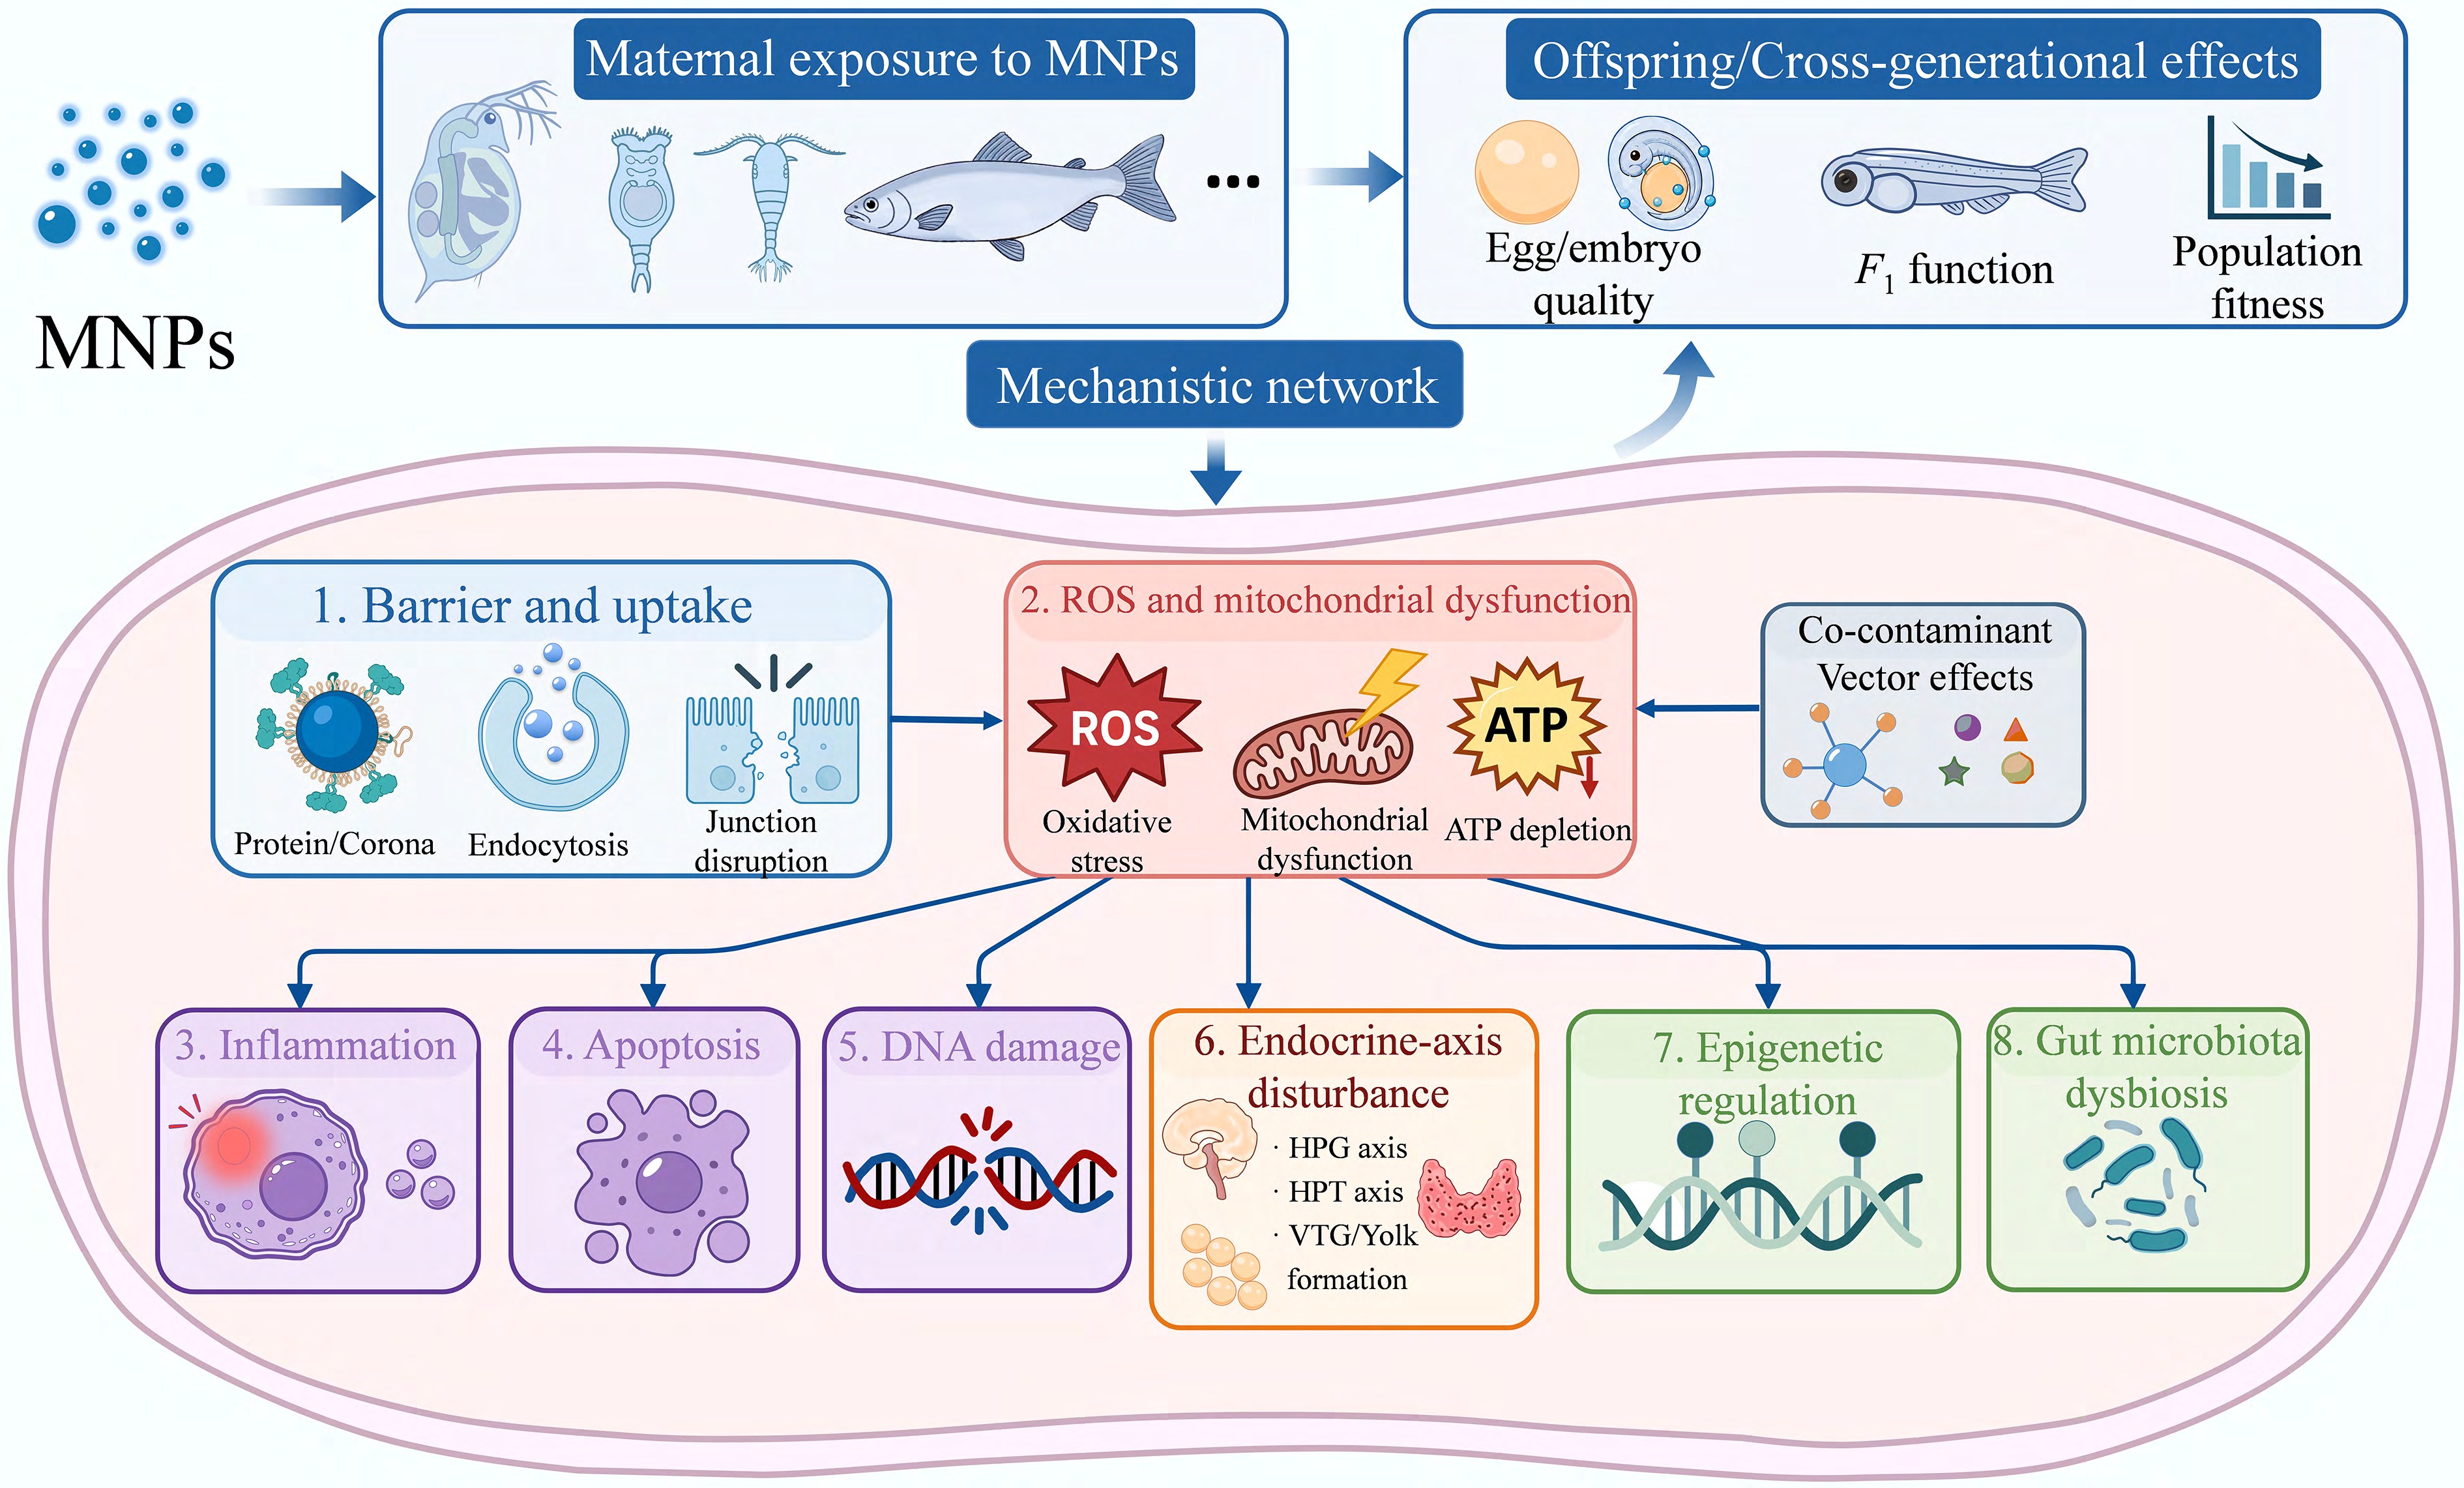
Figure 4.
Potential mechanistic pathways linking parental MNP exposure to offspring and multigenerational phenotypes, independent of demonstrated particle transfer. The mechanistic network includes barrier uptake, oxidative stress and mitochondrial dysfunction, inflammation, apoptosis, DNA damage, endocrine axis disturbance, epigenetic regulation, and gut microbiota dysbiosis. Co-contaminant vector effects may modify exposure and tissue distribution across these pathways. Arrows indicate proposed mechanistic connections rather than a confirmed linear causal sequence. MNPs, micro(nano)plastics; ROS, reactive oxygen species; ATP, adenosine triphosphate; HPG, hypothalamic–pituitary–gonadal; HPT, hypothalamic–pituitary–thyroid; VTG, vitellogenin.
-
Model Plastic material Exposure design Evidence category Localization evidence Main methodological limitation Biological endpoints Ref. Daphnia galeata PS-NPs; 52 nm; 5 mg/L F0 exposed for 5 d; embryos remained in the brood chamber during exposure; no clean-generation follow-up Intergenerational evidence Fluorescence microscopy; confocal Z-stack No clean-generation design Adult survival and pregnancy rate decreased; embryos showed abnormal development and low hatching; no persistent offspring survival/lipid effect after hatching [16] Daphnia magna Pd-doped PS NPs; 200 nm; 0.1 and 1 mg/L F0–F3 continuous exposure; 21 d per generation; no clean-generation condition Multigenerational evidence ICP-MS via Pd tracer No clean-generation design; no tissue-level particle localization Adult survival largely unchanged; F3 fertility increased at 1 mg/L, whereas F3 offspring body size and lipid content decreased; useful low-effect case [17] Daphnia magna Polyester MP fibers; 6 μm; 10 and 100 particles/L Parallel F0–F2 continuous and clean-generation lines Transgenerational evidence SEM; transfer check; DNA methylation sequencing Particle transfer was not directly confirmed Reproduction and molting decreased; clean F1/F2 lines retained fitness loss and altered DNA methylation; particle transfer was not confirmed. [18] Daphnia magna PE-MP/BP-3 fragments; 19.31 ± 5.16 μm; 5 mg/L F0 exposed for 21 d; F1–F3 reared in clean M4 medium Transgenerational evidence; co-exposure WGBS; phenotypic tracking No direct particle localization; combined MP/BP-3 exposure Population growth decreased in F0–F1 but recovered in F2–F3; DNA methylation signatures persisted across F0–F3. [19] Brachionus
koreanusFluorescent PS-NPs; 50 nm; 1 and 10 μg/mL F0 maternal exposure; eggs/offspring transferred to clean seawater before assessment Intergenerational evidence; strong support for maternal particle transfer Fluorescence microscopy; egg-only and dye leaching controls Fluorescence-based detection without orthogonal particle confirmation NP signal increased in eggs; F1 maturation was delayed, reproduction/lifespan declined, and ROS increased. [20] Brachionus
plicatilisAmino-modified PS-NPs
(PS-NH2); 0.5 and 2.5 mg/LF0–F3 continuous exposure with recovery lineage follow-up Multigenerational evidence Bioaccumulation imaging; transcriptomics No orthogonal confirmation of particle transfer Population growth was suppressed; egg and offspring numbers decreased across generations; reproductive strategy shifted from r- to K-selection. [21] Tigriopus japonicus PS-NPs; 50 nm; 23 μg/L;
Hg, 1 μg/LF0–F2 continuous co-exposure; no clean-generation condition Multigenerational evidence; co-exposure CV-AFS for Hg; RNA-seq No clean-generation design or direct offspring localization PS-NPs increased Hg body burden; survival and fecundity decreased; development time and reproduction-related transcriptome were disrupted. [22] Danio rerio Fluorescent PS-NPs; 100 nm; 10 μg/L; EHS, 1–100 μg/L F0 exposed for 28 d; F1 embryos/larvae cultured in clean water Intergenerational evidence; co-exposure Fluorescence imaging and SEM for PS-NP distribution; GC-MS/MS for EHS quantification F1 particle uptake was observed, but endogenous maternal transfer was not confirmed. PS-NPs and EHS accumulated in F1 embryos, predominantly in the yolk sac; PS-NPs subsequently redistributed to other tissues and enhanced EHS transfer to offspring [23] Danio rerio Fluorescent PS-NPs; 54.5 ± 2.8 nm; 100 μg/L; TDCIPP, 0.4–10 μg/L F0 lifecycle exposure, 2 hpf–150 dpf; F1 assessed in clean water to 5 dpf Intergenerational evidence; co-exposure Fluorescence microscopy; LC-MS/MS No orthogonal particle localization in F1 PS-NPs promoted TDCIPP transfer to F1 eggs; Hatching/development and locomotor behavior worsened with disruption of the dopamine pathway. [24] Oryzias melastigma PS-MPs; 13 μm; 2–200 μg/L; Phe, 50 μg/L F0 females exposed 60 d; mated with unexposed males; F1 cultured in clean seawater Intergenerational evidence; co-exposure Optical microscopy; HPLC Optical localization lacks polymer-specific confirmation MPs increased Phe accumulation in ovaries/embryos; ovarian maturity and egg output decreased; F1 heart rate, hatching, and body size were impaired. [25] Note: Models are ordered by cladocerans, rotifers/copepods, and fish. Intergenerational evidence = F0 exposure followed by F1 changes; multigenerational evidence = continuous exposure across F0, F1, F2, or later generations; transgenerational evidence = persistence in unexposed generations after a clean-generation or recovery design; true maternal particle transfer = particles directly localized in eggs, embryos, or offspring tissues with orthogonal particle confirmation and adequate controls for external contamination. Co-exposure is shown only as a qualifier. Localization evidence lists the reported detection or analytical methods and does not by itself establish transfer certainty. CV-AFS, cold-vapor atomic fluorescence spectrometry; dpf, days post-fertilization; EHS, ethylhexyl salicylate; GC-MS/MS, gas chromatography-tandem mass spectrometry; Hg, mercury; HPLC, high-performance liquid chromatography; ICP-MS, inductively coupled plasma mass spectrometry; LC-MS/MS, liquid chromatography-tandem mass spectrometry; Phe, phenanthrene; RNA-seq, RNA sequencing; SEM, scanning electron microscopy; TDCIPP, tris(1,3-dichloro-2-propyl) phosphate; WGBS, whole-genome bisulfite sequencing. Additional evidence is provided in Supplementary Table S1. Table 1.
Representative cross-generational MNP studies in aquatic organisms selected to distinguish true maternal particle transfer, intergenerational evidence, multigenerational evidence, and transgenerational evidence
Figures
(4)
Tables
(1)