-
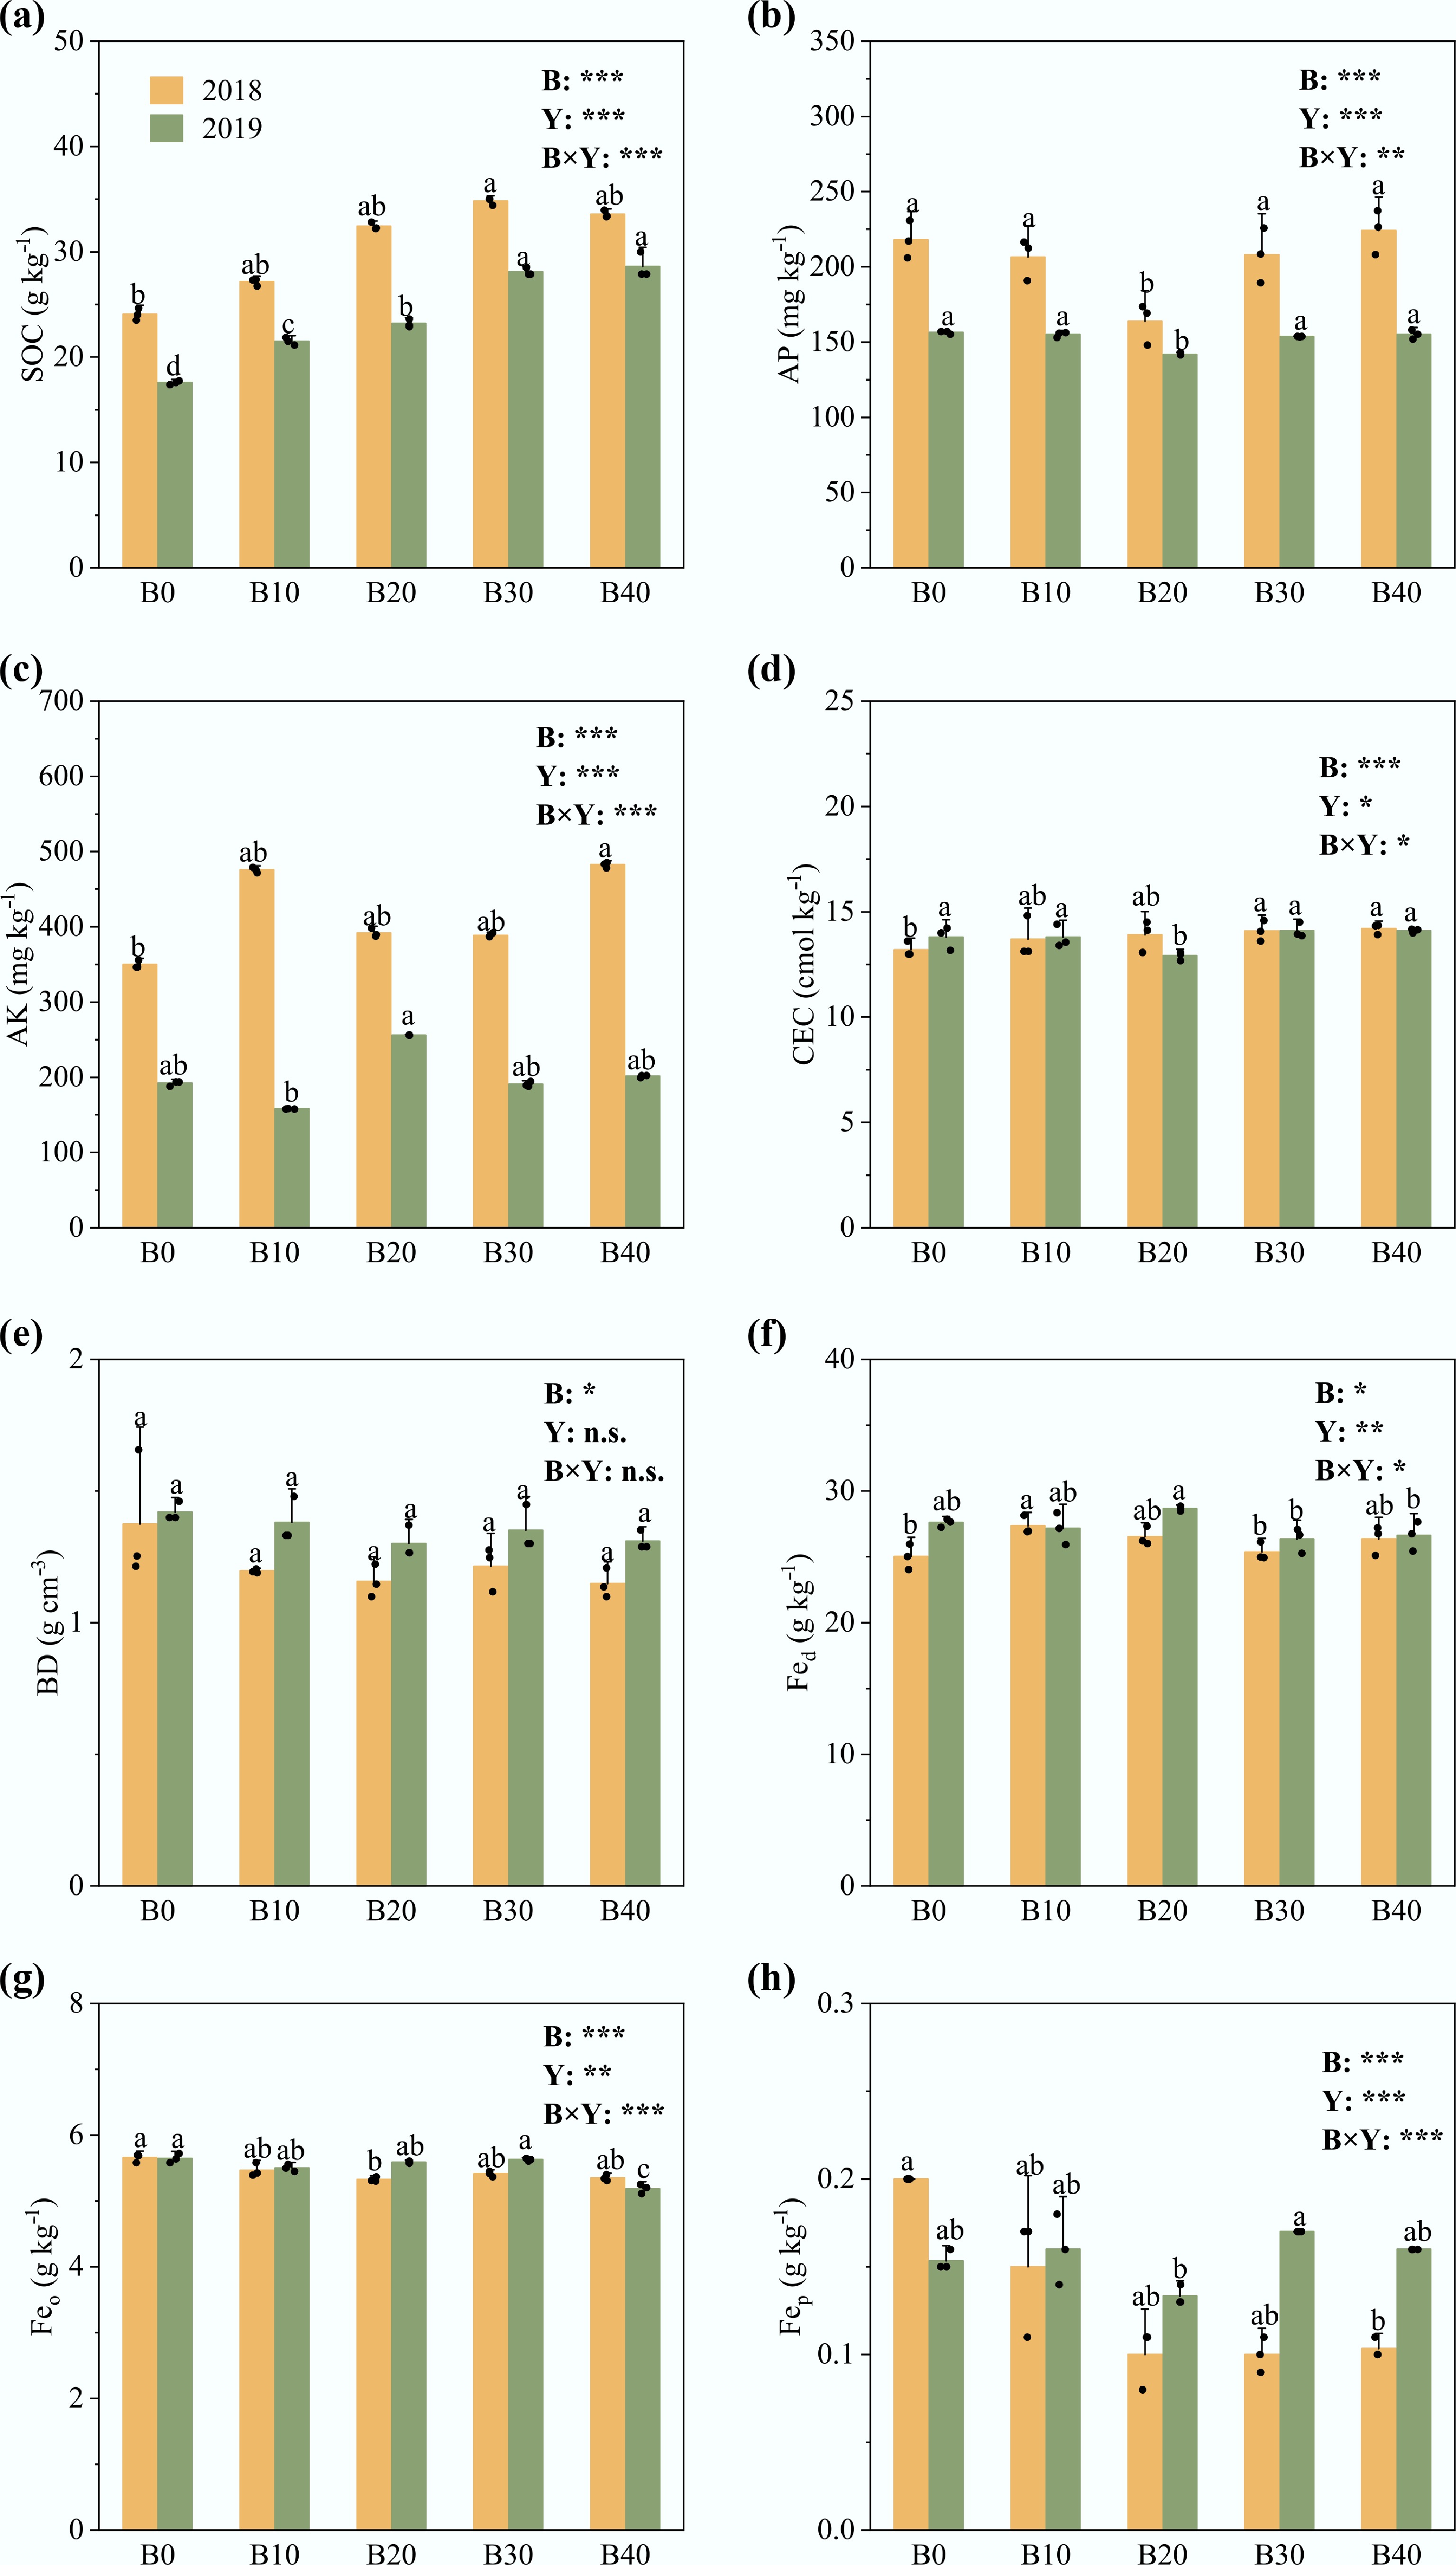
Figure 1.
Effects of different application rates of biochar on soil physicochemical properties in 2018 to 2019: (a) SOC, soil organic carbon; (b) AP, soil available phosphorus; (c) AK, soil available potassium; (d) CEC, cation exchange capacity; (e) BD, bulk density; (f) Fed, free iron oxide; (g) Feo, amorphous iron oxide; (h) Fep, complexed iron. Error bars indicate standard deviations (n = 3). B0, B10, B20, B30, and B40 are treatments with N fertilization and application of 0, 10, 20, 30, and 40 t biochar ha−1, respectively. Different lowercase letters indicate statistically significant differences (p < 0.05) between treatments in the same year. B indicates biochar effect; Y indicates cropping year effect; B × Y indicates interaction effects between biochar and year; ns, not significant; * p < 0.05; ** p < 0.01; *** p < 0.001. The SOC and BD for 2019 and the CEC for 2018 were redrawn from Liu et al.[58] and Li et al.[60], respectively.
-
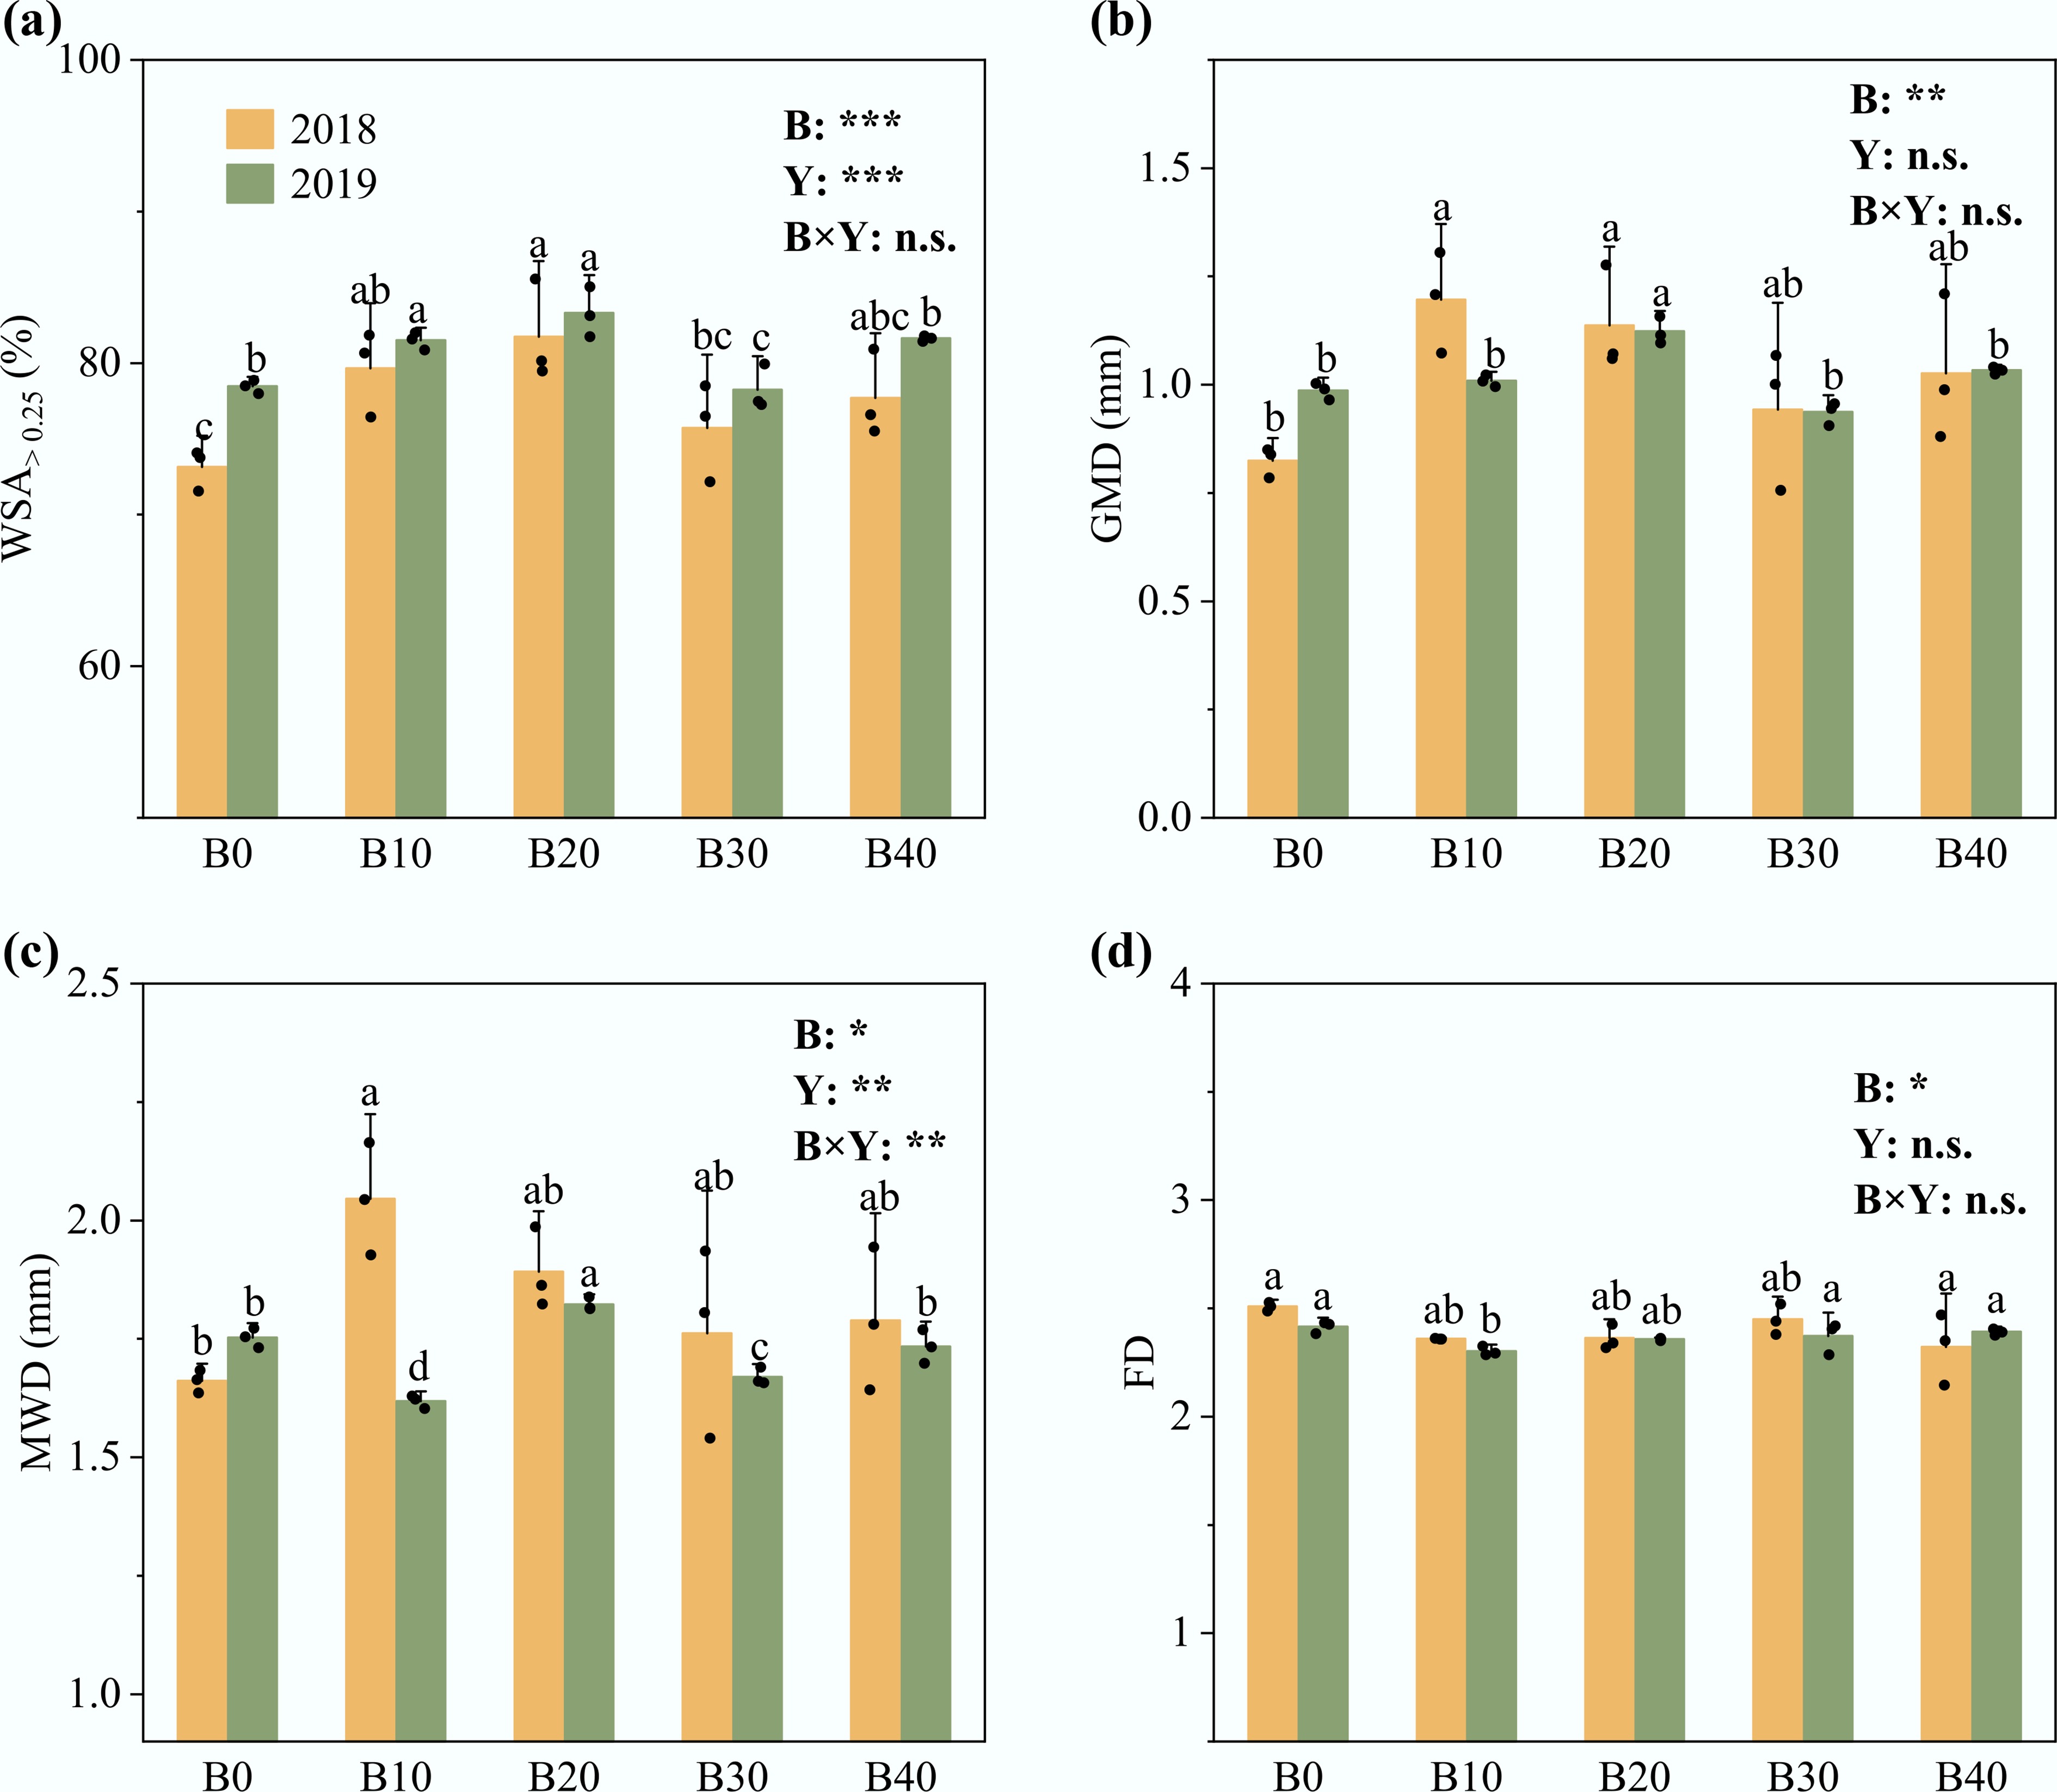
Figure 2.
Soil aggregate stability under different application rates of biochar in 2018 to 2019: (a) WSA>0.25, water-stable macroaggregates (%); (b) GMD, geometric mean diameter; (c) MWD, mean weight diameter; (d) FD, fractal dimension. Error bars indicate standard deviations (n = 3). B0, B10, B20, B30, and B40 are treatments with N fertilization and application of 0, 10, 20, 30, and 40 t biochar ha−1, respectively. Different lowercase letters indicate statistically significant differences (p < 0.05) between treatments in the same year. B indicates biochar effect; Y indicates cropping year effect; B × Y indicates interaction effects between biochar and year; ns, not significant; * p < 0.05; ** p < 0.01; *** p < 0.001.
-
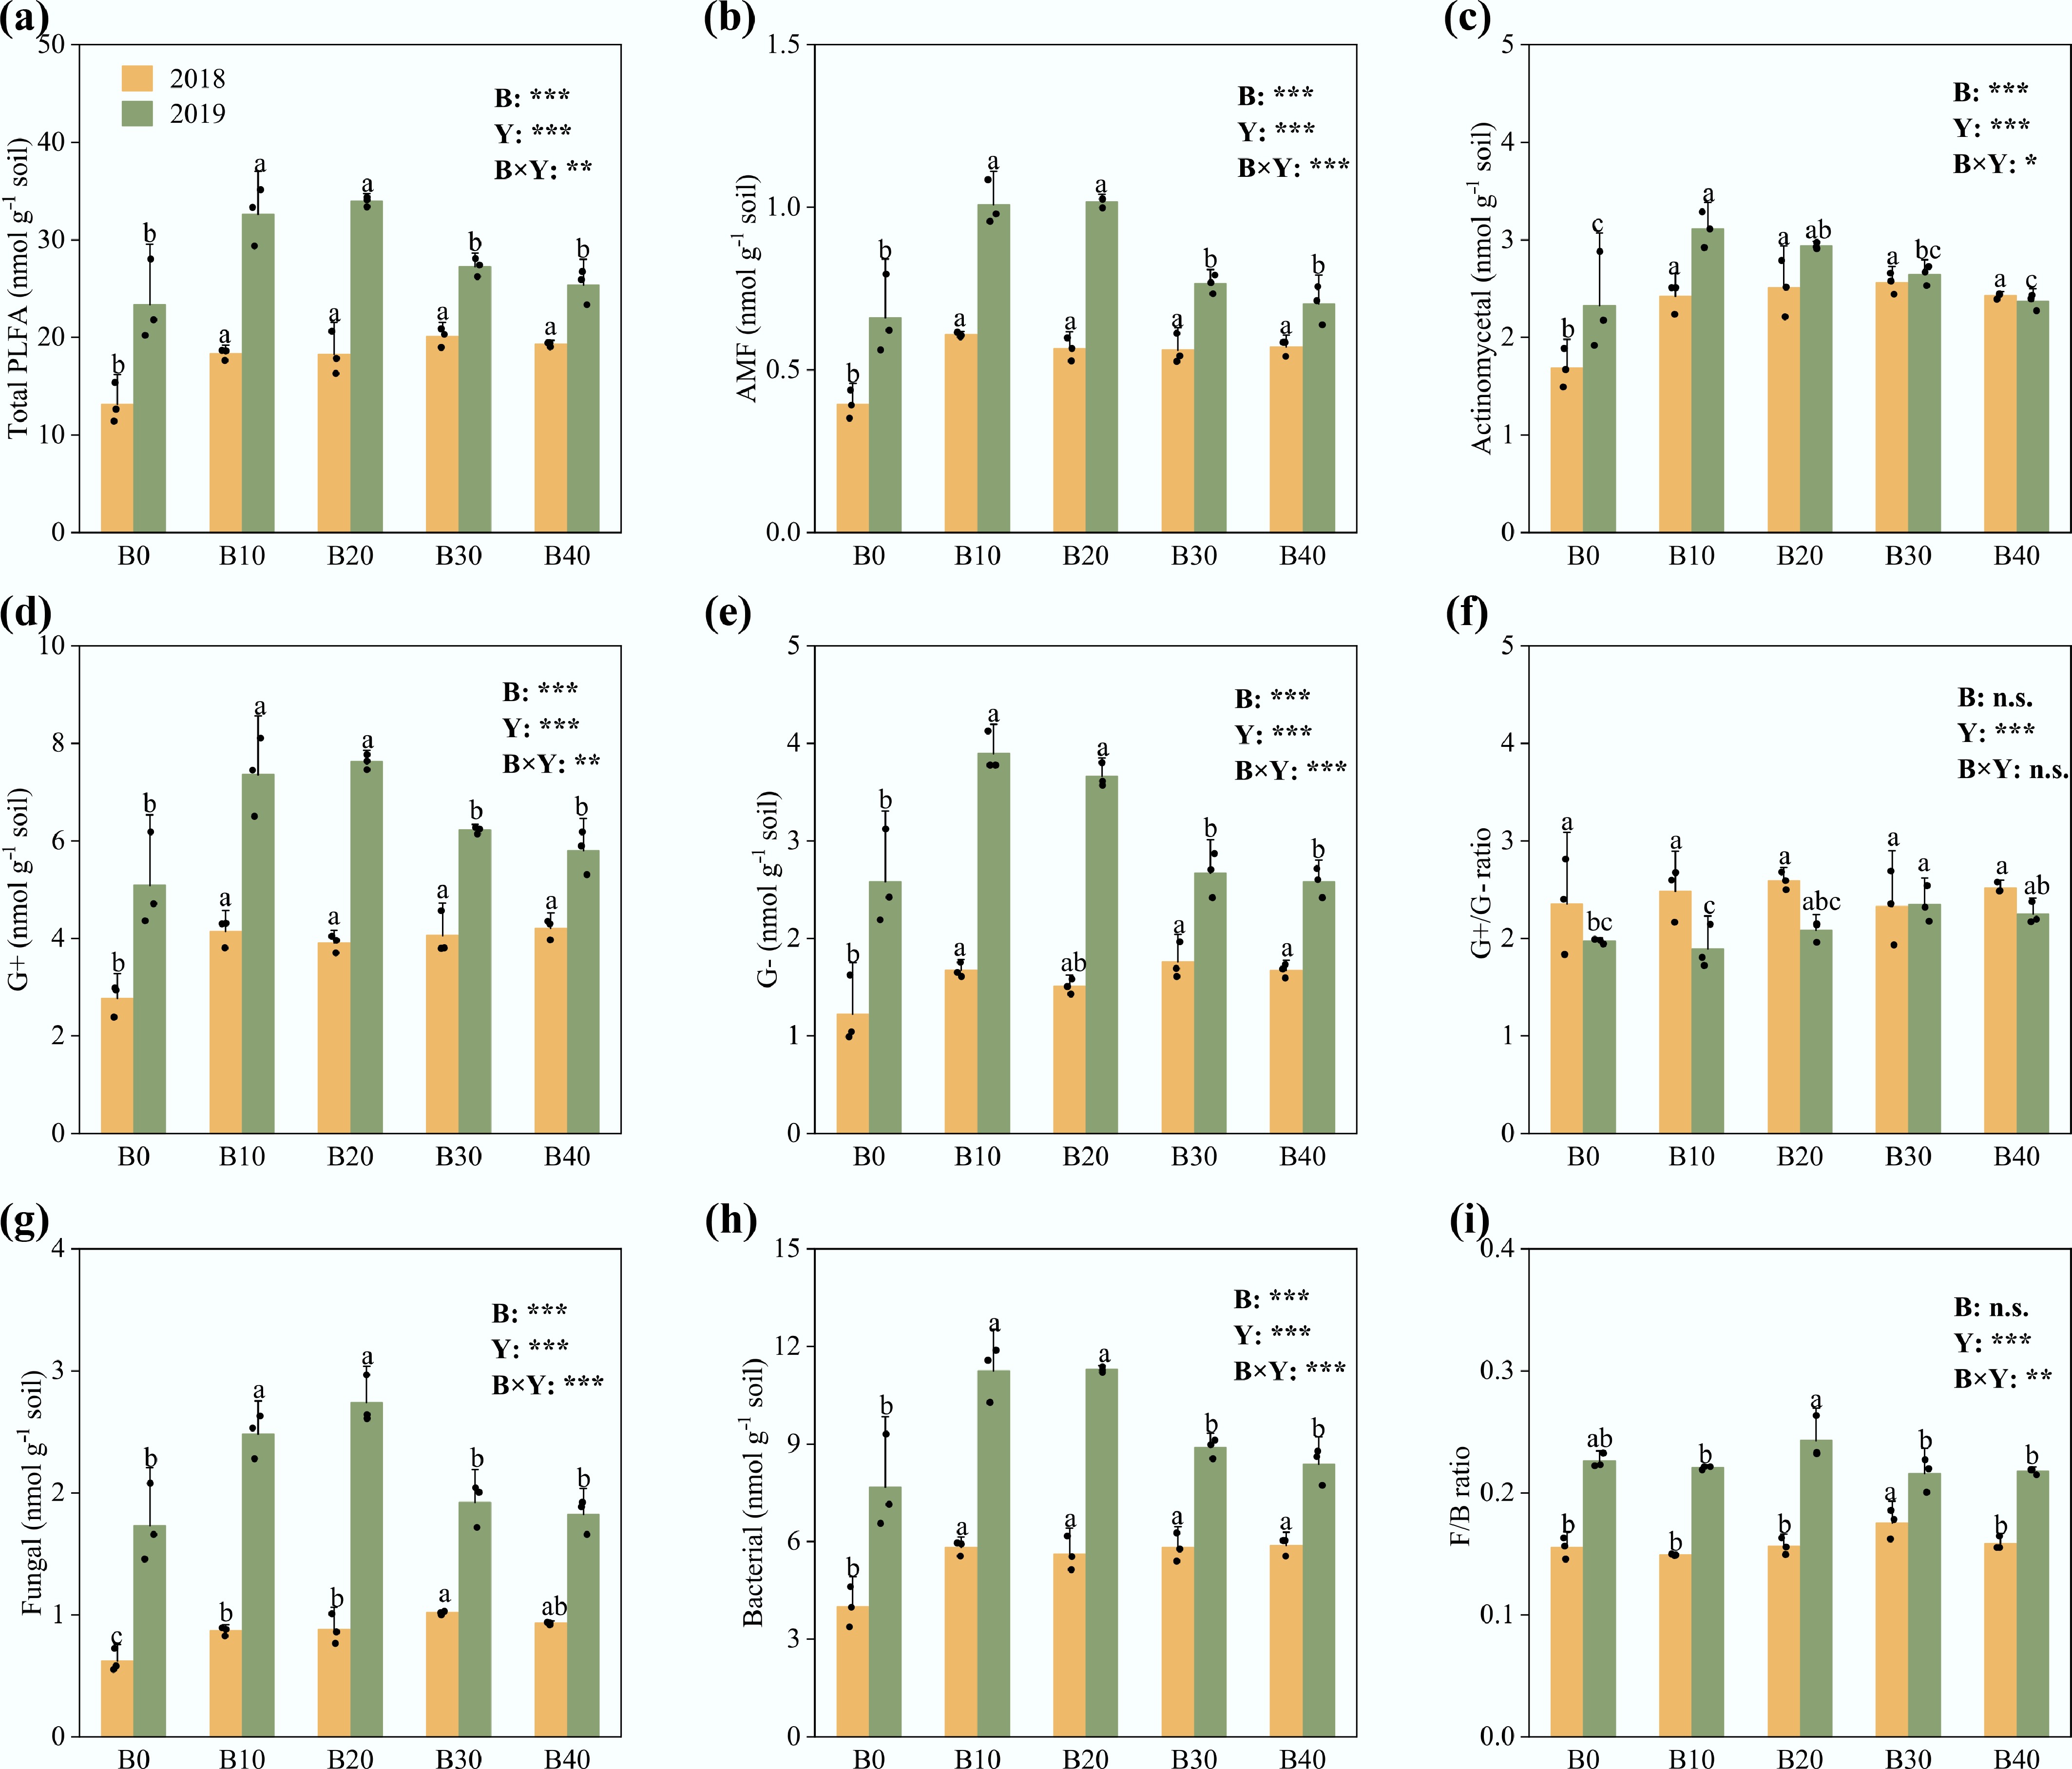
Figure 3.
Effects of different addition rates of biochar on (a) total phospholipid fatty acid (PLFA) content; (b) arbuscular mycorrhizal fungi (AMF) PLFAs; (c) actinomycete PLFAs; (d) Gram-positive bacteria (G+) PLFAs; (e) Gram-negative bacteria (G−) PLFAs; (f) G+/G− PLFA ratios; (g) bacterial PLFAs. (h) fungal PLFAs; and (i) fungal/bacterial PLFA ratios. (i) Error bars indicate standard deviations (n = 3). B0, B10, B20, B30, and B40 are treatments with N fertilization and application of 0, 10, 20, 30, and 40 t biochar ha−1, respectively. Different lowercase letters indicate statistically significant differences (p < 0.05) between treatments in the same year. B indicates biochar effect; Y indicates cropping year effect; B × Y indicates interaction effects between biochar and year; ns, not significant; * p < 0.05; ** p < 0.01; *** p < 0.001. The total PLFA content, fungal PLFA content, bacterial PLFA content, and their PLFA ratios from 2019 were redrawn from Liu et al.[58].
-
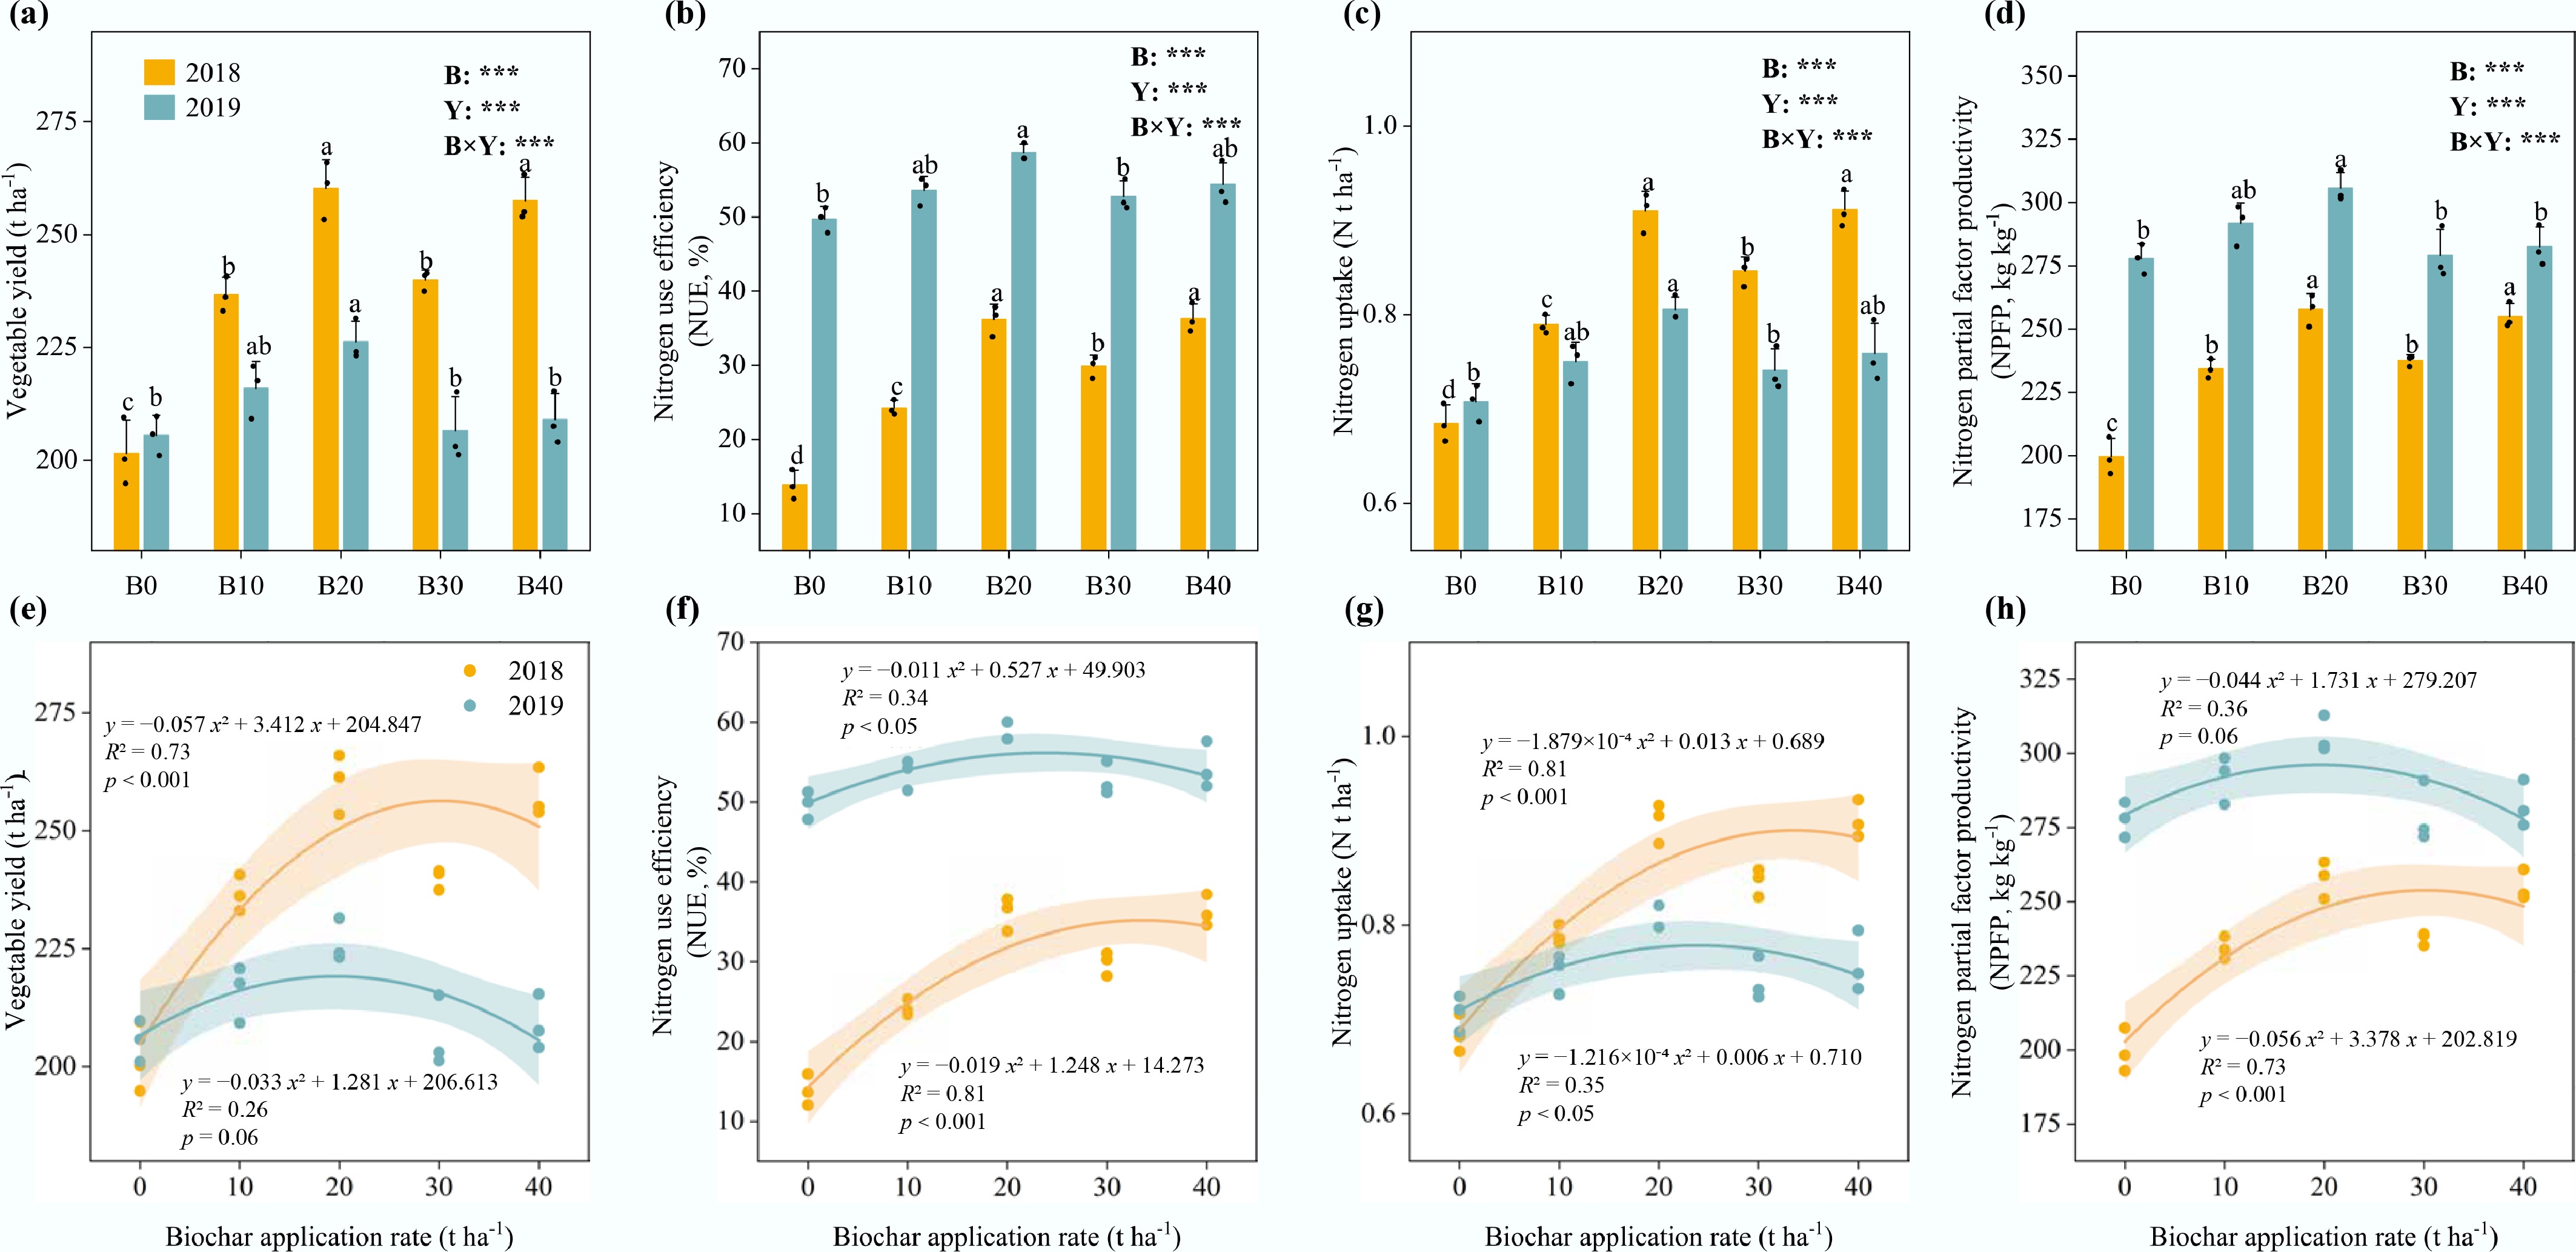
Figure 4.
Effects of different addition rates of biochar on (a) vegetable yield; (b) nitrogen use efficiency; (c) nitrogen uptake; and (d) nitrogen partial factor productivity, NPFP; and (e)–(h) the linear relationships between vegetable yield, NUE, nitrogen uptake, NPFP, and biochar addition rate in 2018 to 2019. Error bars indicate standard deviations (n = 3). B0, B10, B20, B30, and B40 are treatments with N fertilization and application of 0, 10, 20, 30, and 40 t biochar ha−1, respectively. Different lowercase letters indicate statistically significant differences (p < 0.05) between treatments in the same year. B indicates biochar effect; Y indicates cropping year effect; B × Y indicates interaction effects between biochar and year; *** p < 0.001. Solid lines and shaded areas indicate linear regression lines and 95% confidence intervals. The vegetable yield in 2018 was redrawn from Li et al.[60].
-
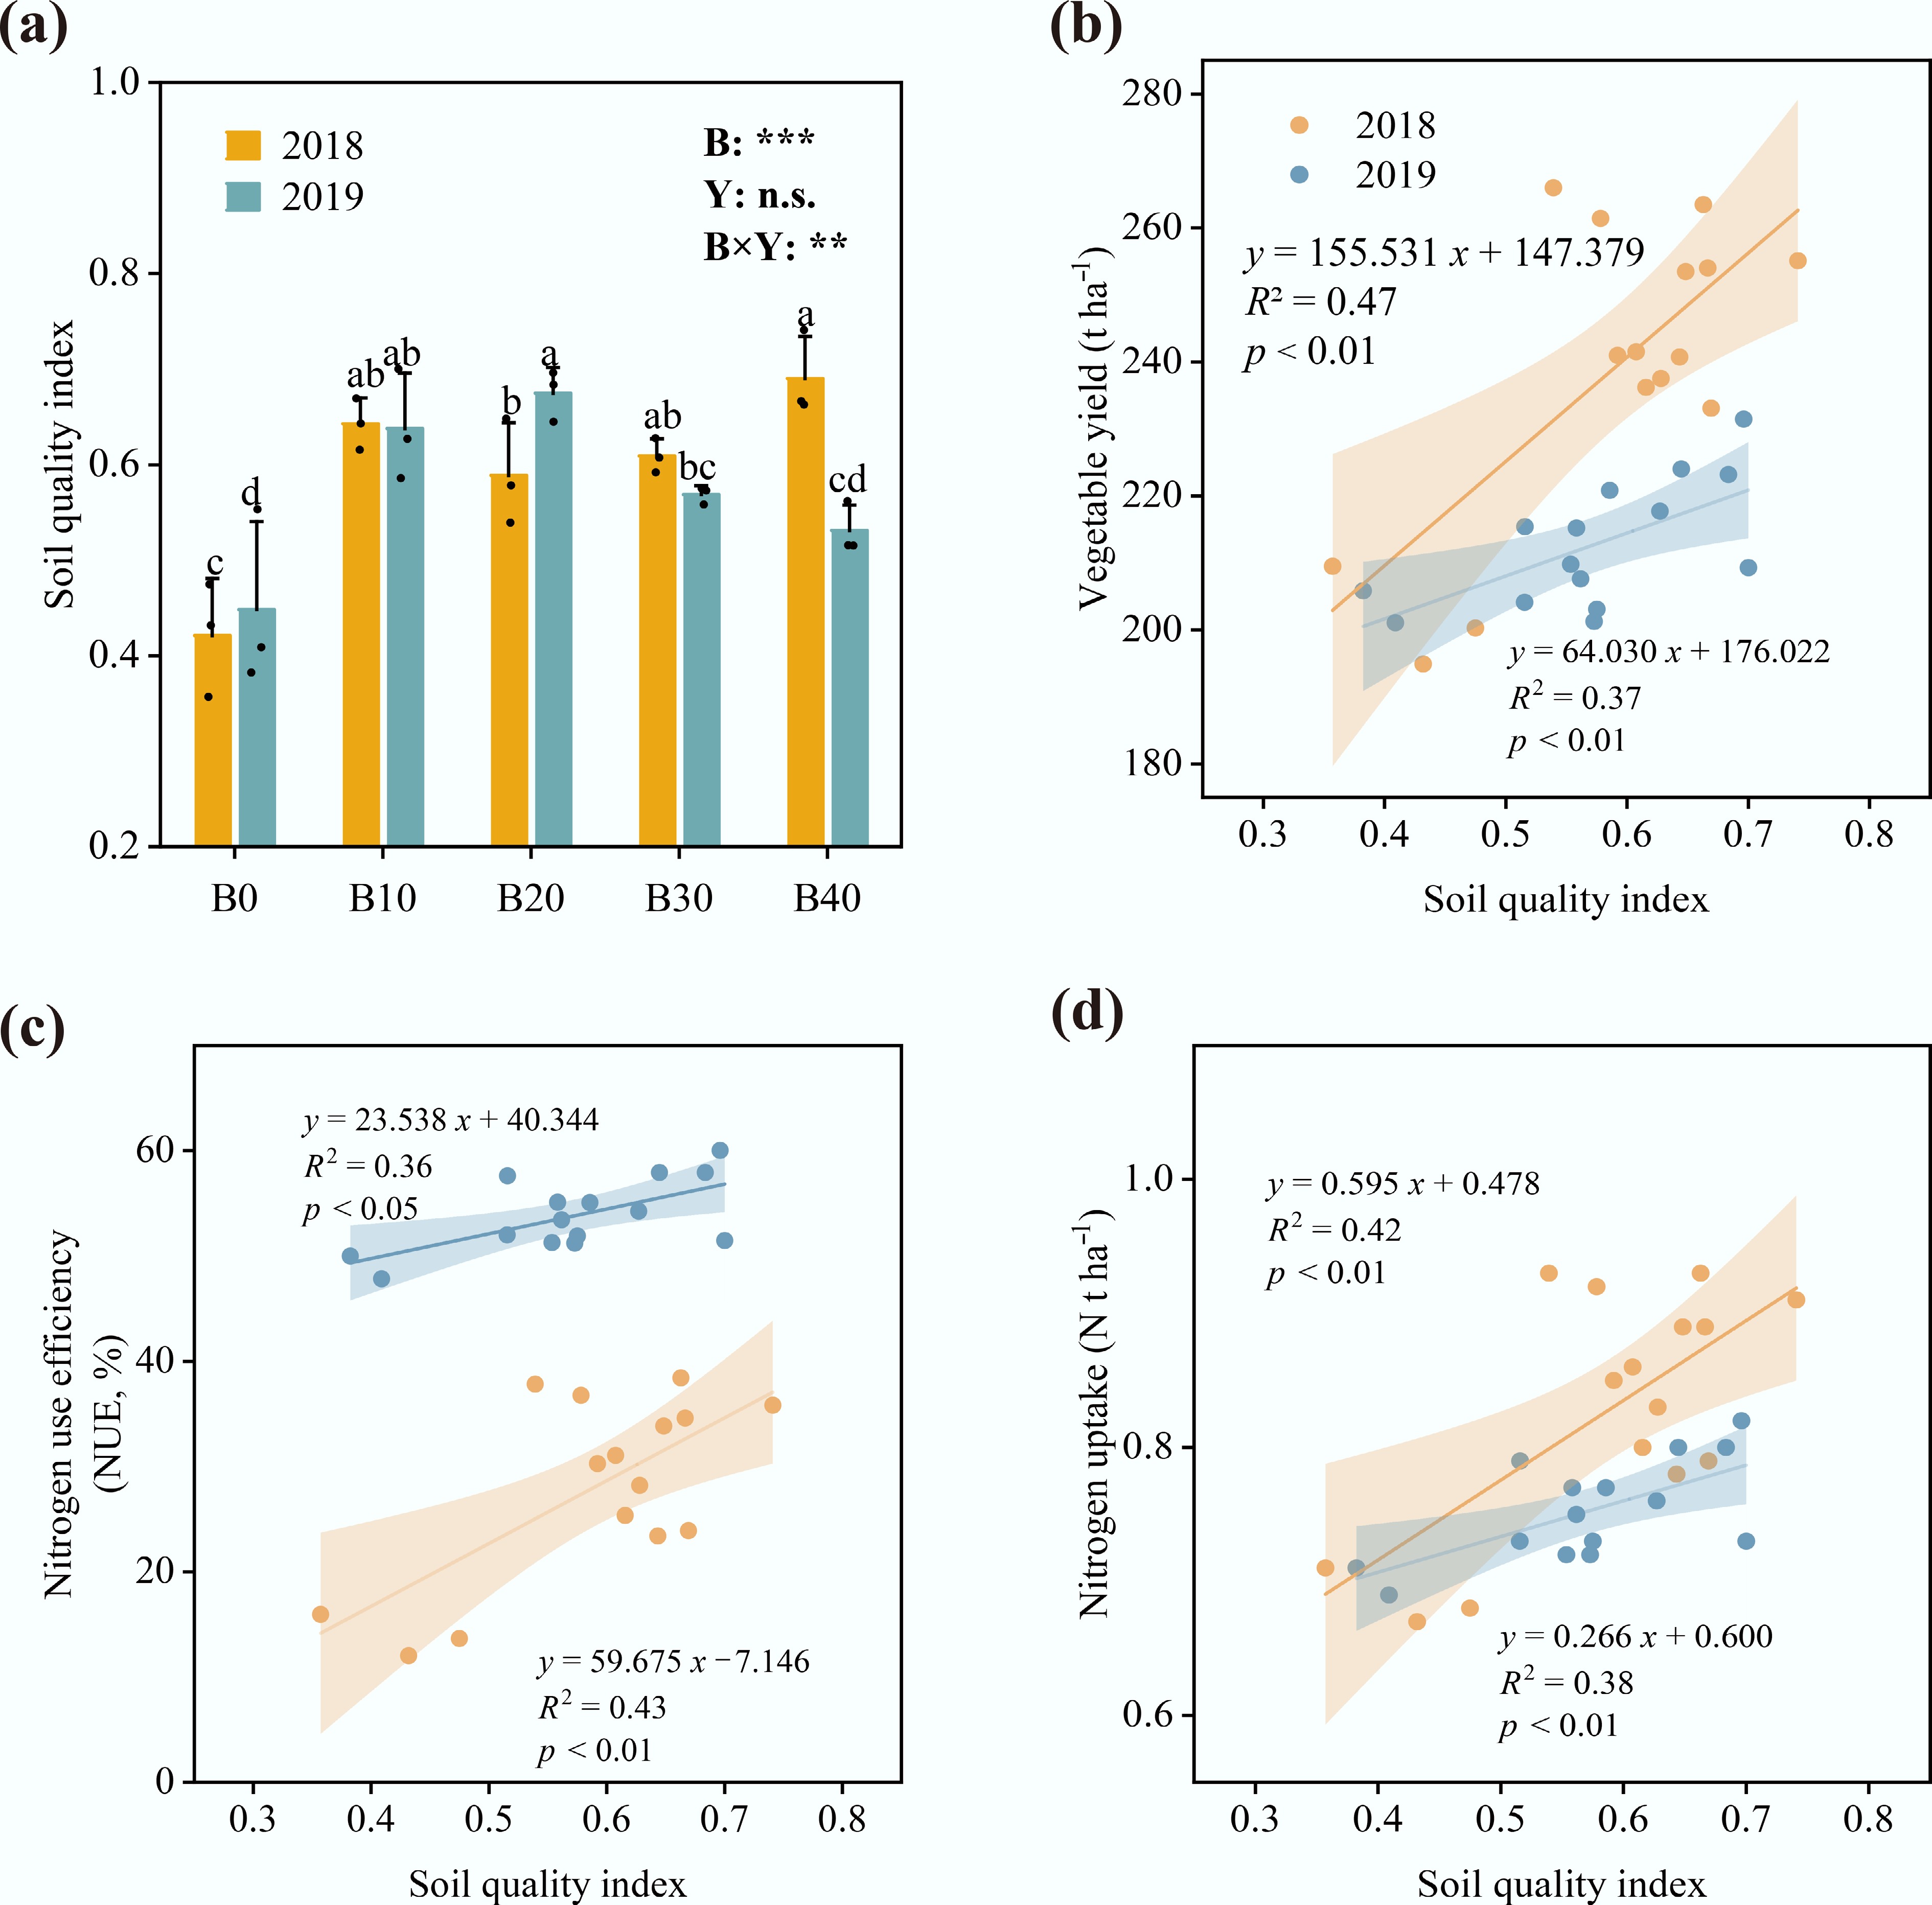
Figure 5.
Effects of different addition rates of biochar on (a) soil quality indices; (b) their linear relationships with vegetable yield; (c) nitrogen use efficiency; and (d) nitrogen uptake from 2018 to 2019. B0, B10, B20, B30, and B40 are treatments with N fertilization and application of 0, 10, 20, 30, and 40 t biochar ha−1, respectively. Different lowercase letters indicate statistically significant differences (p < 0.05) between treatments in the same year. B indicates biochar effect; Y indicates cropping year effect; B × Y indicates interaction effects between biochar and year; ns, not significant; ** p < 0.01; *** p < 0.001. Solid lines and shaded areas indicate linear regression lines and 95% confidence intervals.
-
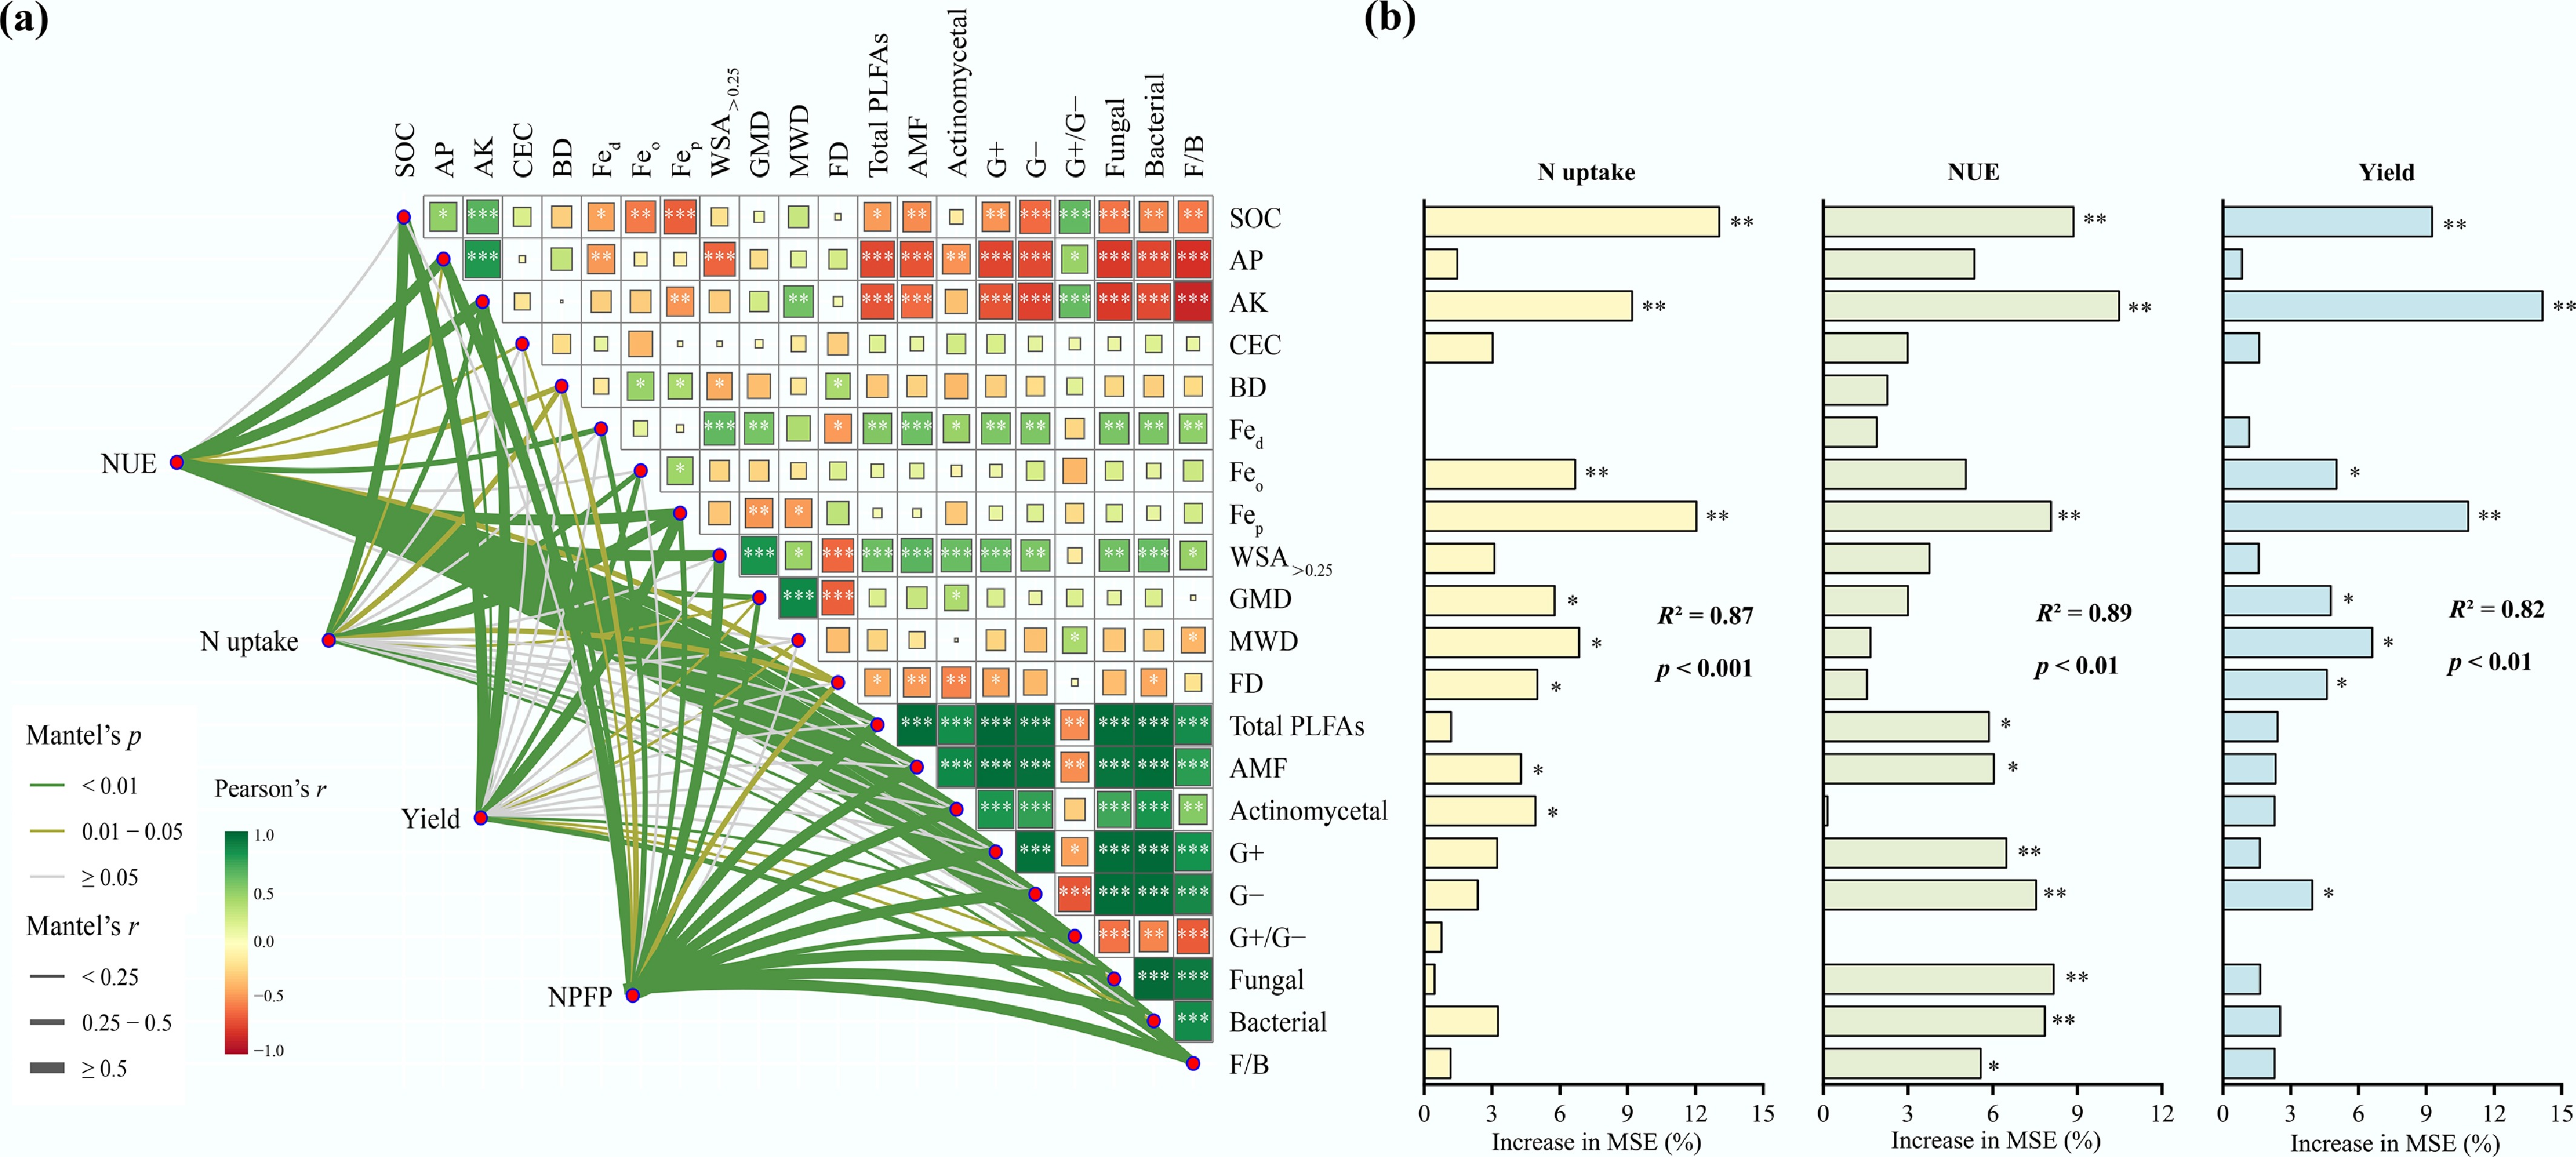
Figure 6.
(a) Mantel test of NUE, N uptake, vegetable yield, and NPFP with environmental factors; (b) Random forest model analysis to determine the primary factors influencing N uptake, NUE, and vegetable yield. Percentage increases in the MSE (mean squared error) of variables were used to estimate the importance of these predictors, where higher MSE% values imply more important predictors. * p < 0.05; ** p < 0.01; *** p < 0.001.
-
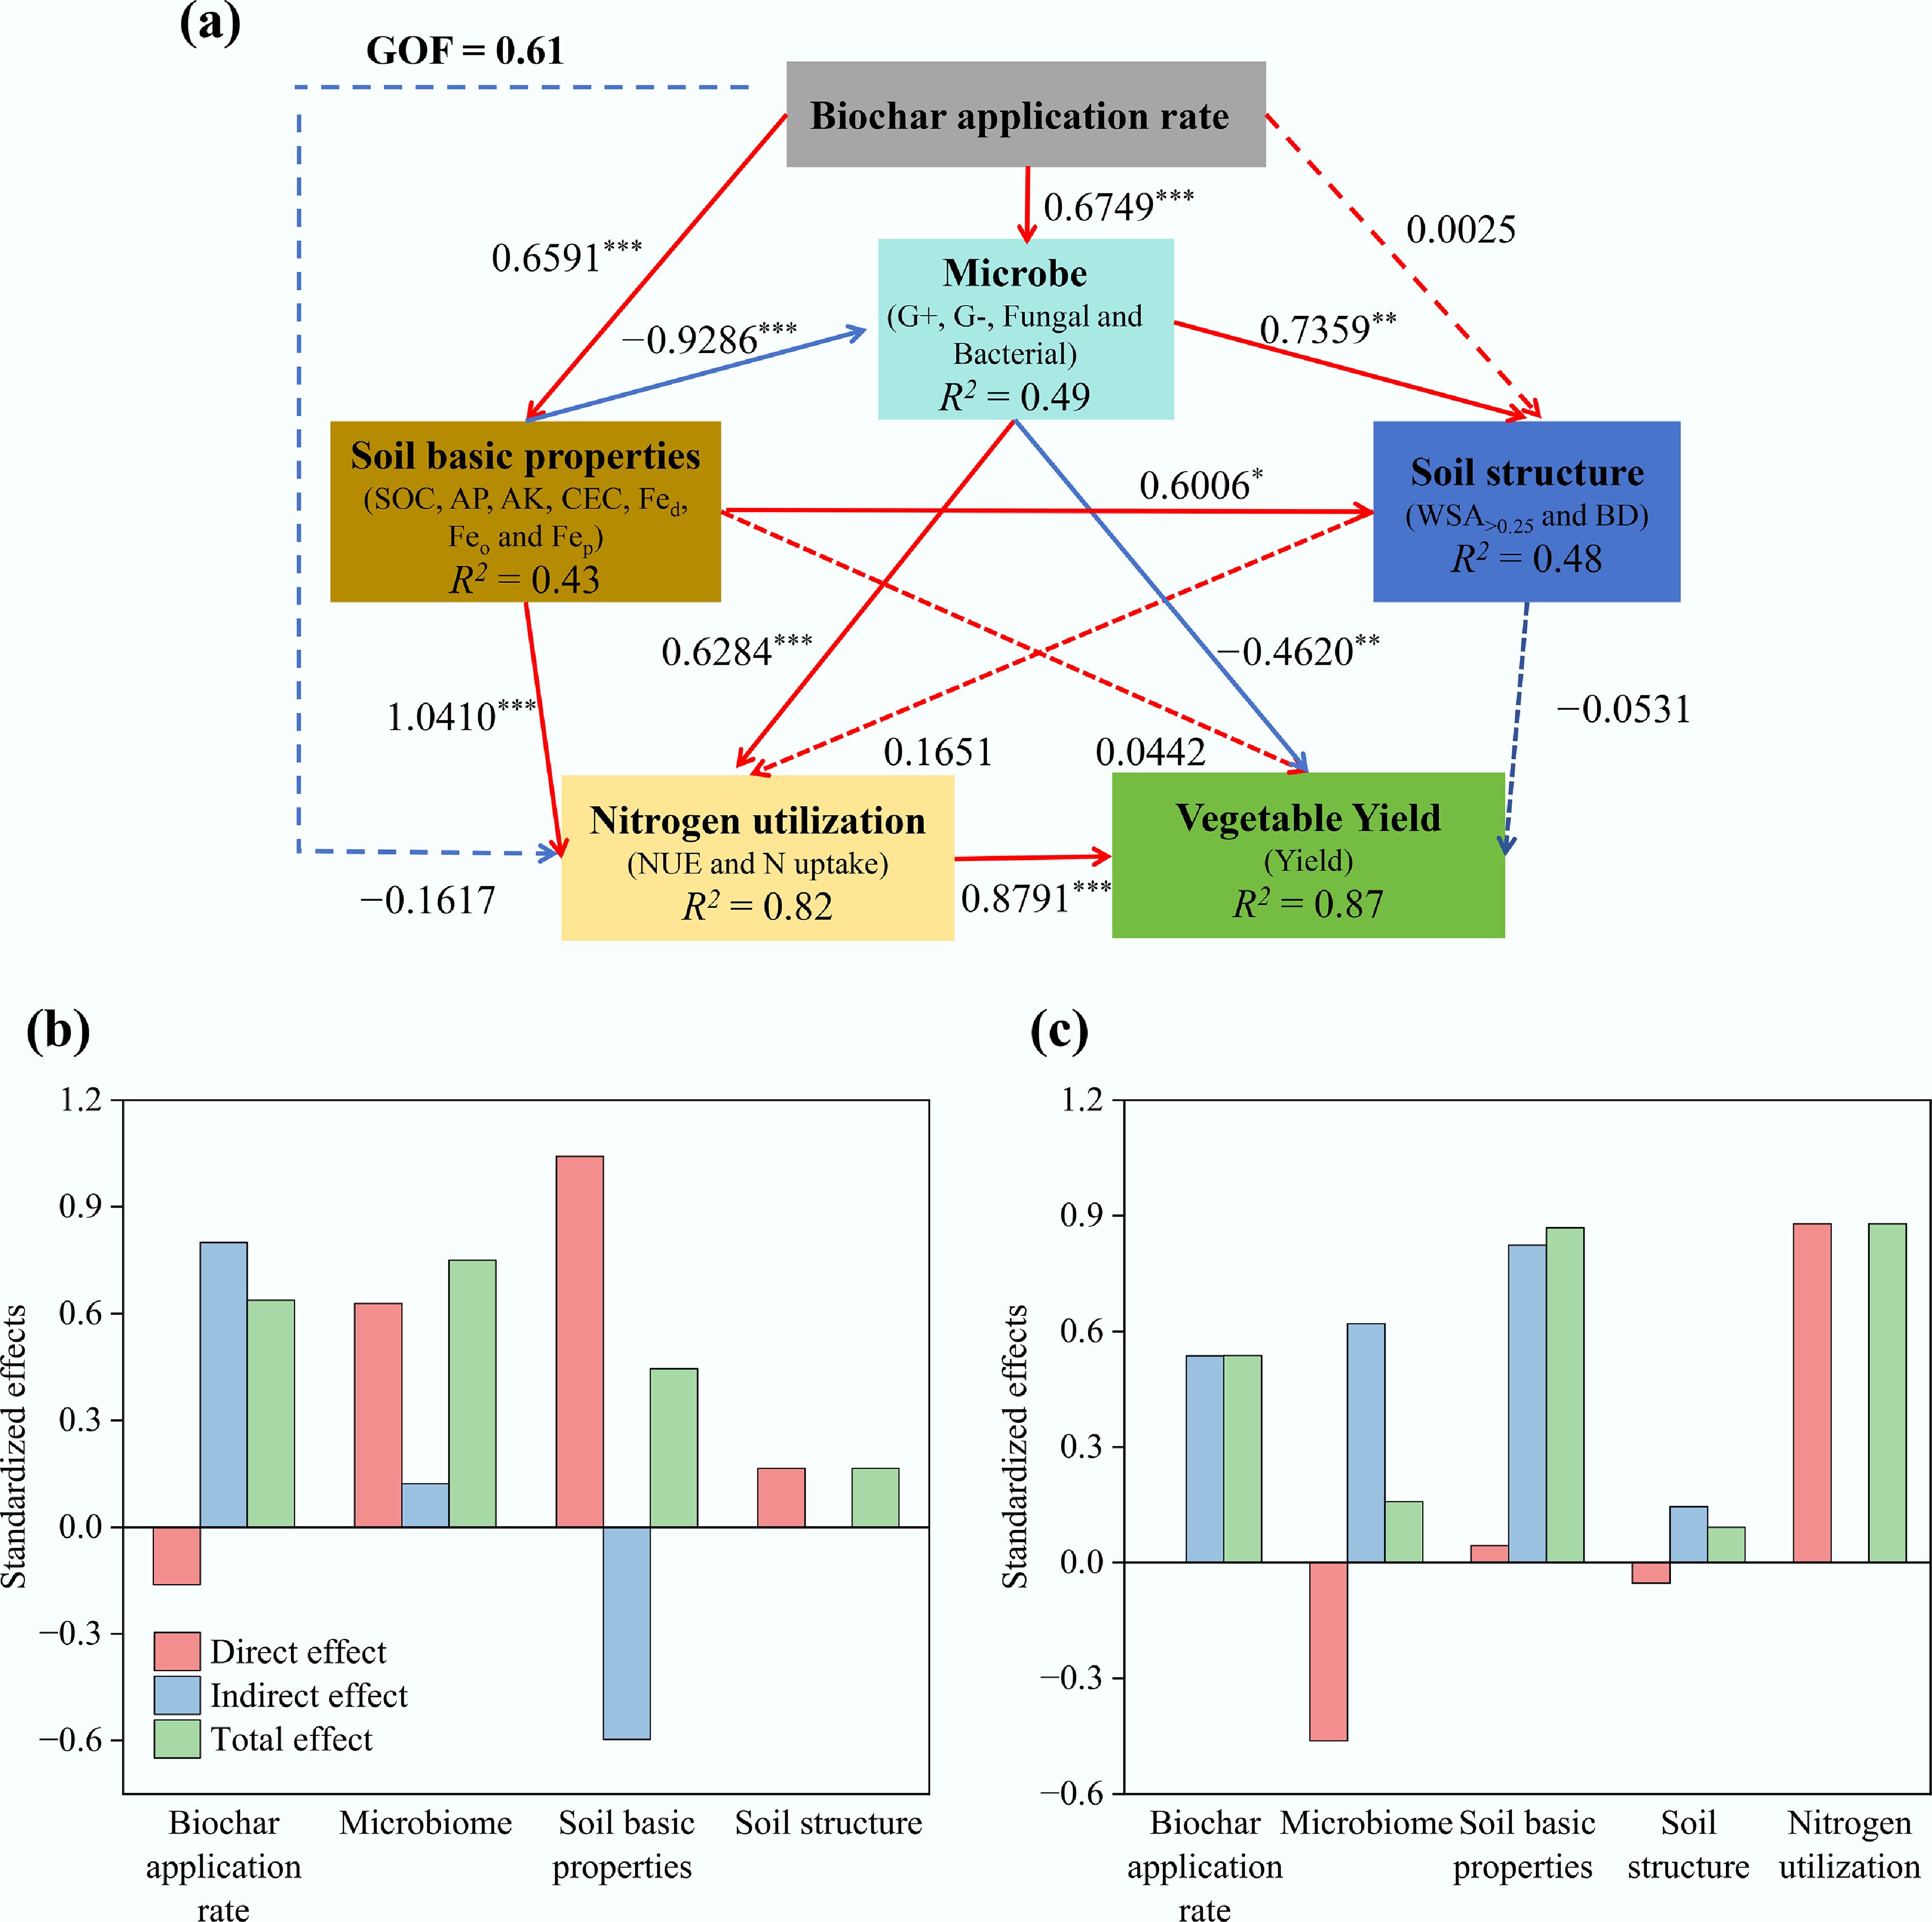
Figure 7.
Partial least squares path model showing the relationships among biochar application rate, soil basic properties, microbiome, soil structure, nitrogen utilization and vegetable yield (a); as well as the standardized effects of these variables on nitrogen utilization (b), and vegetable yield (c). Soil basic properties include the SOC, AP, AK, CEC, Fed, Feo, and Fep. Microbiome includes the G+ bacterial, G− bacterial, Fungal and Bacterial. Soil structure includes the WSA>0.25 and BD. Nitrogen utilization includes the NUE and N uptake. Red and blue arrows indicate significant positive and negative relationships, respectively. Dashed arrows denote nonsignificant relations. The number adjacent to each line represents the standardized path coefficient; *, p < 0.05; **, p < 0.01; ***, p < 0.001.
-
Treatment Year Water-stable aggregate content (%) LMA SMA MIA SC B0 2018 34.08 Bb 39.07 Ba 17.8 Aa 9.05 Aa B10 47.32 Aa 32.35 Bb 16.33 Aa 4 Ab B20 40.01 Aab 41.73 Ba 13.67 Aa 4.59 Ab B30 37.12 Ab 38.6 Ba 17.37 Aa 6.91 Aab B40 37.33 Ab 40.36 Ba 17.99 Ba 4.31 Ab B0 2019 35.58 Aa 42.88 Ac 15.71 Ba 5.83 Ba B10 28.55 Bc 52.95 Aa 15.05 Aa 3.46 Ab B20 36.46 Aa 46.85 Ab 12.11 Ab 4.58 Aab B30 32.18 Ab 46.05 Ab 15.41 Aab 6.35 Aab B40 33.44 Ab 48.19 Ab 12.94 Bab 5.43 Aa Biochar (B) n.s. n.s. * ** Years (Y) *** *** ** n.s. B × Y *** *** n.s. n.s. Note: B0, B10, B20, B30, and B40 are treatments with N fertilization and application of 0, 10, 20, 30, and 40 t biochar ha−1, respectively. Different lowercase letters within each column indicate statistically significant differences (p < 0.05) between treatments in the same year. Different uppercase letters indicate statistically significant differences (p < 0.05) for the same treatment across different years (p < 0.05). B indicates biochar effect; Y indicates cropping year effect; B × Y indicates interaction effects between biochar and year. Large macroaggregates (LMA), > 2 mm; small macroaggregates (SMA), 0.25–2 mm; microaggregates (MIA), 0.053–0.25 mm; and silt and clay (SC), < 0.053 mm. n.s, not significant; * p < 0.05; ** p < 0.01; *** p < 0.001. Table 1.
Soil aggregate size distribution under different application rates of biochar from 2018 to 2019
Figures
(7)
Tables
(1)