













-
Driven by population growth and economic expansion, the vegetable cultivation area in China increased from approximately 3.3 to 23.4 million hectares (ha) from 1978 to 2024, accounting for 13.5% of the total national cropland[1]. Vegetable cultivation typically adopts intensive practices to obtain high yields, as evidenced by substantial fertilizer inputs and the practice of growing multiple crops per year[2]. In addition, vegetable production in China was reported to consume 25% of the nation's nitrogen (N) fertilizer, with N fertilizer application reaching 364 kg N ha−1 for each vegetable season[3]. This rate is twice as high as the N amount applied to grain crops and far exceeds the actual N requirements for vegetable growth[3,4]. However, the excessive application of fertilizers not only fails to increase vegetable yields but may also lead to reduced N use efficiency (NUE), diminished profits, and environmental N pollution[5]. Therefore, achieving sustainable development of intensive vegetable production in China calls for the urgent adoption of innovative technologies and sustainable management practices.
Biochar has been widely acknowledged for improving soil quality, optimizing NUE, and supporting sustainable crop production[6,7]. Because of its capacity for nutrient retention, biochar is commonly co-applied with N fertilizer in agricultural cropping systems. Recent studies suggested that the effect of biochar combined with N fertilizer in cropping systems depends on soil types, biochar application rate, and biochar types[8,9]. For example, biochar substantially enhanced nutrient retention and crop yields on sandy or acidic soils, but it showed minimal effect on fertile soils high in organic matter[10]. At present, most studies have demonstrated that biochar can enhance crop yields by promoting soil quality, increasing soil aggregate stability, increasing water-holding capacity, and regulating microbial properties[5,11], whereby crop yields increase with higher application rates of biochar[9,12]. However, this influence is not always linear, and its effects also have uncertainties. In a rice-wheat rotation trial, both 20 and 40 t ha−1 biochar enhanced crop yield by enhancing soil aggregate stability and NUE, with no significant difference observed across the two application rates[13]. Furthermore, over-supply of biochar (> 40 t ha−1) has been reported to suppress the NUE and yield of tomato as well as farmers' net benefit[14]. Therefore, the appropriate biochar application rate is crucial for increasing crop yields and NUE within specific agricultural systems.
Soil quality index (SQI) is an important indicator assessed by integrating a series of physical, chemical, and biological soil parameters, which measures the soil's ability to maintain ecological balance, soil health, and productivity[15]. Soil quality plays a key role in increasing crop yields and reducing nitrogen fertilizer use[16]. Although there is currently a large body of research on how biochar affects the SQI, these studies often rely on subjective screening to select the minimum dataset (MDS)[15,17], which may result in the exclusion of some core indicators or a reduction in the accuracy of the assessment. Additionally, in China, most previous studies on biochar application for soil quality improvement and yield-efficiency enhancement have focused on the Yangtze River Delta Plain and the North China Plain[5,18]. Few studies have examined red soil (Ultisols) under humid tropical and subtropical climates, such as those in Southern China, where problems such as soil acidification, low nutrient retention capacity, and productivity decline are becoming increasingly severe[19]. Under intensive vegetable cultivation, these soils are particularly vulnerable to degradation due to high-intensity farming practices and excessive input of N fertilizer[20,21]. Soil microbial community structure in intensive vegetable farming systems under severe acid soil stress may differ from that in other regions[22], leading to differences in N transformation. Consequently, in-depth research into the effects of biochar on the quality of red soil is crucial for optimizing its agricultural application rates and promoting increased vegetable yields and NUE.
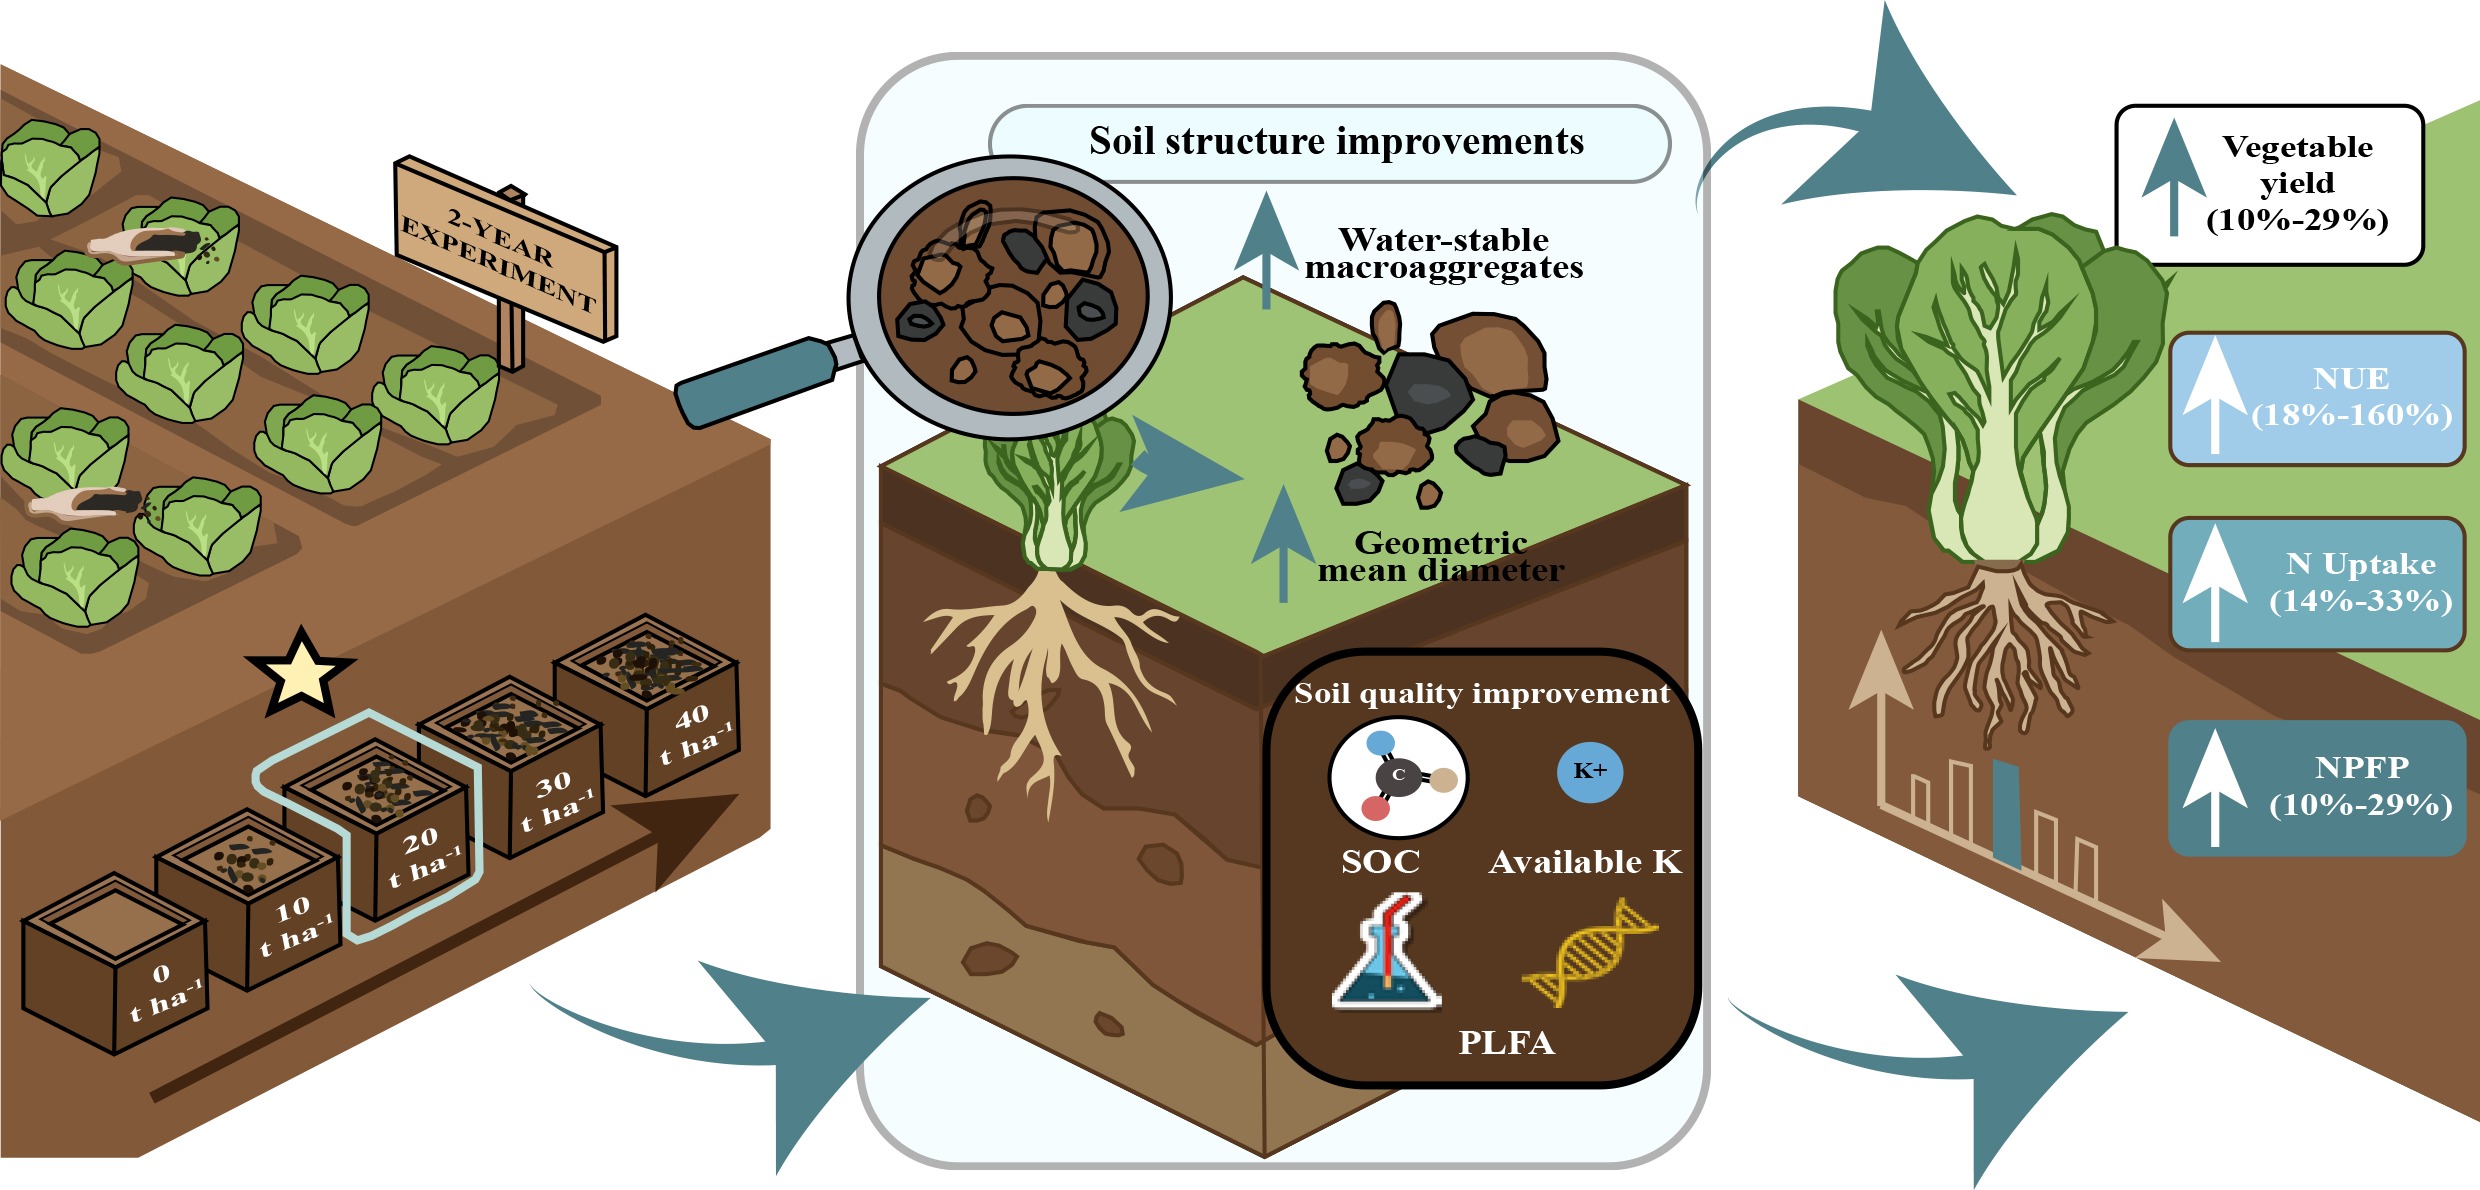
Therefore, a 2-year field experiment was conducted in an intensively managed vegetable field in Southern China to evaluate the impacts of different biochar application rates on soil properties, soil microbial community, vegetable yield, and NUE. Additionally, 21 physicochemical and biological soil properties were comprehensively assessed, and SQI was calculated separately for each year of the 2-year field experiment to evaluate the overall effect of biochar application on soil quality in intensive vegetable fields in Southern China. Overall, the aims of this study are to find the optimal biochar application rate for intensive vegetable cultivation by comparing the yield, N uptake, and NUE; and to elucidate the relationship between SQI, vegetable yield, and NUE, and explore the main driving parameters, including various soil properties. We hypothesized that: (1) optimal biochar application rates can continuously improve soil physicochemical properties and enhance soil microbial activity; and that (2) biochar primarily improves soil N utilization and increases vegetable yields by altering key indicators of soil quality.
-
A 2-year field experiment was conducted in an intensive vegetable field at the Teaching and Research Bases of South China Agricultural University, located in Guangdong Province, China (23°17′ N, 113°37′ E), from 2018 to 2020. The climate is a typical subtropical maritime monsoon with an average annual temperature of 22.5 °C and an average annual rainfall of 1,517 mm. The soils at the site belong to Ultisols, with a texture of loamy clay containing 26% clay, 34% silt, and 41% sand. The basic properties of the soil in the 0-15 cm topsoil layer are as follows: pH 5.13, soil organic carbon (SOC) 17.2 g kg−1, total nitrogen (TN) 1.28 g kg−1, cation exchange capacity (CEC) 9.96 cmol kg−1, and bulk density (BD) 1.15 g cm−3.
During the fieldwork, Indian lettuce (Lactuca sativa L. var. longifolia) and Asparagus lettuce (Lactuca sativa L. var. augustana) were used as the test vegetable crops. Fertilizers included conventional urea, CO(NH2)2, to supply N; calcium superphosphate, Ca(H2PO4)2·H2O, to provide phosphorus (P); and potassium sulphate, K2SO4, to supply potassium (K) and sulfur (S).
Biochar was produced from rice straw by pyrolysis at 500 °C and was procured from Liaoning Golden Future Agriculture Technology Co., Ltd. The basic properties of the biochar included a pH of 9.5, CEC of 26 cmol kg−1, TN of 1.9 g kg−1, total C (TC) of 506 g kg−1, ammonium (NH4+) of 2.5 mg N kg−1, nitrate (NO3−) of 2.2 mg N kg−1, and ash content of 9.6%.
Experimental design and field management
-
A 2-year field experiment was conducted, including four vegetable seasons with multiple harvests. A short fallow period of 1–2 months separated the two cropping seasons. A randomized complete block design was used in the experiment, with five treatments: (1) control without biochar amendment (B0); (2) 10 t ha−1 biochar (B10); (3) 20 t ha−1 biochar (B20); (4) 30 t ha−1 biochar (B30); and (5) 40 t ha−1 biochar (B40). Urea N fertilizer was applied to each treatment at rates according to local standards (average annual 875 kg N ha−1 yr−1). Each treatment had three replications, resulting in 15 plots; each plot covered an area of 17.5 m2 (7.0 × 2.5 m). Biochar was applied in 2018, 1 week prior to the initial vegetable planting. Specifically, biochar was applied in a single application to each plot and then thoroughly incorporated into the topsoil (0–20 cm) by ploughing. The N fertilizer application rates (basal and topdressing) for each vegetable crop and basic farm management procedures are shown in Supplementary Table S1.
Soil sampling and analysis
-
Following the final harvest each year (March 1, 2019, and February 28, 2020), five soil samples were collected from each plot using a soil corer of 2 cm in diameter. After passing the soil samples through a 2 mm sieve to remove rock fragments and plant debris, they were combined into a single sample for subsequent soil property analysis. Determination of soil chemical properties was performed according to previously described protocol[23]. In brief, soil pH was determined using a soil-water mixture in a ratio of 1:2.5; TN and soil organic carbon (SOC) were analyzed by the semi-trace Kjeldahl N determination method and the wet-digestion method, respectively; NH4+ and NO3− were extracted using 2 M KCl and measured using a continuous flow analyzer (Alliance, Future, France); available phosphorus (AP) was assayed by the molybdenum-antimony anti-spectrophotometric method after extraction with 0.5 M NaHCO3; available potassium (AK) was extracted with a solution of 1 M NH4OAc and analyzed using flame atomic absorption spectrometry (FP6431, Shanghai, China); CEC was analyzed using the BaCl2 compulsive exchange method; and BD was determined using a ring cutter (100 cm3). The interannual trends in soil pH, TN, NO3−, and NH4+ concentrations are shown in Supplementary Fig. S1. Additionally, complexed iron (Fep), amorphous iron oxide (Feo), and free iron oxide (Fed) from soil samples were determined via sodium pyrophosphate, ammonium oxalate-oxalic acid, and dithionite-citrate-bicarbonate (DCB), respectively[24].
Soil aggregate size distribution was assessed by a wet-sieving method as described previously[25]. Briefly, a 50 g air-dried soil sample was placed on sieve sets with mesh apertures of 0.053, 0.25, and 2 mm, and then soaked in distilled water in a settling cylinder for 5 min. Following this, the sample was vibrated at an amplitude of 5 mm, 30 times per min, for 5 min. After sieving, four different size fractions of aggregates were obtained: silt and clay (SC, < 0.053 mm), microaggregates (MIA, 0.053–0.25 mm), small macroaggregates (SMA, 0.25–2 mm), and large macroaggregates (LMA, > 2 mm). Aggregate stability was evaluated by calculating the proportion of water-stable macroaggregates (WSA>0.25, %), mean weight diameter (MWD, mm), geometric mean diameter (GMD, mm), and fractal dimension (FD) using the following formula:
$ WSA_{ \gt 0.25}=\frac{M_{ \gt 0.25}}{M\mathit{ }}\times100\text{%} $ (1) where WSA>0.25 is the proportion of water-stable macroaggregates (%); M>0.25 is the mass of aggregates > 0.25 mm (g); and M is the mass of the total aggregate (g):
$ \textit{MWD}=\sum \limits_{{}_{\textit{i}}}^{\textit{n}}{\textit{x}}_{\textit{i}}{\textit{w}}_{\textit{i}}\Bigg/\sum \limits_{{}_{\textit{i}}}^{\textit{n}}{\textit{w}}_{\textit{i}} $ (2) $ GMD=\exp \left(\sum \limits_{\textit{i}}^{\textit{n}}{w}_{\textit{i}}\ln\; {\textit{x}}_{\textit{i}}\Bigg/\sum \limits_{{}_{\textit{i}}}^{\textit{n}}{w}_{\textit{i}}\right) $ (3) $ (3-FD)l\text{og}({x}_{i}/{x}_{\max })=l\text{og}(W(\delta \leq {x}_{i})/W) $ (4) where xi denotes the average diameter of the four aggregate size fractions (mm); wi represents the percentage content of water-stable aggregates of each particle size (%); xmax represents the maximum average particle size of aggregates; W denotes the sum of the weights of soil particles of all sizes; and W (δ ≤ xi) refers to the sum of the weights of soil particles whose size is ≤ xi.
PLFA analysis
-
According to the research by Zelles et al.[26], 8.0 g of freeze-dried soil that passed through a 2 mm sieve was extracted twice using phosphate buffer/methanol/chloroform (v/v/v = 0.8/2/1). The phospholipids were separated from glycolipids and neutral lipids using silica acid columns (ANPEL Laboratory Technologies Inc., Shanghai, China). Different types of PLFAs were separated and identified using an Agilent 7890A gas chromatograph equipped with the Sherlock microbial identification system (v6.2, MIDI, Newark, Delaware, USA). Before derivatization, methyl nonanoate (19:0) was used as the internal standard to quantitatively measure phospholipid concentration. The specific PLFA biomarkers for different microbial groups are shown in Supplementary Table S2. The sum of G+ and G- bacteria was calculated and expressed as total bacterial biomass. Two ratios were also calculated: G+ bacteria to G- bacteria (G+: G-) and fungi to bacteria (F: B).
Calculation of soil quality index
-
To comprehensively assess the impact of different biochar treatments on soil quality, a Total Data Set (TDS) comprising 21 soil physical (BD, WSA>0.25, MWD), chemical (pH, TN, NH4+-N, NO3−-N, SOC, AP, AK, CEC, Fed, Feo, Fep), and biological indicators (Total PLFAs, AMF, Actinomycetal, G+ bacterial, G- bacterial, Fungal, Bacterial) was established[27,28]. First, we utilized standard linear scoring functions to convert empirical measurements into dimensionless scores ranging from 0 to 1[29]. Variables were categorized into 'more is better' and 'less is better' functions based on their contribution to soil quality. For 'more is better' indicators (e.g., SOC, available nutrients, microbial biomass),
$ {\textit{S}}_{i}=({X}_{i}-{X}_{\min })/({X}_{\max }-{X}_{\min }) $ (5) For 'less is better' indicators (e.g., BD),
$ {\textit{S}}_{i}=({X}_{\max }-{X}_{i})/({X}_{\max }-{X}_{\min }) $ (6) where Si is the indicator score, Xi is the measured value, and Xmin and Xmax are the minimum and maximum values observed across the dataset, respectively. Soil pH was scored as 'more is better' to reflect the benefits of alleviating acidity in this study region. To determine each indicator's contribution to the variability of the overall SQI, a principal component analysis (PCA) was performed on the entire dataset (Supplementary Table S3). The first four principal components (PCs) were selected based on the eigenvalues > 1, which accounted for more than 80% of the variation and could reflect most of the variation between soil indicators. The SQI was then calculated using a weighted additive approach[30]:
$ S\textit{Q}I=\sum \limits_{i=1}^{n}({S}_{i}\times {W}_{i}) $ (7) where Si and Wi are the score and weight of the ith indicator, respectively. A higher SQI value indicates superior soil quality status.
Plant sampling and analysis
-
Vegetable yield was measured by weighing the fresh weight of all above-ground vegetable samples in each plot after each harvest. Nitrogen concentration was determined by the Kjeldahl method for dried samples[31]. Nitrogen uptake by plants (N t ha−1), N use efficiency (NUE, %), and N partial factor productivity (NPFP, kg kg−1) were calculated as:
$ Nitrogen\;uptake={N}_{plant}\times Y\times {10}^{-3} $ (8) $ NUE=\left({N}_{\textit{plant}}-{\textit{N}}_{0}\right)/{N}_{\textit{input}}\times 100{\text{%}} $ (9) $ NPFP=Y\textit{ield}/{N}_{input} $ (10) where Nplant is the vegetable N concentration with N fertilization (g kg−1), N0 is the vegetable N concentration without N fertilization (g kg−1), Ninput is the N fertilizer input, and Yield is the vegetable yield (t ha−1). More details about the N0 treatment are specifically described in Chen et al.[32].
Statistical analysis
-
All statistical analyses were conducted using R 4.4.1 software. One-way analysis of variance (ANOVA) with Duncan's multiple range test was used to analyze the differences between the various treatments within the same year (p < 0.05). Two-way ANOVA with Duncan's multiple range test was used to examine the interaction between biochar (B) and cropping year (Y). A linear regression model was used to test the relationship between biochar application rates and vegetable yield, NUE, N uptake, and NPFP, as well as the relationship between SQI and vegetable yield, NUE, and N uptake. The Mantel test was conducted using the 'linkET' R package to investigate the effects of soil physicochemical properties, aggregate stability, and microbial communities on NUE, N uptake, vegetable yield, and NPFP. Random forest models were run using the 'randomForest' R package to further identify the main predictors affecting NUE, N uptake, vegetable yield, and SQI. Moreover, using the 'plspm' R package, we used partial least squares path modeling (PLS-PM) to identify the potential relations between biochar application rate, soil basic properties, microbiome, soil structure, nitrogen utilization, and vegetable yield.
-
The two-way ANOVA results showed that soil physicochemical properties strongly depended on the biochar incorporation, cropping year, and their interaction (Fig. 1). Specifically, the SOC content in the B30 treatment was significantly higher than that in the B0 treatment in 2018, but showed no significant difference compared with other biochar treatments (Fig. 1a). In addition, compared with the B0 treatment, the B20 treatment significantly decreased AP content by 25% in 2018, and by 9% in 2019 (Fig. 1b, p < 0.05). In 2018, biochar application increased AK content, and the B40 treatment was significantly greater than the B0 treatment (Fig. 1c, p < 0.05). Biochar addition resulted in significant reductions in BD and Feo of 1%–7% and 0.3%–8%, respectively (Fig. 1e, g, p < 0.05). Moreover, the B20 treatment increased soil Fed content while reducing soil Fep content in both years (Fig. 1f, h).
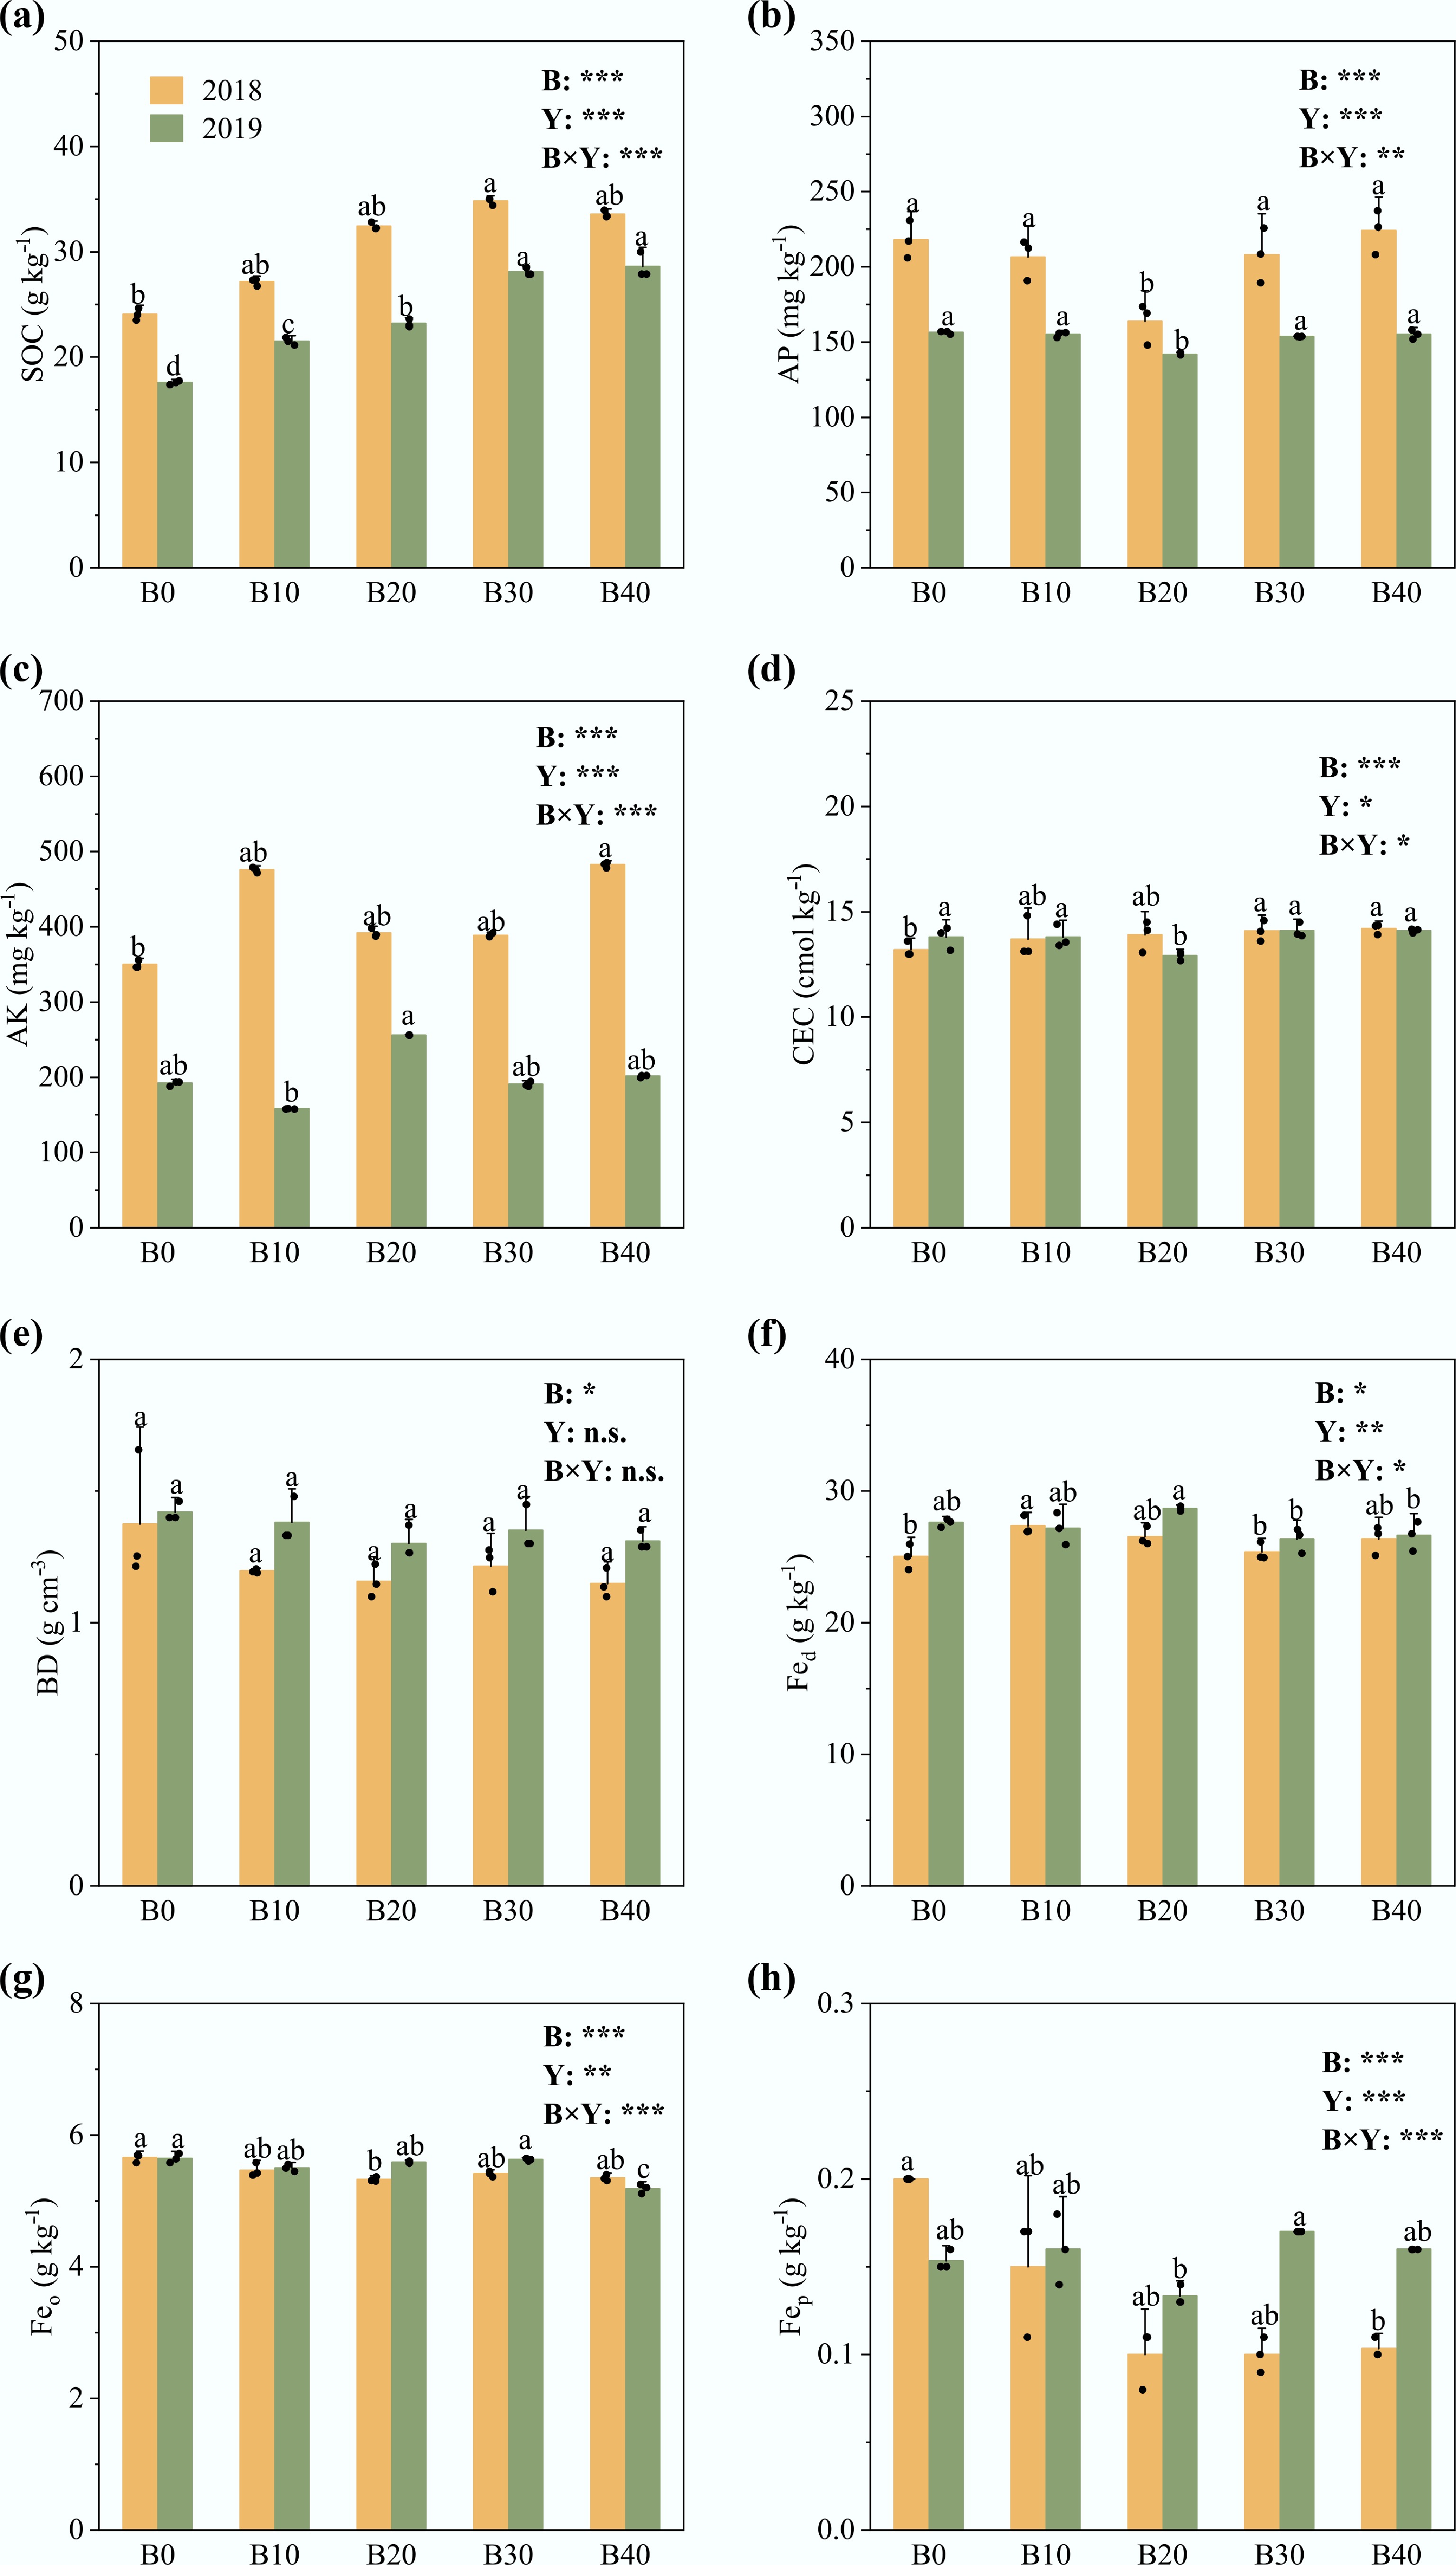
Figure 1.
Effects of different application rates of biochar on soil physicochemical properties in 2018 to 2019: (a) SOC, soil organic carbon; (b) AP, soil available phosphorus; (c) AK, soil available potassium; (d) CEC, cation exchange capacity; (e) BD, bulk density; (f) Fed, free iron oxide; (g) Feo, amorphous iron oxide; (h) Fep, complexed iron. Error bars indicate standard deviations (n = 3). B0, B10, B20, B30, and B40 are treatments with N fertilization and application of 0, 10, 20, 30, and 40 t biochar ha−1, respectively. Different lowercase letters indicate statistically significant differences (p < 0.05) between treatments in the same year. B indicates biochar effect; Y indicates cropping year effect; B × Y indicates interaction effects between biochar and year; ns, not significant; * p < 0.05; ** p < 0.01; *** p < 0.001. The SOC and BD for 2019 and the CEC for 2018 were redrawn from Liu et al.[58] and Li et al.[60], respectively.
Soil aggregate size distribution and stability
-
During the 2-year fieldwork, biochar changed the water-stable aggregate size and structural stability (Table 1; Fig. 2). Specifically, LMA and SMA were the most prevalent, constituting 28%–40% and 32%–52% of all aggregates, respectively, followed by MIA, with a mean value of 15% (Table 1). SC represented the smallest proportion with a mean value of 5%. Similar values of LMA, SMA, MIA, and SC were observed across the 2 years for each biochar treatment, but the SMA content in 2019 was significantly higher than that in 2018 (p < 0.05). Two-way ANOVA analysis showed significant effects of biochar on WSA>0.25, MWD, GMD, and FD, but with a significant B × Y interaction for MWD (Fig. 2). Compared with B0, all biochar treatments except B30 significantly increased WSA>0.25 content, with B20 showing the highest increase by 11% and 6% in 2018 and 2019, respectively. In addition, the values of GMD and MWD for B20 in 2019 were significantly higher than those of all other treatments (p < 0.05). In contrast, the application of biochar reduced the FD value to some extent in both years. These results demonstrated that biochar application increased soil water-stable macroaggregates and had a positive role in the stability of soil aggregate structure.
Table 1. Soil aggregate size distribution under different application rates of biochar from 2018 to 2019
Treatment Year Water-stable aggregate content (%) LMA SMA MIA SC B0 2018 34.08 Bb 39.07 Ba 17.8 Aa 9.05 Aa B10 47.32 Aa 32.35 Bb 16.33 Aa 4 Ab B20 40.01 Aab 41.73 Ba 13.67 Aa 4.59 Ab B30 37.12 Ab 38.6 Ba 17.37 Aa 6.91 Aab B40 37.33 Ab 40.36 Ba 17.99 Ba 4.31 Ab B0 2019 35.58 Aa 42.88 Ac 15.71 Ba 5.83 Ba B10 28.55 Bc 52.95 Aa 15.05 Aa 3.46 Ab B20 36.46 Aa 46.85 Ab 12.11 Ab 4.58 Aab B30 32.18 Ab 46.05 Ab 15.41 Aab 6.35 Aab B40 33.44 Ab 48.19 Ab 12.94 Bab 5.43 Aa Biochar (B) n.s. n.s. * ** Years (Y) *** *** ** n.s. B × Y *** *** n.s. n.s. Note: B0, B10, B20, B30, and B40 are treatments with N fertilization and application of 0, 10, 20, 30, and 40 t biochar ha−1, respectively. Different lowercase letters within each column indicate statistically significant differences (p < 0.05) between treatments in the same year. Different uppercase letters indicate statistically significant differences (p < 0.05) for the same treatment across different years (p < 0.05). B indicates biochar effect; Y indicates cropping year effect; B × Y indicates interaction effects between biochar and year. Large macroaggregates (LMA), > 2 mm; small macroaggregates (SMA), 0.25–2 mm; microaggregates (MIA), 0.053–0.25 mm; and silt and clay (SC), < 0.053 mm. n.s, not significant; * p < 0.05; ** p < 0.01; *** p < 0.001. 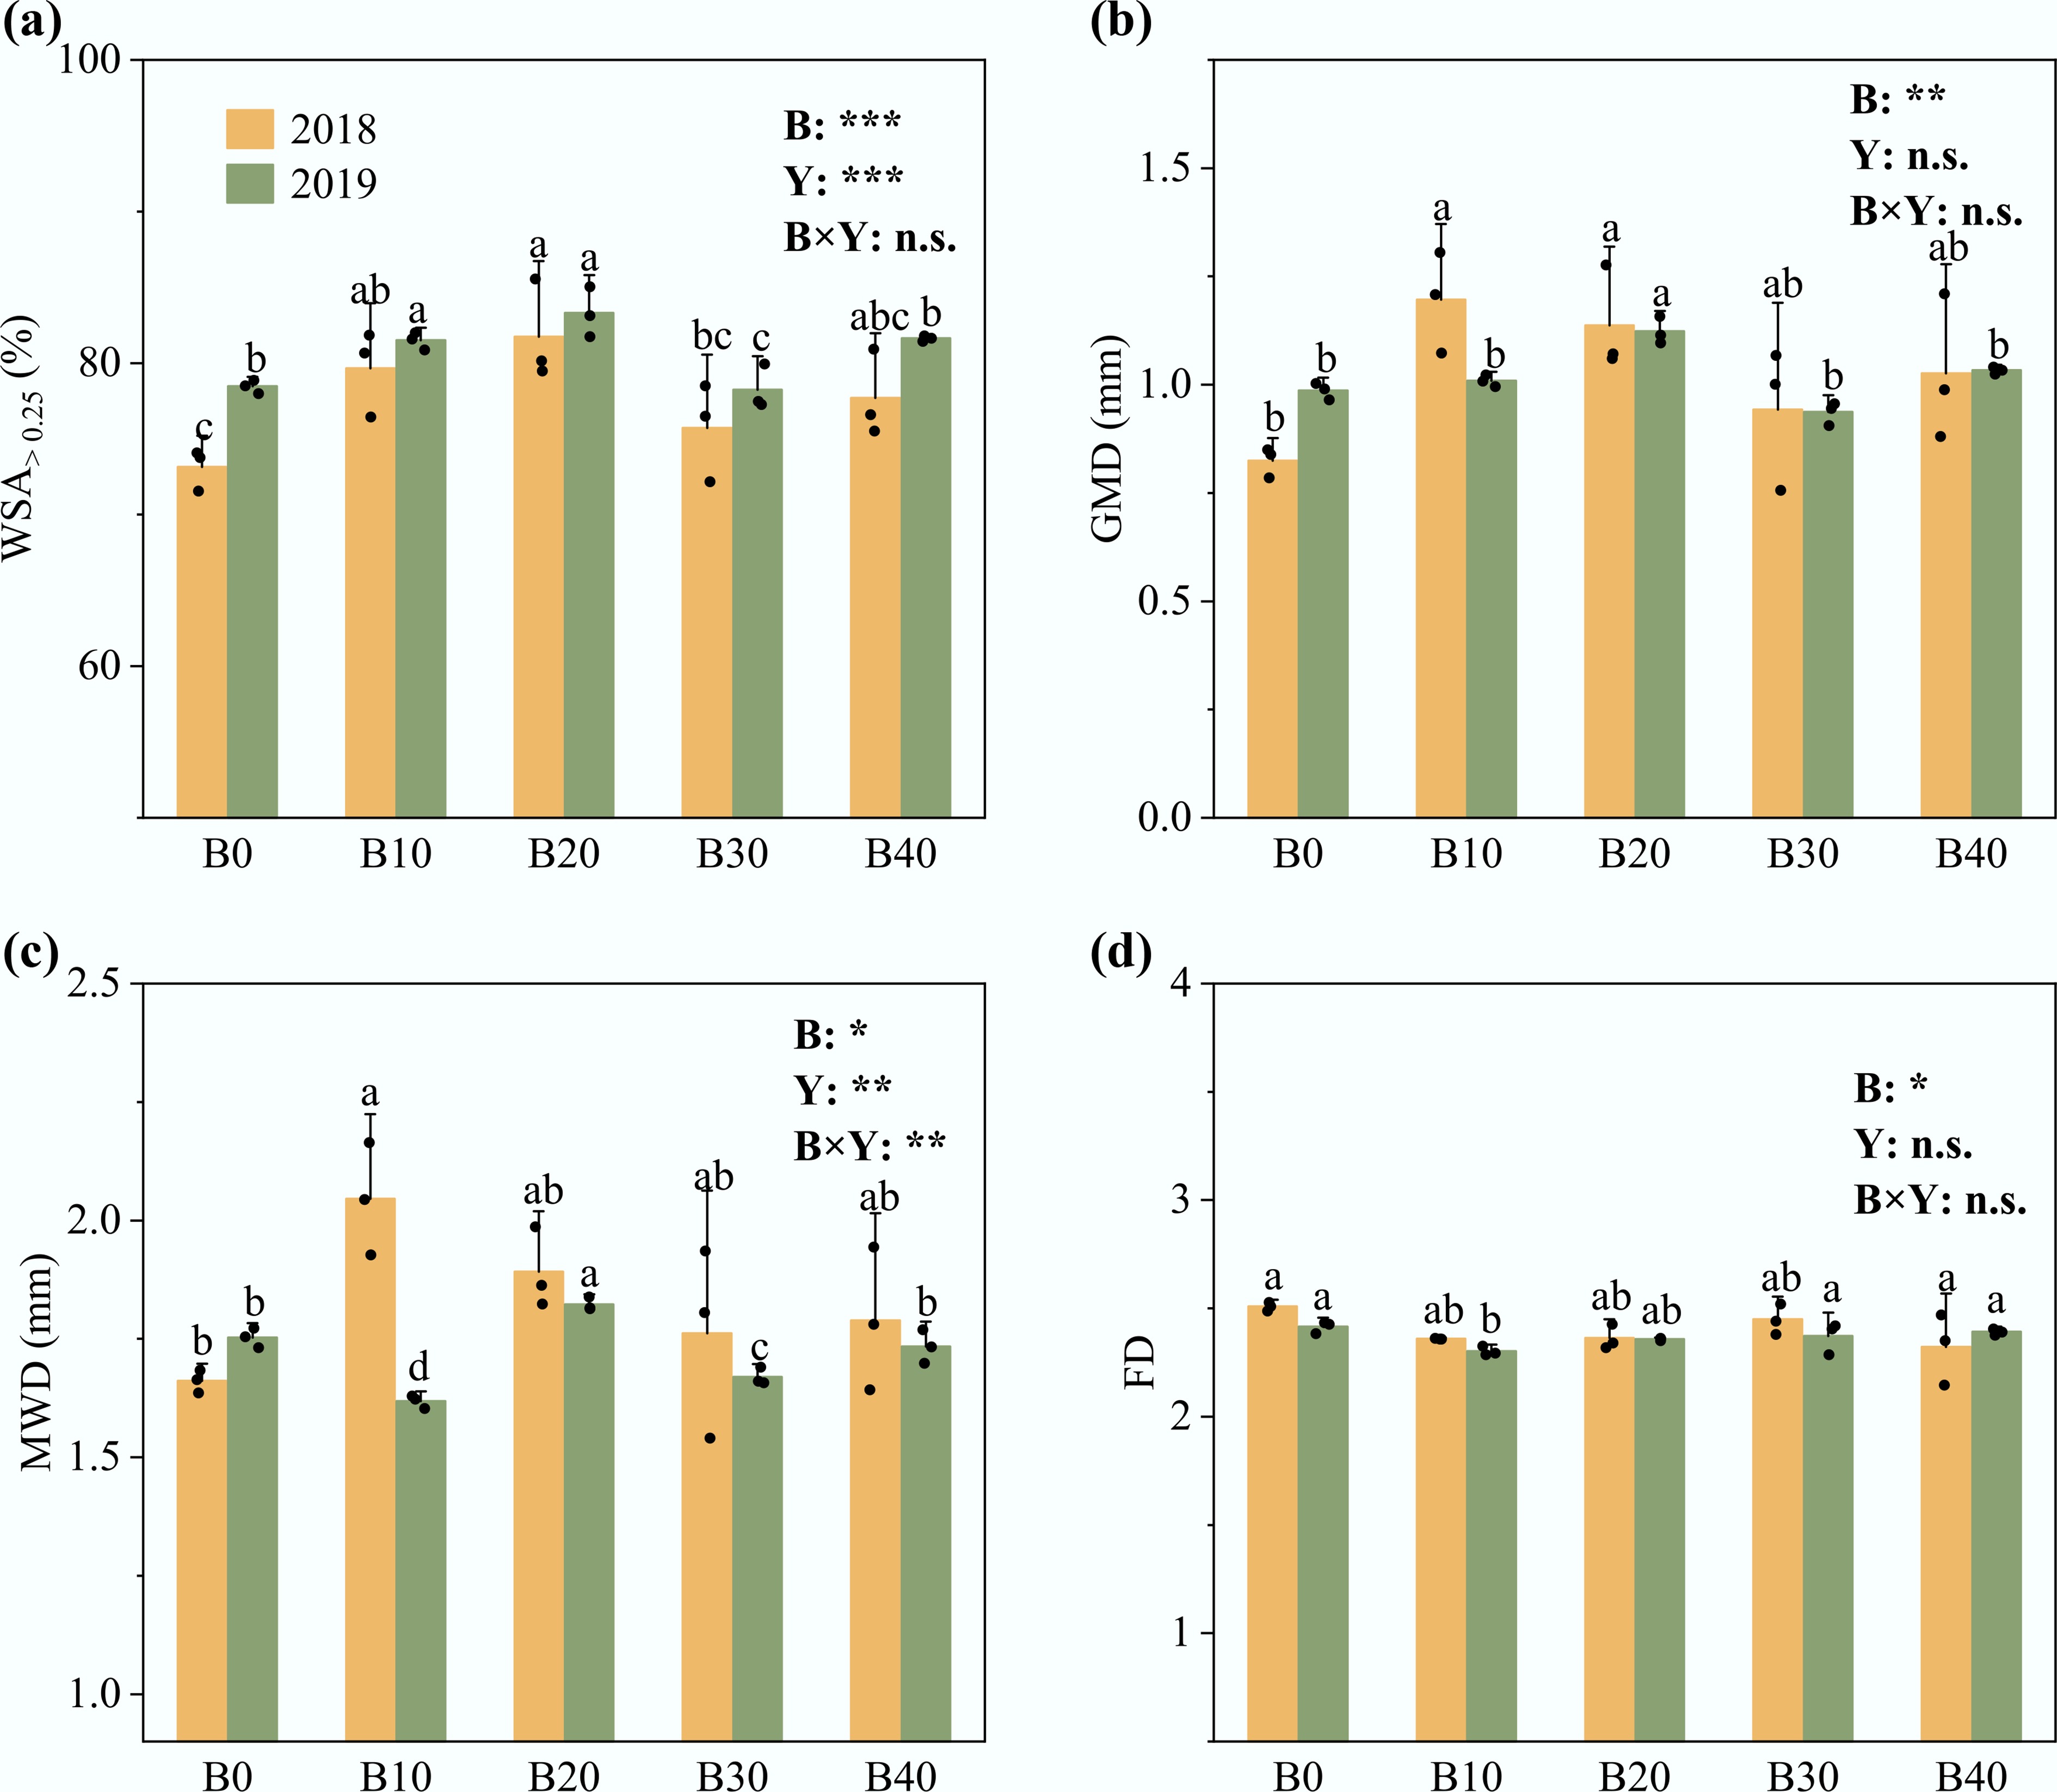
Figure 2.
Soil aggregate stability under different application rates of biochar in 2018 to 2019: (a) WSA>0.25, water-stable macroaggregates (%); (b) GMD, geometric mean diameter; (c) MWD, mean weight diameter; (d) FD, fractal dimension. Error bars indicate standard deviations (n = 3). B0, B10, B20, B30, and B40 are treatments with N fertilization and application of 0, 10, 20, 30, and 40 t biochar ha−1, respectively. Different lowercase letters indicate statistically significant differences (p < 0.05) between treatments in the same year. B indicates biochar effect; Y indicates cropping year effect; B × Y indicates interaction effects between biochar and year; ns, not significant; * p < 0.05; ** p < 0.01; *** p < 0.001.
Soil microbial biomass and community
-
According to a two-way ANOVA analysis, microbial abundance was strongly affected by both biochar and cropping year, with a significant interaction (Fig. 3, p < 0.05). Biochar significantly increased the total PLFAs during the experimental period, and values were significantly higher in 2019 than in 2018 (Fig. 3a, p < 0.05). However, the abundance of AMF, Actinomycetes, G+ bacteria, G- bacteria, and total bacteria generally showed a non-linear response to biochar application rates. Specifically, the abundance of the various PLFAs followed an inverted 'U'-shaped curve, with the highest abundances observed in the B10 and B20 treatments, although no significant differences between the biochar-amended treatments were observed in 2018. Compared with the B0 treatment, biochar amendments significantly increased the abundance of AMF, Actinomycetes, G+ bacteria, G- bacteria, and total bacteria by 43%–54%, 43%–52%, 40%–51%, 23%–43%, and 40%–47%, respectively. Moreover, regarding microbial community structure, biochar had no significant effect on the F/B ratio or the G+/G- ratio (Fig. 3f, i). The G+/G- ratio in 2018 was slightly higher than that in 2019. In contrast, the F/B ratio in 2019 was significantly higher than that in 2018. In addition, as shown in Supplementary Fig. S2, the relative abundance of soil microorganisms in 2018 and 2019 was dominated by total bacteria (including G- and G+ bacteria), followed by Actinomycetes and Fungi.
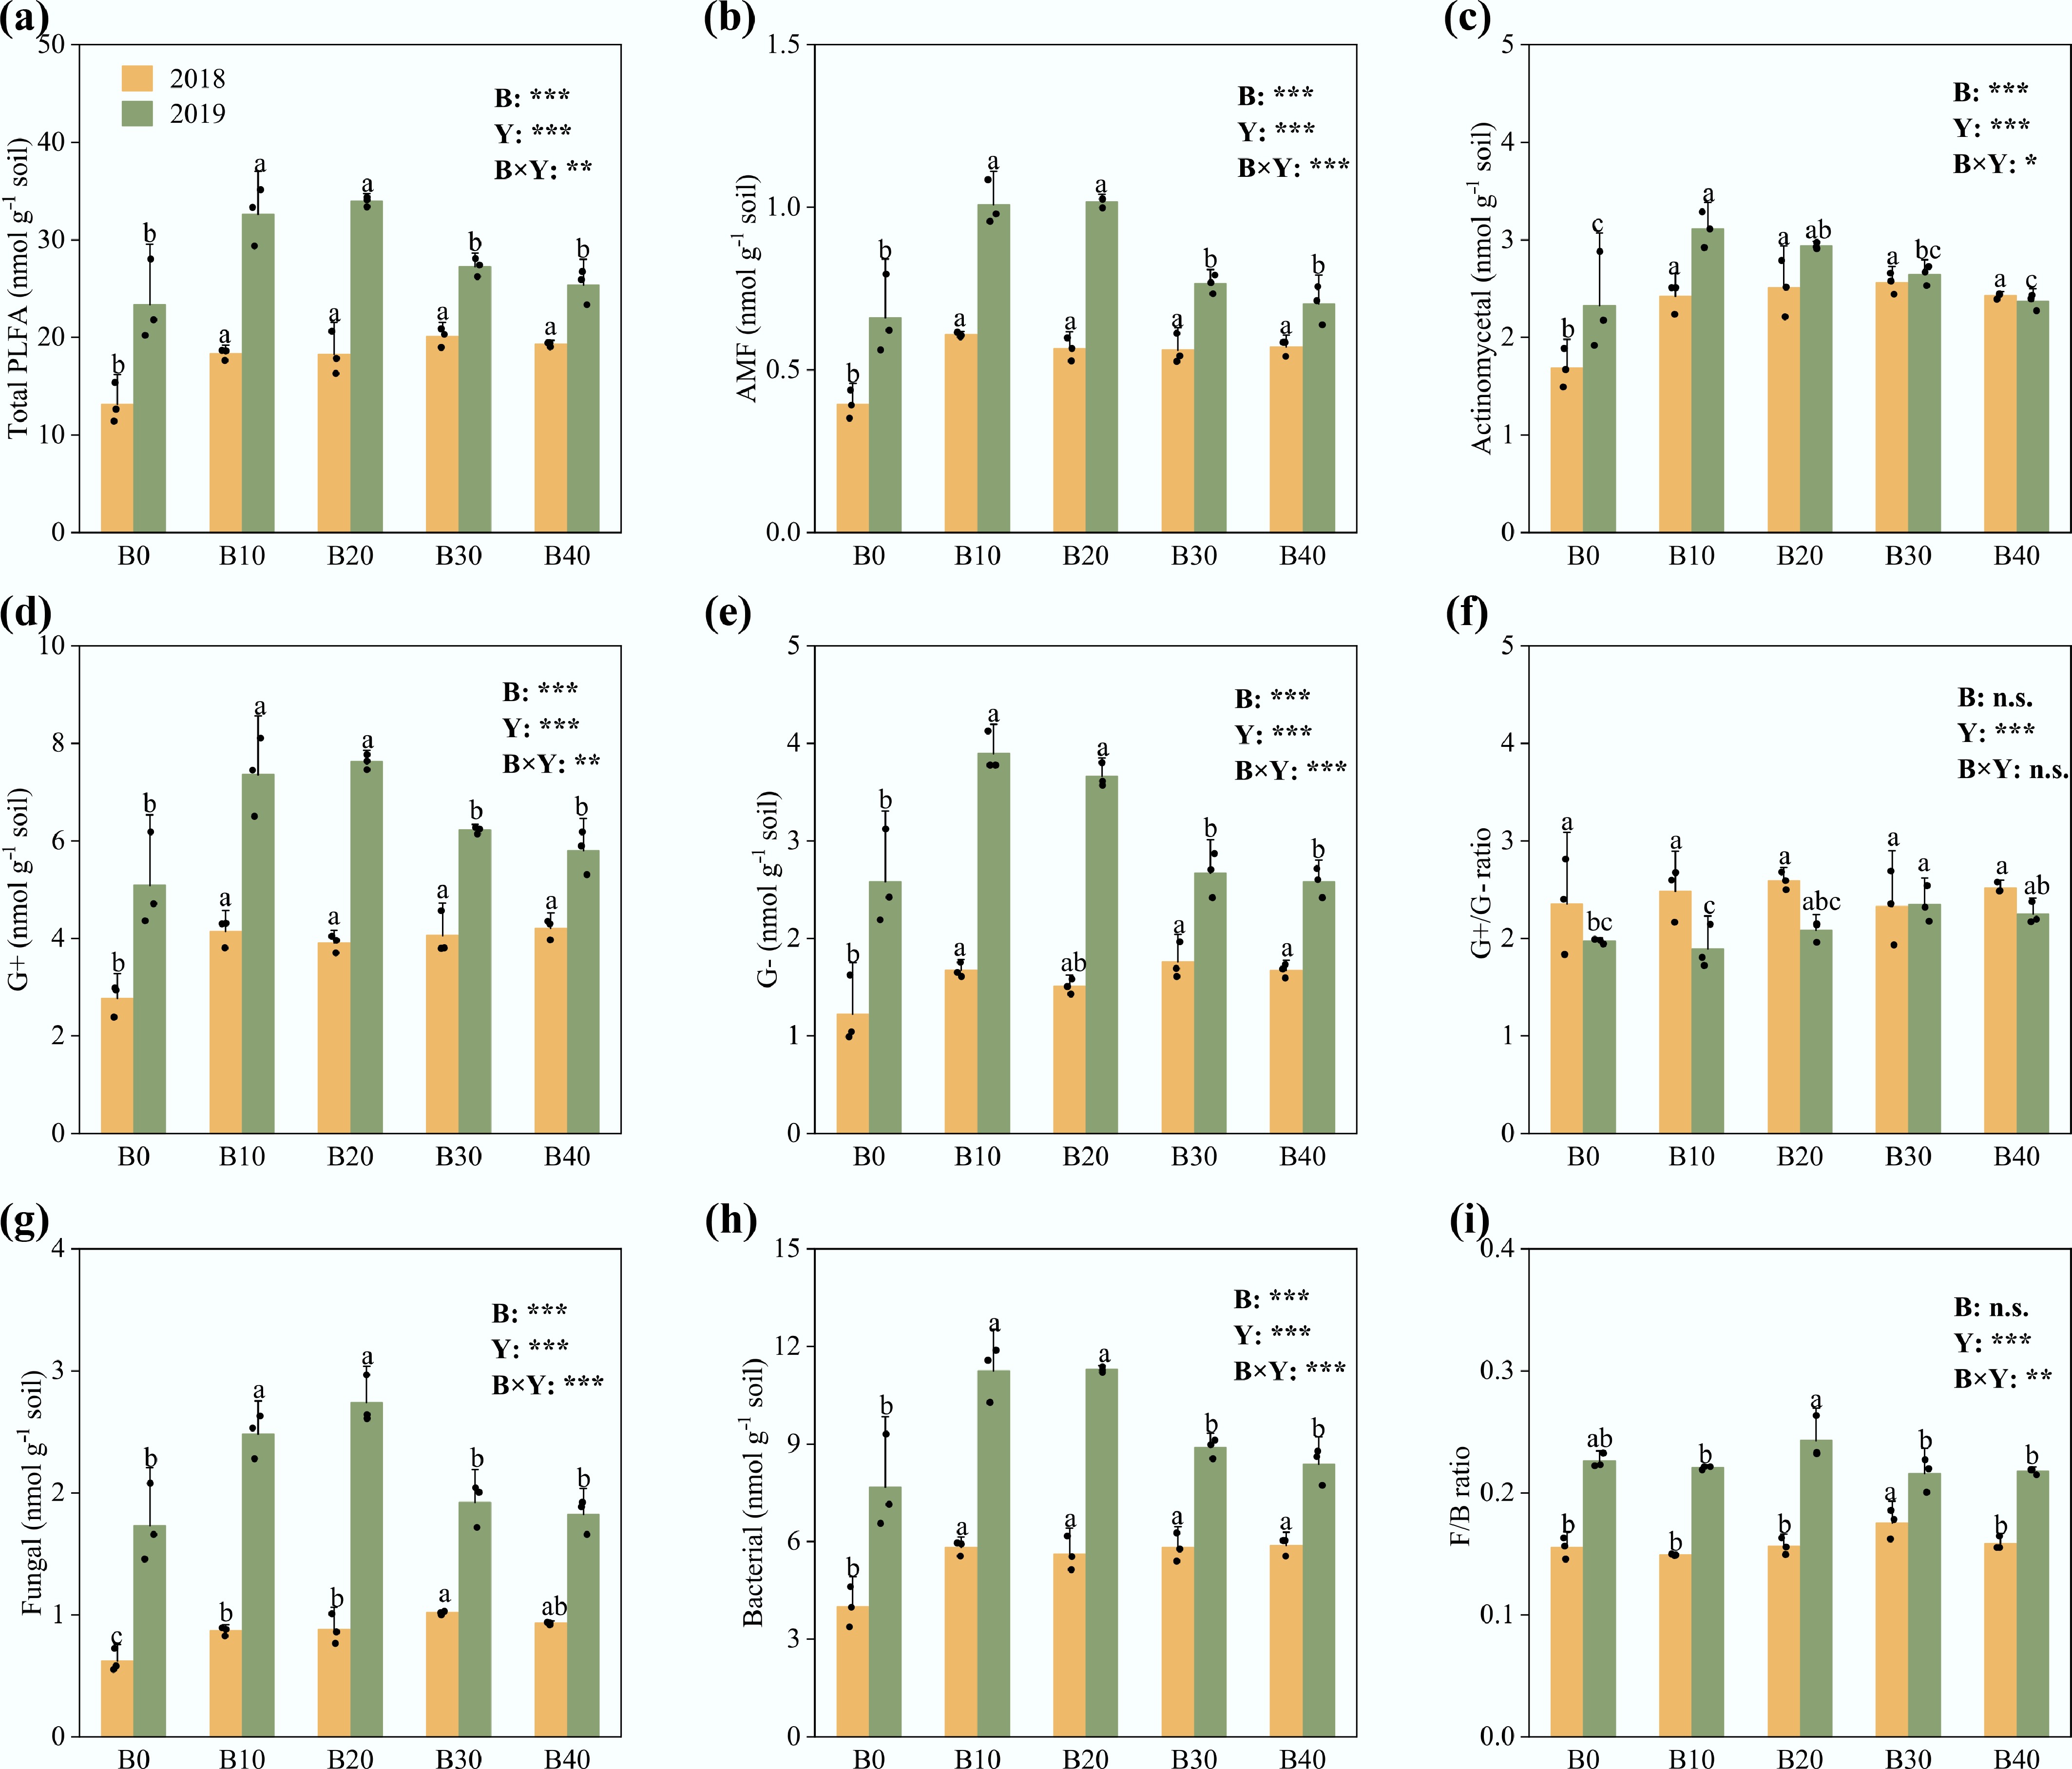
Figure 3.
Effects of different addition rates of biochar on (a) total phospholipid fatty acid (PLFA) content; (b) arbuscular mycorrhizal fungi (AMF) PLFAs; (c) actinomycete PLFAs; (d) Gram-positive bacteria (G+) PLFAs; (e) Gram-negative bacteria (G−) PLFAs; (f) G+/G− PLFA ratios; (g) bacterial PLFAs. (h) fungal PLFAs; and (i) fungal/bacterial PLFA ratios. (i) Error bars indicate standard deviations (n = 3). B0, B10, B20, B30, and B40 are treatments with N fertilization and application of 0, 10, 20, 30, and 40 t biochar ha−1, respectively. Different lowercase letters indicate statistically significant differences (p < 0.05) between treatments in the same year. B indicates biochar effect; Y indicates cropping year effect; B × Y indicates interaction effects between biochar and year; ns, not significant; * p < 0.05; ** p < 0.01; *** p < 0.001. The total PLFA content, fungal PLFA content, bacterial PLFA content, and their PLFA ratios from 2019 were redrawn from Liu et al.[58].
Vegetable crop productivity parameters and soil quality index
-
The effects of biochar on vegetable yield, NUE, N uptake, and NPFP are shown in Fig. 4. Compared with the B0 control, biochar incorporation significantly increased vegetable yield, NUE, N uptake, and NPFP by 0.46%–29%, 6%–161%, 4%–33%, and 0.46%–29%, respectively. In addition, the interaction between biochar and cropping year also significantly influenced these parameters (p < 0.001). In addition, vegetable yield, NUE, N uptake, and NPFP all showed a trend of first increasing and then decreasing with the increase in biochar addition in both 2018 and 2019 (Fig. 4e–h, p < 0.05). These relationships followed an inverse U-shaped pattern, reaching a peak around B20 (Fig. 4e–h).
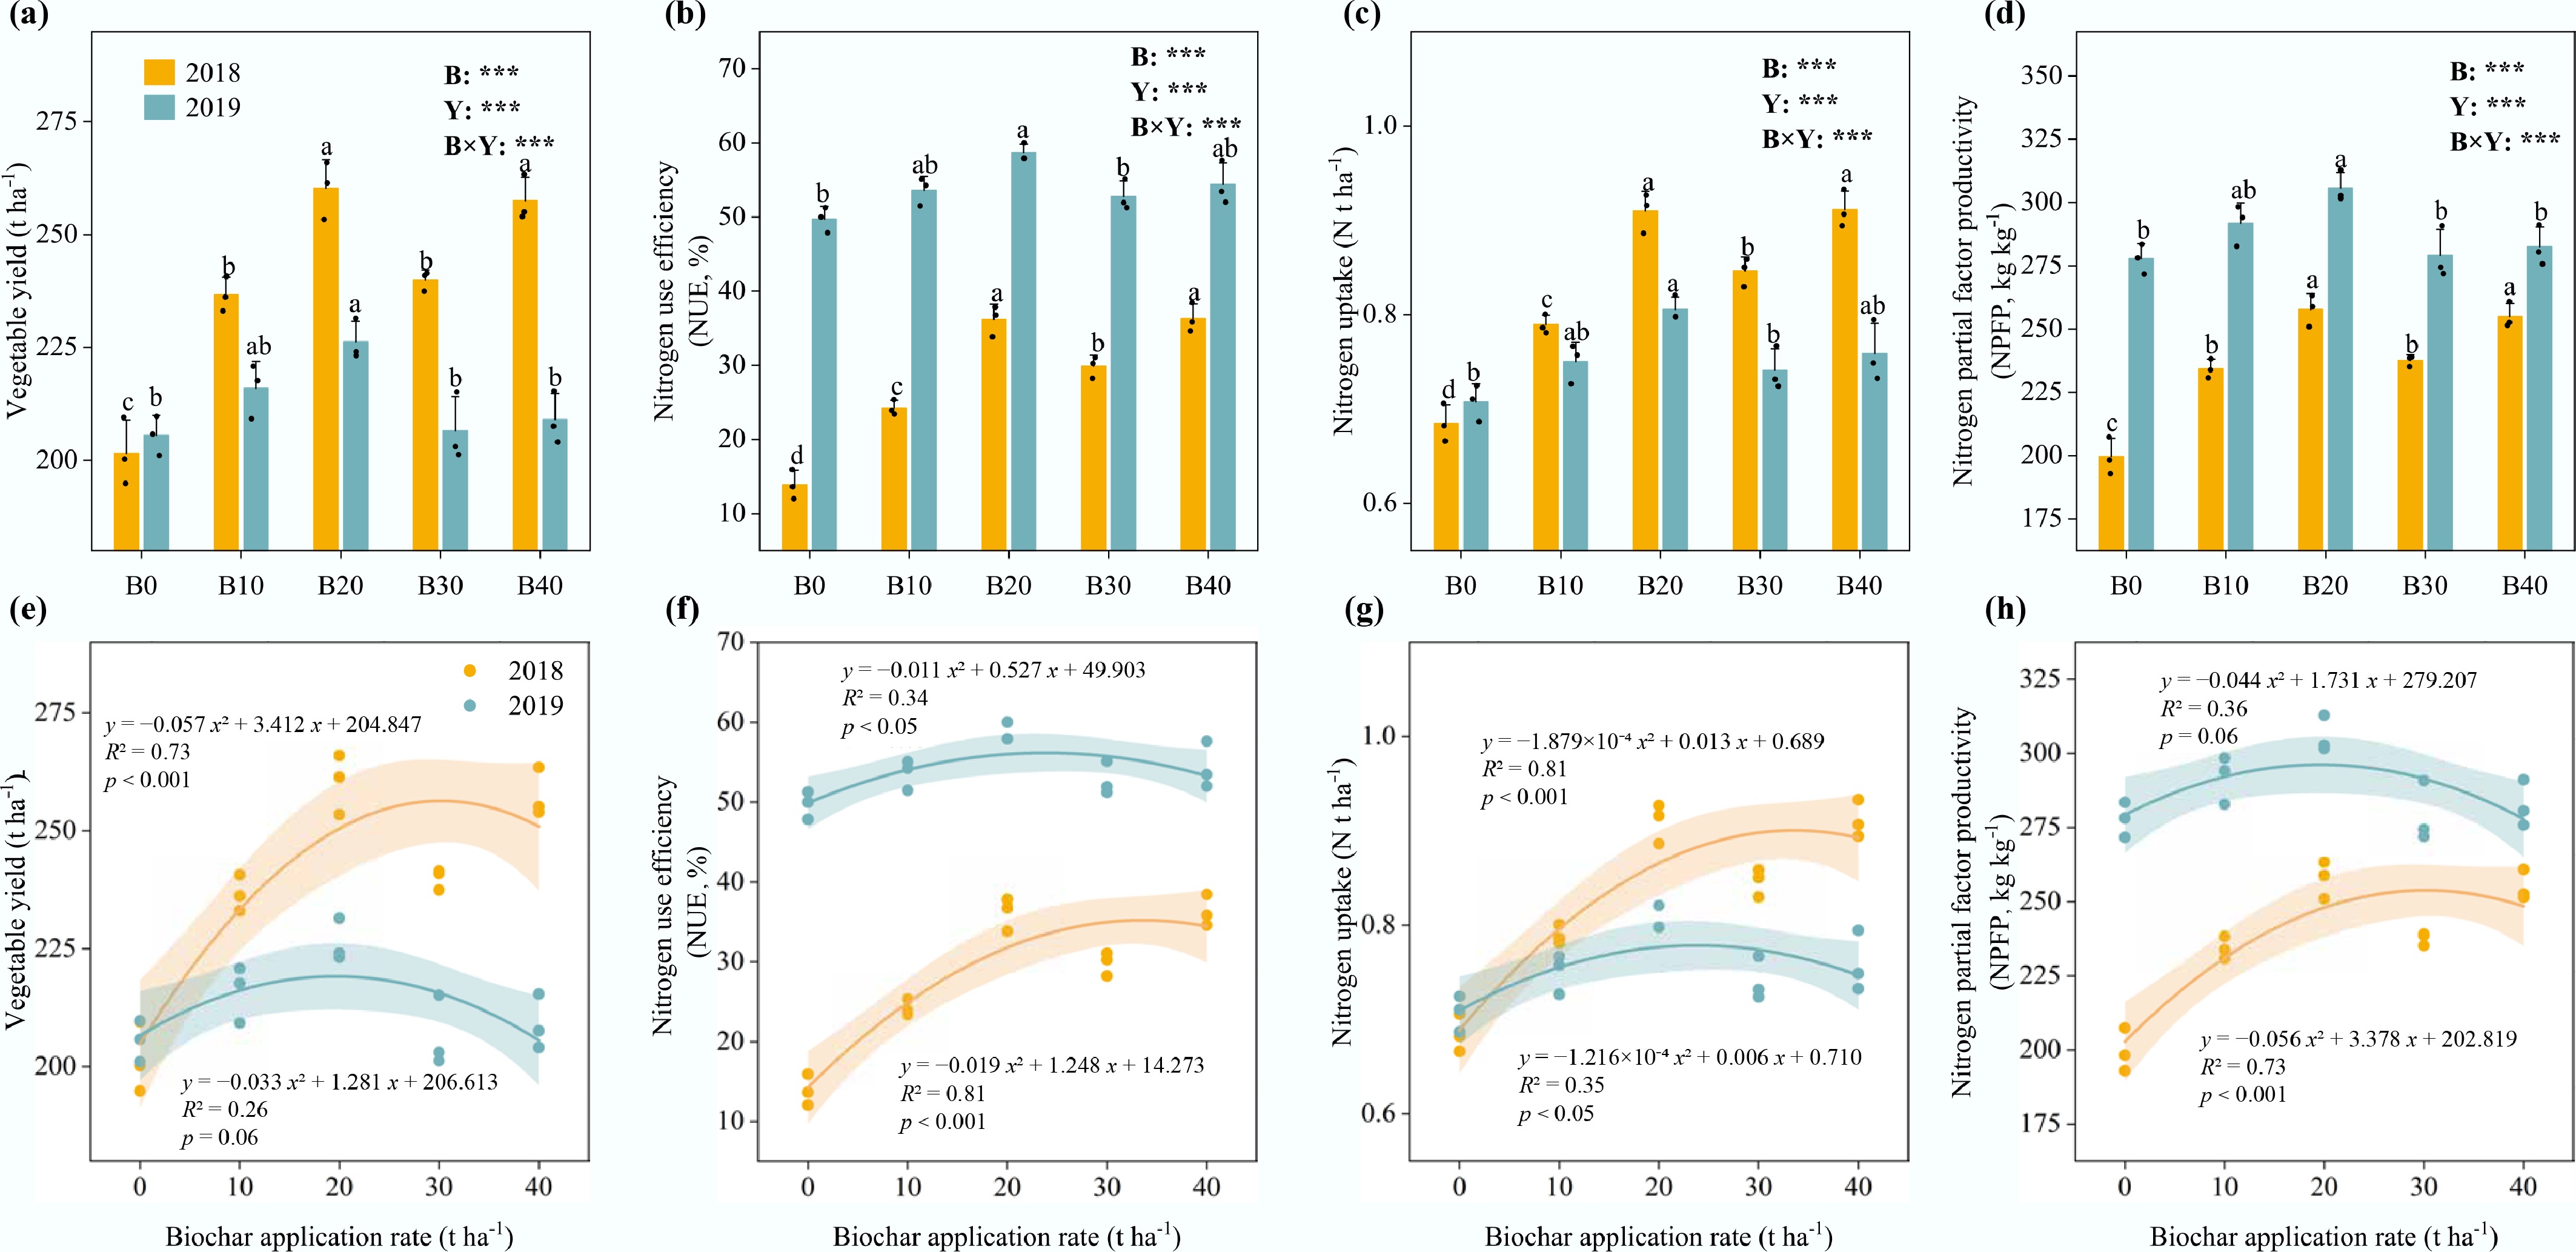
Figure 4.
Effects of different addition rates of biochar on (a) vegetable yield; (b) nitrogen use efficiency; (c) nitrogen uptake; and (d) nitrogen partial factor productivity, NPFP; and (e)–(h) the linear relationships between vegetable yield, NUE, nitrogen uptake, NPFP, and biochar addition rate in 2018 to 2019. Error bars indicate standard deviations (n = 3). B0, B10, B20, B30, and B40 are treatments with N fertilization and application of 0, 10, 20, 30, and 40 t biochar ha−1, respectively. Different lowercase letters indicate statistically significant differences (p < 0.05) between treatments in the same year. B indicates biochar effect; Y indicates cropping year effect; B × Y indicates interaction effects between biochar and year; *** p < 0.001. Solid lines and shaded areas indicate linear regression lines and 95% confidence intervals. The vegetable yield in 2018 was redrawn from Li et al.[60].
Overall, SQI in the biochar-amended treatments was higher than that in the B0 control, regardless of biochar application rate and cropping year (Fig. 5a). The SQI of the B20 treatment was 39.7% and 50.6% higher than that of the B0 treatment in the 2 years, respectively (Fig. 5a, p < 0.001). Additionally, random forest analysis indicated that soil chemical factors (44%) and biological factors (51%) exerted the greatest influence on SQI in 2018, while changes in soil biological factors (69%) elicited the strongest response to SQI in 2019 (Supplementary Fig. S3). Moreover, vegetable yield, NUE, and N uptake in both 2018 and 2019 showed positive correlations with SQI (Fig. 5b–d, p < 0.05), highlighting the importance of improving soil quality for enhancing crop production and N uptake and utilization.
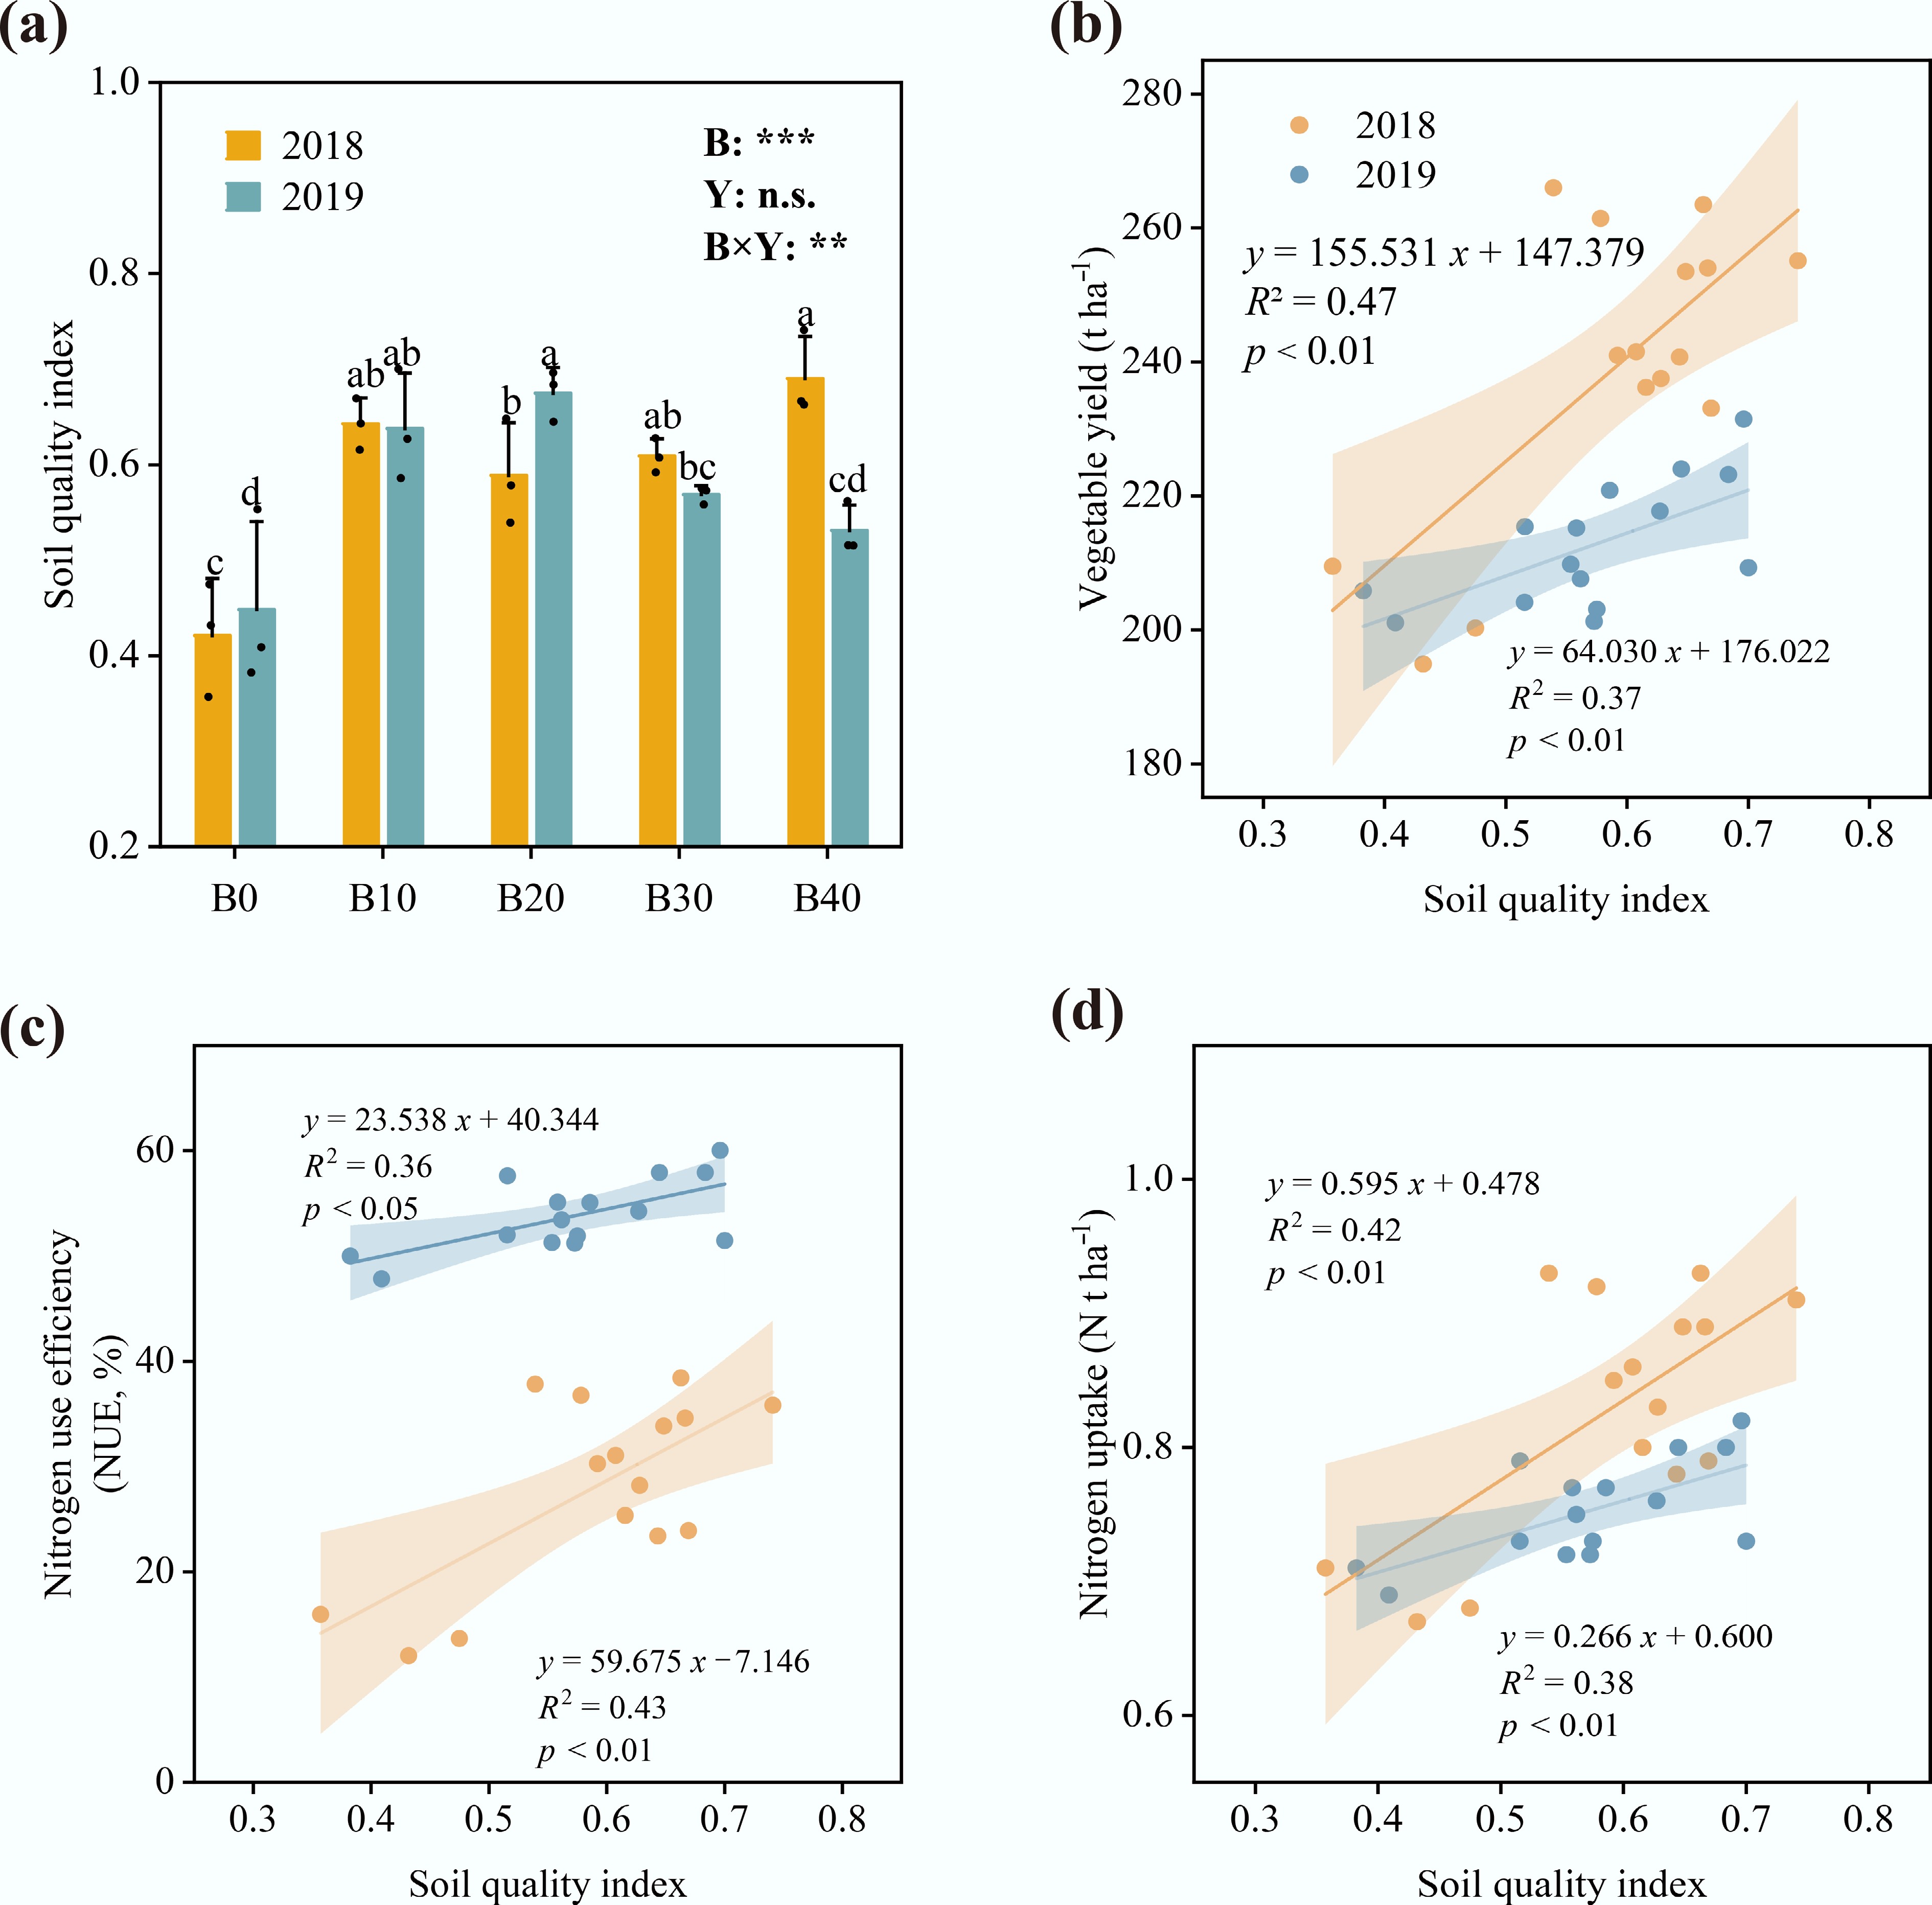
Figure 5.
Effects of different addition rates of biochar on (a) soil quality indices; (b) their linear relationships with vegetable yield; (c) nitrogen use efficiency; and (d) nitrogen uptake from 2018 to 2019. B0, B10, B20, B30, and B40 are treatments with N fertilization and application of 0, 10, 20, 30, and 40 t biochar ha−1, respectively. Different lowercase letters indicate statistically significant differences (p < 0.05) between treatments in the same year. B indicates biochar effect; Y indicates cropping year effect; B × Y indicates interaction effects between biochar and year; ns, not significant; ** p < 0.01; *** p < 0.001. Solid lines and shaded areas indicate linear regression lines and 95% confidence intervals.
Correlation of NUE and vegetable yield with soil properties, aggregate stability, and microbial communities
-
Mantel test results showed significant correlations between vegetable yield and soil properties (e.g., SOC, AK, Feo, and Fep), NUE and microbiome, N uptake and soil properties (e.g., SOC and Fep), and NPFP with WSA>0.25, GMD, soil properties (e.g., AP, AK, Fed, and Fep), and microbiome (Fig. 6a). The random forest model indicated that SOC, Fep, AK, MWD, and Feo were the key soil factors influencing N uptake (Fig. 6b, p < 0.05), and AK, SOC, Fungal, Fep, and total bacterial were the key soil factors impacting NUE (Fig. 6b, p < 0.05). Among these different soil factors, the key factors impacting vegetable yield were AK, Fep, SOC, MWD, and Feo (Fig. 6b, p < 0.05).
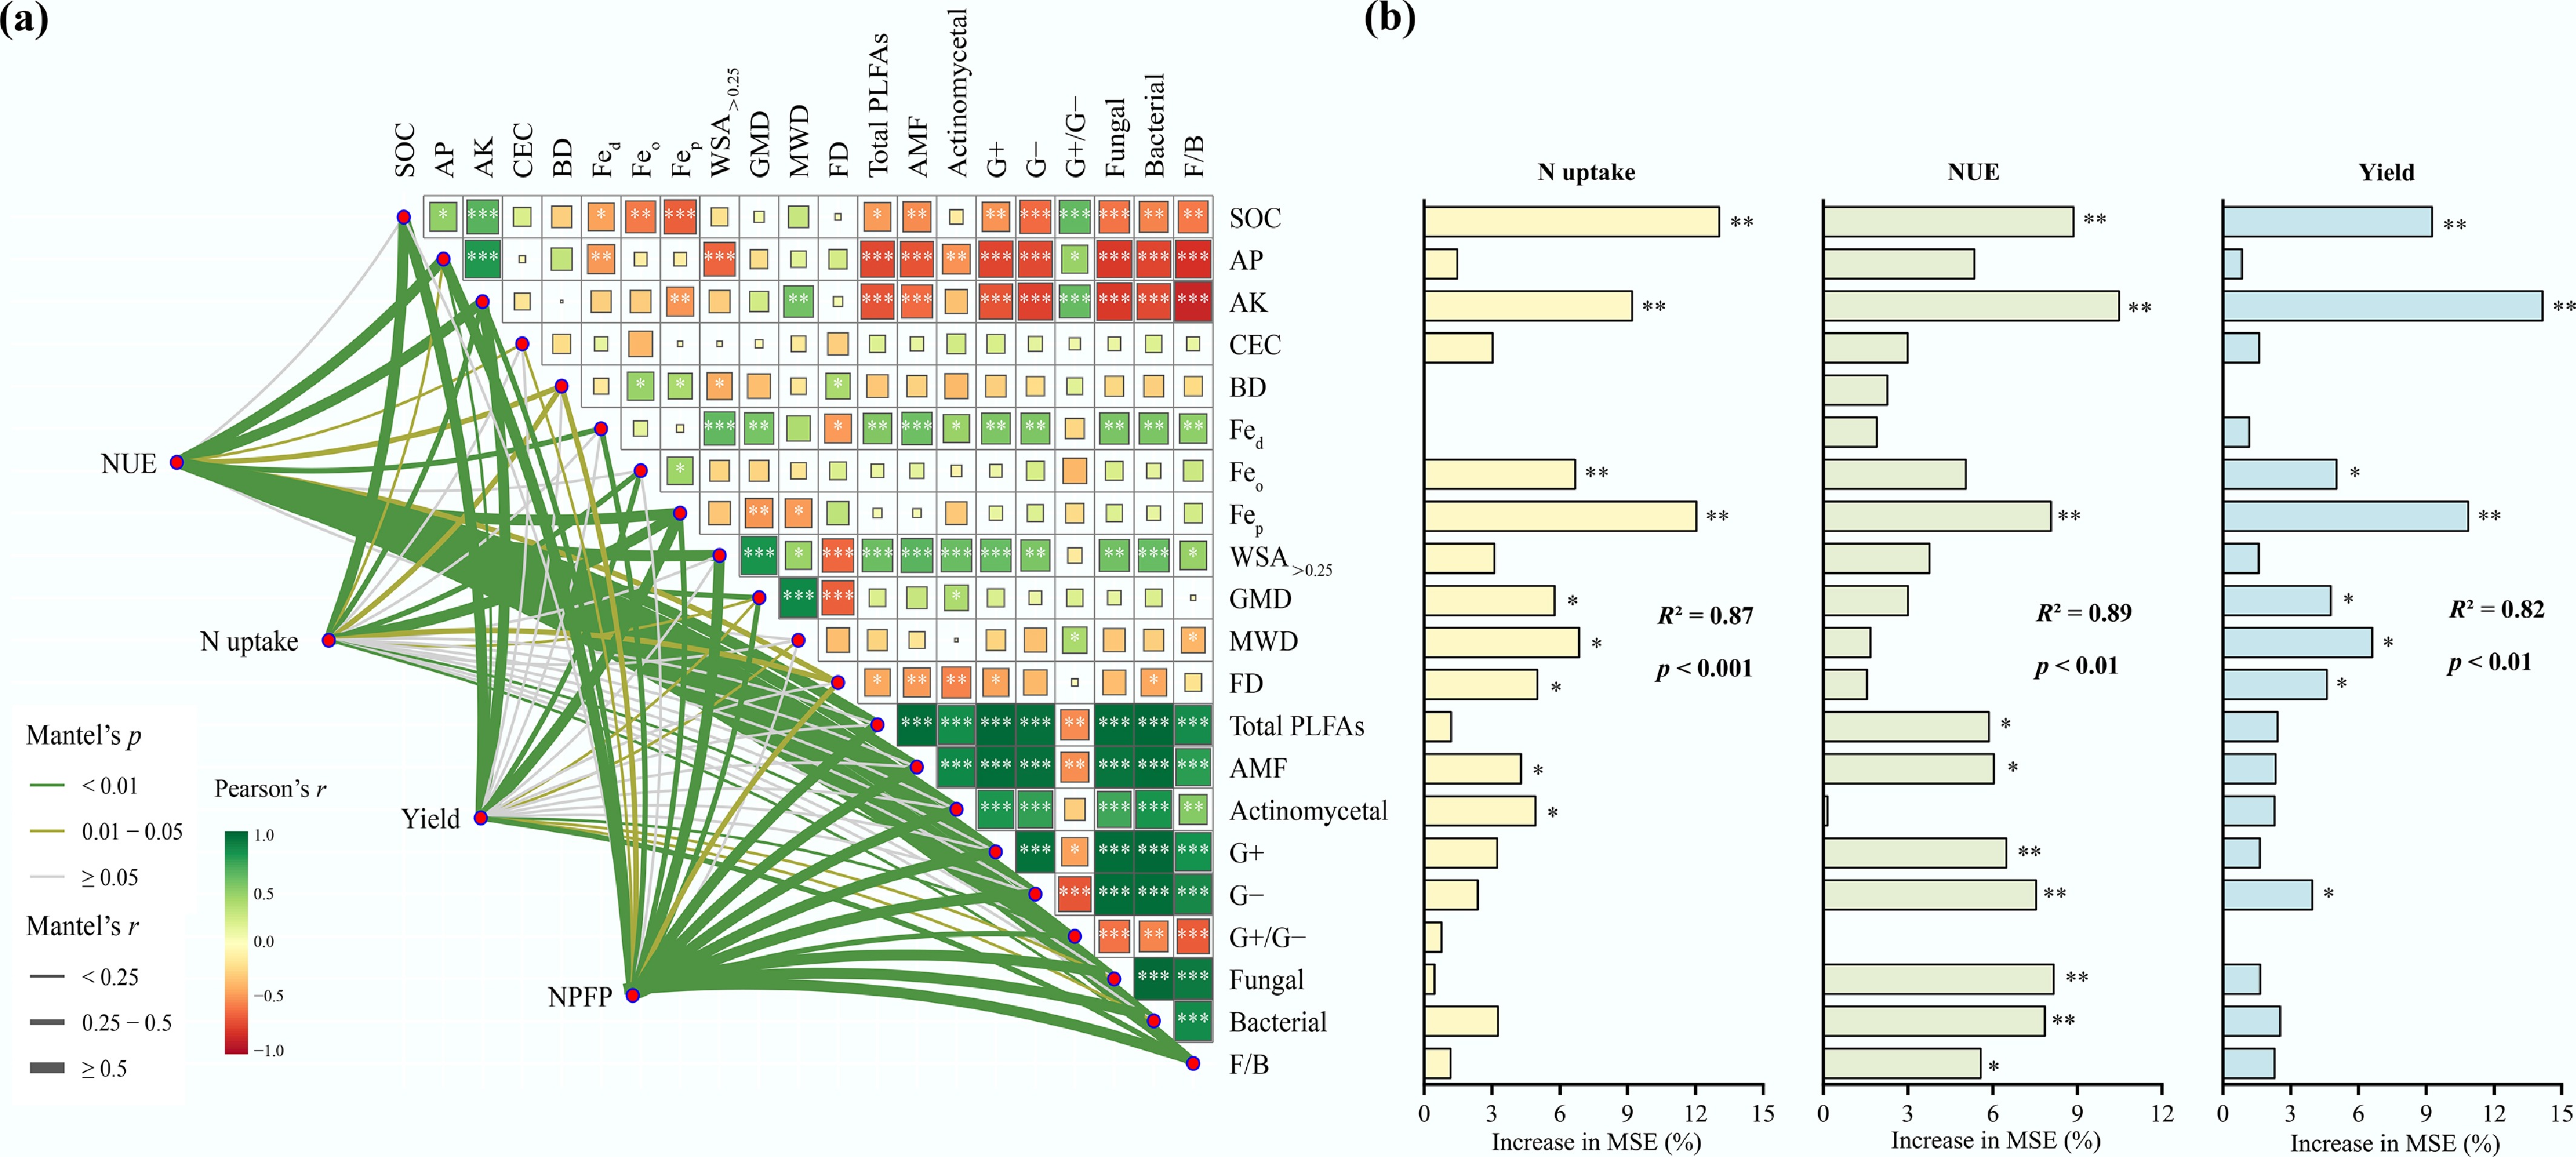
Figure 6.
(a) Mantel test of NUE, N uptake, vegetable yield, and NPFP with environmental factors; (b) Random forest model analysis to determine the primary factors influencing N uptake, NUE, and vegetable yield. Percentage increases in the MSE (mean squared error) of variables were used to estimate the importance of these predictors, where higher MSE% values imply more important predictors. * p < 0.05; ** p < 0.01; *** p < 0.001.
The partial least squares path model explained the variation in N utilization (82.0%) and vegetable yield (87.0%), thereby revealing that the biochar application rate affected N utilization and vegetable yield by altering soil basic properties, the microbiome, and soil structure (Fig. 7). Nitrogen utilization was positively correlated with vegetable yield (p < 0.001). Specifically, the soil microbiome had a significant direct positive effect on N utilization (p < 0.001), which indirectly promoted vegetable yields, while significantly improving soil structure (p < 0.05). Soil basic properties played a critical role in vegetable yield by positively affecting N utilization (Fig. 7b, c, p < 0.001), while significantly and negatively affecting the soil microbiome (p < 0.001).
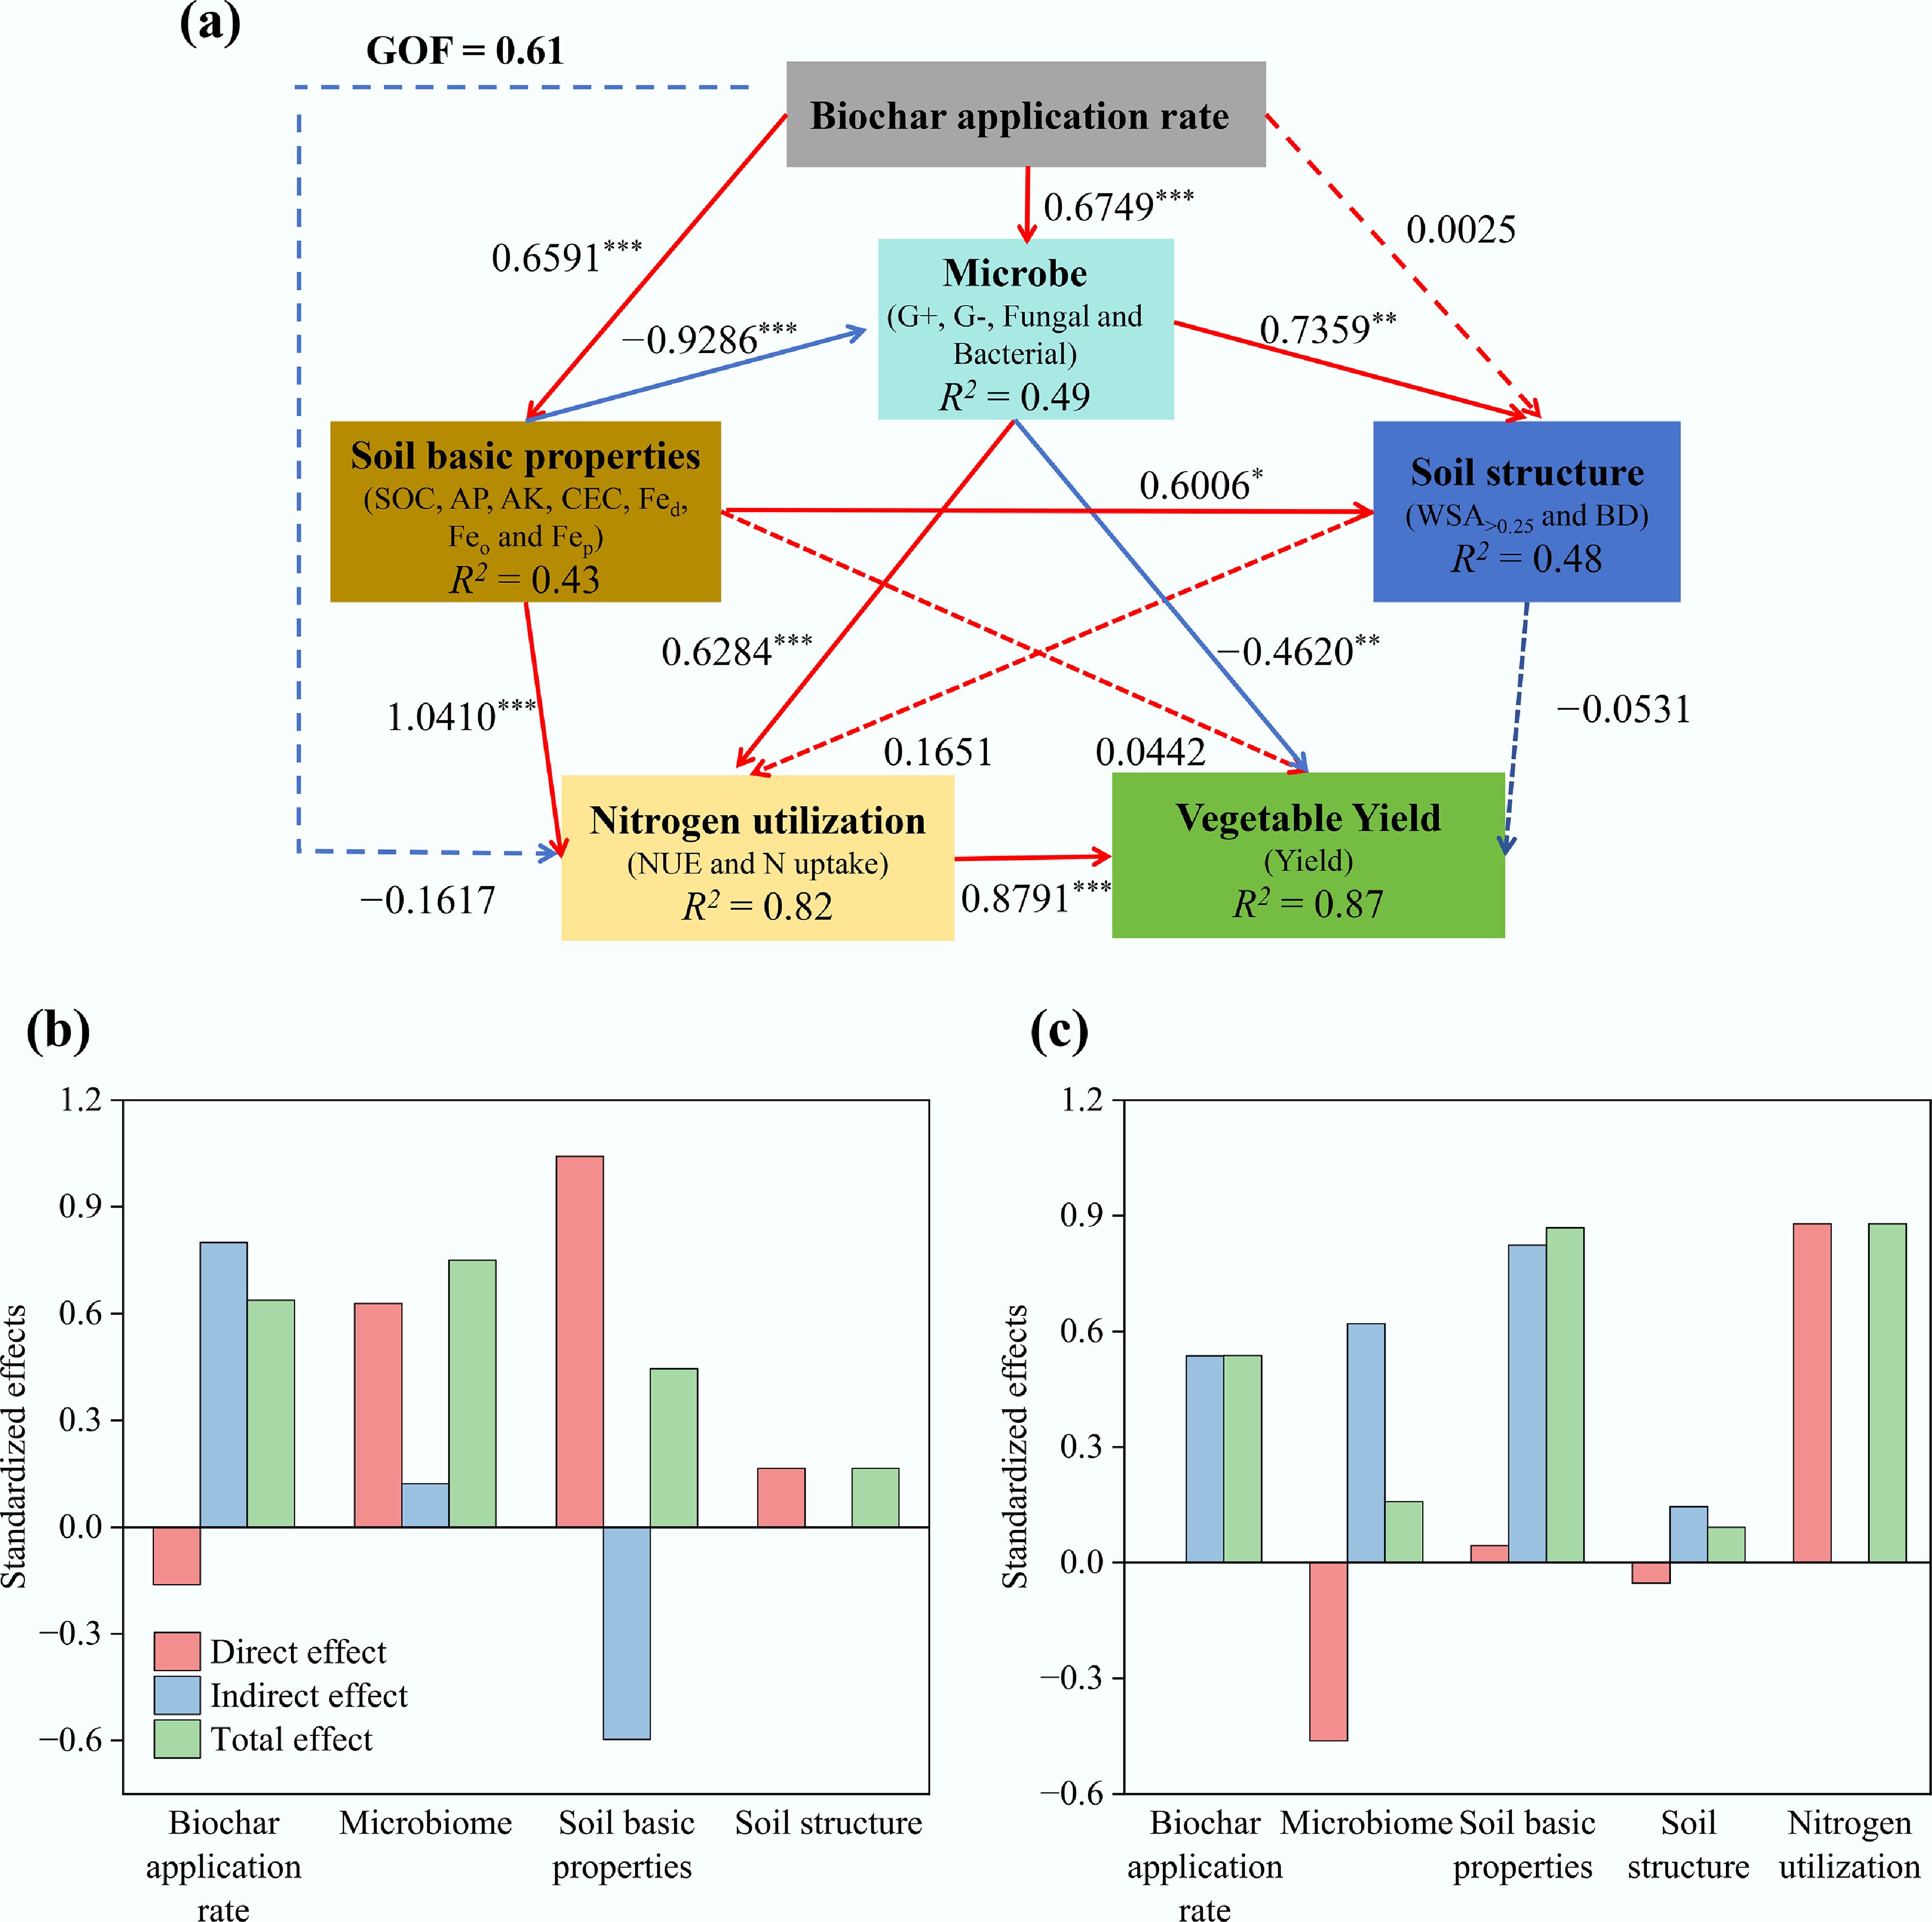
Figure 7.
Partial least squares path model showing the relationships among biochar application rate, soil basic properties, microbiome, soil structure, nitrogen utilization and vegetable yield (a); as well as the standardized effects of these variables on nitrogen utilization (b), and vegetable yield (c). Soil basic properties include the SOC, AP, AK, CEC, Fed, Feo, and Fep. Microbiome includes the G+ bacterial, G− bacterial, Fungal and Bacterial. Soil structure includes the WSA>0.25 and BD. Nitrogen utilization includes the NUE and N uptake. Red and blue arrows indicate significant positive and negative relationships, respectively. Dashed arrows denote nonsignificant relations. The number adjacent to each line represents the standardized path coefficient; *, p < 0.05; **, p < 0.01; ***, p < 0.001.
-
Recent studies have shown that biochar amendment significantly enhances soil physicochemical properties and improves soil health[33,34]. In this study, we observed substantial differences in soil properties among different biochar application rates compared with the soil without biochar amendment (Fig. 1). Specifically, B20, B30, and B40 treatments increased the soil content, particularly of SOC and AK in both 2018 and 2019 (Fig. 1a, c). This finding is consistent with Qi et al.[35] and Xie et al.[5], and potentially attributable to the large surface area and oxygen-containing functional groups of biochar, which can increase the nutrient supply efficiency, thereby altering soil nutrient availability[36]. In addition, the deficiency of available phosphorus (P) was previously a common feature in red soils in Southern China. However, excessive long-term fertilizer application in intensive vegetable fields has resulted in over-enrichment of soil AP (140–220 mg kg−1). In the present study, notably, B20 significantly reduced soil AP content by 9%–24% in both years (Fig. 1b), thereby partially mitigating the potential hazards of phosphorus excess. The possible reason is that B20 significantly enhanced WSA>0.25 content and improved soil structural stability, which facilitated the strong immobilization of P to aggregates[37]. Furthermore, significant quantities of iron and manganese oxides in highly weathered (sub)tropical soils may form insoluble compounds with phosphorus, leading to a reduction in the AP content and thereby mitigating the toxicity associated with phosphorus excess[38,39]. A significant negative correlation between Fed and AP and between WSA>0.25 and AP further supports these mechanisms (Fig. 6a). Moreover, we also found that the effects of biochar on SOC, AK, and AP began to diminish in the second year, which is in agreement with Jin et al.[12], who found that five different application rates of biochar tested in Jiangxi red soil effectively increased soil pH, SOC, AP, and saturated hydraulic conductivity (Ks), but the effects began to diminish after the first year, suggesting that the marginal benefits of biochar may gradually disappear once its application is discontinued.
As for soil structure, soil WSA>0.25, GMD, MWD, and FD are crucial indicators for assessing soil aggregate stability[40]. In this study, biochar increased WSA>0.25, GMD, and MWD, while reducing FD (Fig. 2). This may be attributed to the fact that biochar could serve as an organic binder to enhance the aggregation process due to its high surface area and enhanced adsorption capacity[41]. Moreover, the positive correlation between WSA>0.25 and PLFA suggests that biochar may stimulate fungal mycelia and root exudates, thereby enhancing the binding of clay minerals and organic matter, which ultimately promotes the formation of soil macroaggregates[42]. In this study, the improvement effect of biochar on soil structure was most pronounced at the appropriate application rate (B20), while the effect diminished at higher application rates (B30 and B40). These results indicated that once soil aggregate stability has been effectively improved, further investments in soil improvement yield limited benefits[43].
Effect of biochar on soil microbial communities
-
Our results demonstrated that biochar significantly increased total PLFA content (specifically G+ bacteria) in relation to B0 during the experimental period. This improvement can be attributed to the fraction of carbon and nutrients provided by biochar, which become readily available to the soil microbial community[44,45]. Notably, the increase in PLFA in the second year was significantly higher than in the first year (Fig. 3), indicating that the enhancement of soil microbial biomass by biochar is a sustained and long-term process. In addition, the significant enrichment of G+ bacteria is associated with the aromatic carbon introduced by biochar, which provides them with a long-lasting growth substrate[46]. However, the PLS-PM model revealed significant negative correlations between SOC, AP, and AK and the microbial community (Fig. 7a). This 'negative' effect suggests that although biochar can provide some nutrients, the rapid release of soluble nutrients at high application rates (B30, B40) may disrupt the soil C:N:P balance, thereby enhancing copiotrophic species (r-strategists) while suppressing the oligotrophic species (K-strategists) adapted to nutrient-poor soil[47,48]. Therefore, excessive biochar application (> 20 t ha−1) may lead to nutrient supersaturation and microbial stress, highlighting the need to optimize biochar rates to balance soil fertility and microbial stability.
Biochar-enhanced soil quality in relation to vegetable productivity and NUE
-
The current results showed that biochar applied in combination with N fertilizer significantly enhanced vegetable yields compared with the application of N fertilizer alone, which is consistent with previous findings[49]. This is likely because mixing biochar with fertilizers can enhance nutrient availability, regulate microbial community composition, and thereby increase crop yields[50]. This was supported by the positive correlation observed between SOC, AK, microbial biomass, and vegetable yields (Fig. 6a). Furthermore, a moderate biochar application rate (20 t ha−1) in our study had the most beneficial effect on vegetable yields, whereas increasing the application rate did not further enhance vegetable yields. Similarly, previous studies have shown that crop yields do not exhibit a linear relationship with biochar application rates[51,52]. First, high biochar application rates may negatively impact crop growth, primarily due to the adsorption of soil nutrients facilitated by the high specific surface area and abundant surface functional groups[53]. Second, excessive biochar application may inhibit plant growth due to the presence of toxic residues or disturbances in nutrient stoichiometry[10].
Li et al.[54] indicated that under conventional N fertilizer application, the NUE of intensive vegetable cultivation was less than 10%, which was far lower than that of other food crops (33%)[55]. Therefore, proposing practical and feasible measures to improve the NUE of intensive vegetable cultivation in China holds significant importance for ensuring food security and reducing the impact of N fertilizers on the environment. Biochar has been shown in multiple studies to prolong the release period of fertilizer nutrients through adsorption and retention, thereby improving plant nutrient uptake and enhancing fertilizer utilization efficiency[56,57]. In our study, the combined application of biochar and N fertilizer substantially improved NPFP (0.46%–29.14%) and NUE (6%–161%), particularly with moderate biochar application rates (Fig. 4). Collectively, these observations lend support to our hypothesis (1). Additionally, vegetable yield, NUE, and N uptake in both 2018 and 2019 showed positive correlations with SQI (Fig. 5b–d, p < 0.05), highlighting the importance of improving soil quality for enhancing crop production and NUE.
Random forest results suggested that soil chemical (TN, NH4+-N, NO3−-N, SOC, AK, CEC) and biological indicators (total PLFAs, AMF, actinomycetes, G+ bacteria, Fungal, total bacteria) were the most influential factors for soil quality as affected by biochar amendment (Supplementary Fig. S3), which strongly supported our hypothesis (2). Therefore, the improvement of these soil quality indicators by biochar application indirectly contributed to enhanced vegetable yield and N utilization.
Compared with the first year, biochar demonstrated a stronger ability to enhance vegetable NUE during the second year of the field trial (Fig. 4), and our previous results demonstrated that biochar can effectively decrease soil greenhouse gas emissions[58], which further validated that the incorporation of biochar may be a long-term effective measure to improve the NUE of N fertilizers in intensive vegetable production in Southern China. Furthermore, we found that 20 t ha−1 of biochar achieved the highest vegetable yields and NUE during the 2-year field trial, and that this improvement was not linearly amplified with increasing application rates. Considering the high cost of biochar (US
${\$} $ -
In this 2-year field study, biochar application, particularly at 20 t ha−1, significantly increased vegetable yields and nitrogen utilization. Biochar application increased SOC and AK, enhanced microbial activity, and improved soil aggregate stability. Taking all the soil properties into consideration, biochar substantially increased SQI in intensive vegetable soil. Moreover, vegetable yield, NUE, and N uptake showed positive correlations with SQI. The random forest and partial least squares path model showed that biochar indirectly promotes vegetable yield and NUE by enhancing soil nutrient availability and promoting microbial activity. However, higher biochar application rates failed to further increase vegetable yields, NUE, and SQI, instead showing a declining trend. Therefore, we recommend that 20 t ha−1 biochar be the most effective application rate to enhance vegetable yields and NUE and improve soil quality in Southern China. Because this study was limited to short-term effects, future research should be conducted over longer time periods to monitor the long-term impacts of biochar.
No acknowledgments are applicable for this work.
-
It accompanies this paper at: https://doi.org/10.48130/nc-00260-0013.
-
Not applicable.
-
The authors confirm their contributions to the paper as follows: data curation, writing – original draft: Chen Z; methodology, software: Chen Z, Liu Y, Hu J; study supervision: Lu Y; writing – review and editing: Chen Z, Elsgaard L, Li B; study conception and design, supervision: Li B; funding acquisition: Lu Y, Li B. All authors reviewed the results and approved the final version of the manuscript.
-
The datasets generated and/or analyzed during the current study are not publicly available but are available from the corresponding author on reasonable request.
-
The authors declare that they have no conflict of interest.
-
Full list of author information is available at the end of the article.
- The supplementary files can be downloaded from here.
- Copyright: © 2026 by the author(s). Published by Maximum Academic Press, Fayetteville, GA. This article is an open access article distributed under Creative Commons Attribution License (CC BY 4.0), visit https://creativecommons.org/licenses/by/4.0/.
-
About this article
Cite this article
Chen Z, Liu Y, Hu J, Lu Y, Elsgaard L, et al. 2026. Biochar enhanced the vegetable production and nitrogen use efficiency by improving soil quality in intensive vegetable fields in Southern China. Nitrogen Cycling 2: e026 doi: 10.48130/nc-0026-0013 

Biochar enhanced the vegetable production and nitrogen use efficiency by improving soil quality in intensive vegetable fields in Southern China
- Received: 23 June 2026
- Revised: 19 August 2026
- Accepted: 28 August 2026
- Published online: 17 September 2026
Abstract: Biochar as a soil amendment is widely recognized to benefit soil properties and enhance crop yield in agricultural ecosystems. However, field-based evidence remains limited regarding the optimal application rate of biochar for enhancing soil quality and crop productivity in intensive vegetable production in Southern China. This study investigated the effects of different rice straw biochar application rates (0, 10, 20, 30, and 40 t ha−1) on soil physicochemical properties, microbial community, vegetable yield, and nitrogen use efficiency (NUE) in a 2-year field experiment in Southern China. The results showed that the 20 t ha−1 biochar treatment elicited the most pronounced benefits over two years, significantly enhancing vegetable yields (10%–29%), NUE (18%–160%), nitrogen uptake (14%–33%), and nitrogen partial factor productivity (NPFP, 10%–29%). The effect on enhancing NUE and NPFP was stronger in the second year compared with the first year during intensive vegetable production. Concurrently, biochar substantially enhanced soil structure by increasing water-stable macroaggregates (6%–12%) and geometric mean diameter (14%–38%). Additionally, the application of biochar significantly improved the soil quality index, as evidenced primarily by increases in soil organic carbon, available potassium, and phospholipid fatty acid contents. Random forest and partial least squares path modeling revealed that biochar indirectly influences vegetable yield and NUE by enhancing soil nutrient availability and promoting microbial activity. In conclusion, the 20 t ha−1 biochar treatment was the optimal amendment strategy for sustainable agricultural production in intensive vegetable fields in Southern China.
-
Key words:
- Biochar /
- Soil quality index /
- Nitrogen use efficiency /
- Intensive vegetable field