-
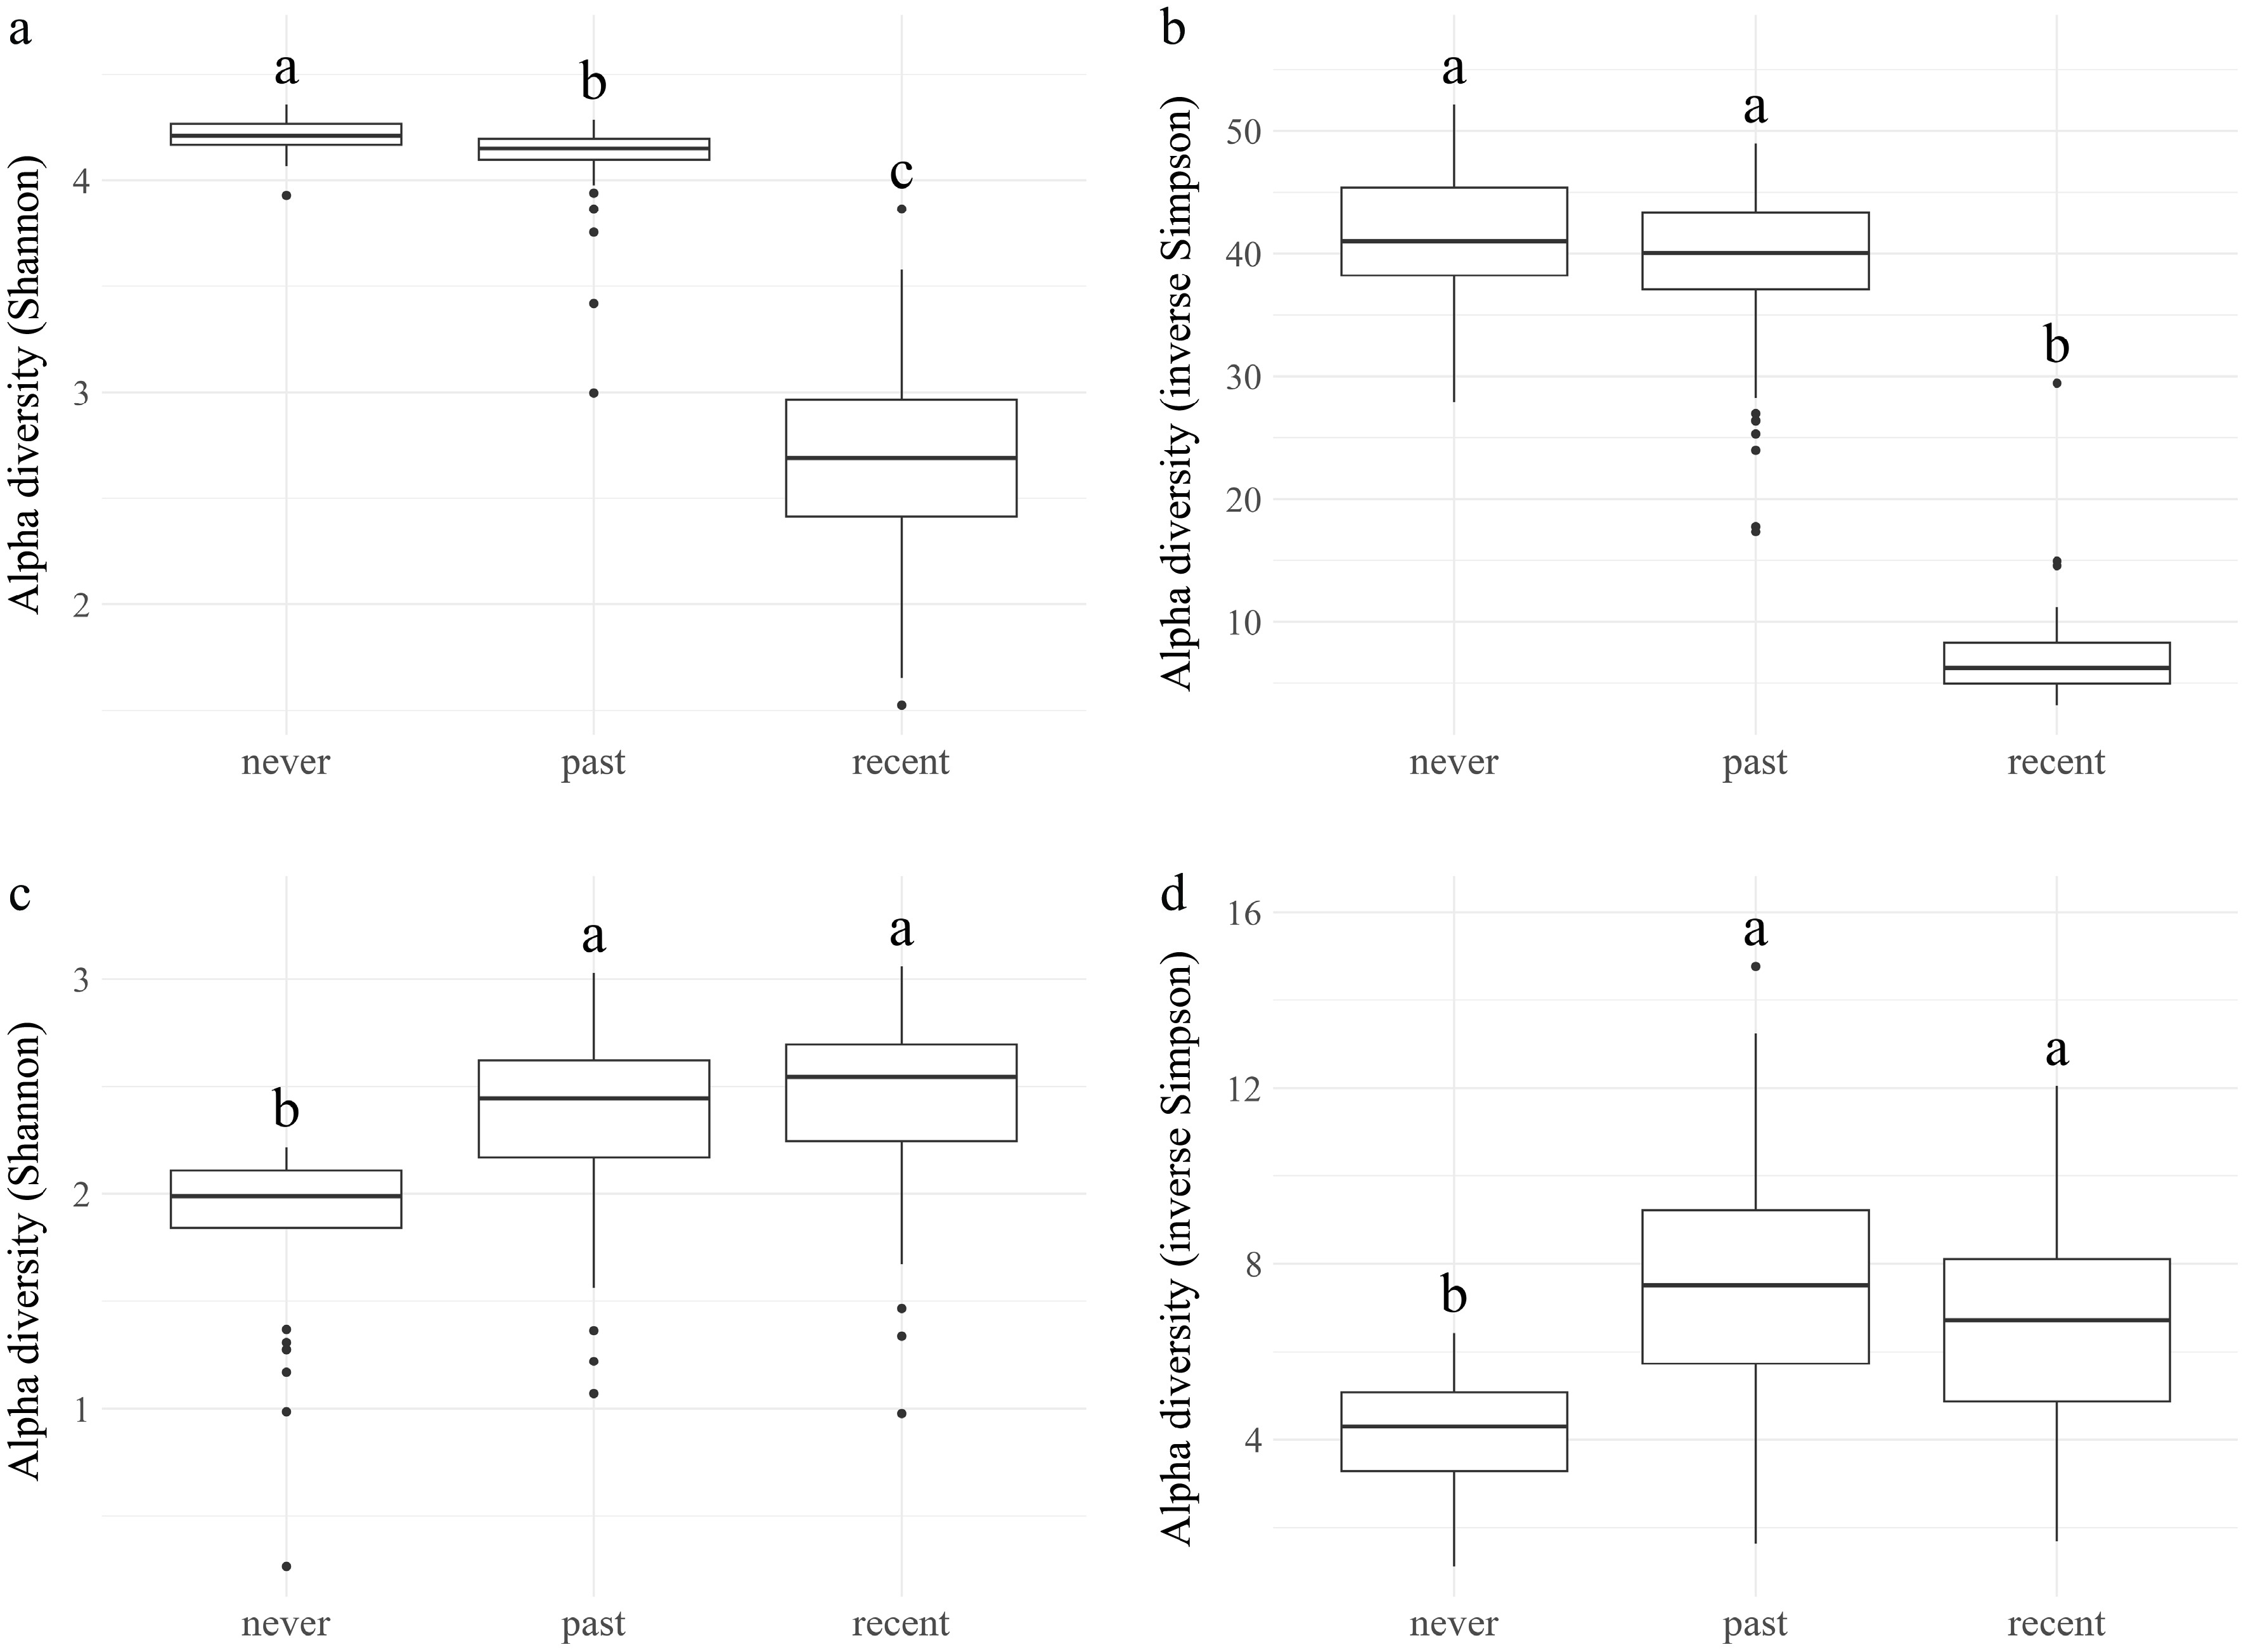
Figure 1.
Alpha diversity within the fumigated putting green by fumigation status. Boxplots show alpha diversity measured by the Shannon index (a, c) and inverse Simpson index (b, d) for bacterial communities at the family level (a, b) and fungal communities at the genus level (c, d), using the putting green's own prefumigation Day 0 samples as the never group. Bacterial diversity was significantly reduced in recently fumigated soils relative to never- and past-fumigated soils, as indicated by both the Shannon (a) and inverse Simpson (b) indices. Fungal diversity was significantly higher in the recent and past phases than in the never group, as indicated by both the Shannon (c) and inverse Simpson (d) indices. Different letters above the boxplots indicate significant differences by Dunn's test with Bonferroni correction, p < 0.05.
-
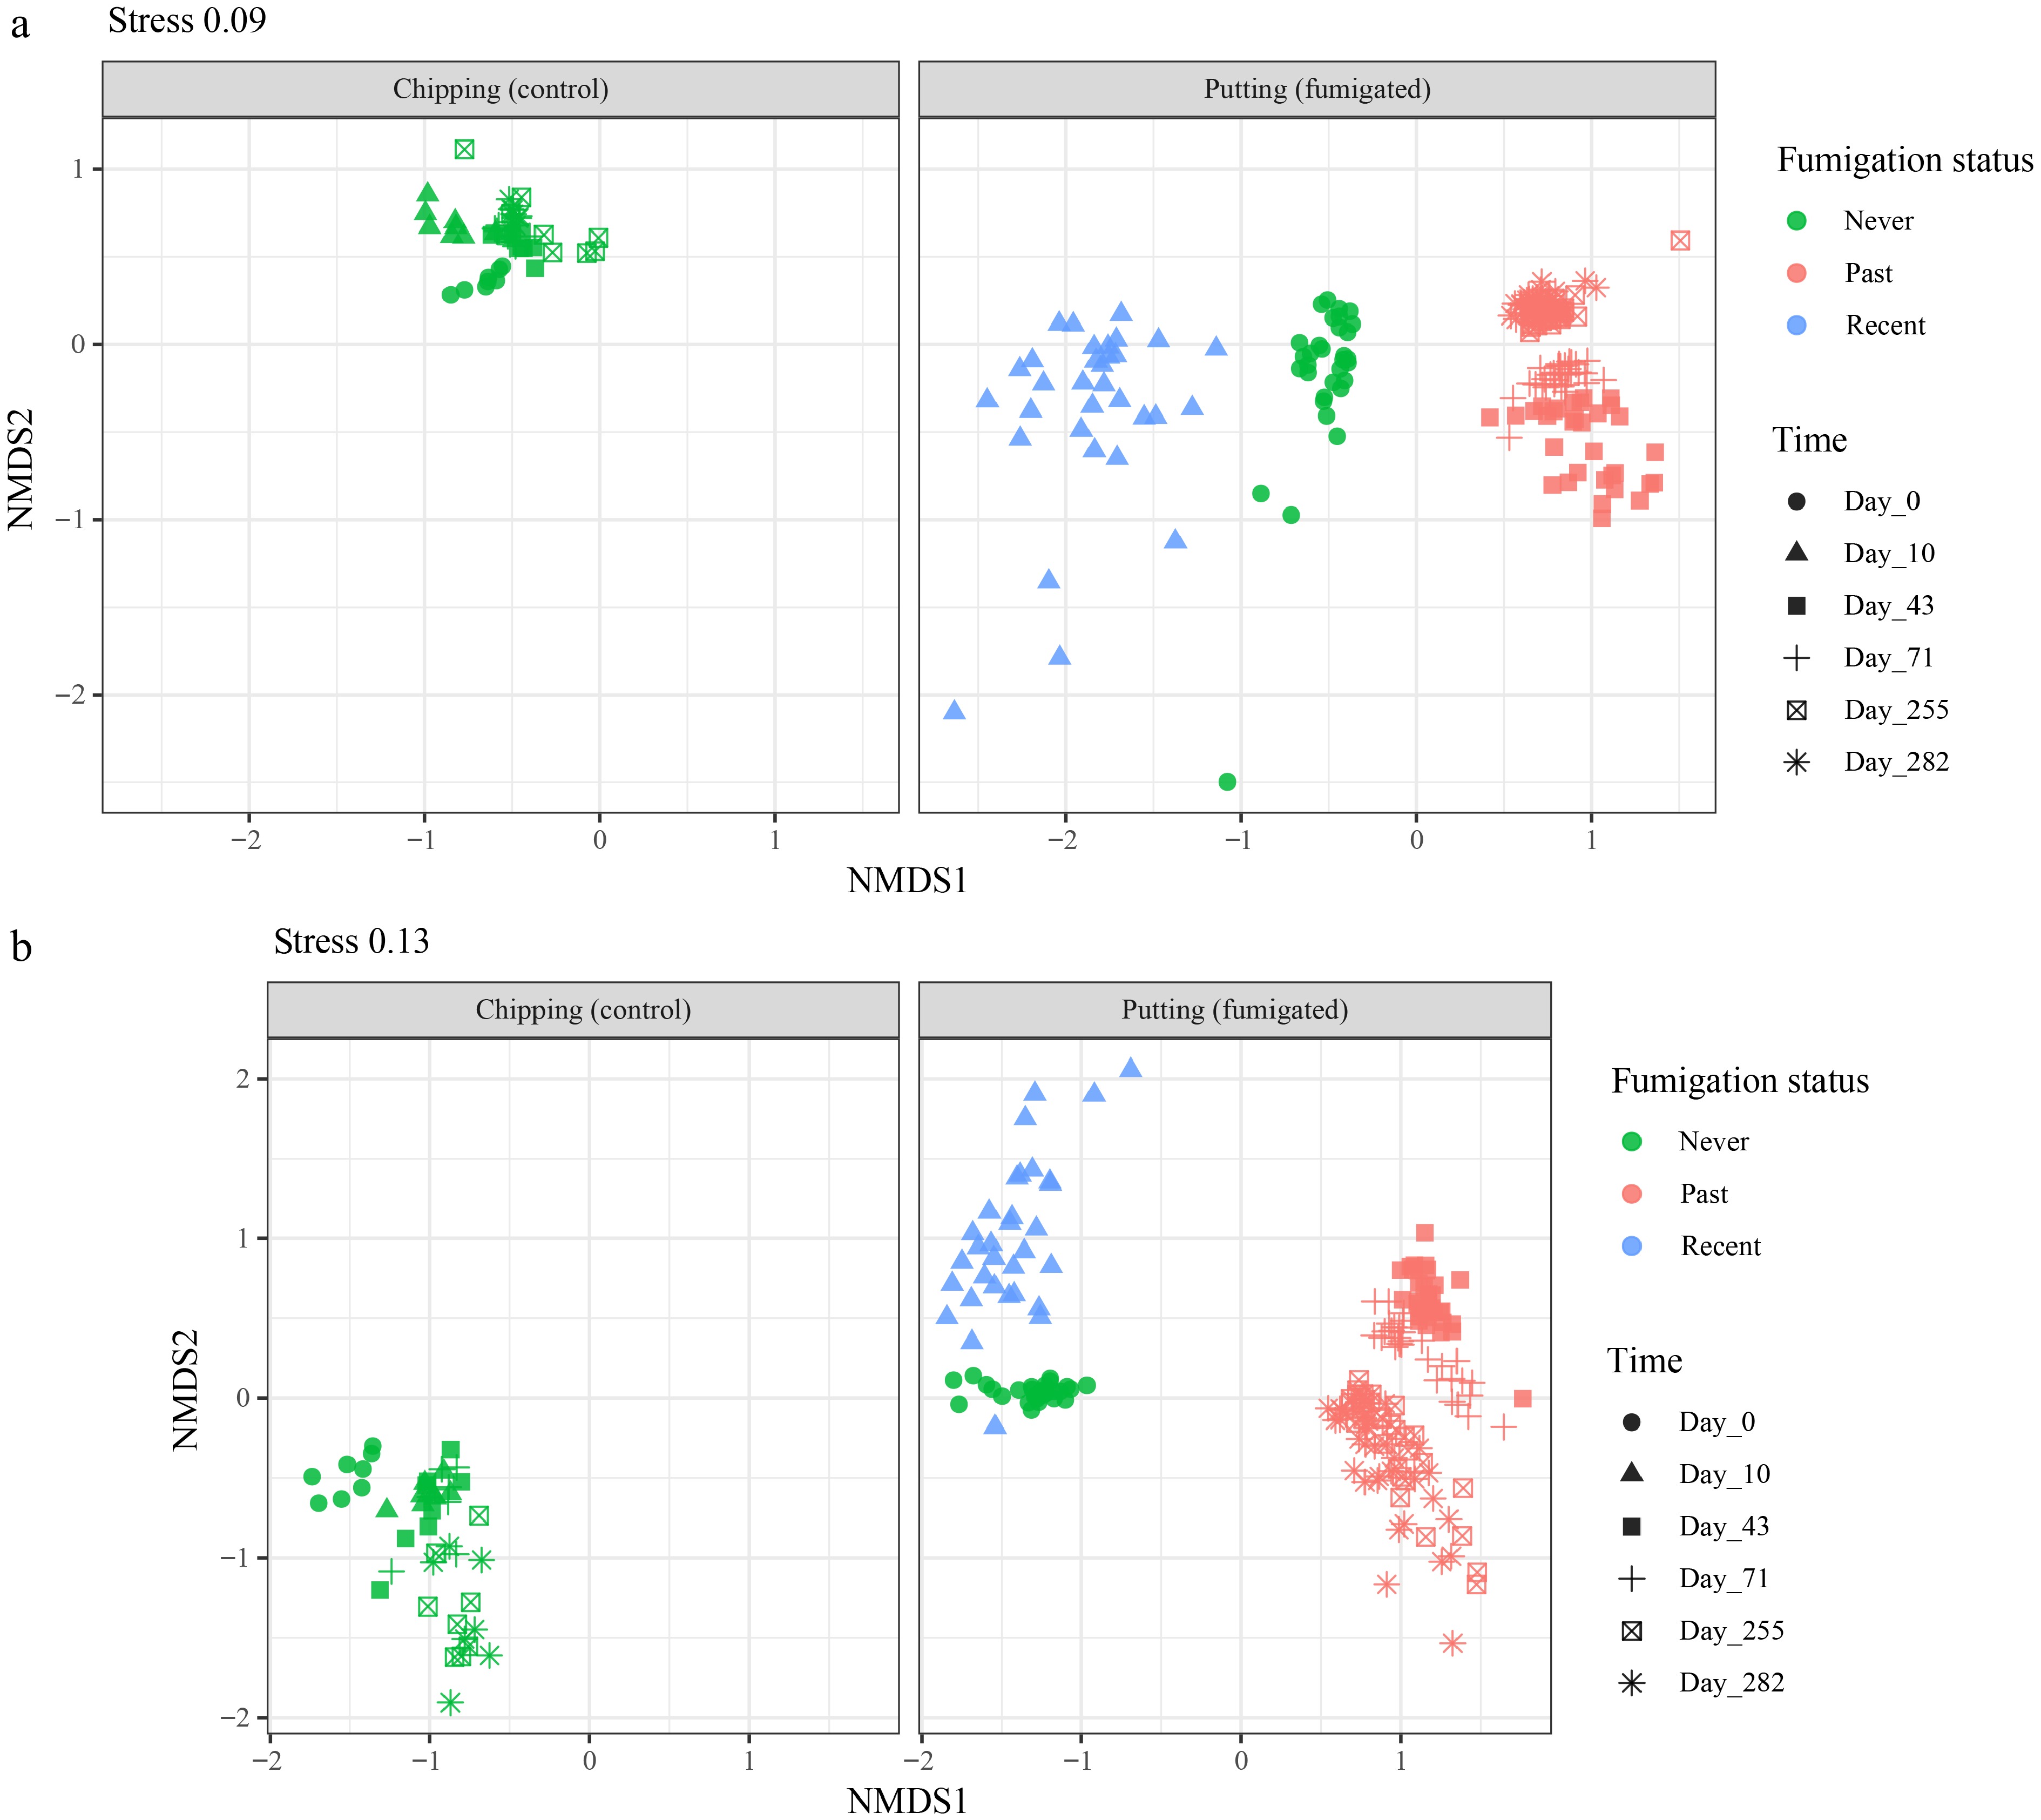
Figure 2.
NMDS of community composition for bacteria (a) and fungi (b), based on Bray–Curtis distances. Each panel shows one joint ordination split into the never-fumigated chipping control and the fumigated putting green on common axes, with points colored by fumigation status and shaped by sampling date. The never-fumigated control clusters tightly across all dates, whereas the fumigated putting green spreads widely and is most displaced just after fumigation at Day 10. Within the putting green, the fall samples at Day 43 and Day 71 separate from the spring samples at Day 255 and Day 282.
-
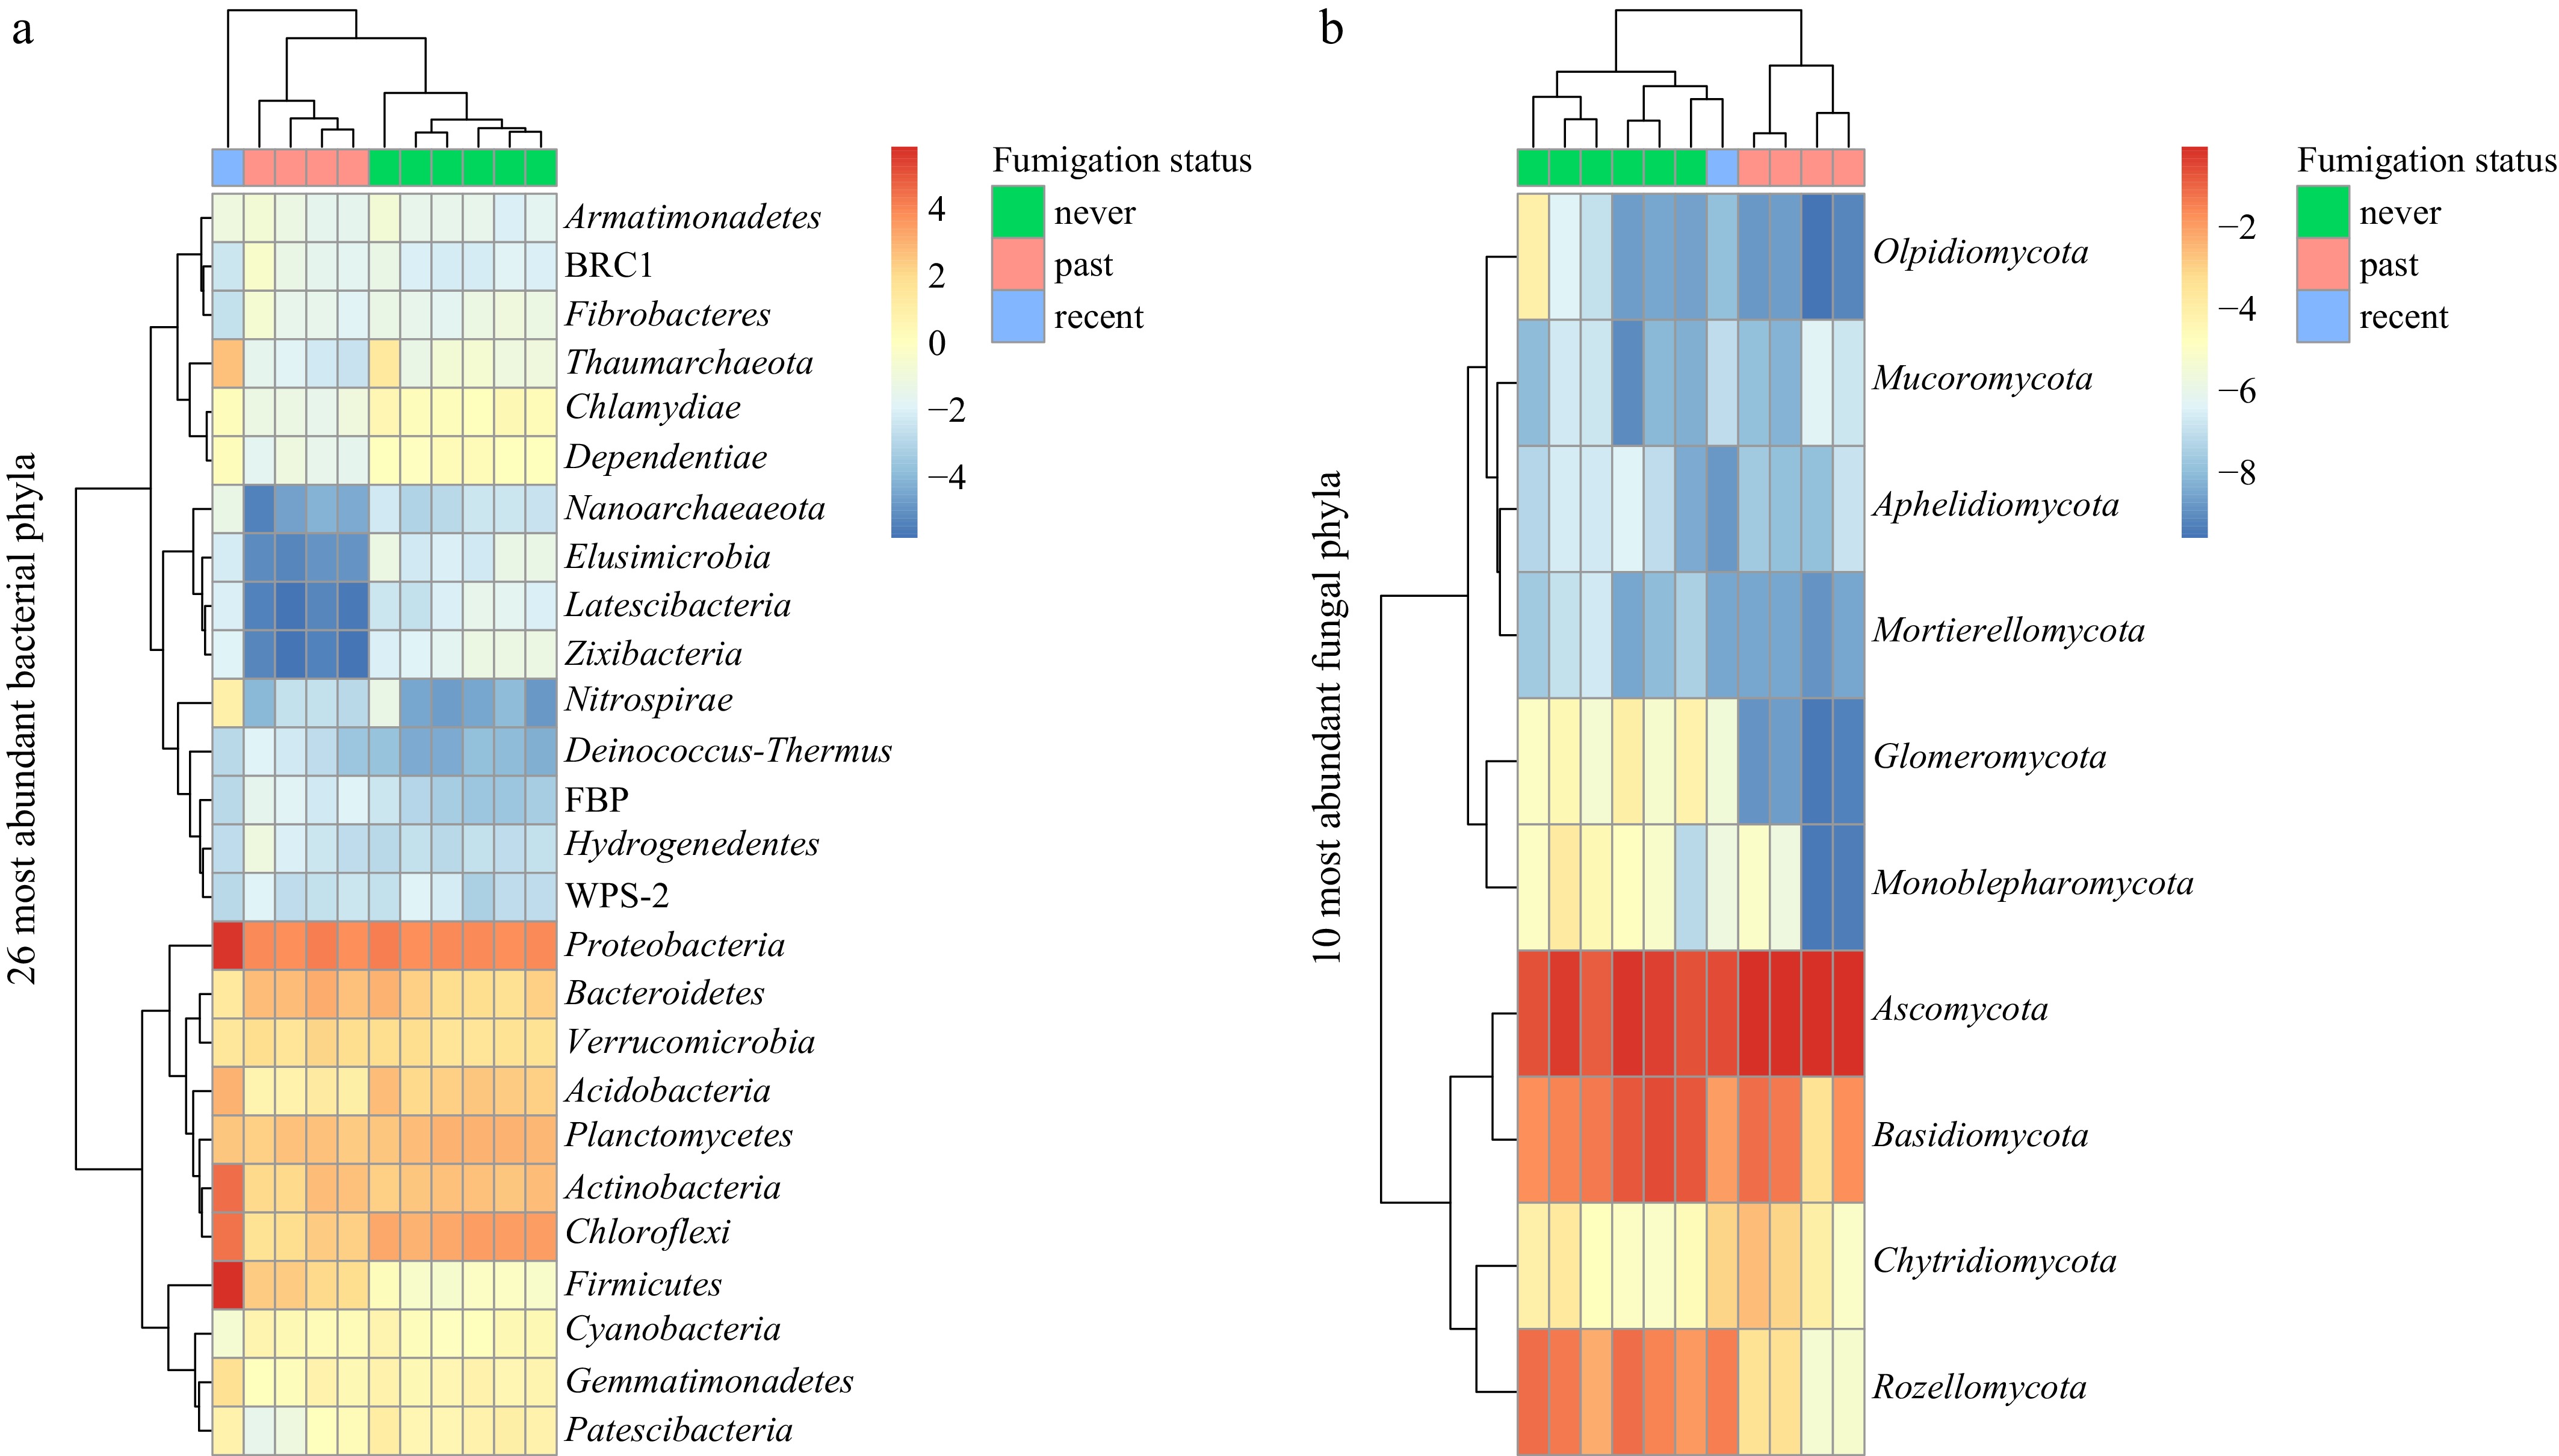
Figure 3.
Microbial community composition of fumigated and nonfumigated soils. (a) Heatmaps showed the relative abundance of bacterial phyla, and (b) heatmaps showed the relative abundance of fungal phyla in never-, past-, and recent-fumigated samples. The heatmaps contain samples on the x-axis and phyla on the y-axis. The dendrograms above each heatmap display hierarchical clustering of samples based on these communities; samples from the same fumigation status tend to end up closer to each other according to the clustering, indicating more similar communities. For each x and y coordinate, the color represents their relative abundance (red: more abundant; blue: less abundant).
-
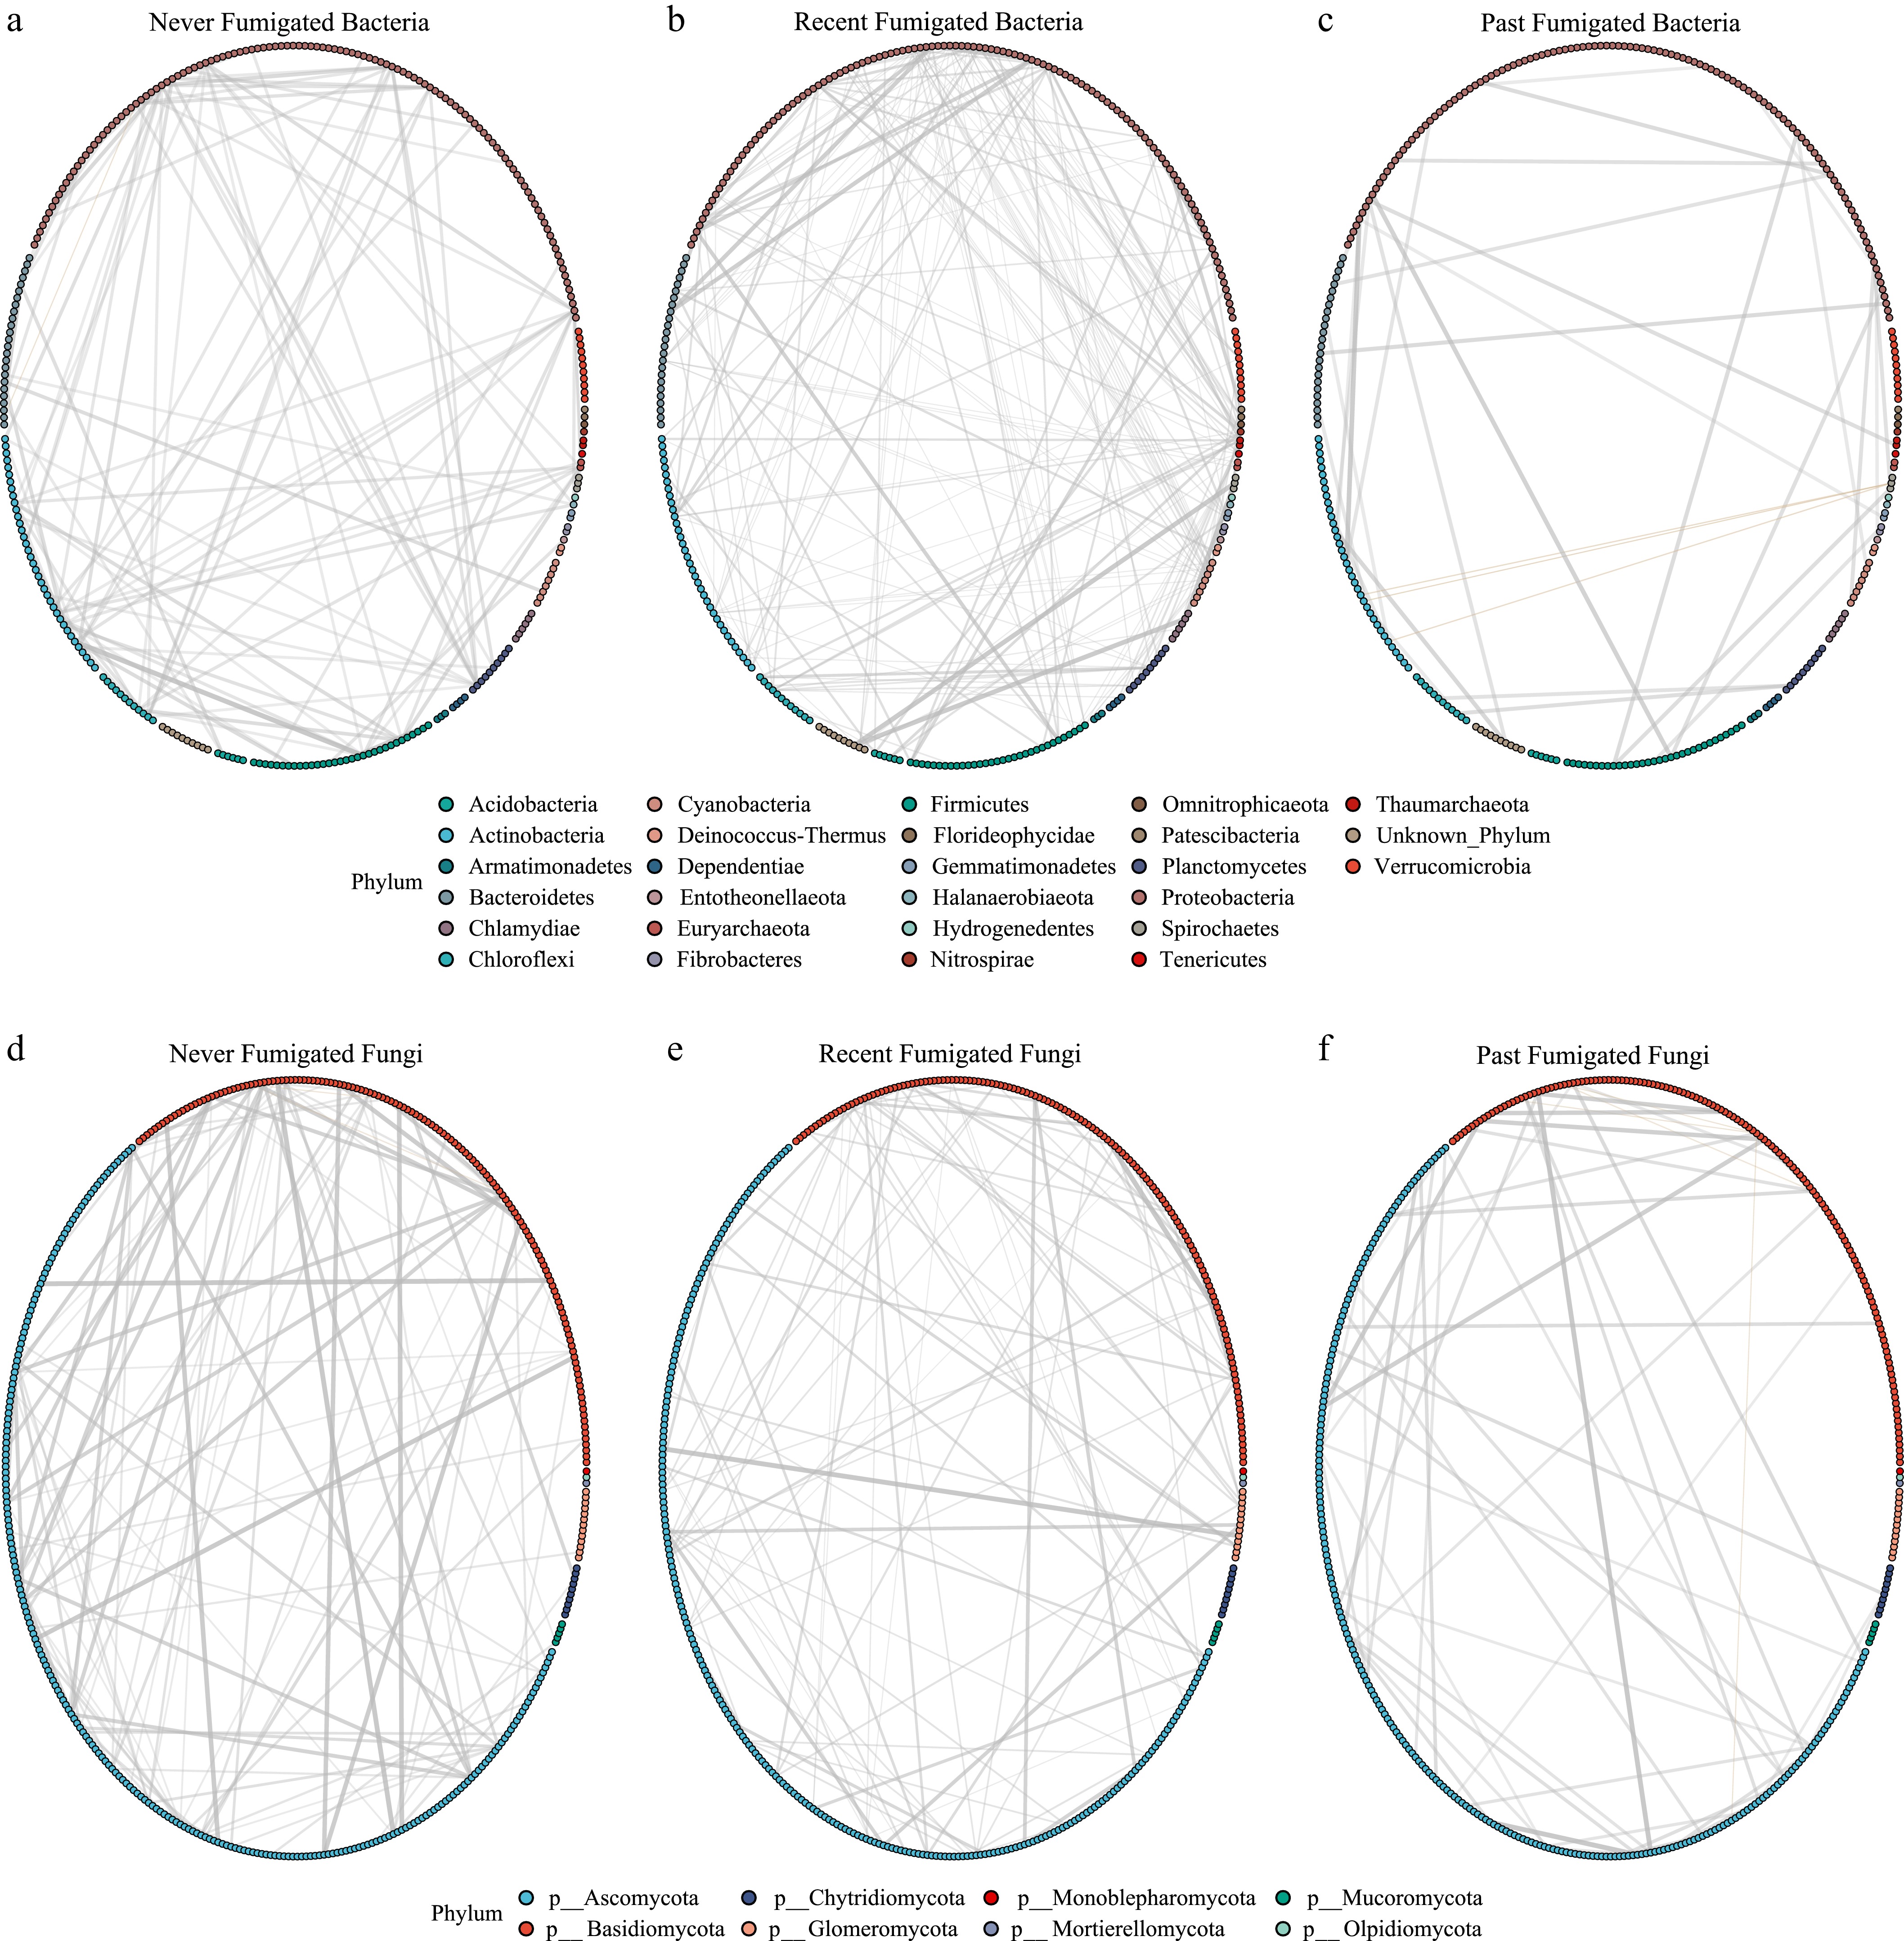
Figure 4.
Co-occurrence networks of microbial communities in fumigated and nonfumigated soils at the OTU level. Bacterial networks represent samples from soils that were never fumigated (a), recently fumigated (b), and past fumigated (c), and fungal networks represent samples from never-fumigated (d), recently fumigated (e), and past-fumigated soils (f). Each node represents an OTU colored by phylum, and edges indicate significant co-occurrence relationships. Variations in network complexity and connectivity across fumigation treatments highlight shifts in microbial community interactions influenced by fumigation history. Both bacterial and fungal diversity showed clear variation in the recent-fumigated soils as compared with nonfumigated and past-fumigated soils.
-
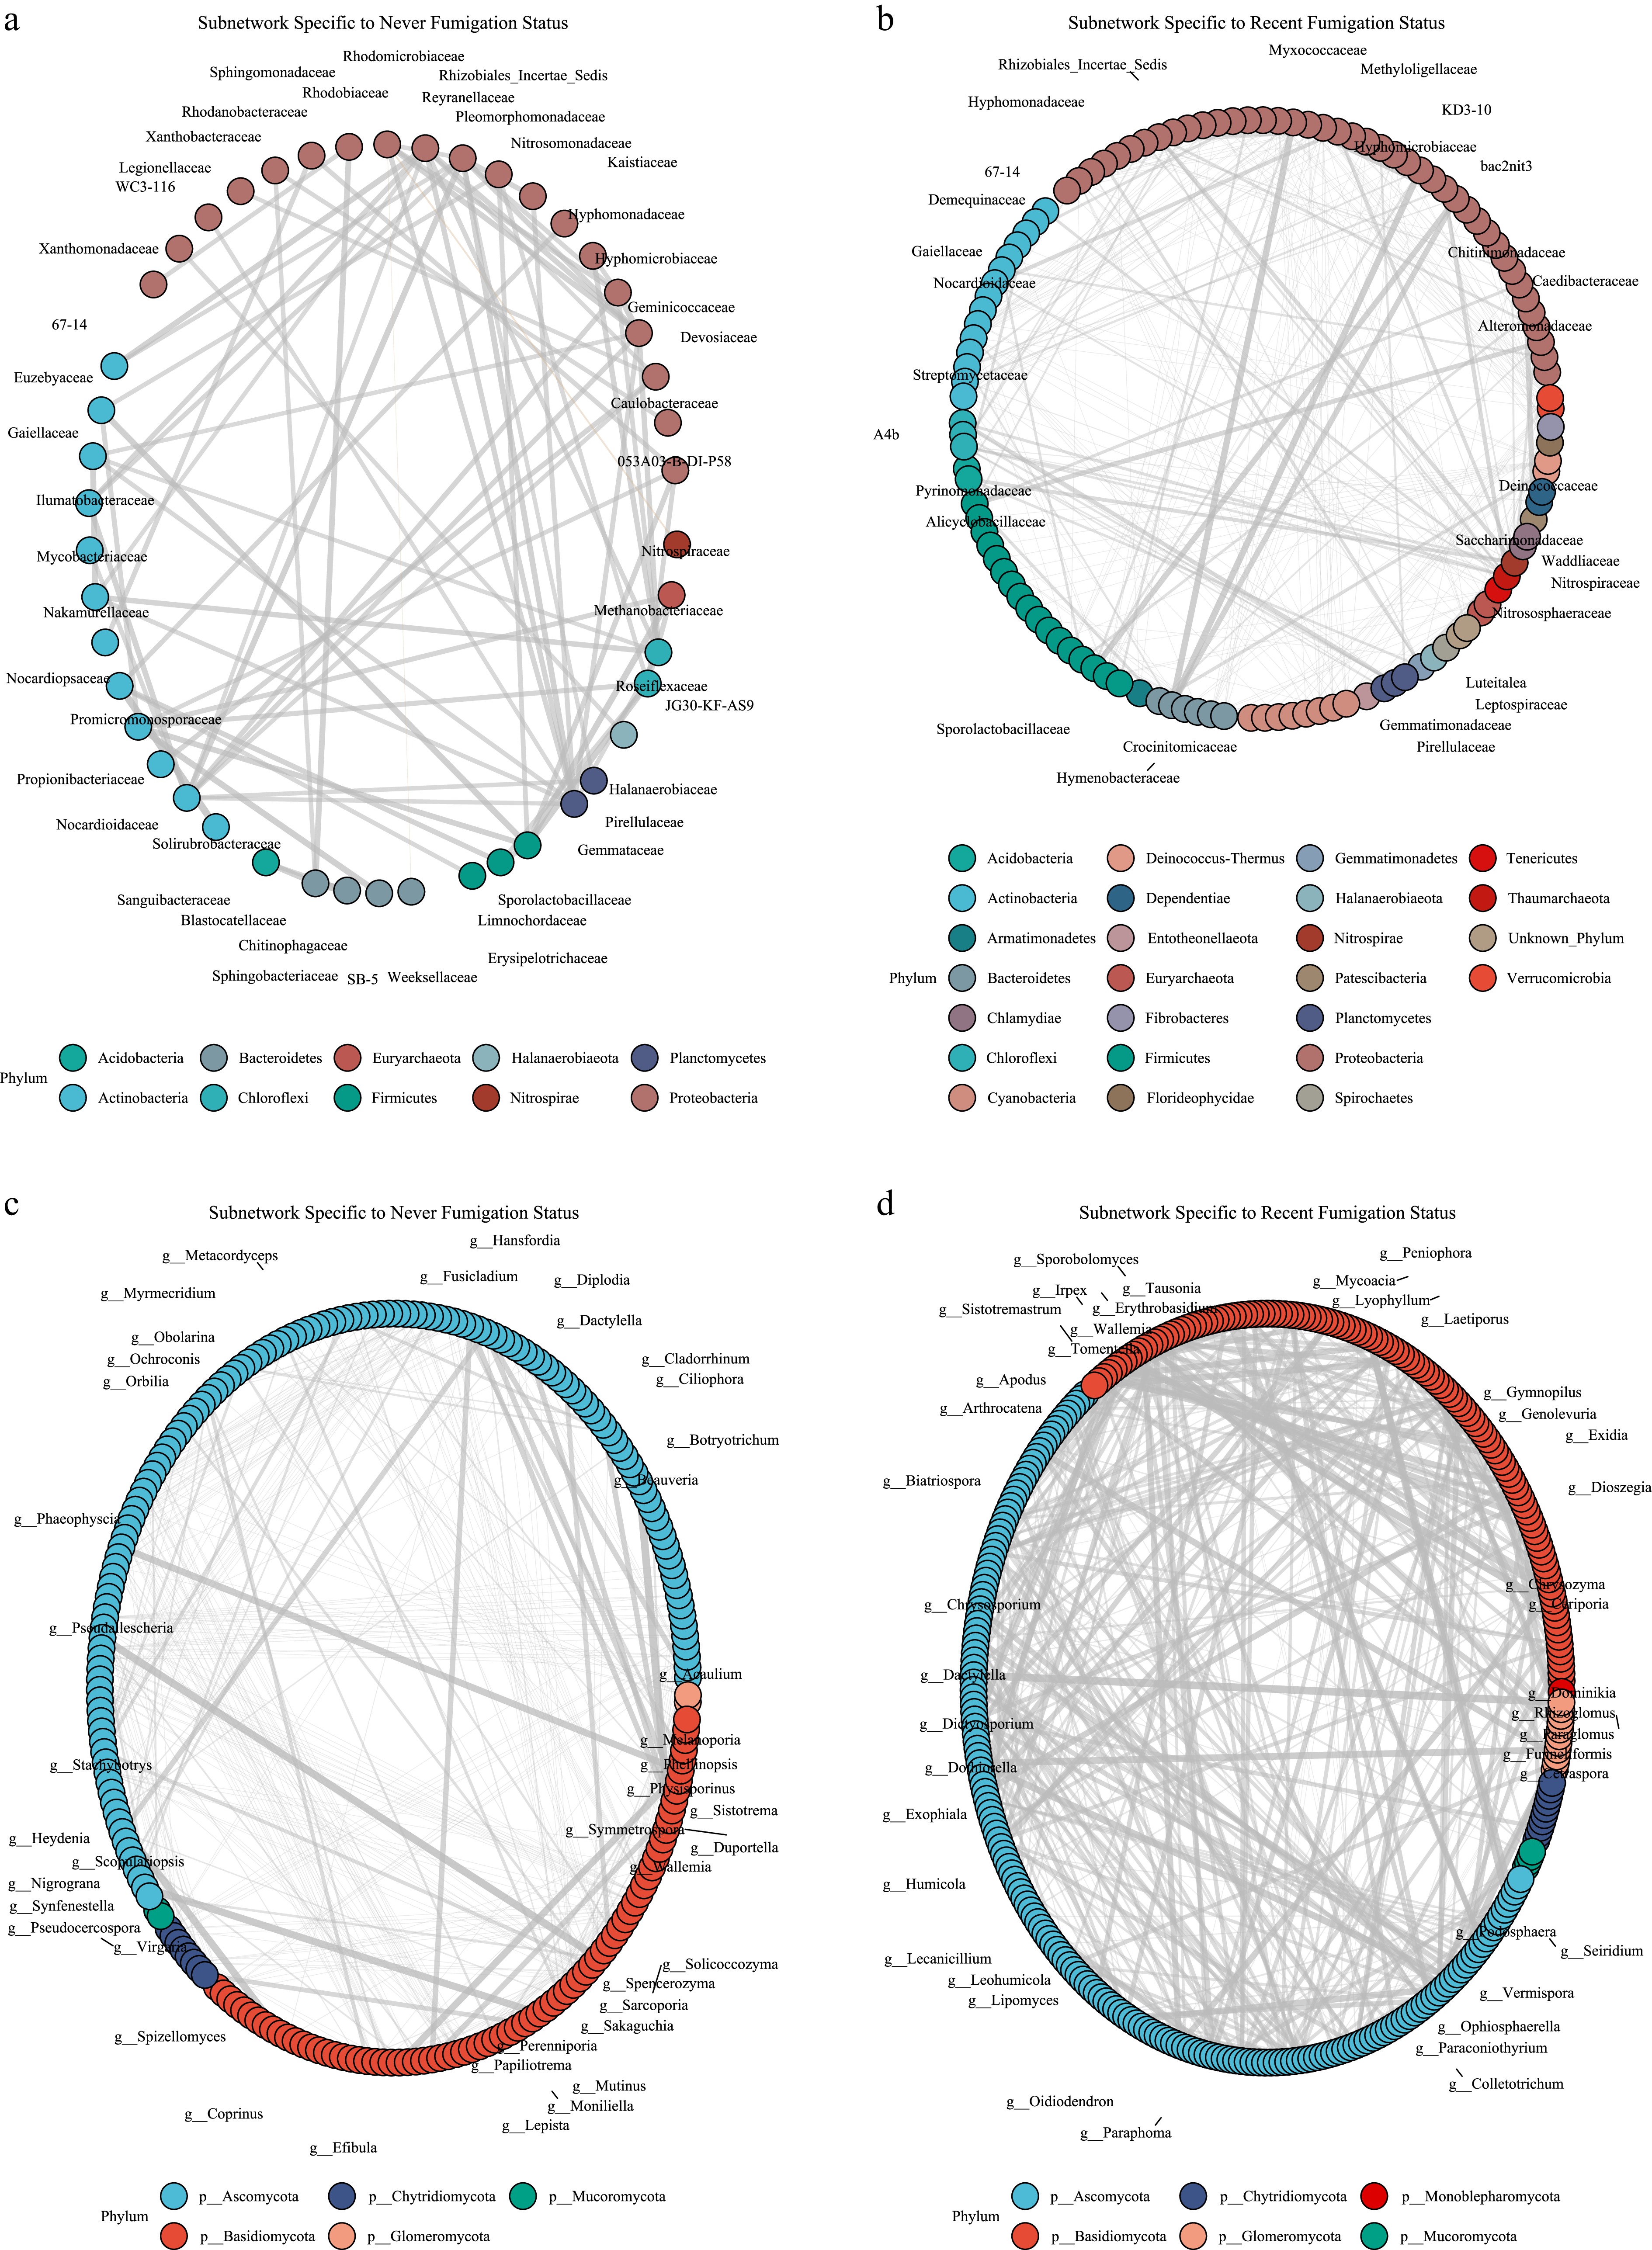
Figure 5.
Microbial co-occurrence subnetworks of bacterial families and fungal genera across fumigated and nonfumigated soils. Each circular network represents a unique subset of microbial interactions: (a) bacterial families specific to never fumigated, (b) bacterial families specific to recent fumigation, (c) fungal genera specific to never fumigated, and (d) fungal genera specific to recent fumigation. Nodes represent taxa, and edges represent interactions between the taxa (positive or negative). Recent-fumigated soils showed a difference in both bacterial and fungal taxa distribution as compared with nonfumigated and past-fumigated soils.
-
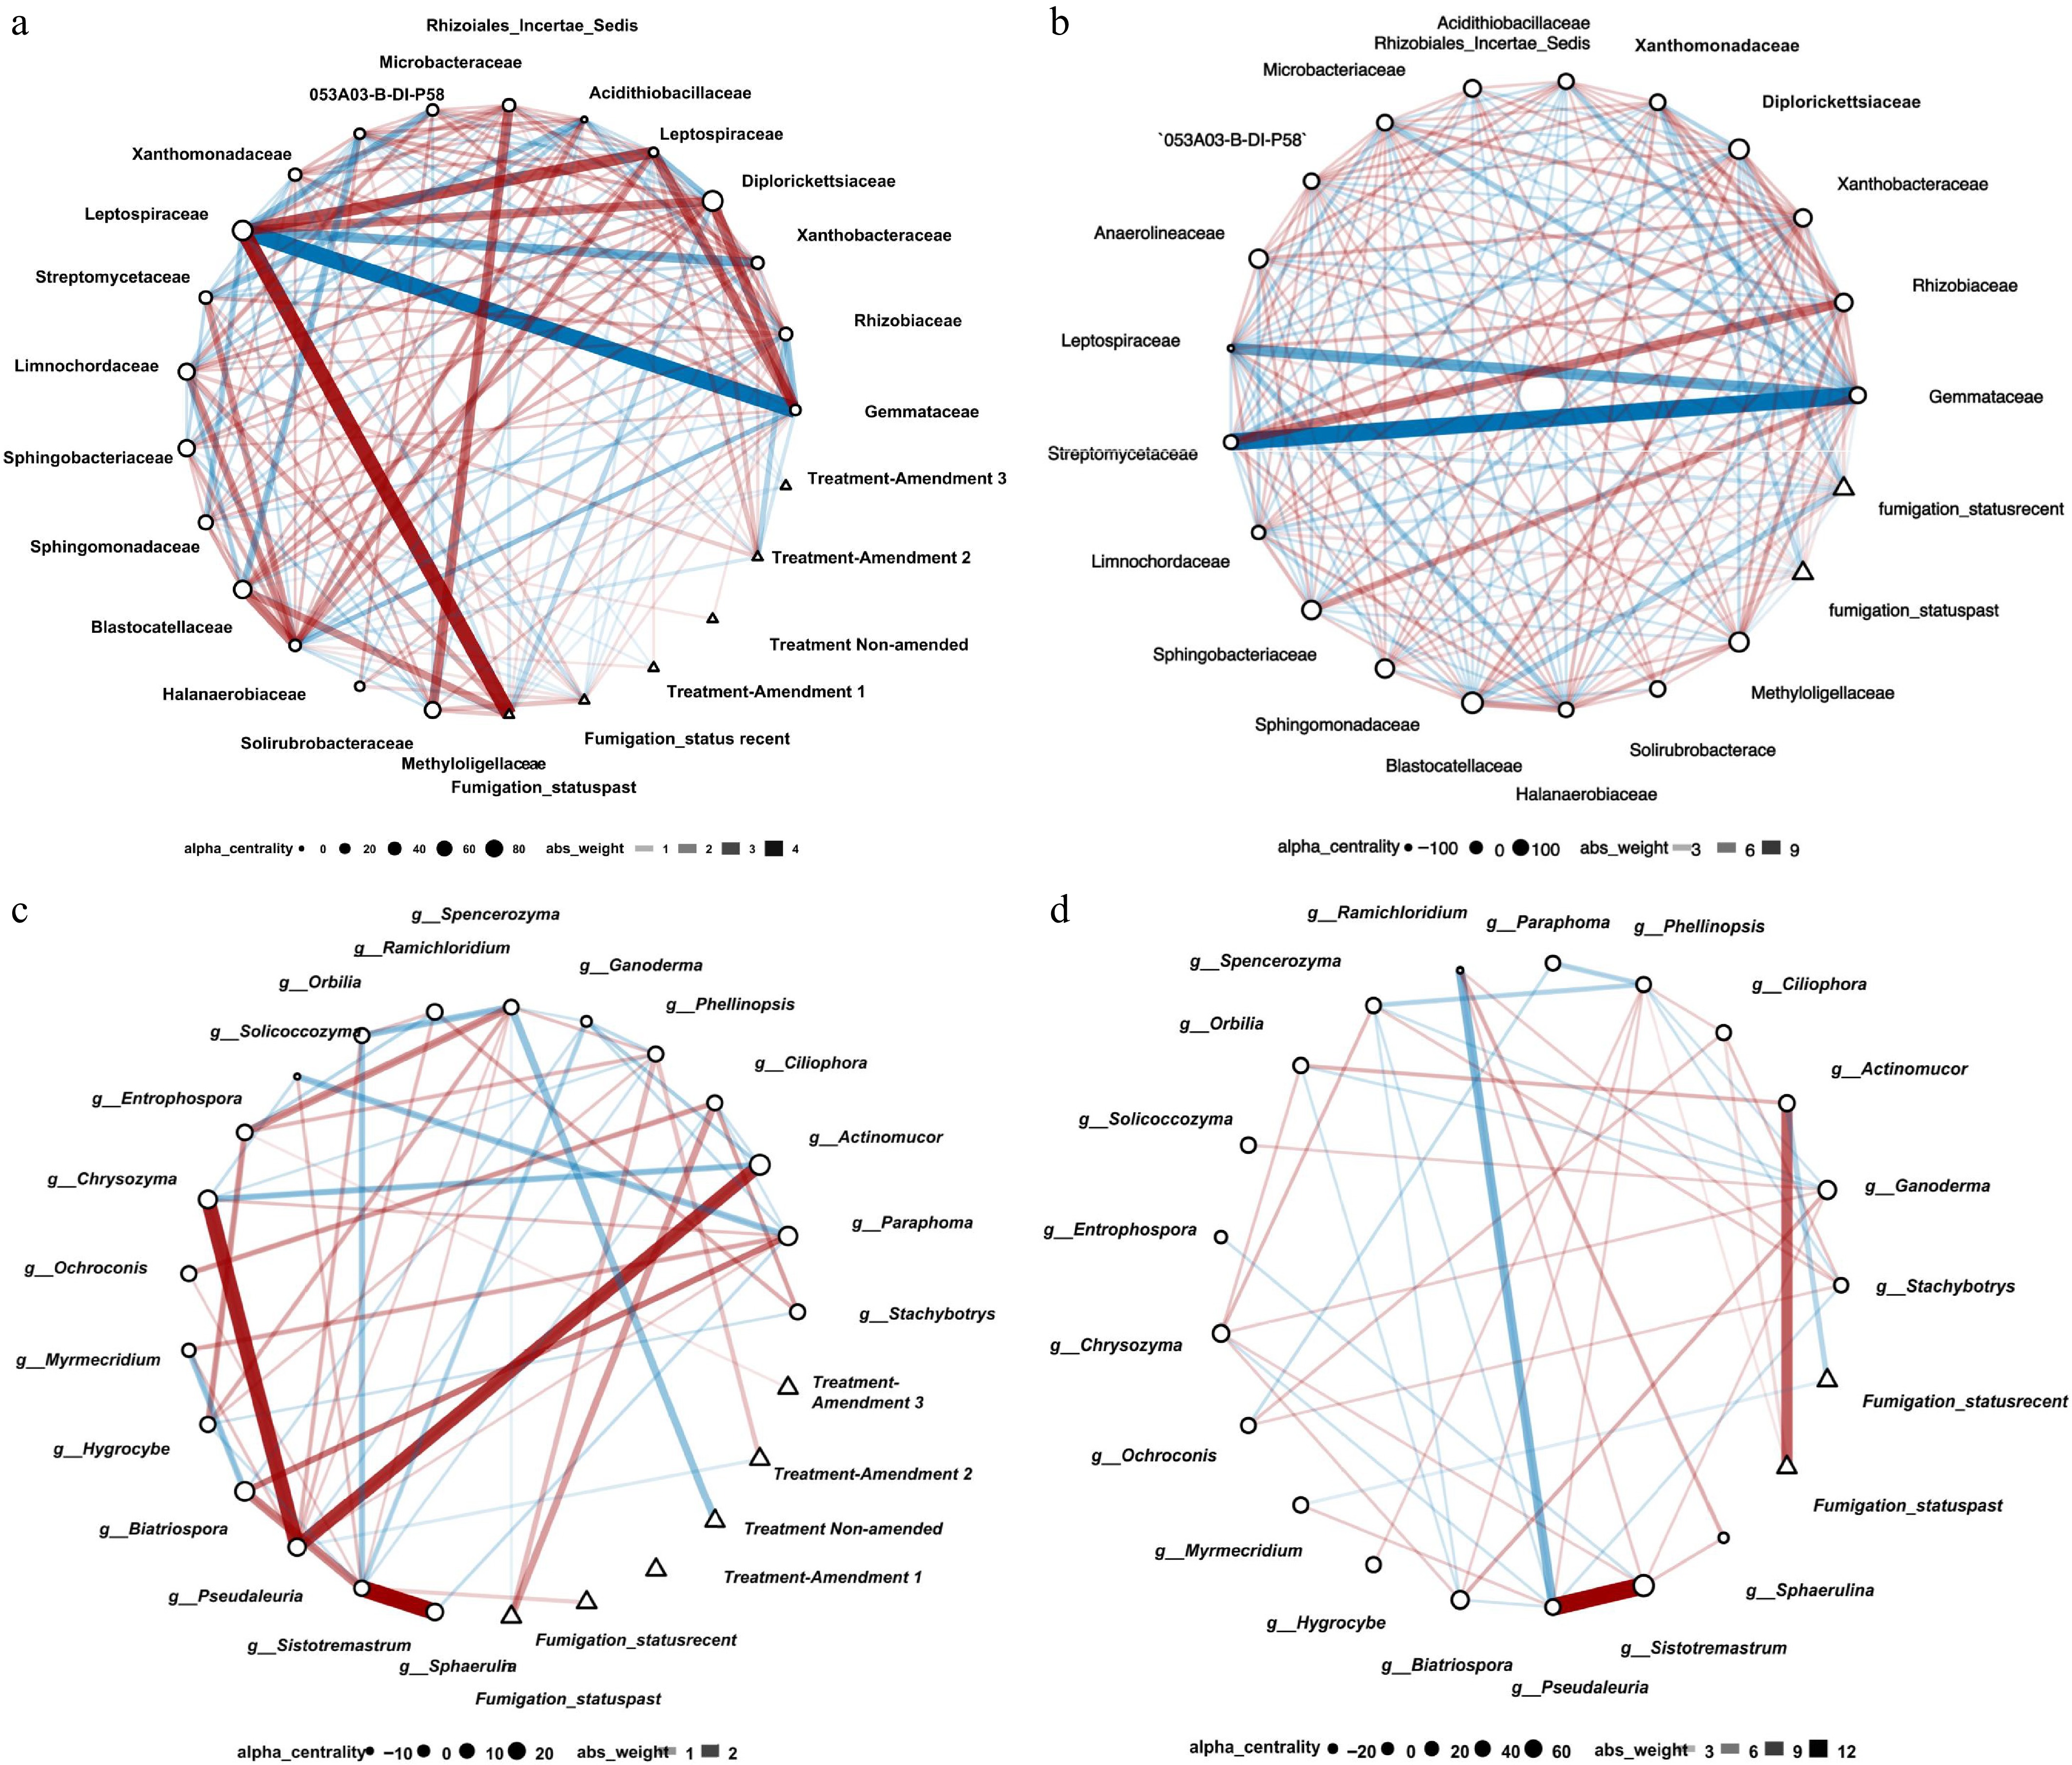
Figure 6.
Network analysis among 20 most differed bacterial and fungal taxa as responses using CARlasso chain graph model with fumigation status and treatment as predictors (a, c) or only fumigation status (b, d). Predictors are represented as triangle nodes, and responses are represented as circle nodes. Red edges mean positive interactions, and blue edges mean negative interactions. Edges are also weighted by effect size, with higher weights represented by higher opacity and greater width. (a, b) networks showed the interaction among different bacterial taxa and (c, d) showed the interaction among different fungal taxa. Among the bacterial taxa, the strongest effect was shown by Leptospiraceae, which positively correlates with recent fumigation and negatively correlates with Streptomycetaceae and Gemmataceae. Fungal genus Pseudaleuria showed the strongest positive correlation with Actinomucor, Sisotremastrum, and Chrysozyma.
-
Filtering Df Residual Df Explained variance (%) F p (Fp > F) Variable All OTUs 2 237 62.04 193.67 < 0.001 Fumigation status OTUs with abundances ≥ 1,000 2 237 62.50 197.46 < 0.001 Fumigation status OTUs with abundances ≥ 10,000 2 237 63.76 208.46 < 0.001 Fumigation status All OTUs 3 156 1.01 0.53 0.871 Treatment OTUs with abundances ≥ 1,000 3 156 1.01 0.53 0.865 Treatment OTUs with abundances ≥ 10,000 3 156 0.98 0.52 0.878 Treatment Fumigation status groups: never is the prefumigation Day 0 samples together with the never-fumigated chipping green, recent is Day 10, past is Days 43–282. Treatment is the soil amendment applied to the fumigated putting green: Nonamended, Mirimichi+Swine, Mirimichi+Biosolids, and NSCC House Brew. Fumigation status and Treatment were tested in two separate PERMANOVA analyses. Residual variance is 1 minus the explained variance. Total degrees of freedom are 239 for fumigation status and 159 for treatment. Because the never group combines two fields, the field effect and the site-by-time decomposition are given in Supplementary Tables S14, S15, and S6–S9. Table 1.
PERMANOVA of bacterial community composition on Bray–Curtis distances at the family level, across three abundance filters. Fumigation status and soil amendment treatment were tested in two separate analyses. Fumigation status used all 240 samples. Treatment used the 160 fumigated putting green samples because the never group received no amendment.
-
Filtering Df Residual Df Explained variance (%) F p (Fp > F) Variable All OTUs 2 237 32.94 58.21 < 0.001 Fumigation status OTUs with abundances ≥ 100 2 237 33.13 58.71 < 0.001 Fumigation status OTUs with abundances ≥ 1,000 2 237 33.86 60.67 < 0.001 Fumigation status All OTUs 3 156 1.56 0.82 0.701 Treatment OTUs with abundances ≥ 100 3 156 1.56 0.82 0.733 Treatment OTUs with abundances ≥ 1,000 3 156 1.58 0.83 0.700 Treatment Fumigation status groups are defined as above. Treatment is the soil amendment on the fumigated putting green. The two variables were tested in two separate PERMANOVA analyses. Residual variance is 1 minus the explained variance. Total degrees of freedom are 239 for fumigation status and 159 for treatment. The field effect and site-by-time decomposition are in Supplementary Tables S14, S15, and S6 to S9. Table 2.
PERMANOVA of fungal community composition on Bray–Curtis distances at the genus level, across three abundance filters. Fumigation status and soil amendment treatment were tested in two separate analyses. Fumigation status used all 240 samples. Treatment used the 160 fumigated putting green samples because the never group received no amendment.
Figures
(6)
Tables
(2)