













-
Soil fumigation is a common agricultural practice that provides economic benefits to growers by controlling soilborne pests and pathogens and can increase yields[1−3]. Soil fumigation with methyl bromide had been used to control soilborne pests in multiple economically important crops, such as tobacco, potato, cucumber, tomato, ginger, and turfgrass to eliminate bacterial pathogens such as Pseudomonas and Streptomyces and fungal pathogens such as Rhizoctonia, Pythium, and Phytophthora[4−7]. Additional indirect impacts of methyl bromide fumigation include maximizing pesticide efficacy by inhibiting pesticide degradation by microbes[5]. Although it was phased out in 2005 by the U.S. Environmental Protection Agency due to its effect on ozone layer depletion, stocks of methyl bromide could be used as recently as 2024.
The broad-spectrum toxicity of methyl bromide may also impact nontargeted taxa, including those that are beneficial to plant growth and others involved in soil processes such as nutrient cycling[7−10]. At the same time, the short-term disruption of microbial communities caused by fumigation can lead to opportunistic microorganisms recolonizing, along with a pulse of organic matter degradation, which can sometimes indirectly promote plant growth in the short-term[7,11,12]. However, in the long term, the impact of fumigation on soil microbial communities may include a decrease in the abundance of key bacterial and fungal species involved in critical soil processes, such as nutrient cycling and pathogen suppression, ultimately leading to a decline in plant health[13−15]. Dangi et al.[4] reported that the long-term effects of methyl bromide and chloropicrin include a decline of Actinobacteria, Firmicutes, and arbuscular mycorrhizal fungi. Methyl bromide fumigation eliminated Agrobacterium tumefaciens populations in buried gall tissue. However, it also reduced overall aerobic bacterial populations and induced dysbiosis in soil microbial communities. This dysbiosis was characterized by a disrupted microbial balance and reduced microbial diversity, which may impair soil health and potentially increase susceptibility to soilborne pathogens[16]. These alterations in the soil microbial community caused by fumigation may signal shifts in key soil processes and functions that ultimately affect agricultural productivity.
Common soil amendments, such as biochar, biosolids, minerals, and manure, can improve soil health and plant productivity by increasing soil organic matter and short- and long-term nutrient availability, reducing moisture loss through evaporation and runoff, suppressing soilborne diseases, and enhancing plant tolerance to diseases[17−19]. Soil amendments also affect the abundance and community composition of microbes that facilitate plant health and productivity[20,21]. However, soil amendments do not always provide such clear benefits. Stacey et al.[22] found no lasting effect of soil amendments on the soil microbiome of amenity turfgrass. Sennett et al. employed a niche-clearing strategy by fumigating the soil before the addition of plant residues to enhance the effectiveness of soil amendments. This approach had a greater impact on microbial diversity and community composition than the addition of plant residues alone[23]. This can be explained by the priority effect, where survival and establishment of an exogenously introduced community are impeded by the inhabiting community[24]. Following this logic, the introduction of the new microbial community was more successful after clearing out the established community.
In this study, we hypothesized that soil amendments have a stronger influence on the soil microbiome when applied subsequently after niche clearing with methyl bromide. Fumigation by methyl bromide and subsequent applications of various soil amendment mixtures, including a mixture of commercial biosolids, commercial swine manure, and a mixture of numerous biological substances, were employed to test the hypothesis on a commercial golf course putting green. Soil samples were collected at six different time points up to 255 days after the fumigation event, and the bacterial and fungal communities in each sample were analyzed using 16S rRNA and ITS gene metabarcoding. We subsequently analyzed the microbiome data using heatmap visualizations, dimensionality reduction, statistical testing for differential abundances and diversity, and microbial network construction to evaluate the effects of fumigation and soil amendments on soil bacterial and fungal communities over time.
-
The experiment was conducted at the Knollwood Club in Lake Forest, IL, USA (42.274, −87.882) on a practice putting green and a practice chipping green with a modified sand-based soil. The experiment was conducted in conjunction with a planned golf course renovation that included soil fumigation with methyl bromide before the U.S. Environmental Protection Agency canceled its registration. Methyl bromide was applied to the putting green site on August 10, 2016. A nonfumigated comparison area was established on a practice chipping green located approximately 45 m from the fumigated site. Following fumigation, "Pure Distinction" creeping bentgrass (Agrostis stolonifera) was seeded on August 18, 2016, at a rate of 73.24 kg ha−1.
To evaluate the effects of soil amendments on microbial community recovery following fumigation, an amendment experiment was established on the fumigated putting green. The experimental design was a randomized complete block design with four replications and an individual plot size of 1.5 × 1.5 m. Three soil amendment treatments and a nonamended control were evaluated within the fumigated area, while the nonfumigated chipping green served as an additional reference treatment. Soil amendments were applied as a topdressing to the fumigated putting green later that same day. Each amendment was applied by hand using shaker jars to a depth of 6 mm. Amendment 1 consisted of 20% (w/w) Mirimichi Green CarbonizPN Soil Enhancer and 80% kiln-dried fine sand. Amendment 2 consisted of 5% (w/w) Mirimichi Green biochar derived from pine wood scraps, 5% biosolids from the Metropolitan Water Reclamation District of Greater Chicago, 10% Terravesco vermicompost, and 80% kiln-dried fine sand. Amendment 3 consisted of 30% (w/w) of a mixture of 36 commercial biological products (Supplementary Table S1) and 70% kiln-dried fine sand. All amendments were prepared at North Shore Country Club (Glenview, IL, USA) under the supervision of course superintendent Dan Dinelli and transported to the Knollwood Club on the day of application.
Sample collection and DNA extraction
-
Samples were collected to a depth of 10 cm using a 3.5-cm diameter soil probe. Two subsamples were collected from each of the 16 putting green plots, which comprised four amendment treatments by four replicate blocks, and eight samples were collected from the nonfumigated chipping green, for a total of 40 samples at each sampling date. The two subsamples from each plot were processed and analyzed as independent samples. The experimental area was sampled six times, providing a total of 240 samples. The first sampling occurred on August 8, 2 days before the fumigation. Subsequent samplings occurred on August 18, 2016, September 20, 2016, October 18, 2016, April 20, 2017, and May 17, 2017. We grouped samples by fumigation status into three categories: never fumigated (denoted as "never" in the figures and text), including samples collected from grass that was not fumigated or before fumigation; recently fumigated (denoted as "recent"), including samples collected immediately after summer fumigation; and past fumigation (denoted as "past"), including samples collected at least 1 month after fumigation. Samples were placed on ice, immediately driven to the University of Wisconsin-Madison campus (2 h away), and stored in a −80 °C freezer until DNA extraction.
Soil DNA extraction, preparation of libraries for 16S rRNA and ITS genes, and sequencing on an Illumina MiSeq sequencer
-
Genomic DNA was extracted from 0.25 g of soil using a DNeasy PowerLyzer PowerSoil Kit (Qiagen, Hilden, Germany) according to the manufacturer's instructions. The bacterial 16S rRNA gene V4 region was amplified using primers 515F (5′-GTGYCAGCMGCCGCGGTAA-3′) and 806R (5′-GGACTACNVGGGTWTCTAAT-3′)[25,26], whereas the fungal ITS2 region was amplified using primers 5.8S-Fun (5′-AACTTTYRRCAAYGGATCWCT-3′) and ITS4 (5′-TCCTCCGCTTATTGATATGC-3′)[27,28]. Amplifications were performed in 25-µL reactions containing 12.5 µL 2× KAPA HiFi HotStart ReadyMix (Roche, Basel, Switzerland), 0.5 µM of each primer, and 10–20 ng of template DNA. Thermal cycling conditions consisted of an initial denaturation at 95 °C for 3 min, followed by 25 cycles of 98 °C for 20 s, 55 °C for 30 s, and 72 °C for 30 s, with a final extension at 72 °C for 5 min.
Amplicon size was verified by electrophoresis on a 1.5% agarose gel prepared in 1× TAE buffer and stained with GelRed. Target amplicons were excised and purified using a Zymoclean Gel DNA Recovery Kit (Zymo Research, Irvine, CA, USA) to remove residual primers and small fragments. Dual indices and Illumina sequencing adapters were added in a second limited-cycle Polymerase Chain Reaction (PCR) following the Illumina 16S Metagenomic Sequencing Library Preparation protocol. The indexing reaction consisted of eight cycles using KAPA HiFi HotStart ReadyMix under the manufacturer's recommended conditions. Indexed libraries were purified, quantified fluorometrically, normalized using a Mag-Bind® EquiPure Library Normalization Kit (Omega Bio-tek, Norcross, GA, USA), and pooled in equimolar concentrations. The pooled library was assessed for fragment size distribution and concentration before sequencing on an Illumina MiSeq platform using the MiSeq Reagent Kit v3 (Illumina, San Diego, CA, USA) with paired-end chemistry according to the manufacturer's standard amplicon sequencing protocols.
Sequence processing and microbiome data analysis
-
Sequencing reads were demultiplexed with bcl2fastq and processed with DADA2[29] for quality filtering and inference of amplicon sequence variants, which we refer to as Operational Taxonomic Units (OTUs) throughout. Taxonomy was assigned using the SILVA database[30] for bacteria and the UNITE database[31] for fungi, and nontarget sequences were removed. Bacterial and fungal communities were analyzed separately at the family and genus levels, respectively, using relative abundances grouped by fumigation status.
Community composition was visualized with clustered heatmaps in pheatmap[32] after additive log-ratio normalization, including reduced views of the 152 most abundant bacterial families and the 68 most abundant fungal genera, and with nonmetric multidimensional scaling (NMDS) based on rank-based distances using the vegan R package[33]. Alpha diversity was assessed using the Shannon and inverse Simpson indices, and differences were evaluated by Kruskal–Wallis tests followed by Dunn's multiple comparisons with Bonferroni correction[34−36]. For the fumigation effect on alpha diversity, we used the fumigated putting green alone, with its own prefumigation Day 0 samples as the never group, and compared the putting green against the time-matched chipping control using the Wilcoxon rank-sum test. Differences in composition were tested with permutational multivariate analysis of variance (PERMANOVA) on Bray–Curtis dissimilarities[37,38] at three abundance filters: all OTUs, OTUs with at least 1,000 reads, and OTUs with at least 10,000 reads. Fumigation status and soil amendment treatment were tested in separate analyses. Because the never-fumigated samples came from a separate chipping green about 45 m away, we also ran a site-aware analysis: a field effect using the Day 0 prefumigation samples, the effect of sampling date within the fumigated putting green and within the never-fumigated chipping control separately, and a site-by-time interaction on the full data set as a difference-in-differences test.
Microbial interaction networks were inferred separately for each fumigation status using graphical LASSO on centered log-ratio-transformed data[39,40], and the 20 most abundant taxa were further examined with Bayesian chain graph models implemented in CARlasso[41,42]. All analyses were conducted in R[43]. Detailed methods are in the Supplementary File 1, and raw sequencing reads are available in the NCBI Sequence Read Archive under BioProject PRJNA1335563.
-
Sequencing yielded over 4.1 million bacterial 16S reads and 3.0 million fungal ITS reads after quality filtering, with average depths of approximately 17,300 and 12,400 reads per sample and a total of 16,230 bacterial and 6,655 fungal OTUs. Before testing fumigation, we confirmed that the two fields did not differ in fungal alpha diversity at baseline and differed only modestly for bacteria (Supplementary Table S2), and we assessed the fumigation effect within the fumigated putting green using its own prefumigation Day 0 samples as the never group. Bacterial diversity was significantly reduced in recently fumigated soils relative to past- and never-fumigated soils, as shown by both the Shannon and inverse Simpson indices (p < 0.001, Fig. 1a, b, Supplementary Tables S3−S6). For fungi, diversity was lowest before fumigation and significantly higher in the recent and past phases by both indices (p < 0.001, Fig. 1c, d, Supplementary Tables S7−S10). Soil amendments had no significant effect on bacterial or fungal alpha diversity by either index (p > 0.05, Supplementary Fig. S1).
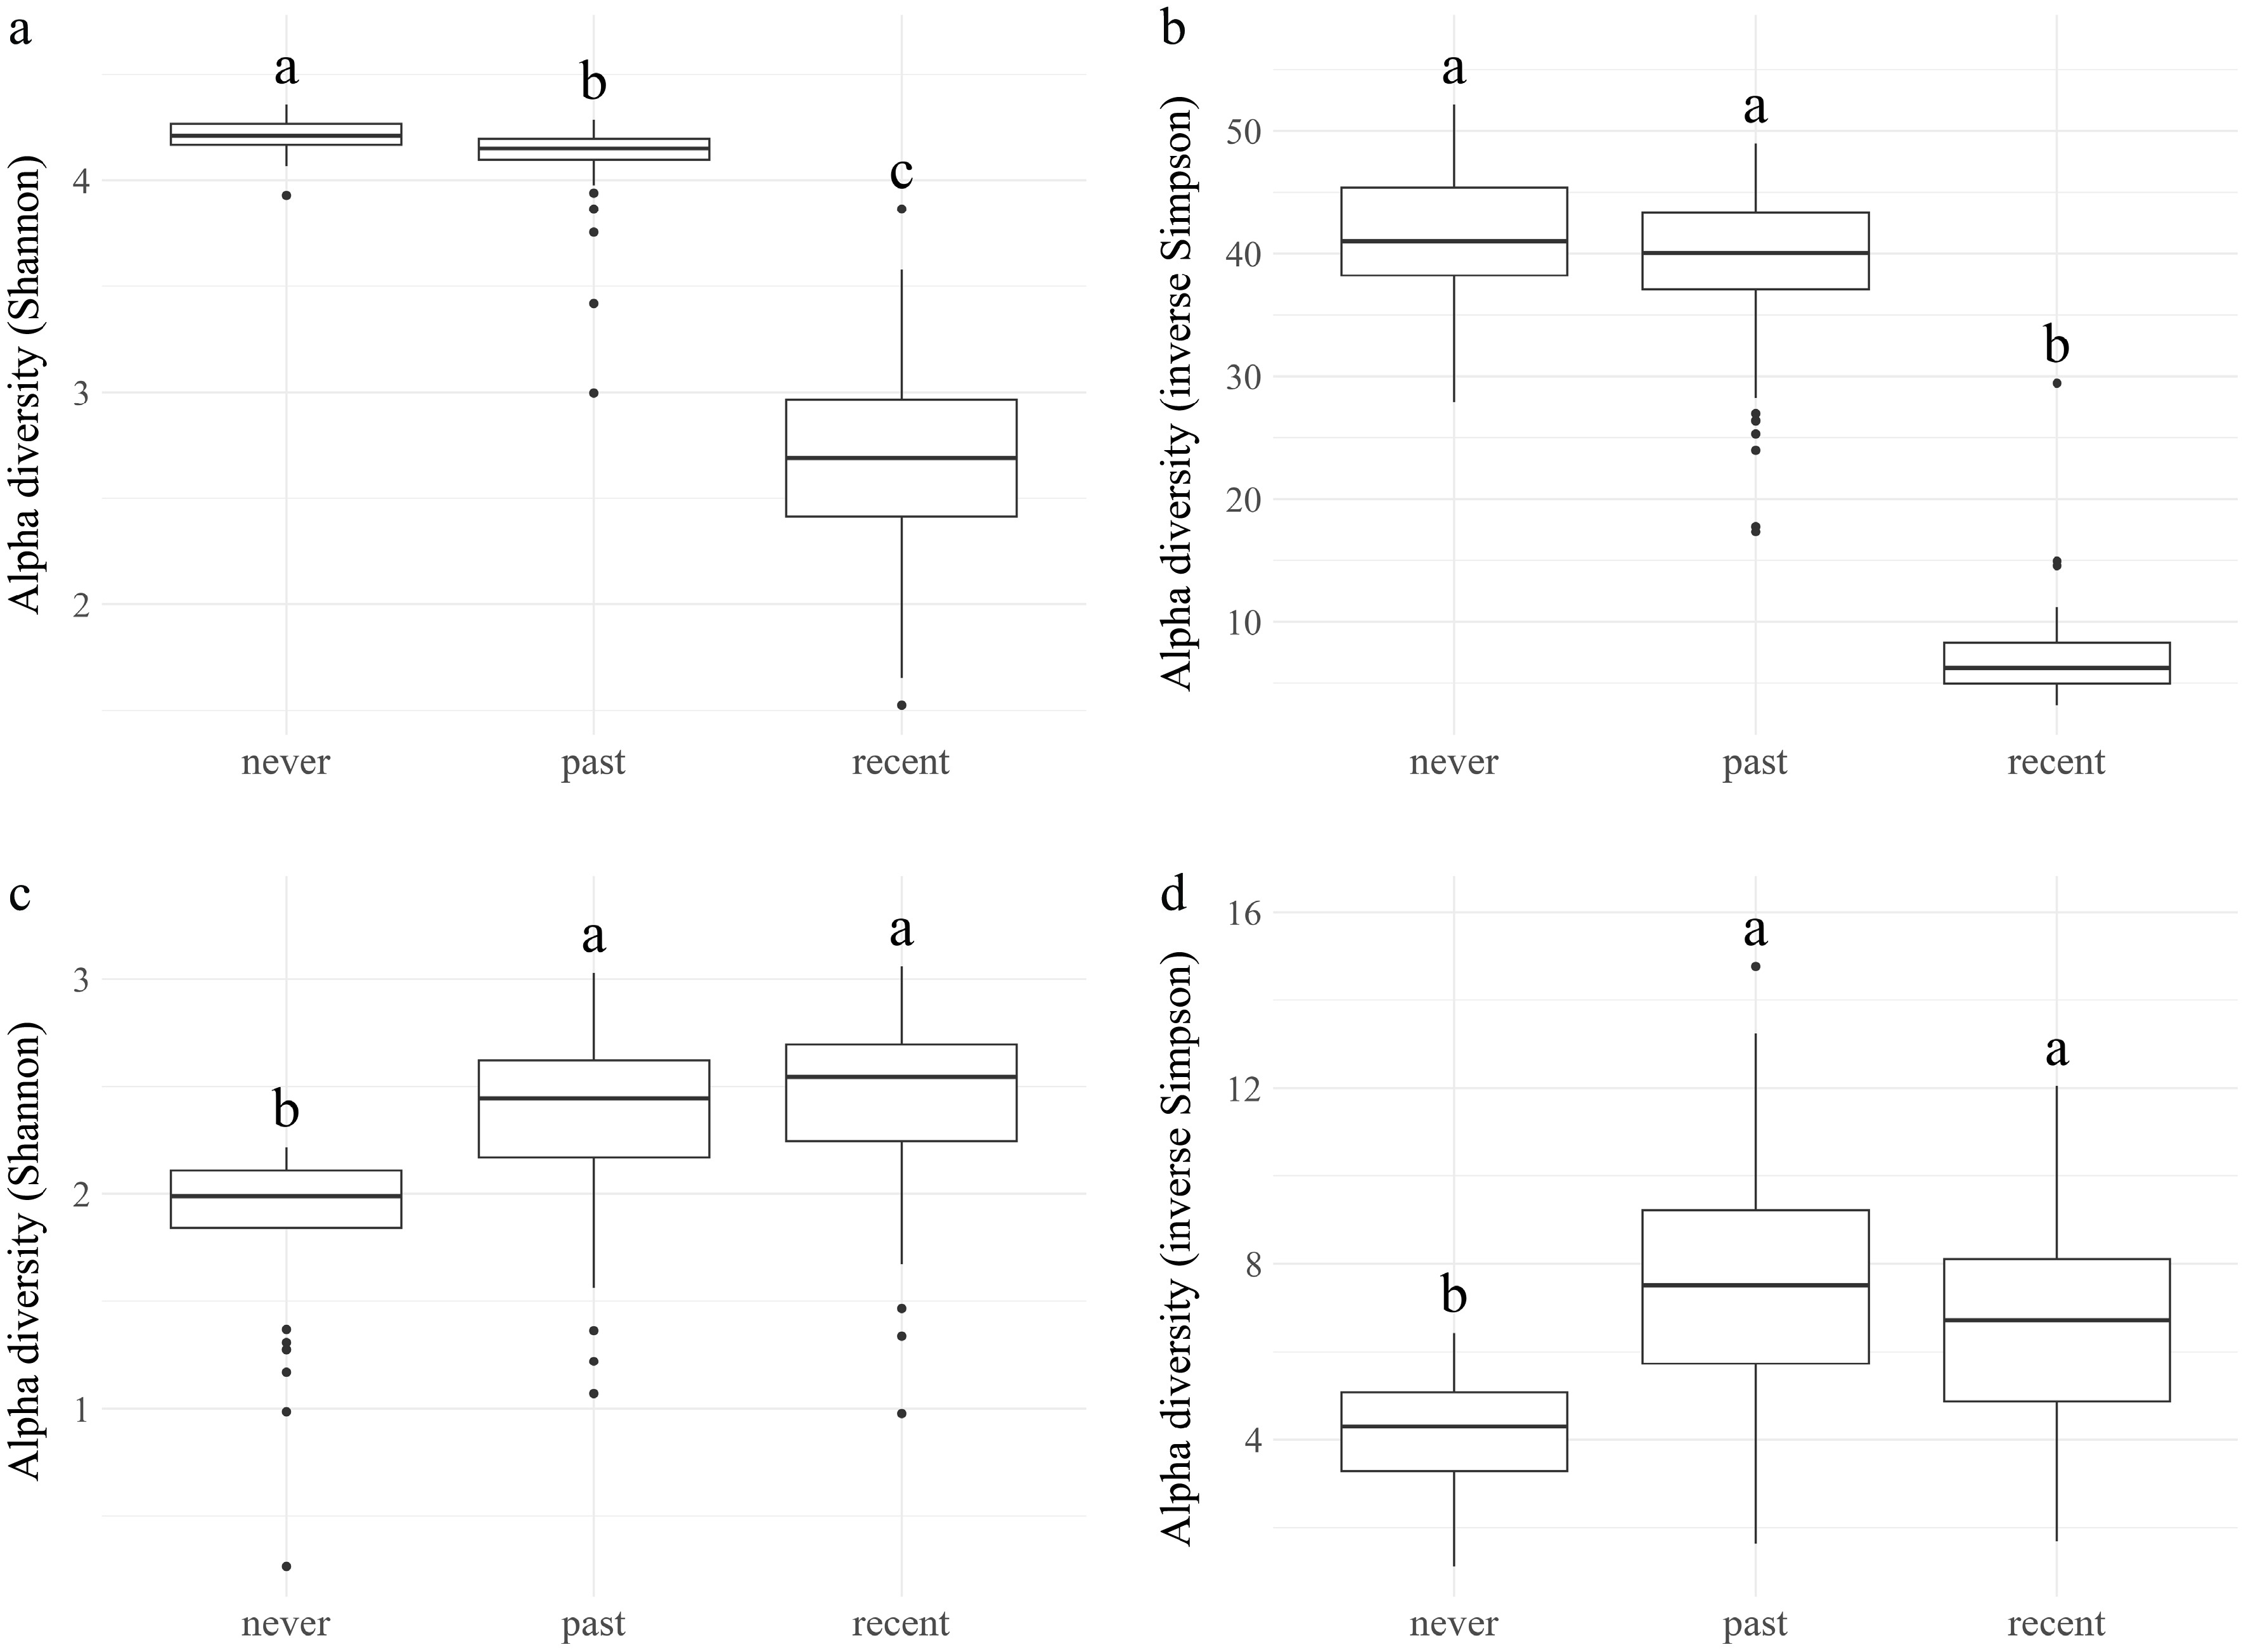
Figure 1.
Alpha diversity within the fumigated putting green by fumigation status. Boxplots show alpha diversity measured by the Shannon index (a, c) and inverse Simpson index (b, d) for bacterial communities at the family level (a, b) and fungal communities at the genus level (c, d), using the putting green's own prefumigation Day 0 samples as the never group. Bacterial diversity was significantly reduced in recently fumigated soils relative to never- and past-fumigated soils, as indicated by both the Shannon (a) and inverse Simpson (b) indices. Fungal diversity was significantly higher in the recent and past phases than in the never group, as indicated by both the Shannon (c) and inverse Simpson (d) indices. Different letters above the boxplots indicate significant differences by Dunn's test with Bonferroni correction, p < 0.05.
Recent-fumigated soils assemble a distinct microbiome
-
We tested community composition using PERMANOVA on Bray–Curtis distances. Fumigation status explained most of the variation in bacterial composition, whereas soil amendments did not (Table 1). Because the never group combines the two fields, we also decomposed the temporal change within each field separately. Within the fumigated putting green, sampling date explained 71%–73% of the bacterial variance, much more than the 42%–45% explained within the never-fumigated chipping control (Supplementary Tables S11, S12). The site-by-time interaction was significant (Supplementary Table S13), indicating that the putting green changed over time differently from the control, rather than following a shared seasonal trend. A comparison of the two fields on Day 0 confirmed a small baseline field difference (Supplementary Table S2).
Table 1. PERMANOVA of bacterial community composition on Bray–Curtis distances at the family level, across three abundance filters. Fumigation status and soil amendment treatment were tested in two separate analyses. Fumigation status used all 240 samples. Treatment used the 160 fumigated putting green samples because the never group received no amendment.
Filtering Df Residual Df Explained variance (%) F p (Fp > F) Variable All OTUs 2 237 62.04 193.67 < 0.001 Fumigation status OTUs with abundances ≥ 1,000 2 237 62.50 197.46 < 0.001 Fumigation status OTUs with abundances ≥ 10,000 2 237 63.76 208.46 < 0.001 Fumigation status All OTUs 3 156 1.01 0.53 0.871 Treatment OTUs with abundances ≥ 1,000 3 156 1.01 0.53 0.865 Treatment OTUs with abundances ≥ 10,000 3 156 0.98 0.52 0.878 Treatment Fumigation status groups: never is the prefumigation Day 0 samples together with the never-fumigated chipping green, recent is Day 10, past is Days 43–282. Treatment is the soil amendment applied to the fumigated putting green: Nonamended, Mirimichi+Swine, Mirimichi+Biosolids, and NSCC House Brew. Fumigation status and Treatment were tested in two separate PERMANOVA analyses. Residual variance is 1 minus the explained variance. Total degrees of freedom are 239 for fumigation status and 159 for treatment. Because the never group combines two fields, the field effect and the site-by-time decomposition are given in Supplementary Tables S14, S15, and S6–S9. The fungal community showed the same overall pattern. Fumigation status differed in composition, whereas soil amendments did not (Table 2). Sampling date explained 50%–54% of the fungal variance in the fumigated putting green and 59%–68% in the never-fumigated chipping control (Supplementary Tables S14, S15); thus, the fungal community changed strongly over time in both fields. Even so, the site-by-time interaction was significant (Supplementary Table S13), indicating a fumigation effect on the fungal community beyond the shared seasonal change.
Table 2. PERMANOVA of fungal community composition on Bray–Curtis distances at the genus level, across three abundance filters. Fumigation status and soil amendment treatment were tested in two separate analyses. Fumigation status used all 240 samples. Treatment used the 160 fumigated putting green samples because the never group received no amendment.
Filtering Df Residual Df Explained variance (%) F p (Fp > F) Variable All OTUs 2 237 32.94 58.21 < 0.001 Fumigation status OTUs with abundances ≥ 100 2 237 33.13 58.71 < 0.001 Fumigation status OTUs with abundances ≥ 1,000 2 237 33.86 60.67 < 0.001 Fumigation status All OTUs 3 156 1.56 0.82 0.701 Treatment OTUs with abundances ≥ 100 3 156 1.56 0.82 0.733 Treatment OTUs with abundances ≥ 1,000 3 156 1.58 0.83 0.700 Treatment Fumigation status groups are defined as above. Treatment is the soil amendment on the fumigated putting green. The two variables were tested in two separate PERMANOVA analyses. Residual variance is 1 minus the explained variance. Total degrees of freedom are 239 for fumigation status and 159 for treatment. The field effect and site-by-time decomposition are in Supplementary Tables S14, S15, and S6 to S9. As shown in Fig. 2, NMDS confirmed these patterns. We plotted a joint ordination for each domain and split it by field on common axes. For both bacteria and fungi, the never-fumigated chipping control formed a tight cluster across all dates, whereas the fumigated putting green spread widely and was most displaced just after fumigation at Day 10. Time was also a strong determinant within the putting green, with the fall samples at Day 43 and Day 71 separating from the spring samples at Day 255 and Day 282.
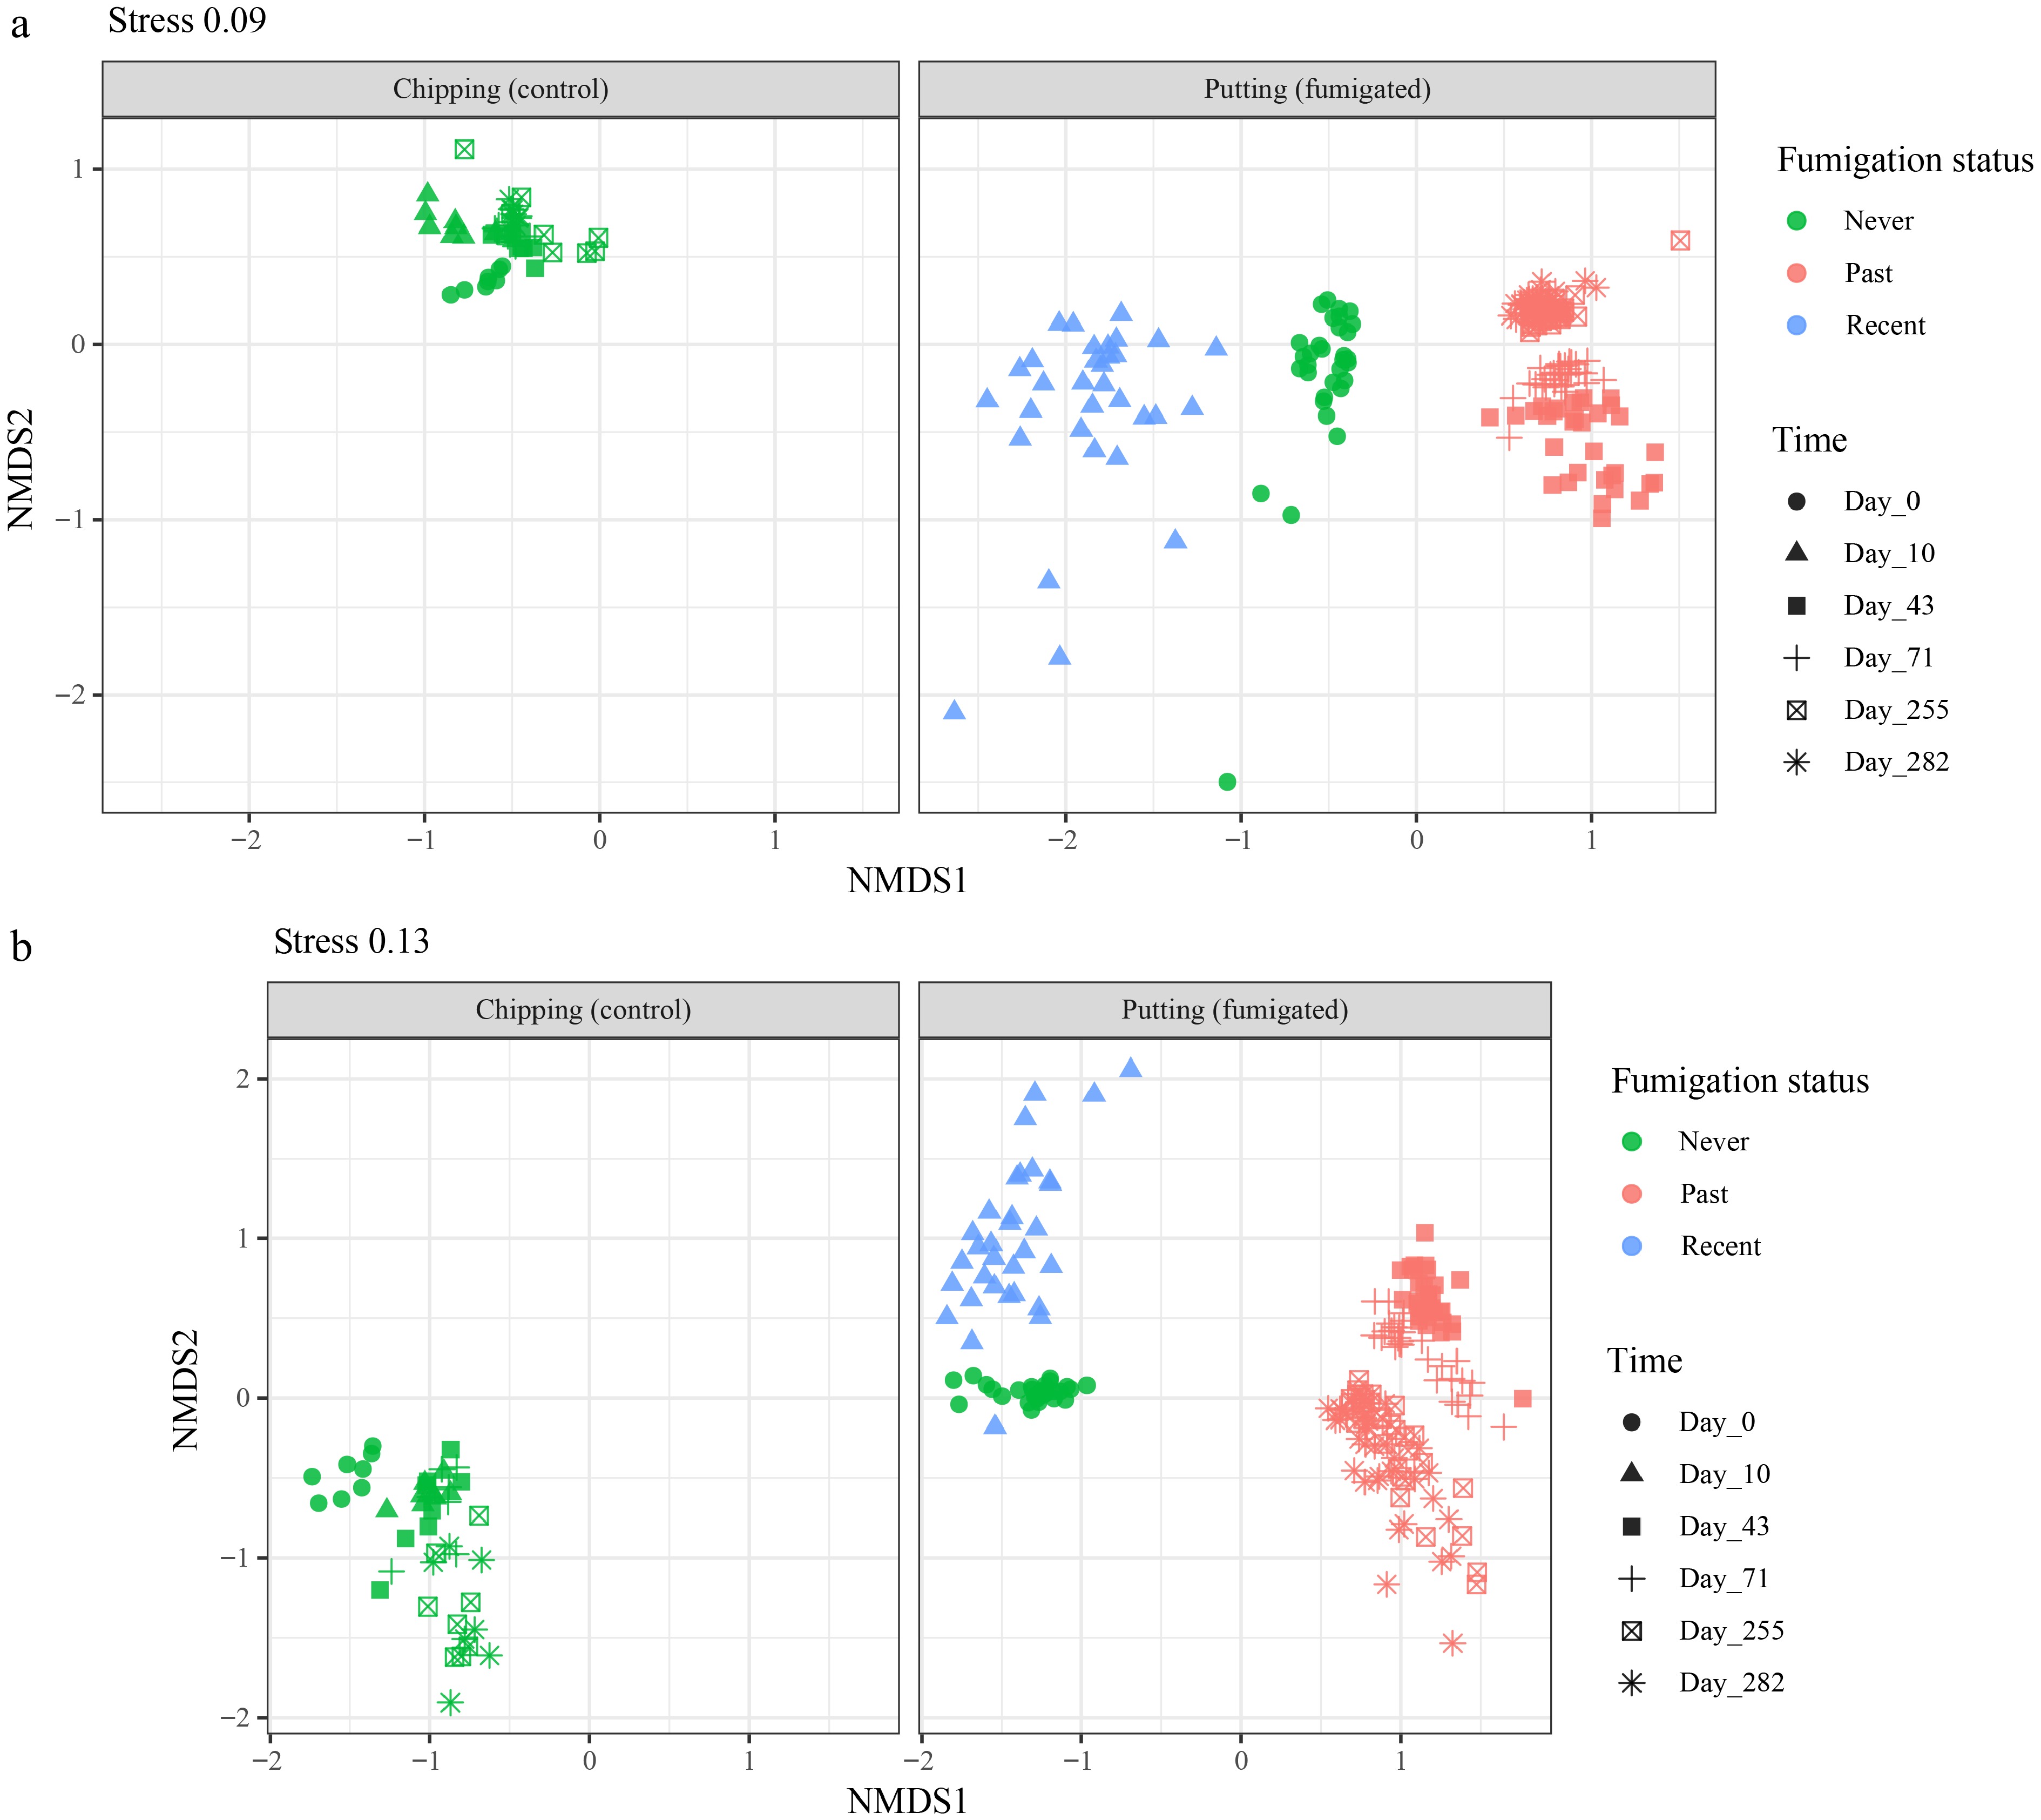
Figure 2.
NMDS of community composition for bacteria (a) and fungi (b), based on Bray–Curtis distances. Each panel shows one joint ordination split into the never-fumigated chipping control and the fumigated putting green on common axes, with points colored by fumigation status and shaped by sampling date. The never-fumigated control clusters tightly across all dates, whereas the fumigated putting green spreads widely and is most displaced just after fumigation at Day 10. Within the putting green, the fall samples at Day 43 and Day 71 separate from the spring samples at Day 255 and Day 282.
Fumigated soil had different dominant microbial taxa from those of nonfumigated soil
-
There were 43 bacterial phyla and 12 fungal phyla identified in the 240 samples from fumigated and nonfumigated soils. The heatmaps in Fig. 3 visualize the phylum-level composition of the microbial communities across different dates and fumigation statuses. Hierarchical clusterings of both the communities (top) and individual phyla (left), based on the data, are shown as dendrograms. Among the most abundant bacterial phyla in nonfumigated soils were Proteobacteria, Bacteroidetes, Chloroflexi, Planctomycetes, Actinobacteria, and Acidobacteria, while Firmicutes, Deinococcus-Thermus, Nitrospirae, and Rokubacteria were the most abundant in fumigated soils (Fig. 3a). The fungal phyla Aphelidiomycota, Ascomycota, Basidiobolomycota, Blastocladiomycota, Chytridiomycota, Monoblepharomycota, Mortierellomycota, Mucoromycota, and Rozellomycota were more abundant in fumigated soils while Basidiomycota, Glomeromycota, and Olpidiomycota were found to be more abundant in never-fumigated soils (Fig. 3b).
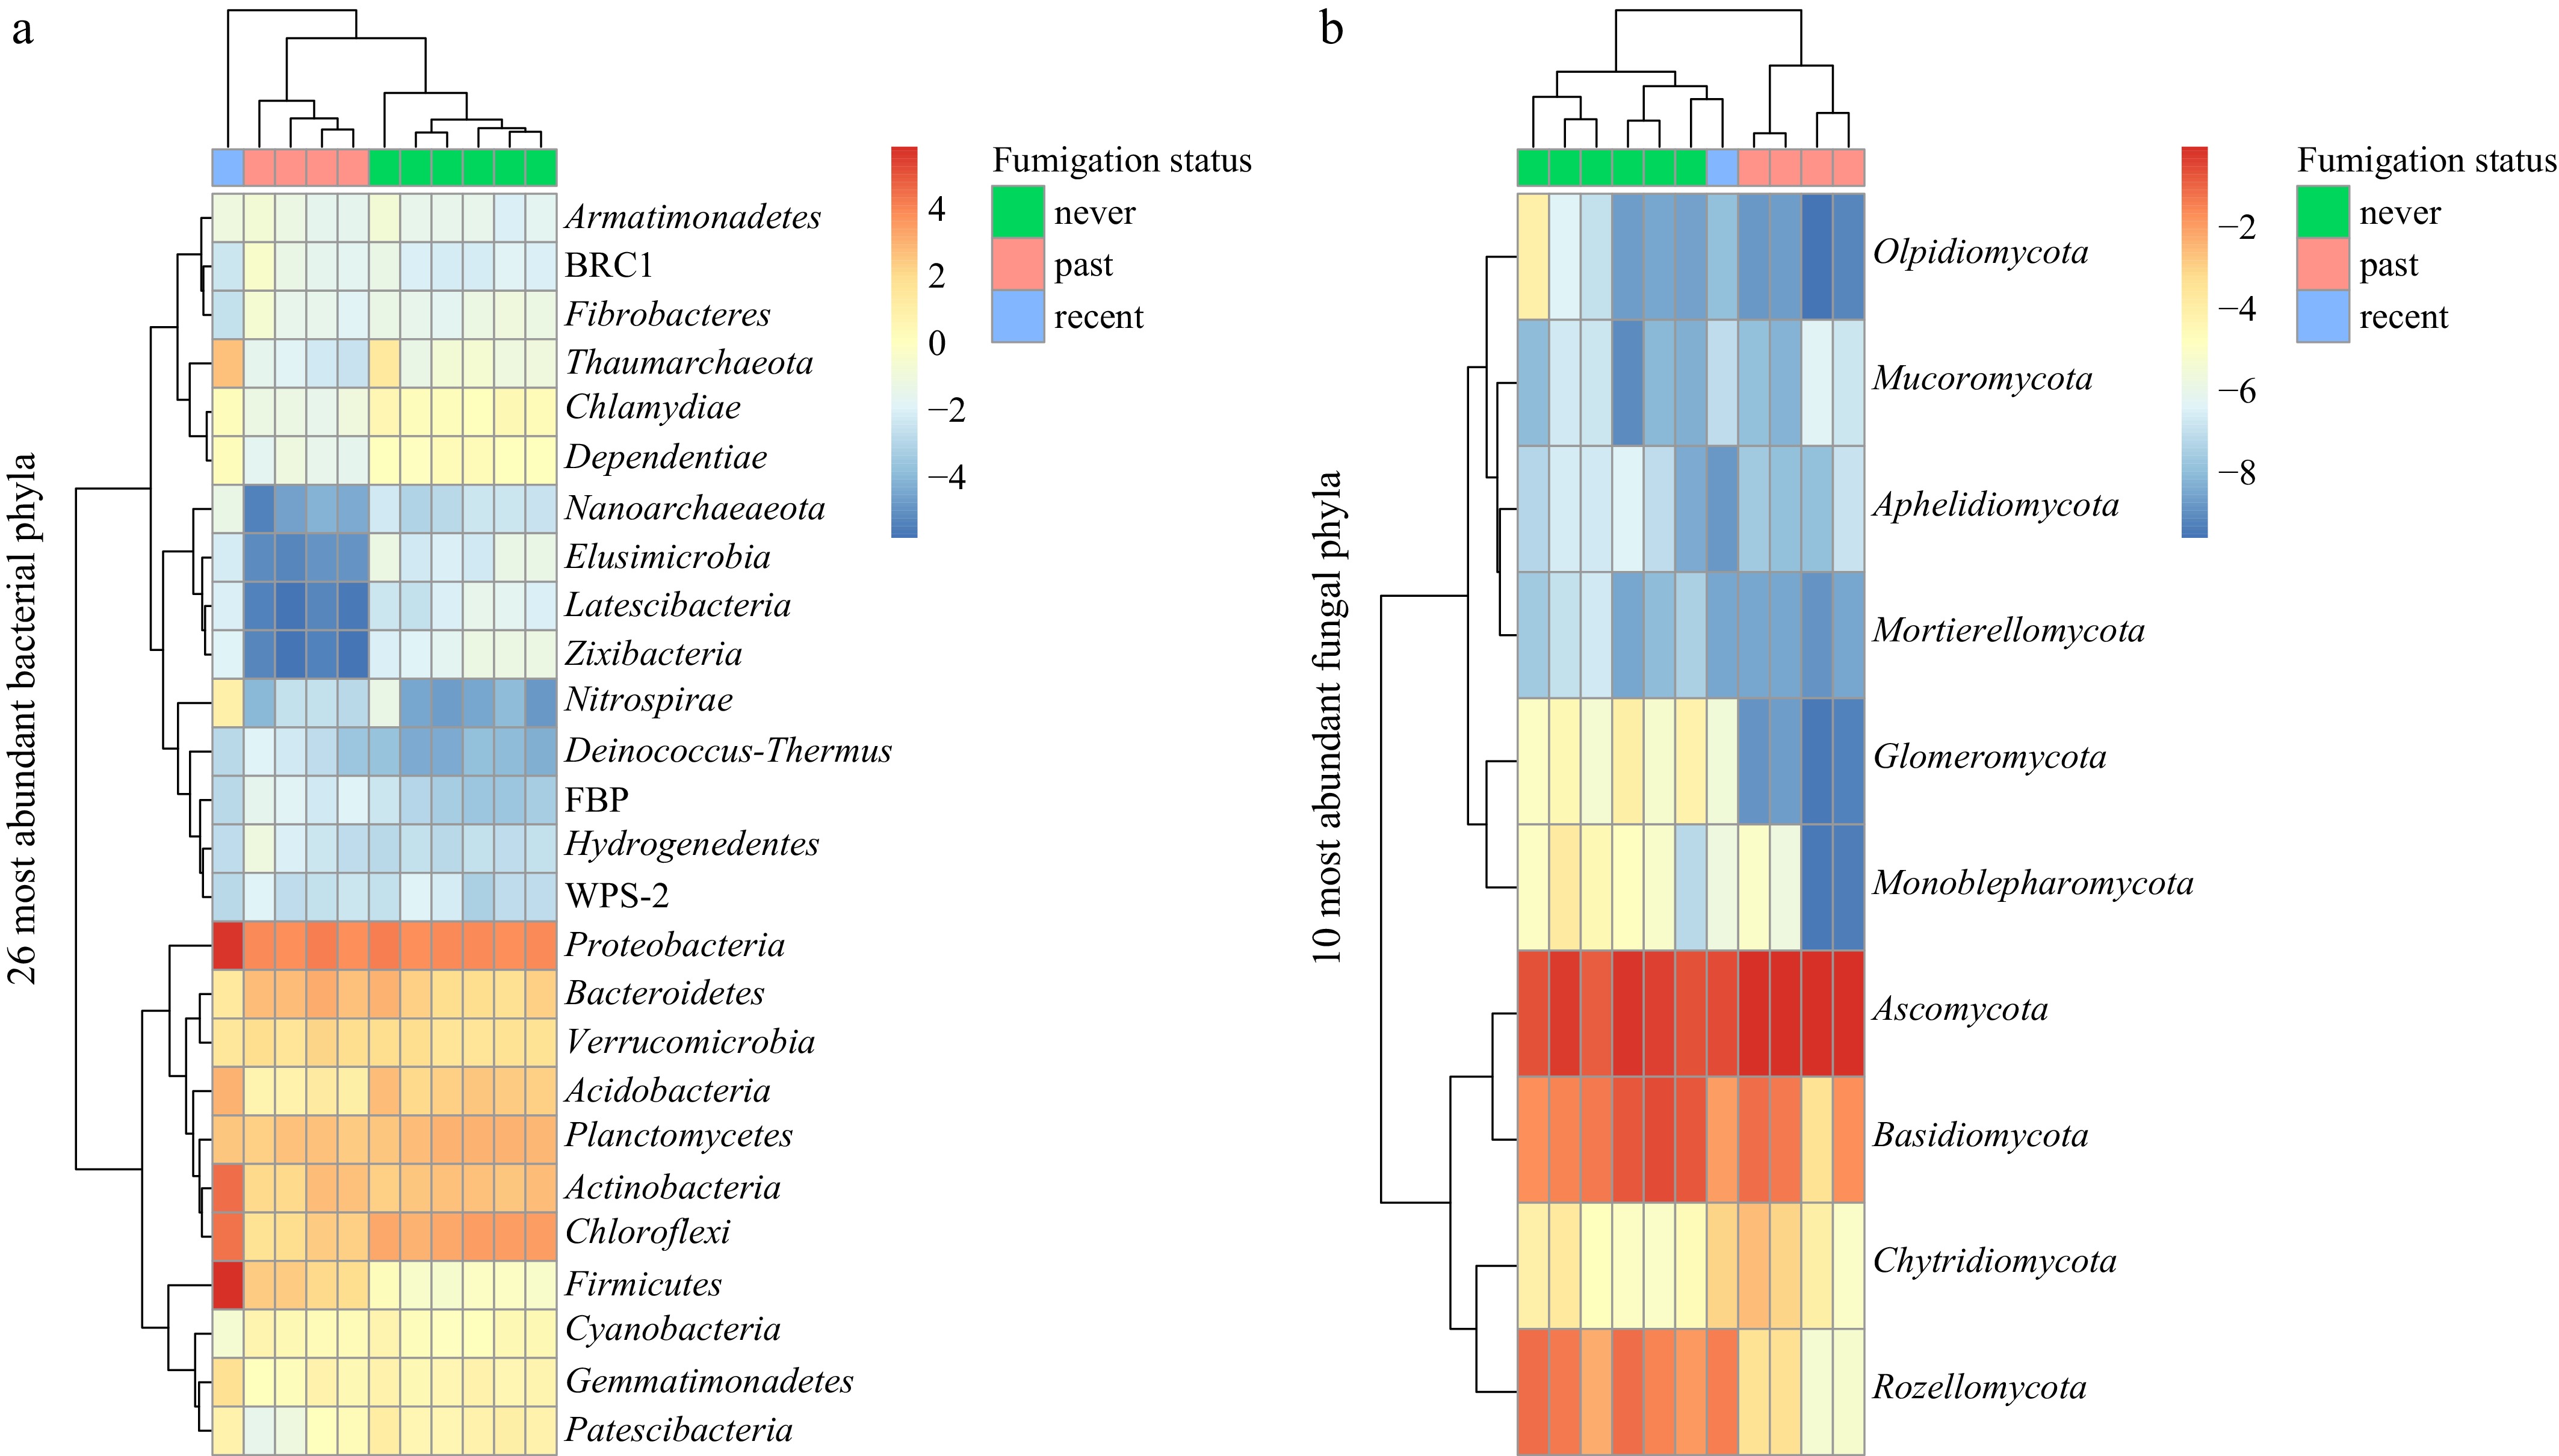
Figure 3.
Microbial community composition of fumigated and nonfumigated soils. (a) Heatmaps showed the relative abundance of bacterial phyla, and (b) heatmaps showed the relative abundance of fungal phyla in never-, past-, and recent-fumigated samples. The heatmaps contain samples on the x-axis and phyla on the y-axis. The dendrograms above each heatmap display hierarchical clustering of samples based on these communities; samples from the same fumigation status tend to end up closer to each other according to the clustering, indicating more similar communities. For each x and y coordinate, the color represents their relative abundance (red: more abundant; blue: less abundant).
Data analysis at the family level showed that there were a total of 295 bacterial families with 21 families common across all three groups, 20 families unique to never-fumigated soils, 18 families to recently fumigated soils, and 17 families to past-fumigated soils (Supplementary Table S16). Similar to the results observed at the phylum level, samples from the same fumigation status tend to have a more similar microbial composition. The difference between fumigated and nonfumigated samples was clearly evident when the clustering was performed on data filtered to include only the 152 most abundant bacterial families (Supplementary Fig. S2a).
Fungal diversity at the genus level showed that 153 fungal genera from "recent," 46 genera from "past," and 65 genera from "never" fumigated samples were identified (Supplementary Table S17). The overall summary of the relative abundance of fungal genera identified in fumigated as well as nonfumigated samples was presented in the form of a heatmap (Supplementary Fig. S2b). Even within fumigated and nonfumigated samples, the relative abundance of genera varied at different time points; for example, samples collected on Day 43 showed different abundances as compared with those collected on Day 255. The difference between fumigated and nonfumigated samples was more obvious when the clustering was done on the data filtered to include only the 68 most abundant fungal genera (Supplementary Fig. S2b).
Soil fumigation affects microbial co-occurrence networks
-
Overall, bacterial network complexity differed significantly among fumigation treatments, with recently fumigated soils exhibiting the greatest network connectivity and edge density (4,418 total edges), compared with never-fumigated (2,182 edges) and past-fumigated soils (947 edges) (Fig. 4a–c; Supplementary Fig. S3a). Recently, fumigated soils also contained the highest number of unique edges (2,872), whereas never- and past-fumigated soils contained 769 and 635 unique edges, respectively, indicating a substantial restructuring of microbial associations following fumigation. A total of 51 edges were shared among all three treatments, representing a conserved core bacterial network. In addition, overlap analysis demonstrated that network topology in past-fumigated soils was more similar to that of never-fumigated soils than to that of recently fumigated soils, suggesting partial recovery of microbial interactions over time (Supplementary Fig. S3a). Members of Proteobacteria, Actinobacteria, and Acidobacteria remained highly connected across all treatments; however, their interaction patterns varied depending on fumigation history, further supporting treatment-driven network reorganization.
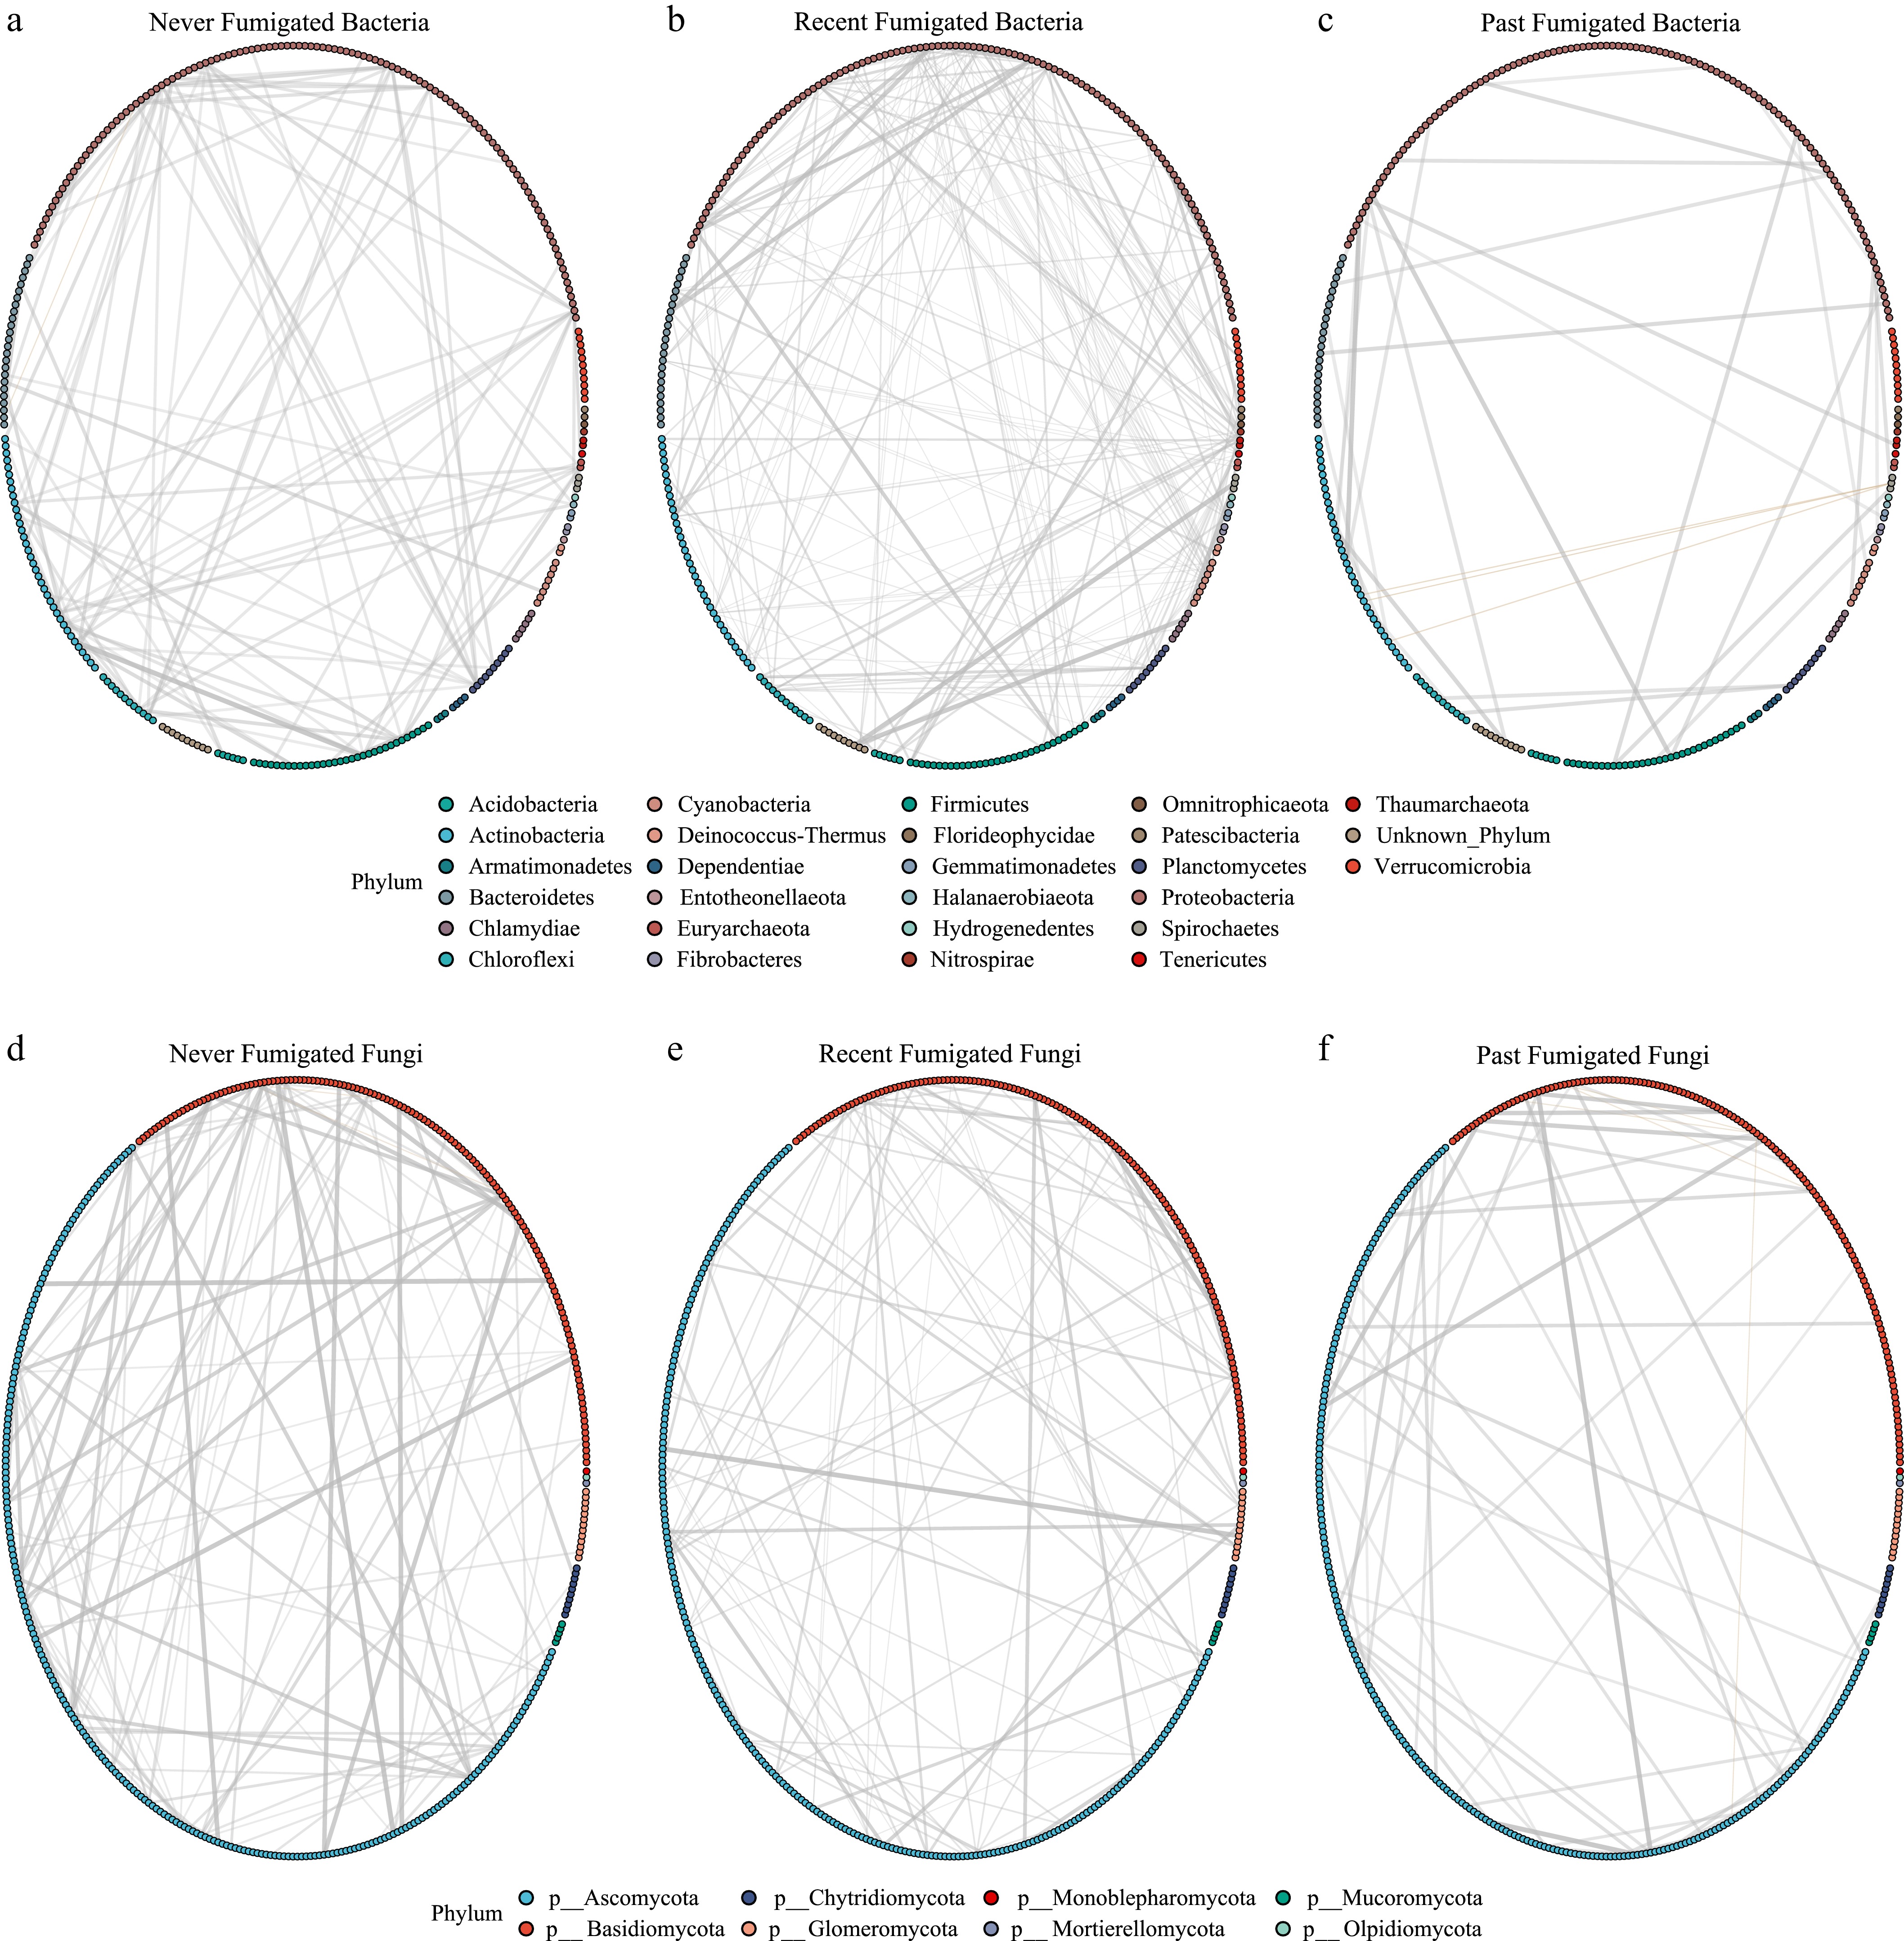
Figure 4.
Co-occurrence networks of microbial communities in fumigated and nonfumigated soils at the OTU level. Bacterial networks represent samples from soils that were never fumigated (a), recently fumigated (b), and past fumigated (c), and fungal networks represent samples from never-fumigated (d), recently fumigated (e), and past-fumigated soils (f). Each node represents an OTU colored by phylum, and edges indicate significant co-occurrence relationships. Variations in network complexity and connectivity across fumigation treatments highlight shifts in microbial community interactions influenced by fumigation history. Both bacterial and fungal diversity showed clear variation in the recent-fumigated soils as compared with nonfumigated and past-fumigated soils.
For fungal communities, GLASSO network analysis also revealed significant differences in network topology among fumigation treatments (Fig. 4d–f). Never-fumigated soils exhibited the greatest fungal network complexity and connectivity, containing 7,463 unique edges, whereas recently fumigated soils showed a substantially reduced and more fragmented network structure. Past-fumigated soils displayed intermediate connectivity, suggesting partial recovery of fungal associations after fumigation. Across all treatments, fungal communities were dominated by taxa from Ascomycota and Basidiomycota, with Mortierellomycota and Glomeromycota represented to a lesser extent. Only 48 fungal edges were shared across all three fumigation groups, indicating limited conservation of fungal interactions under different fumigation histories. Pairwise overlap analysis identified 2,070 shared edges between never- and recent-fumigated soils, 1,212 between never- and past-fumigated soils, and 243 between recent- and past-fumigated soils (Supplementary Fig. S3b), further demonstrating that fumigation history strongly influenced fungal co-occurrence patterns and network structure.
Network analyses elucidate shared and specific microbial communities across fumigation statuses
-
Bacterial subnetworks across all fumigated and never-fumigated soils identified 34 shared bacterial families connected by positive associations, indicating conserved co-occurrence patterns and potential functional complementarity within the soil microbiome (Supplementary Fig. S4a). These shared taxa belonged primarily to the phyla Actinobacteria, Proteobacteria, Firmicutes, Bacteroidetes, and Cyanobacteria. Subnetwork composition and topology differed substantially among fumigation treatments. The never-fumigated soils exhibited greater taxonomic diversity, including several members of Acidobacteria and Chloroflexi, consistent with a more stable and less disturbed microbial community (Fig. 5a). In contrast, recently fumigated soils displayed the highest network complexity and connectivity, with increased dominance of Proteobacteria, Actinobacteria, and Firmicutes (Fig. 5b). This observation was supported by higher node degree values in the recent-fumigation networks relative to never- and past-fumigated soils (Supplementary Fig. S5). The past-fumigation subnetwork exhibited intermediate complexity, with persistent but less abundant fumigation-responsive taxa, including Nitrospirae and archaeal members of Thaumarchaeota, suggesting partial recovery of the bacterial community following fumigation disturbance (Supplementary Fig. S4b).
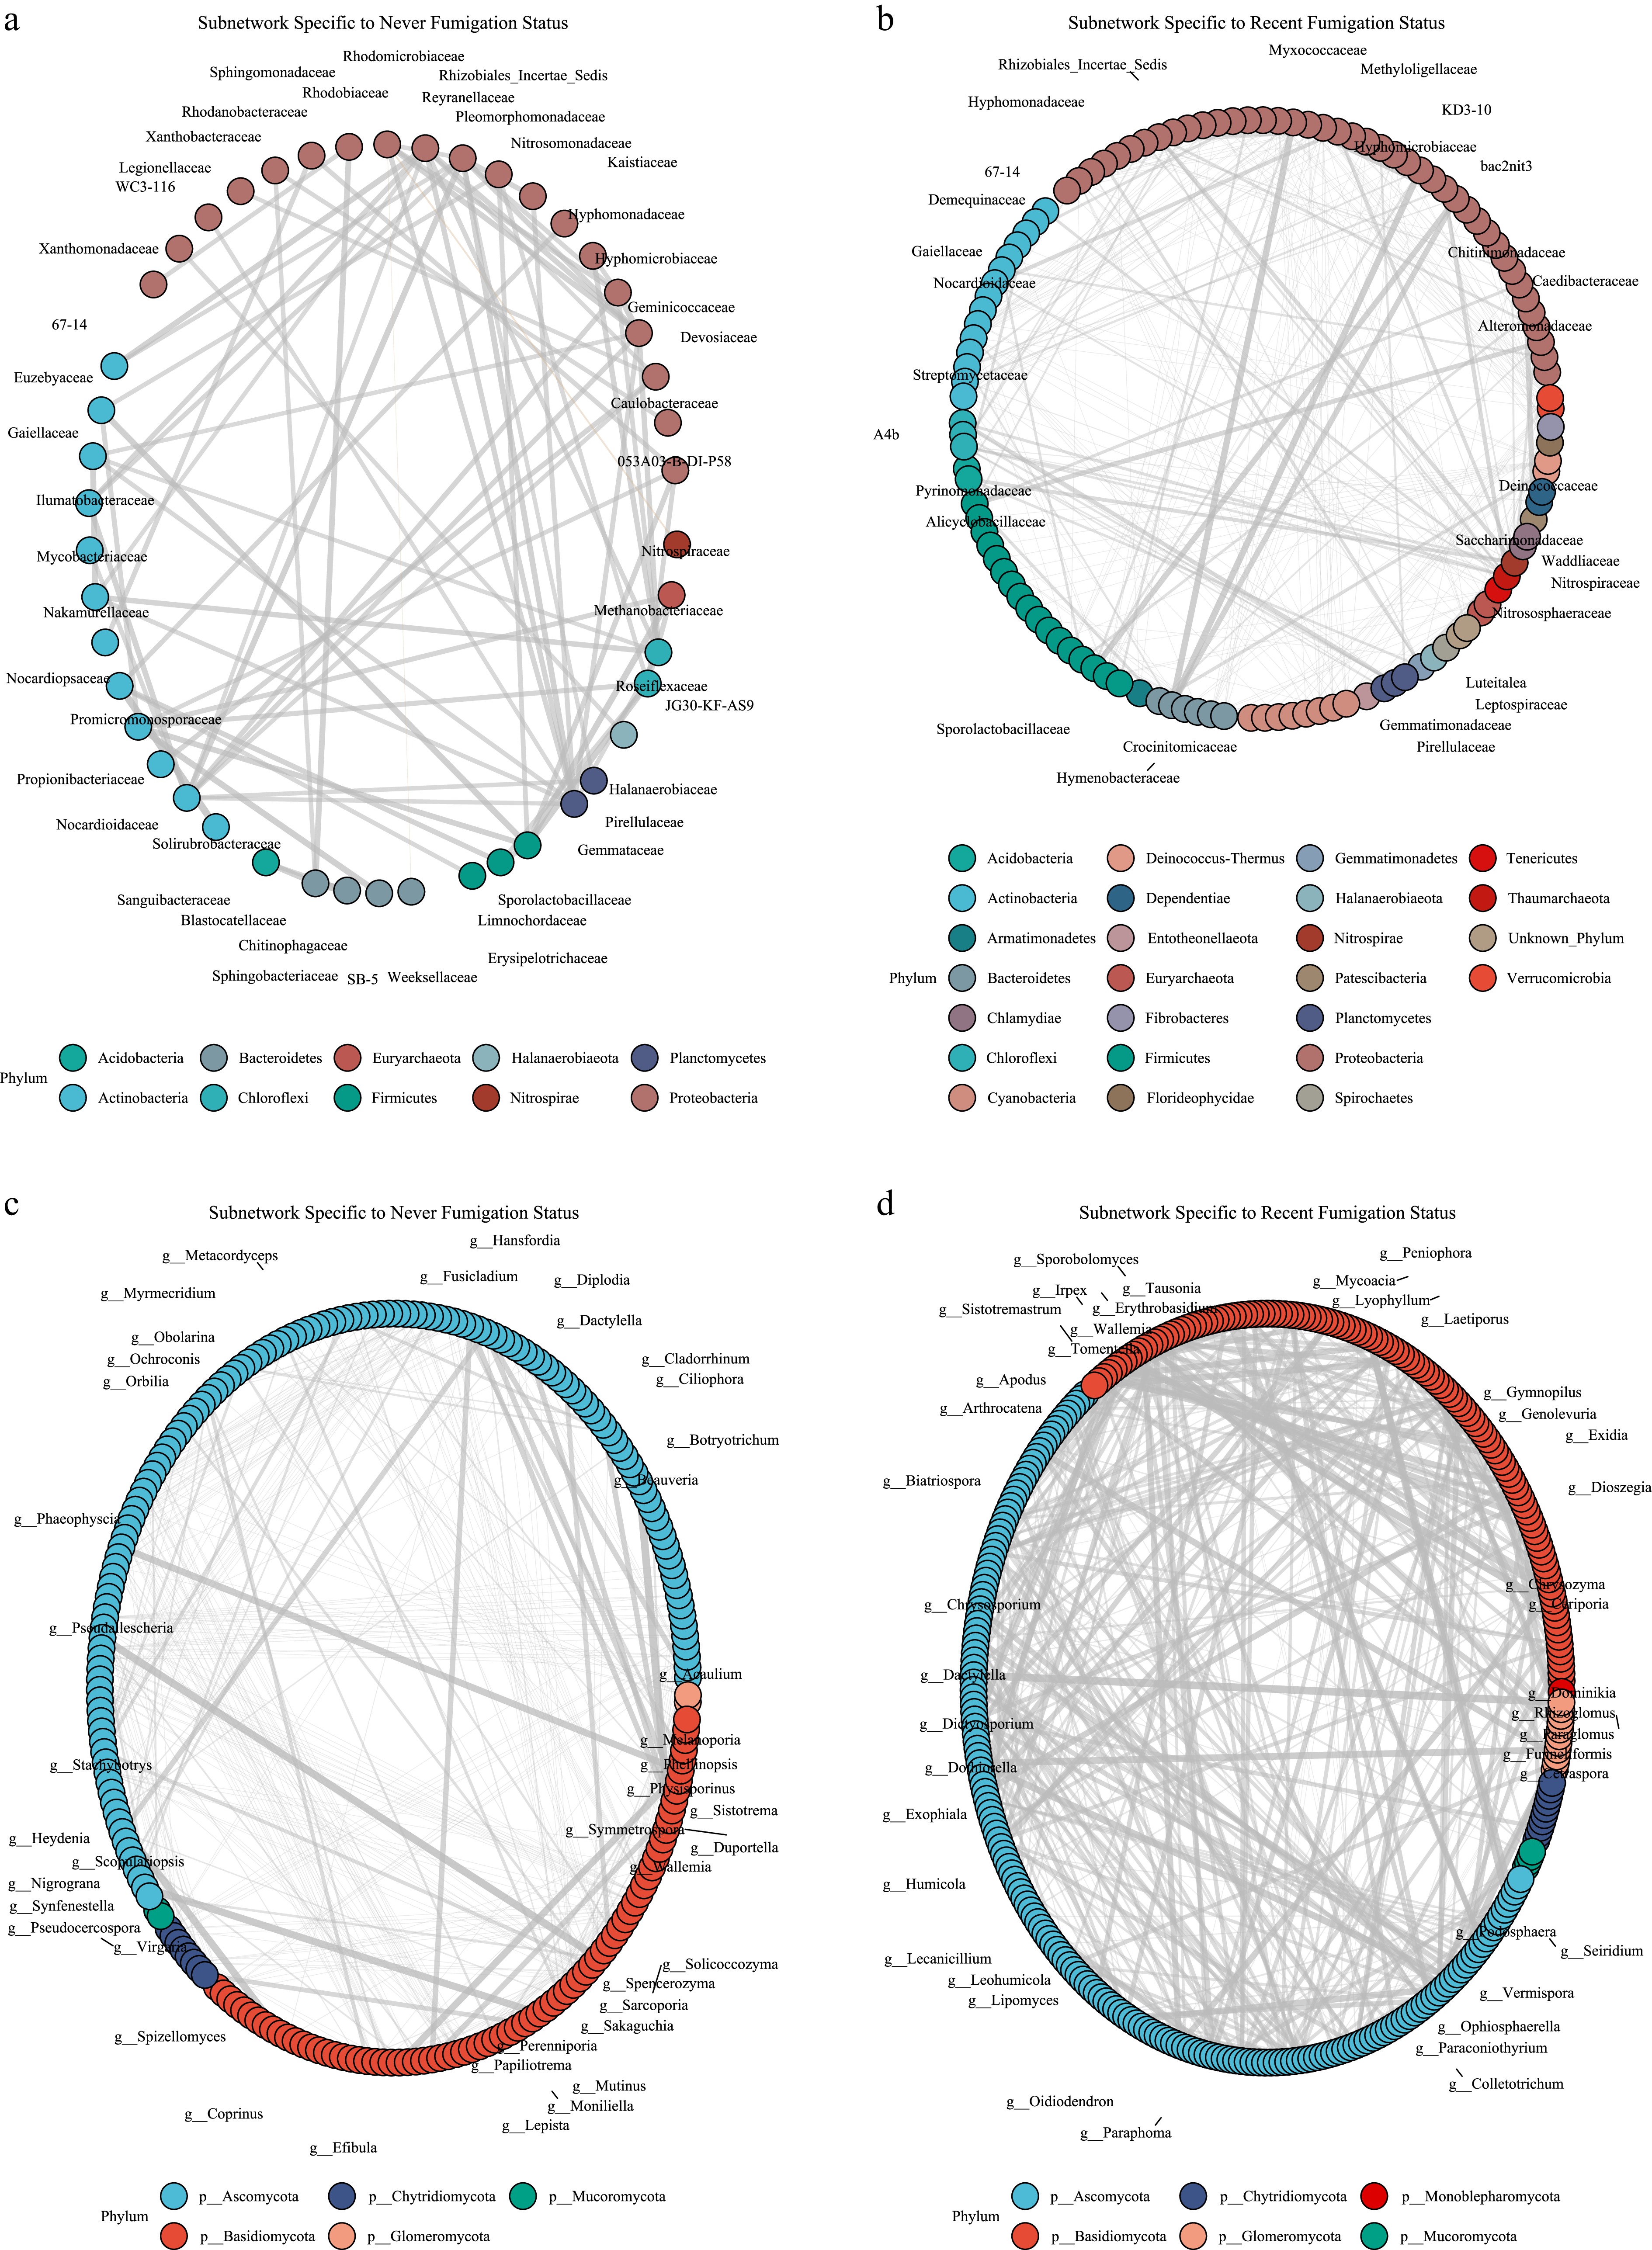
Figure 5.
Microbial co-occurrence subnetworks of bacterial families and fungal genera across fumigated and nonfumigated soils. Each circular network represents a unique subset of microbial interactions: (a) bacterial families specific to never fumigated, (b) bacterial families specific to recent fumigation, (c) fungal genera specific to never fumigated, and (d) fungal genera specific to recent fumigation. Nodes represent taxa, and edges represent interactions between the taxa (positive or negative). Recent-fumigated soils showed a difference in both bacterial and fungal taxa distribution as compared with nonfumigated and past-fumigated soils.
Fungal subnetwork analysis similarly identified a conserved core group of fungal genera, primarily belonging to Ascomycota, that were shared across all fumigation treatments (Supplementary Fig. S4c). However, network topology varied considerably among treatments. Never-fumigated soils contained the densest and most taxonomically diverse fungal network, indicating more extensive fungal interactions under undisturbed conditions (Fig. 5c). Recently fumigated soils exhibited a restructured fungal network characterized by the dominance of Ascomycota and several treatment-specific genera, reflecting strong fumigation-induced shifts in fungal community organization (Fig. 5d). The past-fumigation subnetwork exhibited moderate connectivity and partial recovery of fungal interactions, suggesting ongoing ecological succession after fumigation disturbance (Supplementary Fig. S4d).
Network centrality analysis further supported these treatment-specific differences (Supplementary Fig. S5). For both bacterial and fungal communities, recently fumigated soils consistently exhibited the highest node degree distributions, indicating increased connectivity among taxa, whereas past-fumigated soils showed the lowest degree values. Betweenness centrality values were generally low across all treatments; however, recently fumigated soils displayed a broader distribution and higher maximum betweenness values. These results suggest that a subset of taxa in recently fumigated soils acted as key connector nodes, potentially playing a disproportionately important role in maintaining microbial network structure following fumigation disturbance.
Chain graphs reveal associations with past fumigation status
-
To further evaluate microbial associations, the 20 most abundant bacterial and fungal taxa were analyzed using the CARlasso chain graph model with fumigation status and soil amendment included as predictors (Fig. 6; Supplementary Tables S18, S19). Among bacterial taxa, most associations were positive, indicating coordinated co-occurrence patterns within the soil microbiome. Several bacterial families, including Xanthomonadaceae, Acidithiobacillaceae, and Diplorickettsiaceae, showed negative associations with fumigation status, whereas Leptospiraceae, Nitrosopumilaceae, and Microbacteriaceae exhibited strong positive associations with fumigation treatments (Fig. 6a, b; Supplementary Table S18). Leptospiraceae showed the largest positive edge coefficient associated with recent fumigation and also displayed significant negative associations with Streptomycetaceae and Gemmataceae, indicating potential competitive or exclusionary relationships among these taxa (Fig. 6a, b; Supplementary Fig. S5; Supplementary Table S18). These results suggest that fumigation selectively promoted specific bacterial groups while suppressing others, thereby restructuring microbial interaction networks.
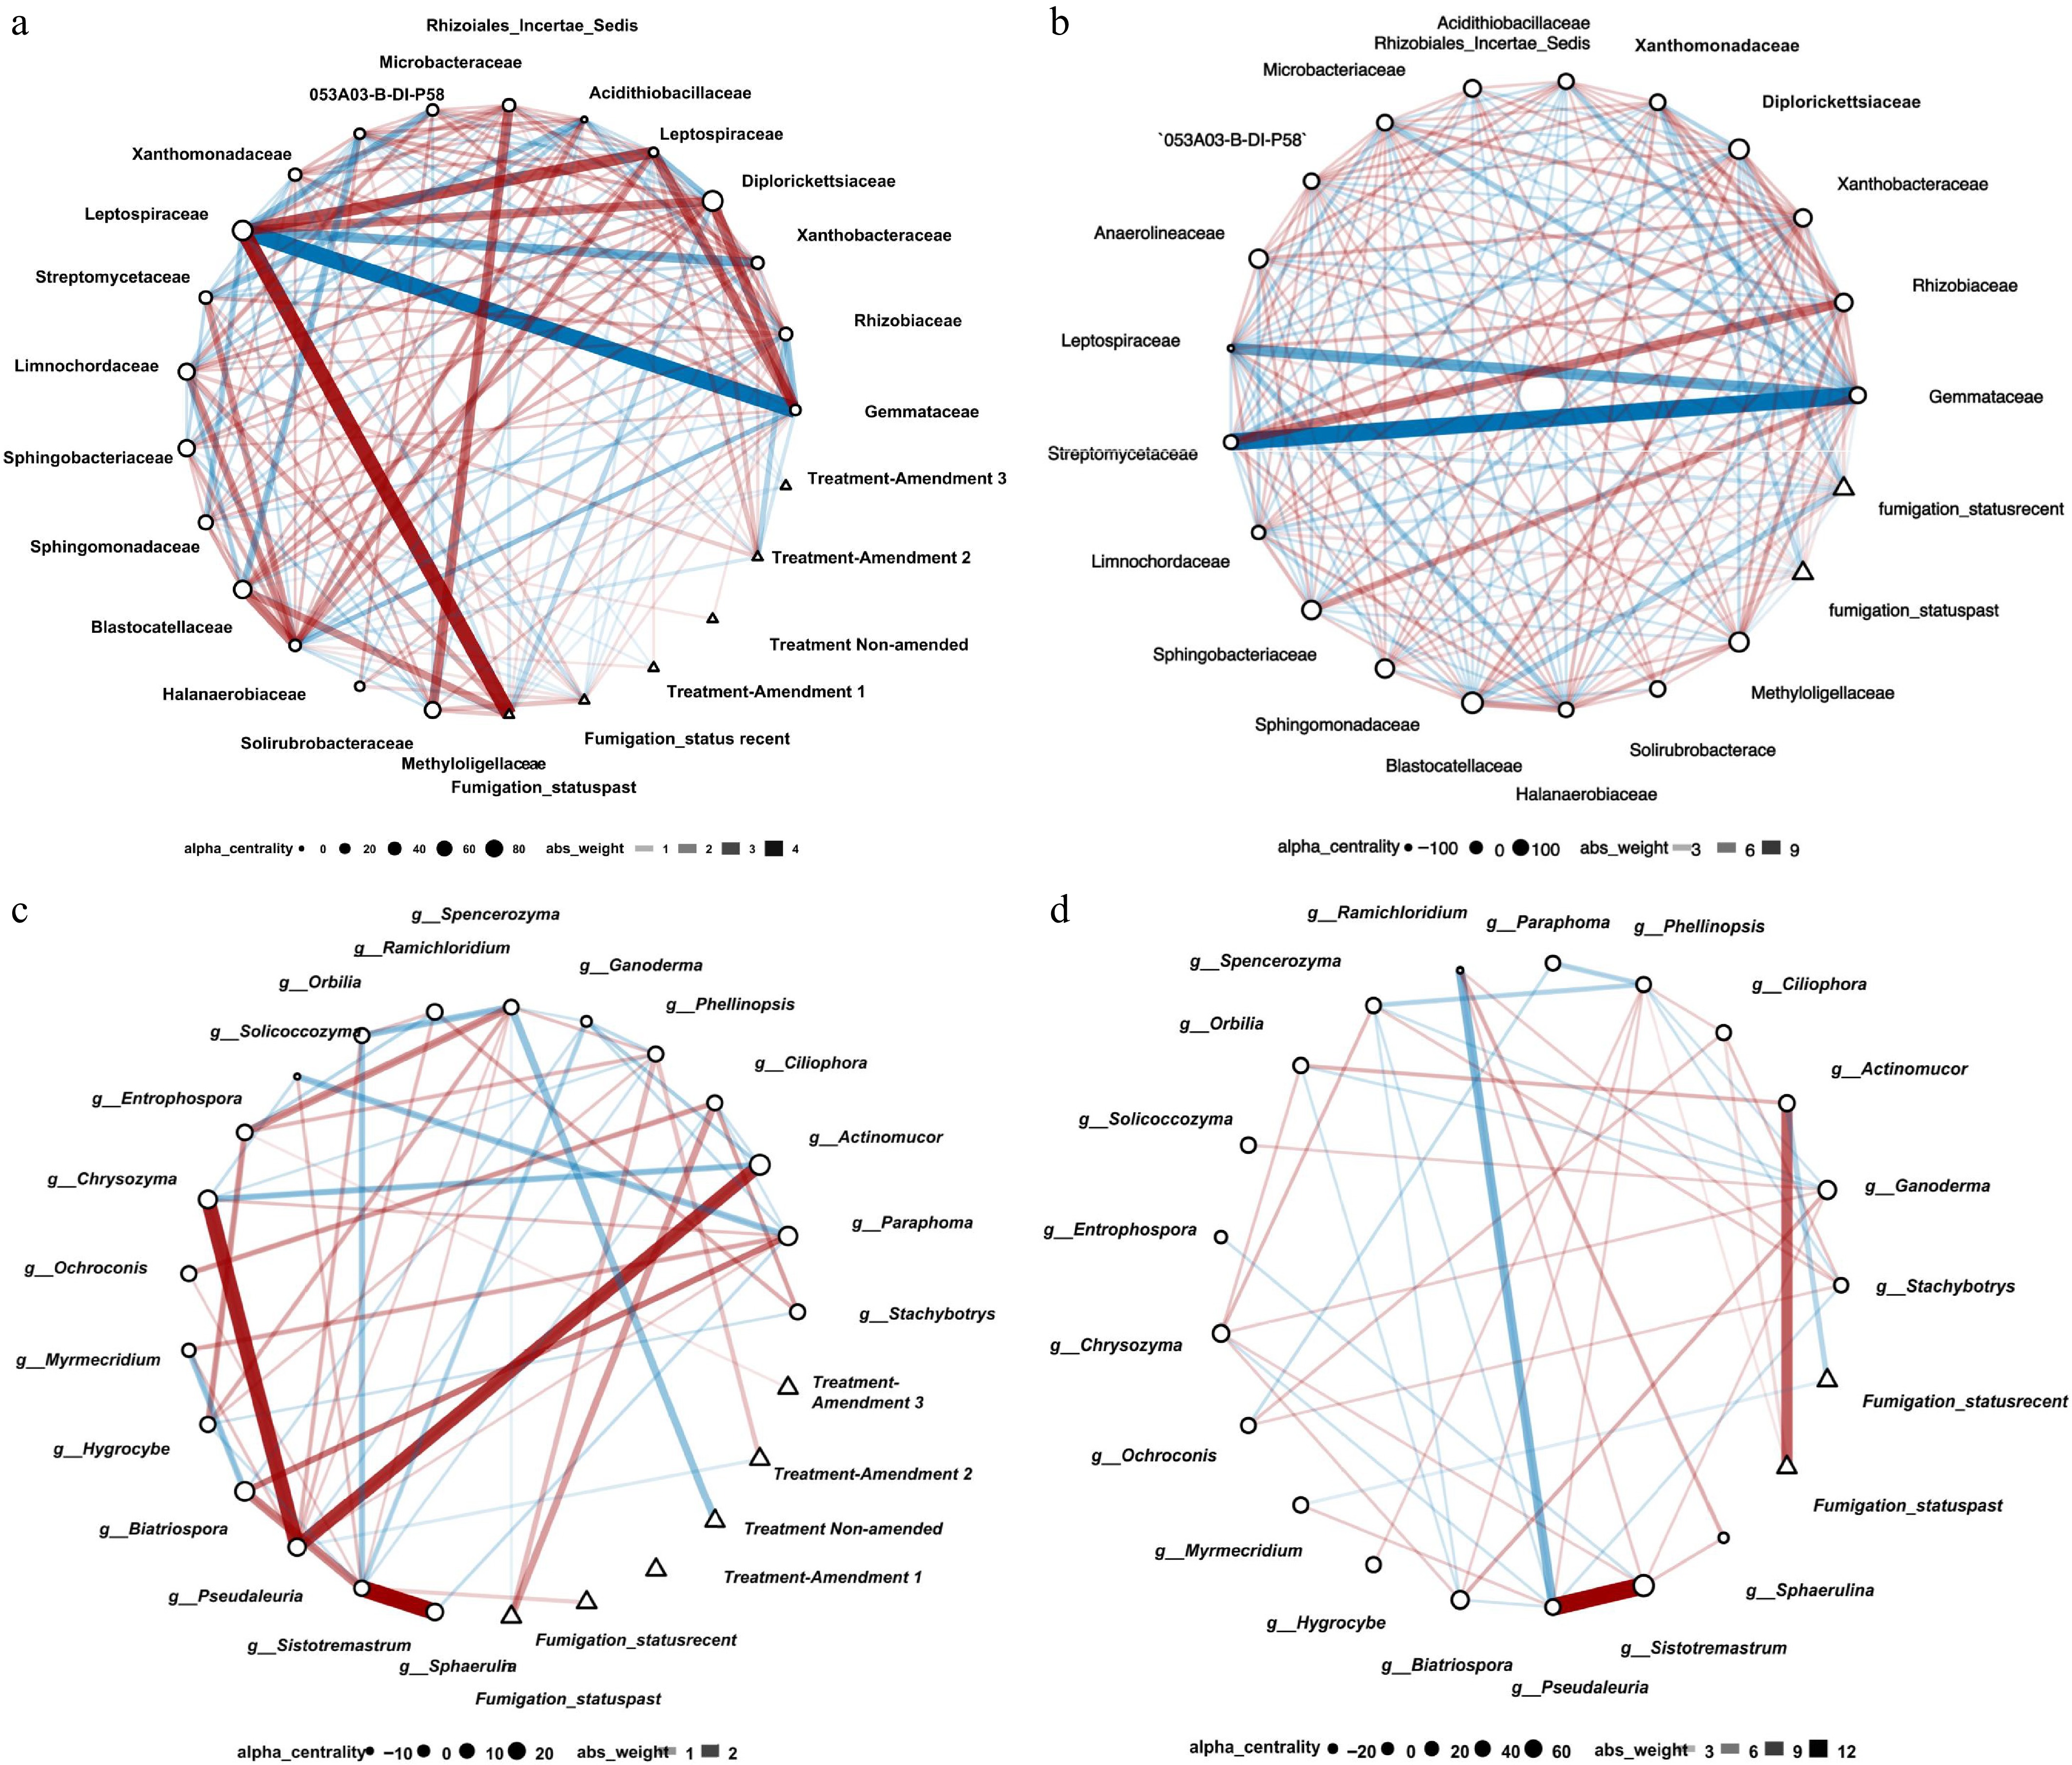
Figure 6.
Network analysis among 20 most differed bacterial and fungal taxa as responses using CARlasso chain graph model with fumigation status and treatment as predictors (a, c) or only fumigation status (b, d). Predictors are represented as triangle nodes, and responses are represented as circle nodes. Red edges mean positive interactions, and blue edges mean negative interactions. Edges are also weighted by effect size, with higher weights represented by higher opacity and greater width. (a, b) networks showed the interaction among different bacterial taxa and (c, d) showed the interaction among different fungal taxa. Among the bacterial taxa, the strongest effect was shown by Leptospiraceae, which positively correlates with recent fumigation and negatively correlates with Streptomycetaceae and Gemmataceae. Fungal genus Pseudaleuria showed the strongest positive correlation with Actinomucor, Sisotremastrum, and Chrysozyma.
For fungal communities, CARlasso analysis identified several genera, including Actinomucor, Phellinopsis, Pseudaleuria, Ganoderma, Hygrocybe, and Sistotremastrum, that were positively associated with recent and past fumigation treatments (Fig. 6c, d; Supplementary Fig. S6; Supplementary Table S19). Among these, Pseudaleuria exhibited the strongest positive associations and was highly connected with Actinomucor, Sistotremastrum, and Chrysozyma, suggesting a central role in the fumigation-responsive fungal network. In contrast, genera such as Radulomyces, Suillus, Ceratostomella, and Lentinellus showed negative associations with recent-fumigation status, indicating reduced abundance or connectivity under disturbed soil conditions (Fig. 6c, d; Supplementary Fig. S7; Supplementary Table S19). Differences in node size, represented by alpha centrality values, further demonstrated variation in taxon importance within the network, with genera such as Ramichloridium and Pseudaleuria exhibiting the highest centrality scores and therefore acting as influential hub taxa within the fungal interaction network.
-
Our results showed that fumigation significantly reshapes soil microbial communities, reducing bacterial diversity in recently fumigated soils while increasing fungal diversity in both recent- and past-fumigated soils; moreover, fumigation status and sampling time drove distinct bacterial and fungal community compositions, whereas soil amendments had no significant effect. Notably, the application of methyl bromide caused a severe initial disruption to both bacterial and fungal communities. Although these shifts in microbial diversity diminished over time, neither community fully recovered to its original state, as indicated by both alpha- and beta-diversity indices.
The disruption of microbial communities and diversities in the soil by fumigation was also reported in previous studies[11,12,44]. Beyond the direct biocidal effect of fumigation, it can also indirectly alter microbial abundance and diversity by enhancing substrate availability and promoting microbes capable of utilizing fumigants as carbon or nitrogen sources[15,45]. In addition, our findings contradict previous studies, in which microbial communities and diversity were reestablished 6 weeks after soil fumigation[13,15]. The difference in microbial recovery observed in our study was likely due to the unique environment of our study, featuring a sand-based rhizosphere and a near-monoculture cropping system that tends to limit fitness for diverse microbial communities and potentially impede the microbial recolonization[46].
No soil amendment impact was observed even with methyl bromide niche-clearing
-
We hypothesized that niche clearing with methyl bromide would allow the microbiome within the soil amendments to impact the diversity and structure of soil communities in turfgrass due to a weakened priority effect. However, our results suggested that applying soil amendments after soil fumigation did not significantly affect the structure and diversity of soil microbial communities and did not alleviate the fumigation disruption or facilitate recovery of the soil microbiome. Previous research in this area has shown mixed outcomes, likely depending on the cropping system, disruption level, and soil and amendment types. For example, Azeem et al.[20] and Zhang et al.[21] reported that amendments such as biochar, biosolids, and plant residues improved microbial abundance and community composition in vegetable and cereal crop systems, especially in soils with moderate disturbance levels. In contrast, Stacey et al.[22] and Carrera et al.[47] found minimal or short-lived effects of amendments on microbial communities in systems with severe fumigation or under high-input conventional agriculture.
The difficulties for an introduced microbiome to colonize and establish itself within the population have been well documented[24,48,49]. This is often attributed to the priority effect, where established or indigenous communities resist the colonization of later-arriving species[50]. Therefore, niche clearing was hypothesized as a potential strategy to eliminate the priority effect. Studies using niche-clearing strategies found more consistent results, where soil amendments could better modulate the diversity and structure of soil microbiomes after chemical fumigation. Sennett et al.[23,51] showed that postfumigation application of soil amendment with young and mature barley tissues shifted beta diversity of both bacteria and fungi. In addition, Li et al.[52] showed that the application of Bacillus-based biofertilizer after dazomet fumigation decreased the relative abundance of plant pathogens (Fusarium spp. and Phytophthora spp.), improved nutrient availability, and promoted the growth of strawberries. However, our results did not support these previous findings. Potential reasons for the lack of impact of soil amendments on the microbiome include the topdressing of the amendment only on the top of the surface rather than integrating the amendments into the soil, or perhaps the ongoing history of pesticide usage on the putting green selected for a specific community that was more resilient to xenobiotics and could limit the establishment of introduced microbes[53,54]. The amendments were applied only once, as a single topdressing at the start of the study. A single application may be too limited to reshape the soil microbiome, whereas repeated or annual amendment applications, combined with cultivation and topdressing on a mature turfgrass stand, could have a greater cumulative effect on soil health. To our knowledge, the effect of repeated application of amendments on the turfgrass microbiome has not been studied, and this remains an open question.
Shift of microbiome may center around keystone taxa as indicated by network analysis
-
Network analysis of microbial communities showed that recently fumigated soils had more complex structures, with more observed correlations among bacterial and fungal taxa compared with nonfumigated soils. Bacterial families from Proteobacteria, Actinobacteria, and Firmicutes formed dense co-occurrence networks for the recently fumigated soil, suggesting a strong microbial response to chemical disturbance. This observation is consistent with findings by Jiao et al.[55] and Li et al.[15], who reported higher edge connectivity in metam sodium-treated soils. In contrast, Tekeu et al.[44] observed reduced correlations and disrupted bacterial activities following chloropicrin fumigation. The structure of fungal communities also shifted after fumigation, with Ascomycota becoming dominant and likely playing a key role in early recolonization. Genera such as Ganoderma, Actinomucor, Phellinus, and Striaticonidium were positively associated with fumigated soils, whereas Radulomyces, Suillus, and Ceratostomella showed negative correlations. These patterns align with prior studies by Li et al.[15] and Chen et al.[56], who reported positive associations of Pithoascus, Spiromastix, Ganoderma, and Actinomucor with fumigated soils. Additionally, Wang et al.[57] found that fenaminosulf-treated soils had denser fungal networks, with positive correlations with beneficial genera such as Penicillium and Trichoderma and negative correlations with pathogens such as Curvularia and Fusarium.
Soil fumigation reduced pathogen load and promoted opportunistics
-
Fumigation reduced the relative abundance of several bacterial families encompassing many plant pathogens, including Xanthomonadaceae, Acidithiobacillaceae, and Diplorickettsiaceae. Notably, Xanthomonas spp. are known to cause blights in various plants, and Xanthomonas translucens has been associated with leaf elongation and wilt in creeping bentgrass and annual bluegrass, where chemical control options are limited[58−62]. In contrast, fumigation indirectly promoted the relative abundance of opportunistic bacterial taxa, such as Citricoccus, Kocuria, Dichotomicrobium, and Gaiella, by removing competitors and increasing resource availability. This pattern is consistent with previous studies that reported increased postfumigation abundance of taxa such as Bacillus, Gaiella, and Arthrobacter, likely due to their metabolic ability to utilize fumigants or respond to enriched substrates[45]. These bacteria are often found in soil, water, and wetland environments and are adapted to grow rapidly under extreme or disturbed conditions[11−13]. Additionally, certain resilient taxa, such as Pasteuriaceae, may persist due to heat resistance[63], while nitrogen-fixing or ammonia-oxidizing taxa, such as Longivirga, Cenarchaeum, and Nitrosopumilus, may benefit from postfumigation conditions due to their roles in nitrogen and carbon cycling[64].
Conversely, fumigation reduced the abundance of several putative fungal pathogens, including Slopeimyces, Fusarium, Colletotrichum, Cephaliophora, Microdochium, Striaticonidium, and Alternaria (Supplementary Fig. S2), many of which are associated with diseases of cool-season turfgrass. Similar trends have been reported in previous studies[65,66]. These results are consistent with Shi et al.[67], who observed decreased abundance of Cephaliophora, Neocosmospora, and Alternaria following fumigation with various chemical agents, and with Castellano-Hinojosa et al.[45], who demonstrated that prefumigation suppresses pathogens, such as Fusarium and Alternaria, by altering rhizosphere microbial communities across different crop systems.
Soil fumigation resulted in unintended effects
-
Soil fumigation negatively affected several nontarget bacterial genera, including Anderseniella, Bauldia, Flavobacterium, Pseudomonas, Xanthobacter, and Azotobacter, which are involved in nutrient cycling, plant growth promotion, and disease suppression. Similar fumigation-induced shifts in soil bacterial communities have been reported previously, with declines or increases in specific taxa leading to altered soil functions such as pathogen suppression, nutrient availability, and crop productivity[7,15]. For instance, reductions in Pseudomonas populations following fumigation have been linked to diminished pathogen antagonism, while decreases in nitrifying bacteria have been associated with lower soil nitrate availability and reduced crop yields[15,68].
Fumigation also reduced the abundance of beneficial fungi, such as Rhizoglomus, Trichoderma, Orbilia, Mortierella, and Ciliophora, which contribute to nutrient solubilization, plant growth, and resistance to pathogens. Arbuscular mycorrhizal fungi, particularly Rhizoglomus, are known to enhance nutrient uptake, soil structure, and plant stress tolerance, and their sensitivity to fumigation has been reported in multiple cropping systems[4,67,69]. In contrast, several organic matter–decomposing and wood-decay fungi, including Trematosphaeria, Ganoderma, Actinomucor, and Lyophyllum, recovered rapidly after fumigation, likely due to increased substrate availability and reduced microbial competition. These fungi not only play key roles in nutrient cycling and ecosystem productivity but are also associated with fairy ring development in turfgrass, highlighting the need for further research into the ecological links among soil fumigation, microbial community shifts, and turfgrass disease expression[70−74].
Broader implications of this research
-
Although methyl bromide can no longer be used in the United States, numerous other fumigation chemicals remain available and have the potential to significant disrupt the microbiome. Previous research has demonstrated that soil fumigants used as alternatives to methyl bromide, including chloropicrin, 1,3-dichloropropene, metam sodium/potassium, dazomet, dimethyl disulfide (DMDS), and allyl isothiocyanate (AITC), exert significant short- and long-term effects on soil microbial communities. Much like the results presented in our study, research on other fumigation products has reported immediate reductions in overall microbial biomass and diversity following fumigation, accompanied by pronounced shifts in bacterial and fungal community composition[7,15,74,75]. Functional impacts from previous research have frequently indicated reduced enzyme activities and disruptions to carbon and nitrogen cycling processes, including nitrification and denitrification, particularly in the weeks to months following application[4,76]. While partial recovery of microbial abundance and activity was observed over time in many studies, the outcomes were strongly influenced by soil type, fumigant chemistry, application method, and postfumigation management practices[77]. Our results on methyl bromide applied to a golf course putting green contribute to the broader research on chemical disruption of microbiomes and the effectiveness, or lack thereof, of soil health recovery methods.
-
This study provided comprehensive information on the impact of fumigation on soil bacterial and fungal microbial communities in a highly managed turfgrass system. Our findings suggested that methyl bromide fumigation reduced the niche breadth of bacteria and fungi, enhanced microbial resource competition, and led to more restricted ecological niches for both groups. Network analysis provided evidence that changes in keystone taxa primarily drive microbiome shifts. Bacterial and fungal pathogen loads were reduced by fumigation, including bacterial genera Xanthomonas, Rickettsiella, and Pasteuria, and fungal genera Phellinopsis and Striaticonidium. Fumigation also adversely affected the untargeted bacterial populations, including Anderseniella, Dichotomicrobium, Azorhizobium, Xanthobacter, and Flavobacterium, and fungal populations, including Rhizoglomus, Trichoderma, and Mortierella, that play roles in nutrient mineralization, modulating plant nutrient availability, promoting plant growth, and resistance against different diseases. This research also shows that microbial populations partially recover shortly after applying fumigants, but never fully recover to their original state over the duration of this study. Relative abundance of opportunist microbes that are capable of complex organic matter degradation, such as bacteria Citricoccus, Kocuria, Gaiella, and Nitrosopumilus, and fungi Trematosphaeria, Ganoderma, and Lyophyllum, recovered in a short period. While methyl bromide is no longer in use, other fumigation chemicals are still commonly used in agricultural production. These results provide important information on how soil microbial communities in a highly managed plant system respond to significant disruptions, which can aid plant managers in creating more resilient and sustainable plant systems.
The authors acknowledge Drew Barnett, golf course superintendent at Knollwood Golf Club, for hosting this research, and Dan Dinelli, golf course superintendent at North Shore Country Club, for producing the compost treatments.
-
The authors confirm their contributions to the paper as follows: writing original draft, data curation and editing: Mukhtar S; methodology, formal analysis: Xu T, Gorstein E; review and editing: Xu T, Gorstein E, Solis-Lemus C; resources, supervision: Solis-Lemus C, Chou M; Koch P; writing: Xu T, Solis-Lemus C; investigation: Gorstein E, Chou M; data curation: Xu T; review and editing: Chou M, Koch P; methodology, conceptualization, funding acquisition, project administration: Koch P. All authors reviewed the results and approved the final version of the manuscript.
-
Raw sequencing reads are available in the Sequence Read Archive of NCBI under BioProject number PRJNA1335563.
-
The authors declare that they have no conflict of interest.
-
accompanies this paper online at: https://doi.org/10.48130/grares-0026-0021.
-
# Authors contributed equally: Salma Mukhtar, Tianyi Xu
- Supplementary Table S1 Details of substances and percentage used for soil amendments.
- Supplementary Table S2 Pre-fumigation field effect using Day 0 samples only, putting green compared with chipping green.
- Supplementary File 1
- Supplementary Table S3 F-tests from regression with response variable Shannon index of bacterial communities, putting green only.
- Supplementary Table S4 F-tests from regression with response variable the inverse Simpson index of bacterial communities, putting green only.
- Supplementary Table S5 Bacterial Shannon diversity by fumigation status, putting green only.
- Supplementary Table S6 Bacterial inverse Simpson by fumigation status, putting green only.
- Supplementary Table S7 F-tests from regression with response variable Shannon index of fungal communities, putting green only.
- Supplementary Table S8 F-tests from regression with response variable Inverse Simpson index of fungal communities, putting green only.
- Supplementary Table S9 Fungal Shannon by fumigation status, putting green only.
- Supplementary Table S10 Fungal inverse Simpson by fumigation status, putting green only.
- Supplementary Table S11 Bacterial PERMANOVA of sampling date within the fumigated putting green, the fumigation study over time.
- Supplementary Table S12 Bacterial PERMANOVA of sampling date within the never-fumigated chipping green, the control over time.
- Supplementary Tables S14
- Supplementary Table S13 Fungal PERMANOVA of sampling date within the fumigated putting green.
- Supplementary Table S14 Fungal PERMANOVA of sampling date within the never-fumigated chipping green.
- Supplementary Table S15 Site by time interaction on the full dataset, a difference-in-differences test.
- Supplementary Table S16 List of bacterial families associated with edges identified by network analysis.
- Supplementary Table S17 List of fungal genera associated with edges identified by network analysis.
- Supplementary Table S18 The 20 bacterial families that differ the most among networks by fumigation status based on their degree distribution and betweenness, along with the weighted average of their composition in each fumigation status by taking the average of their abundance in each sample.
- Supplementary Table S19 The top 20 fungal genera that differ the most among networks by fumigation status based on their degree distribution and betweenness.
- Supplementary Fig. S1 Alpha diversity across different treatments by using Shannon and Inverse Simpson indices.
- Supplementary Fig. S2 Microbial community composition of fumigated and non-fumigated soils at the family and genus level.
- Supplementary Fig. S3 Venn diagrams showing the overlap of edges among "Never," "Recent," and "Past" groups in networks of bacterial and fungal communities.
- Supplementary Fig. S4 Boxplots of degrees and betweenness in networks for bacteria (A and B) and fungal diversity (C and D) from glasso network between fumigated and non-fumigated soils.
- Supplementary Fig. S5 Microbial co-occurrence subnetworks of bacterial families and fungal genera across fumigated and non-fumigated soils.
- Supplementary Fig. S6 CARlasso chain graph model with fumigation status and treatment as predictors (A) or only fumigation status (B) among the 10 most differed bacterial taxa as responses.
- Supplementary Fig. S7 CARlasso chain graph model with fumigation status and treatment as predictors (A) and only fumigation status (B) among the 10 most differed fungal taxa as responses.
- Supplementary File 1 Additional methods and experimental details.
- Copyright: © 2026 by the author(s). Published by Maximum Academic Press, Fayetteville, GA. This article is an open access article distributed under Creative Commons Attribution License (CC BY 4.0), visit https://creativecommons.org/licenses/by/4.0/.
-
About this article
Cite this article
Mukhtar S, Xu T, Gorstein E, Solis-Lemus C, Chou MY, et al. 2026. Combined effects of methyl bromide and soil amendments on soil bacterial and fungal communities in turfgrass. Grass Research 6: e027 doi: 10.48130/grares-0026-0021 

Combined effects of methyl bromide and soil amendments on soil bacterial and fungal communities in turfgrass
- Received: 28 May 2026
- Revised: 16 July 2026
- Accepted: 23 July 2026
- Published online: 20 September 2026
Abstract: Fumigation is widely used to control soilborne plant pathogens but can also disrupt nontarget microbes. This study examined how methyl bromide fumigation and subsequent biological amendment application influenced bacterial and fungal communities on a golf course putting green. One week before creeping bentgrass was sown, methyl bromide was applied, and surface amendments of biosolids, swine manure, and various biological products were added to the fumigated plots. Over almost 9 months, 240 soil samples were collected and profiled by sequencing bacterial 16S rRNA and fungal ITS2 regions. Fumigation significantly altered both bacterial and fungal diversity, whereas the added amendments produced no significant effect. Fumigation not only reduced the relative abundance of several potential pathogens (e.g., Caulobacter, Xanthomonas, Pasteuria, Phellinopsis, and Striaticonidium) but also diminished beneficial taxa involved in nutrient cycling and plant health (e.g., Anderseniella, Xanthobacter, Flavobacterium, Rhizoglomus, Trichoderma, and Mortierella). Conversely, opportunistic microbes capable of degrading complex organic matter and facilitating nutrient cycling increased after fumigation. Microbial communities did not return to their prefumigation composition within 255 days. These results show that significant chemical disruptions, such as fumigant application, can strongly reshape soil microbiomes. This disruption affected both harmful and beneficial organisms, but surface-applied organic amendments alone were insufficient to restore microbial balance after fumigation.