-
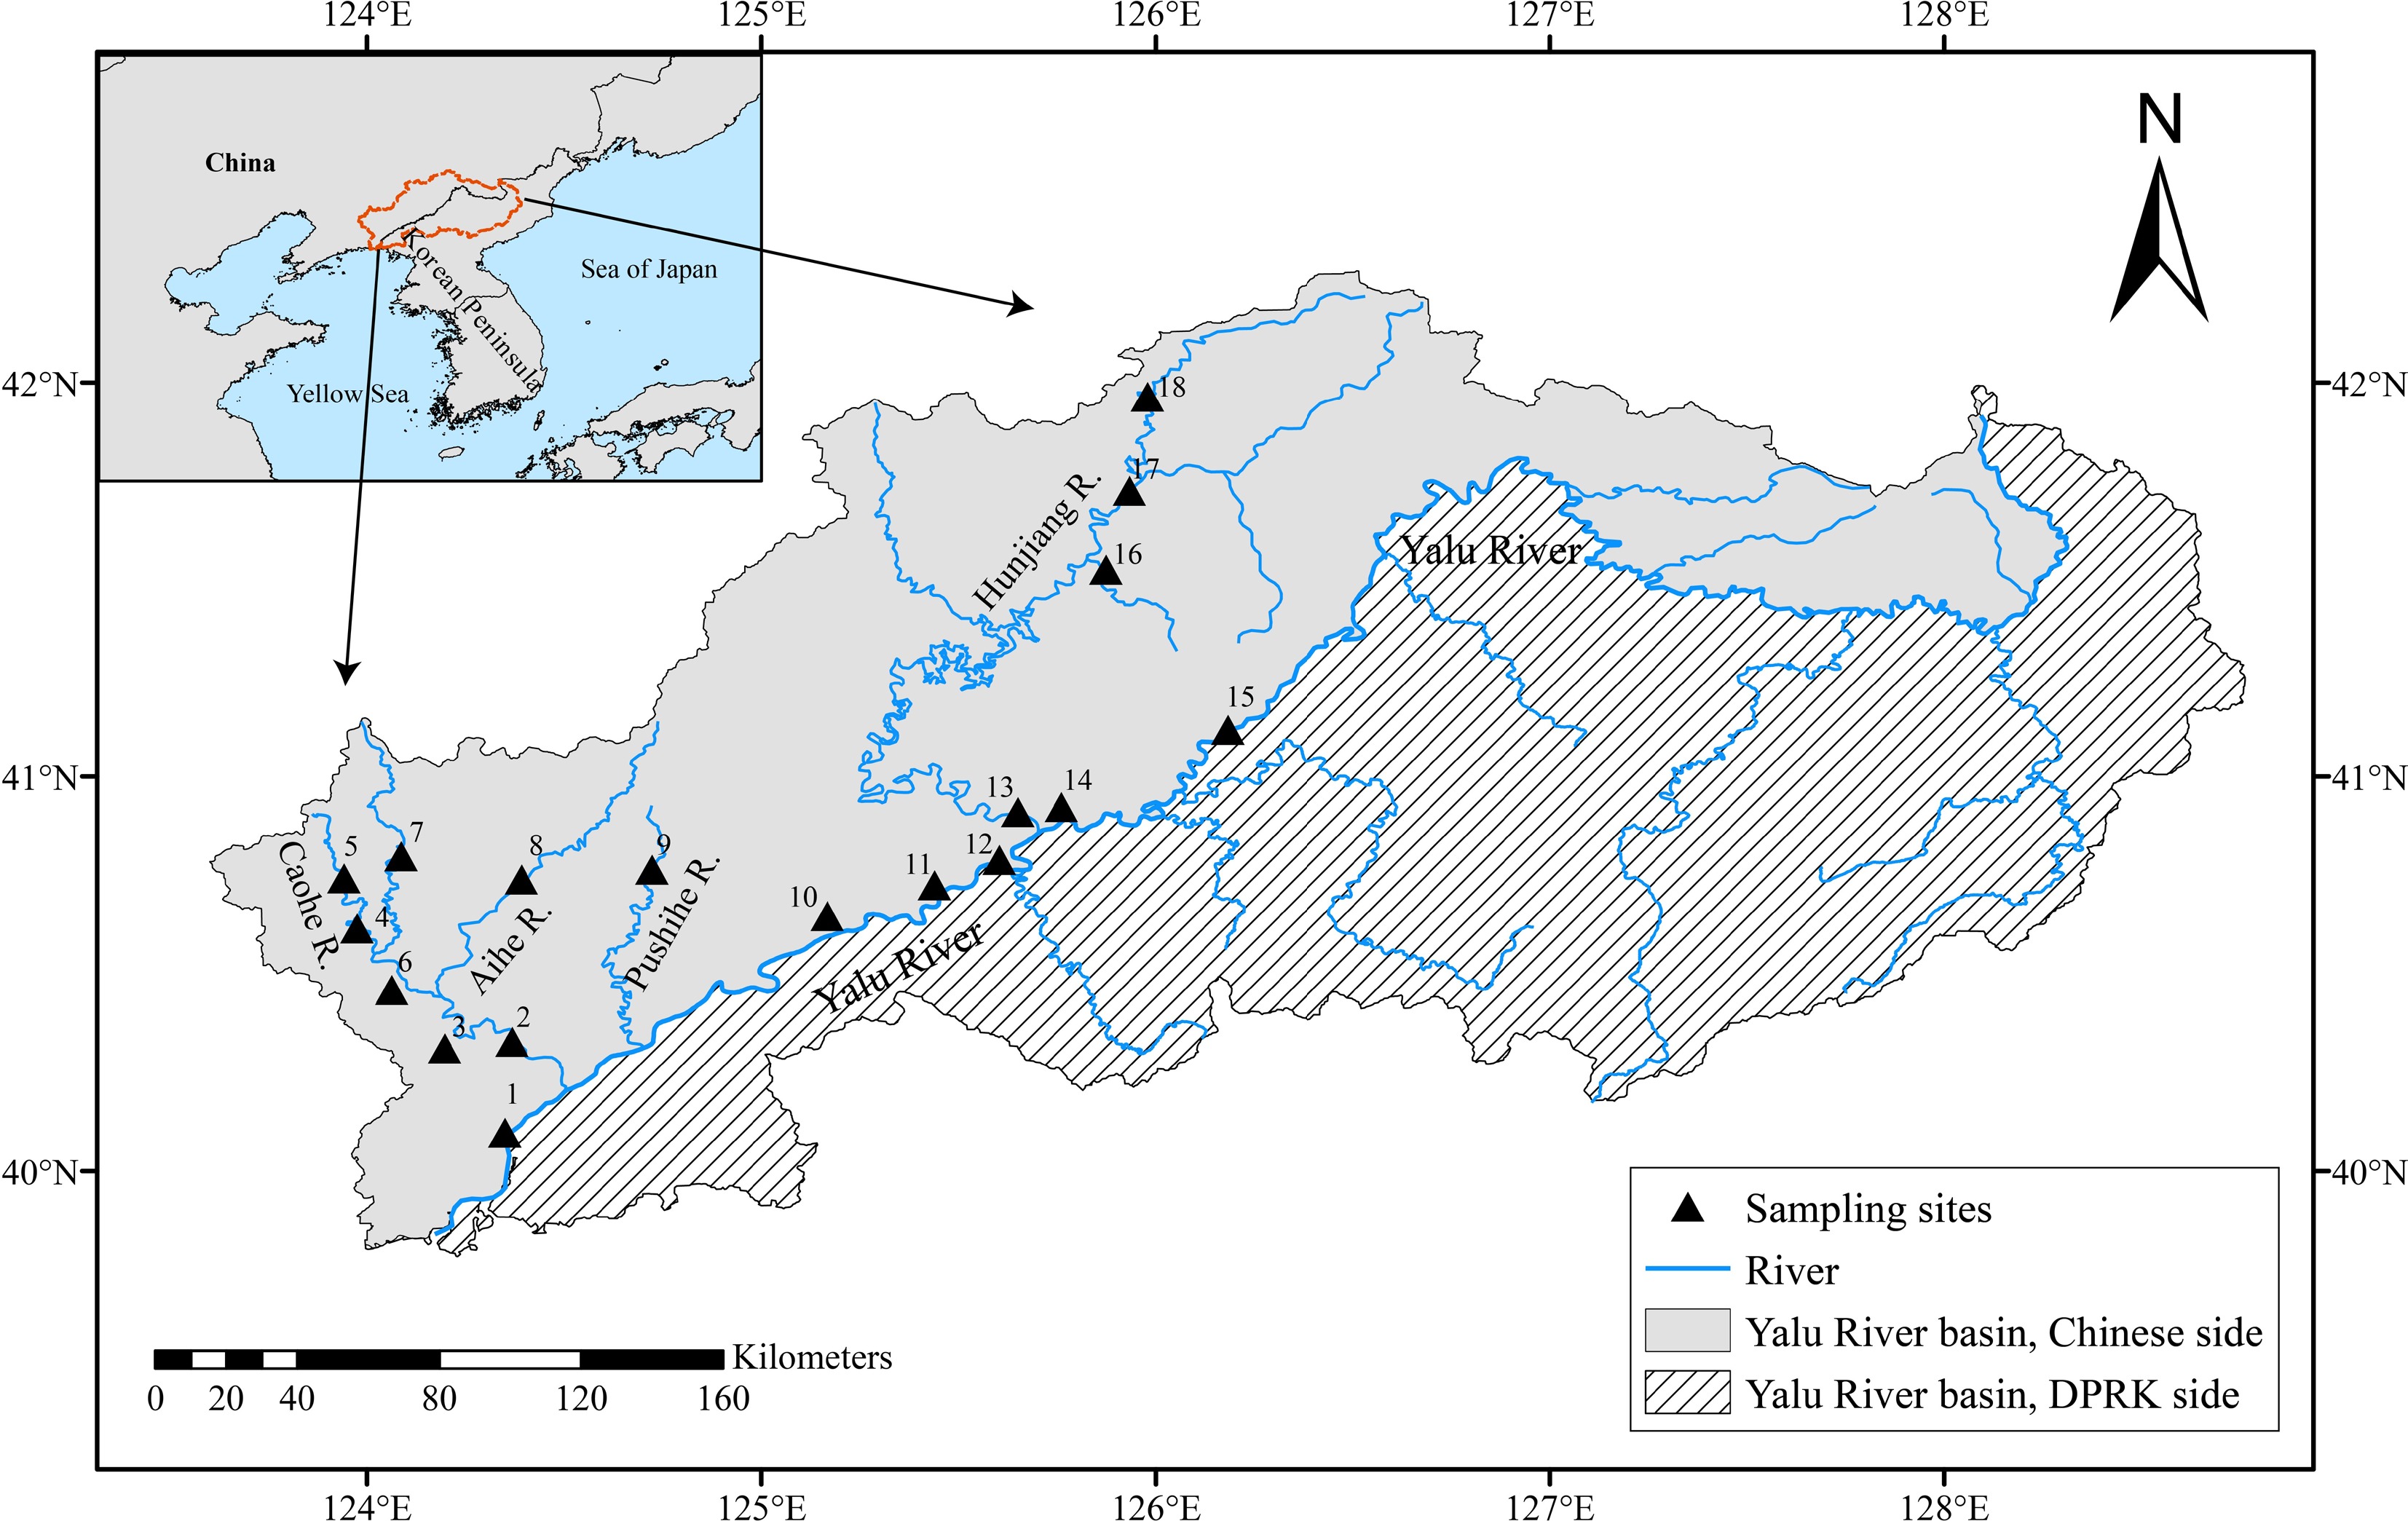
Figure 1.
Map of the Yalu River Basin showing the 18 sampling sites in the Chinese section. Country boundaries and coastlines were obtained from Natural Earth (Admin 0 – Countries, 1:10 m Cultural Vectors, version 5.1.1). River network and drainage basin data were obtained from HydroRIVERS and HydroBASINS, respectively[14].
-
Species n Standard length (cm) Weight (g) 95% CI of a a 95% CI of b b R2 Max Min Max Min T. lanceolata 152 7.173 2.823 8.42 0.55 0.01826–0.02426 0.02126 2.93445–3.09955 3.01700 0.97165 S. gracilis 50 5.841 3.785 3.59 0.89 0.01057–0.02402 0.01729 2.73362–3.20479 2.96921 0.93650 P. longirostris 47 13.130 5.576 28.00 1.84 0.00788–0.01236 0.01012 2.98602–3.17132 3.07867 0.98907 Z. platypus 110 11.243 1.003 19.60 1.20 0.00702–0.01221 0.00961 3.05373–3.30372 3.17873 0.96577 A. yamatsutae 155 6.671 2.340 5.84 0.36 0.02693–0.03419 0.03056 2.68818–2.83511 2.76164 0.97050 Table 1.
Descriptive statistics and parameters of LWRs for five native fish species in the Chinese section of the Yalu River Basin.
Figures
(1)
Tables
(1)