-
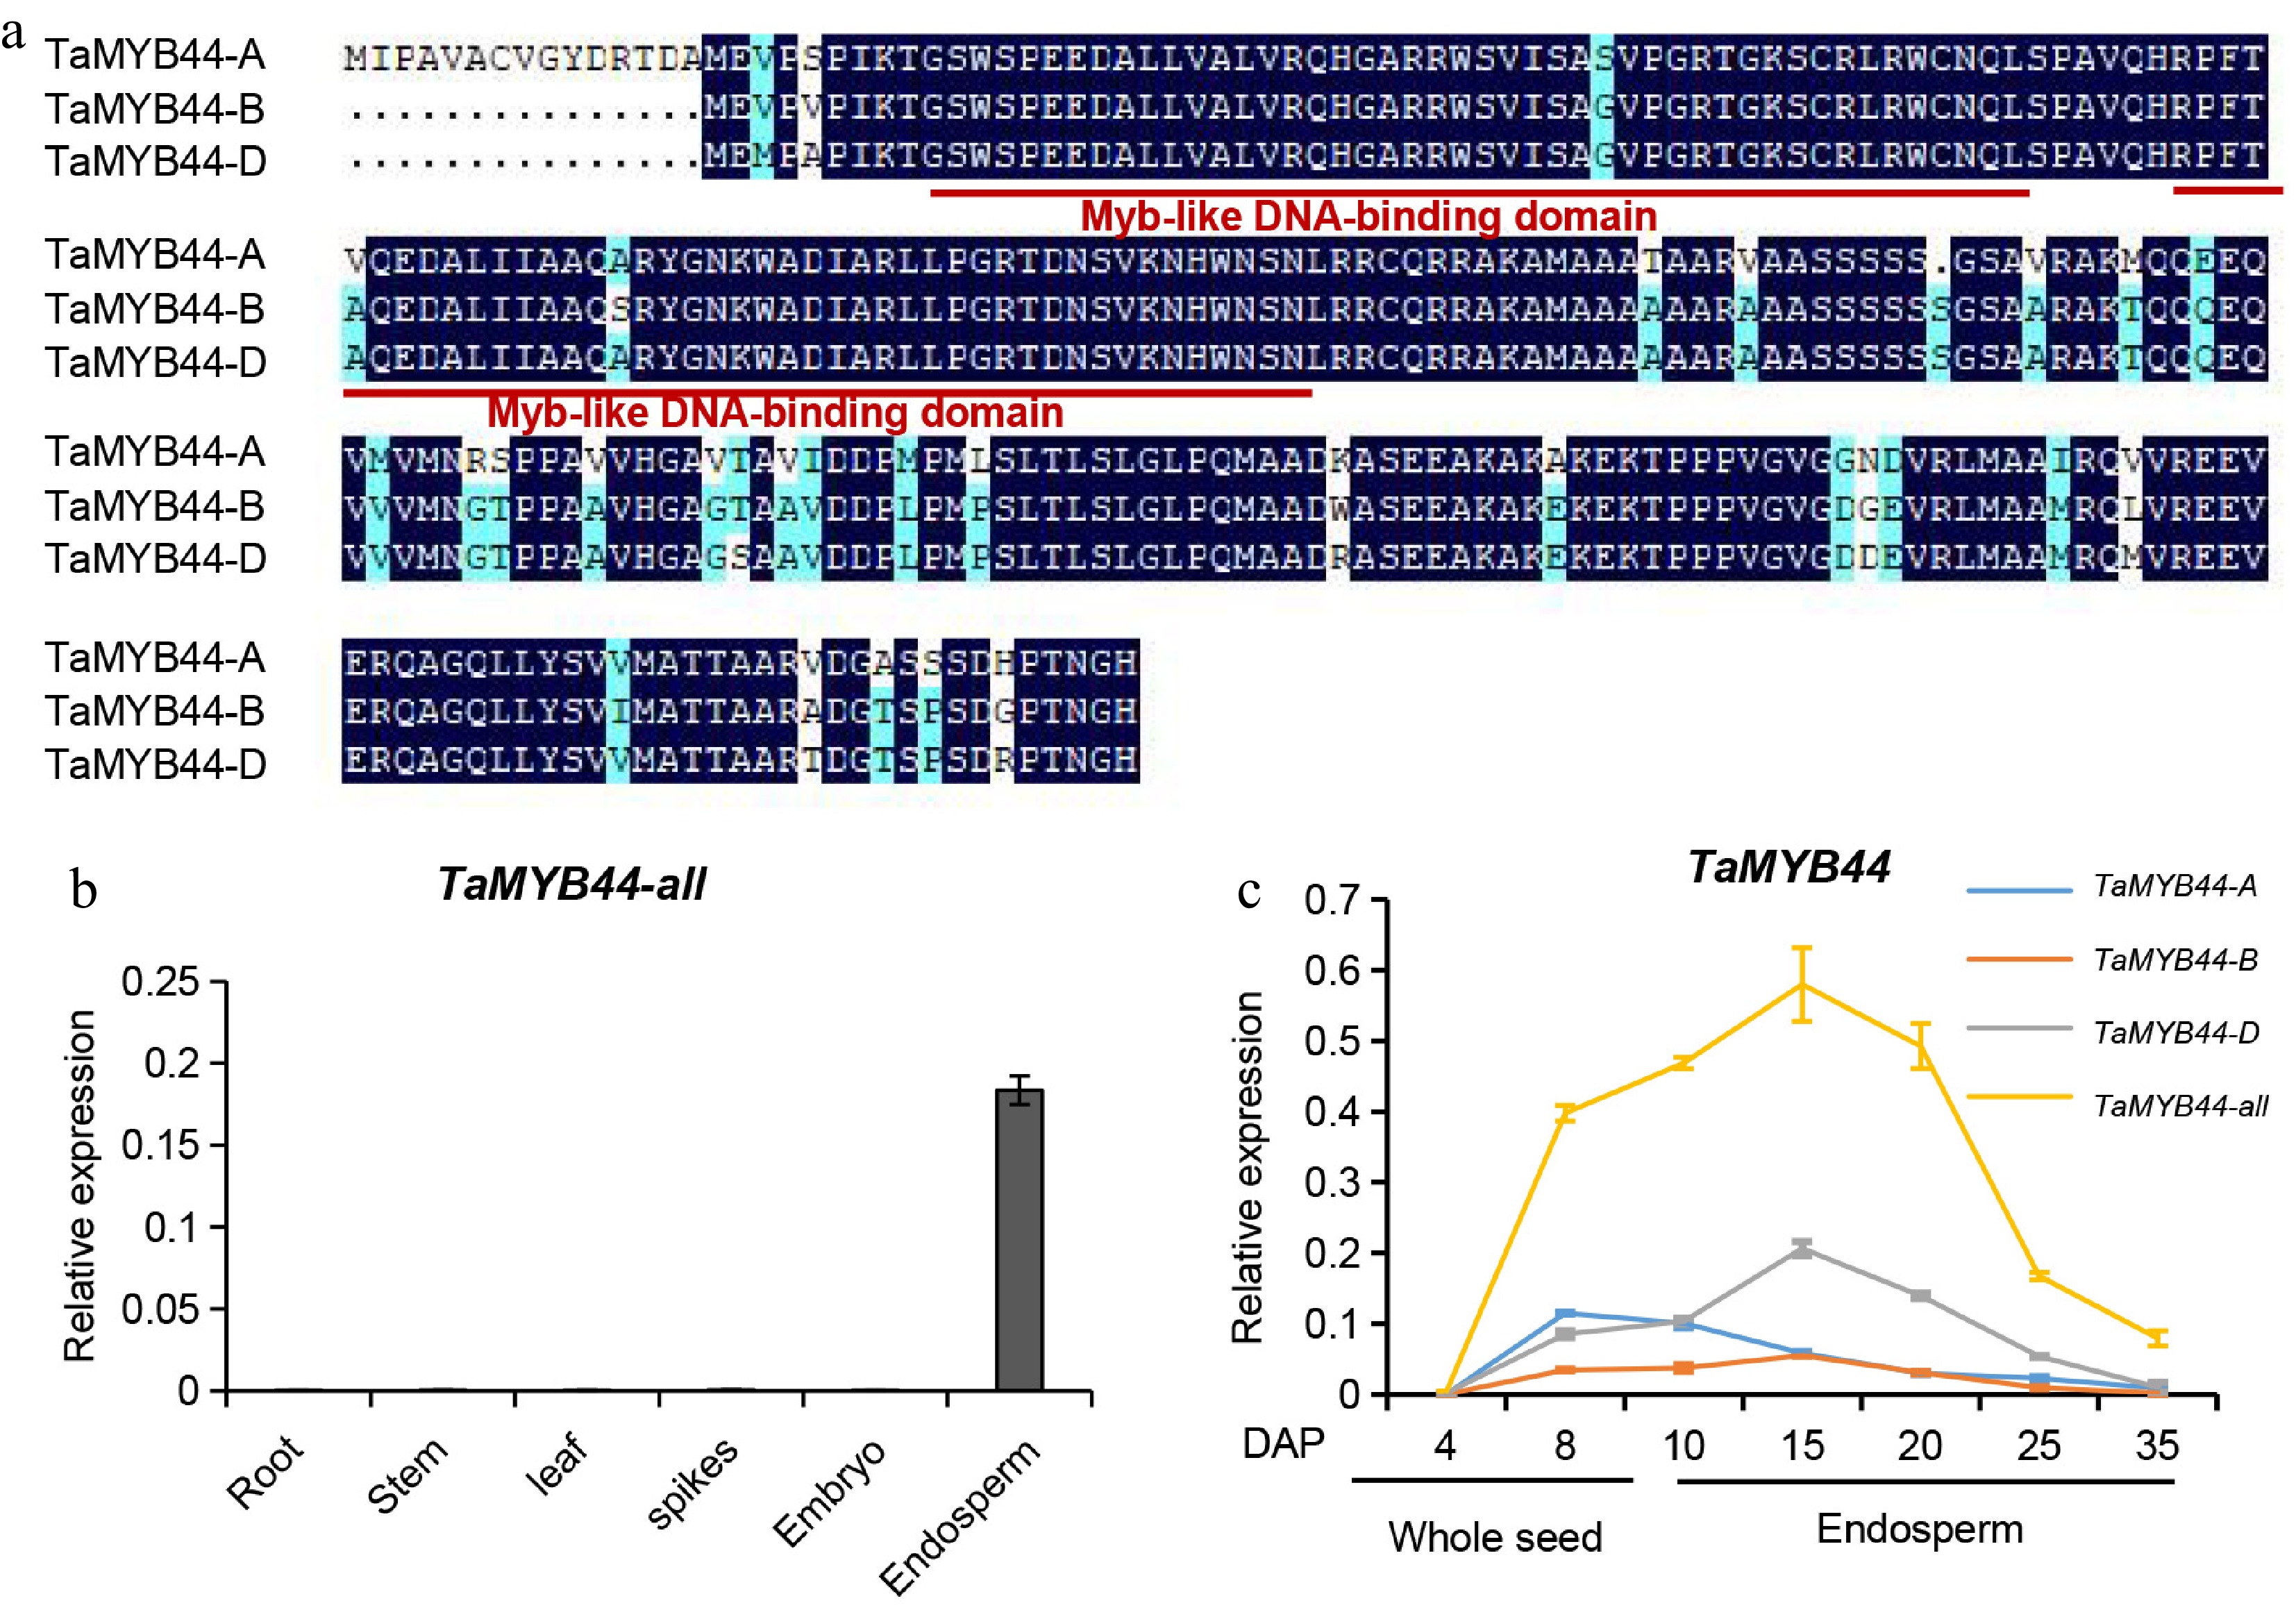
Figure 1.
Identification of endosperm-specific TF TaMYB44 (a) Amino acids of three TaMYB44 homeologs. Red solid lines represent Myb-like DNA-binding domain. (b) Relative transcript levels of TaMYB44-all in the indicated tissues, as determined by RT-qPCR. Data were normalized to wheat TaACTIN, shown as mean ± SD (n = 3). All TaMYB44 transcript levels were measured using a primer combination allowing mRNA amplification of three TaMYB44 homologs. (c) Relative transcript levels of three TaMYB44 homologs and all TaMYB44 genes, estimated using total RNA extracted from whole seeds from 4 and 8 DAP and endosperm (from 10 to 35 DAP).
-
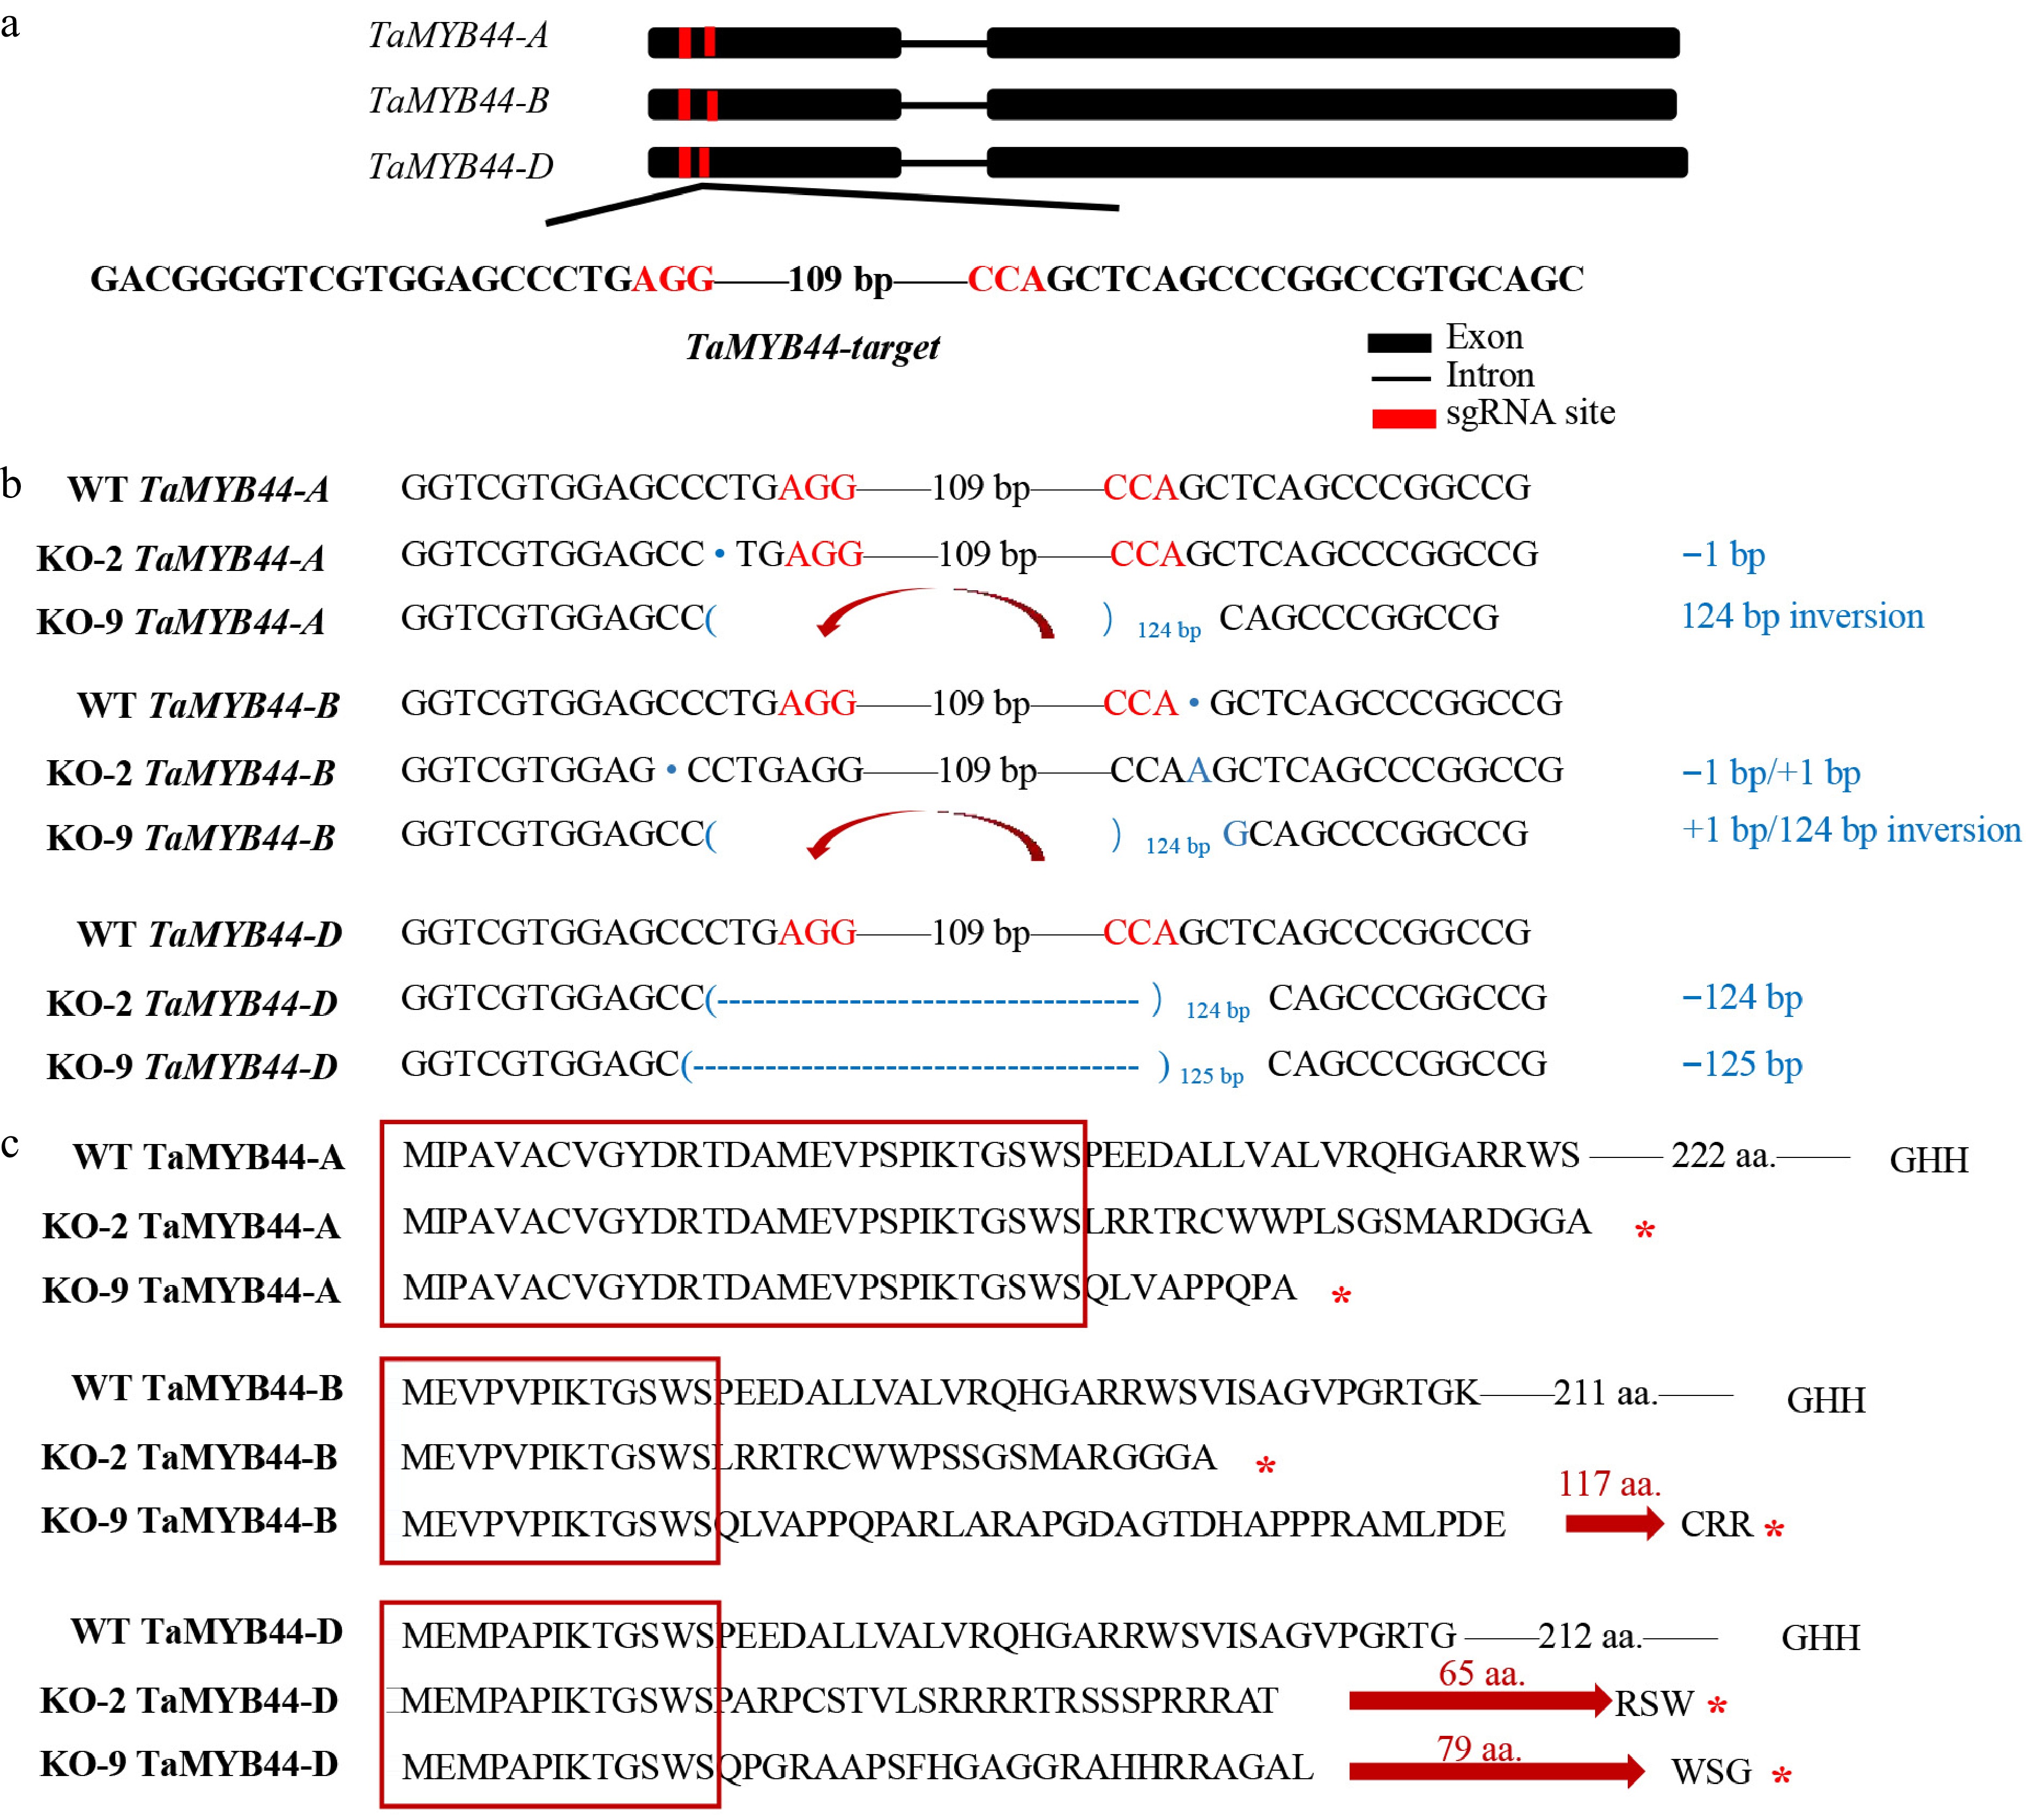
Figure 2.
TaMYB44 nucleotide and amino acid sequences mutation of TaMYB44 knockout lines. (a) Strategy used to produce the TaMYB44 knockout lines. Sequences of two sgRNAs used to target the region in the first exon that is conserved among the three TaMYB44 homeologs (upper panel). The protospacer-adjacent motif (PAM) sequences are highlighted in red. (b) Nucleotide sequences of WT and TaMYB44 mutants at the three TaMYB44 homeologs. PAM sequences are highlighted in red. The nucleotide mutation is highlighted in blue. "+" and "−" indicate the insertion or deletion caused by the CRISPR/Cas9-induced mutations, respectively. Numbers indicate the length of the insertion or deletion. The red curved arrow indicates the inversion of the nucleotide fragment. (c) Amino acid sequences of WT and TaMYB44 mutants at the three TaMYB44 homologs. The amino acids enclosed by the red box represent the nonmutated amino acid region. The red straight arrow indicates a frameshift mutation. The red asterisk means the translation is terminated.
-
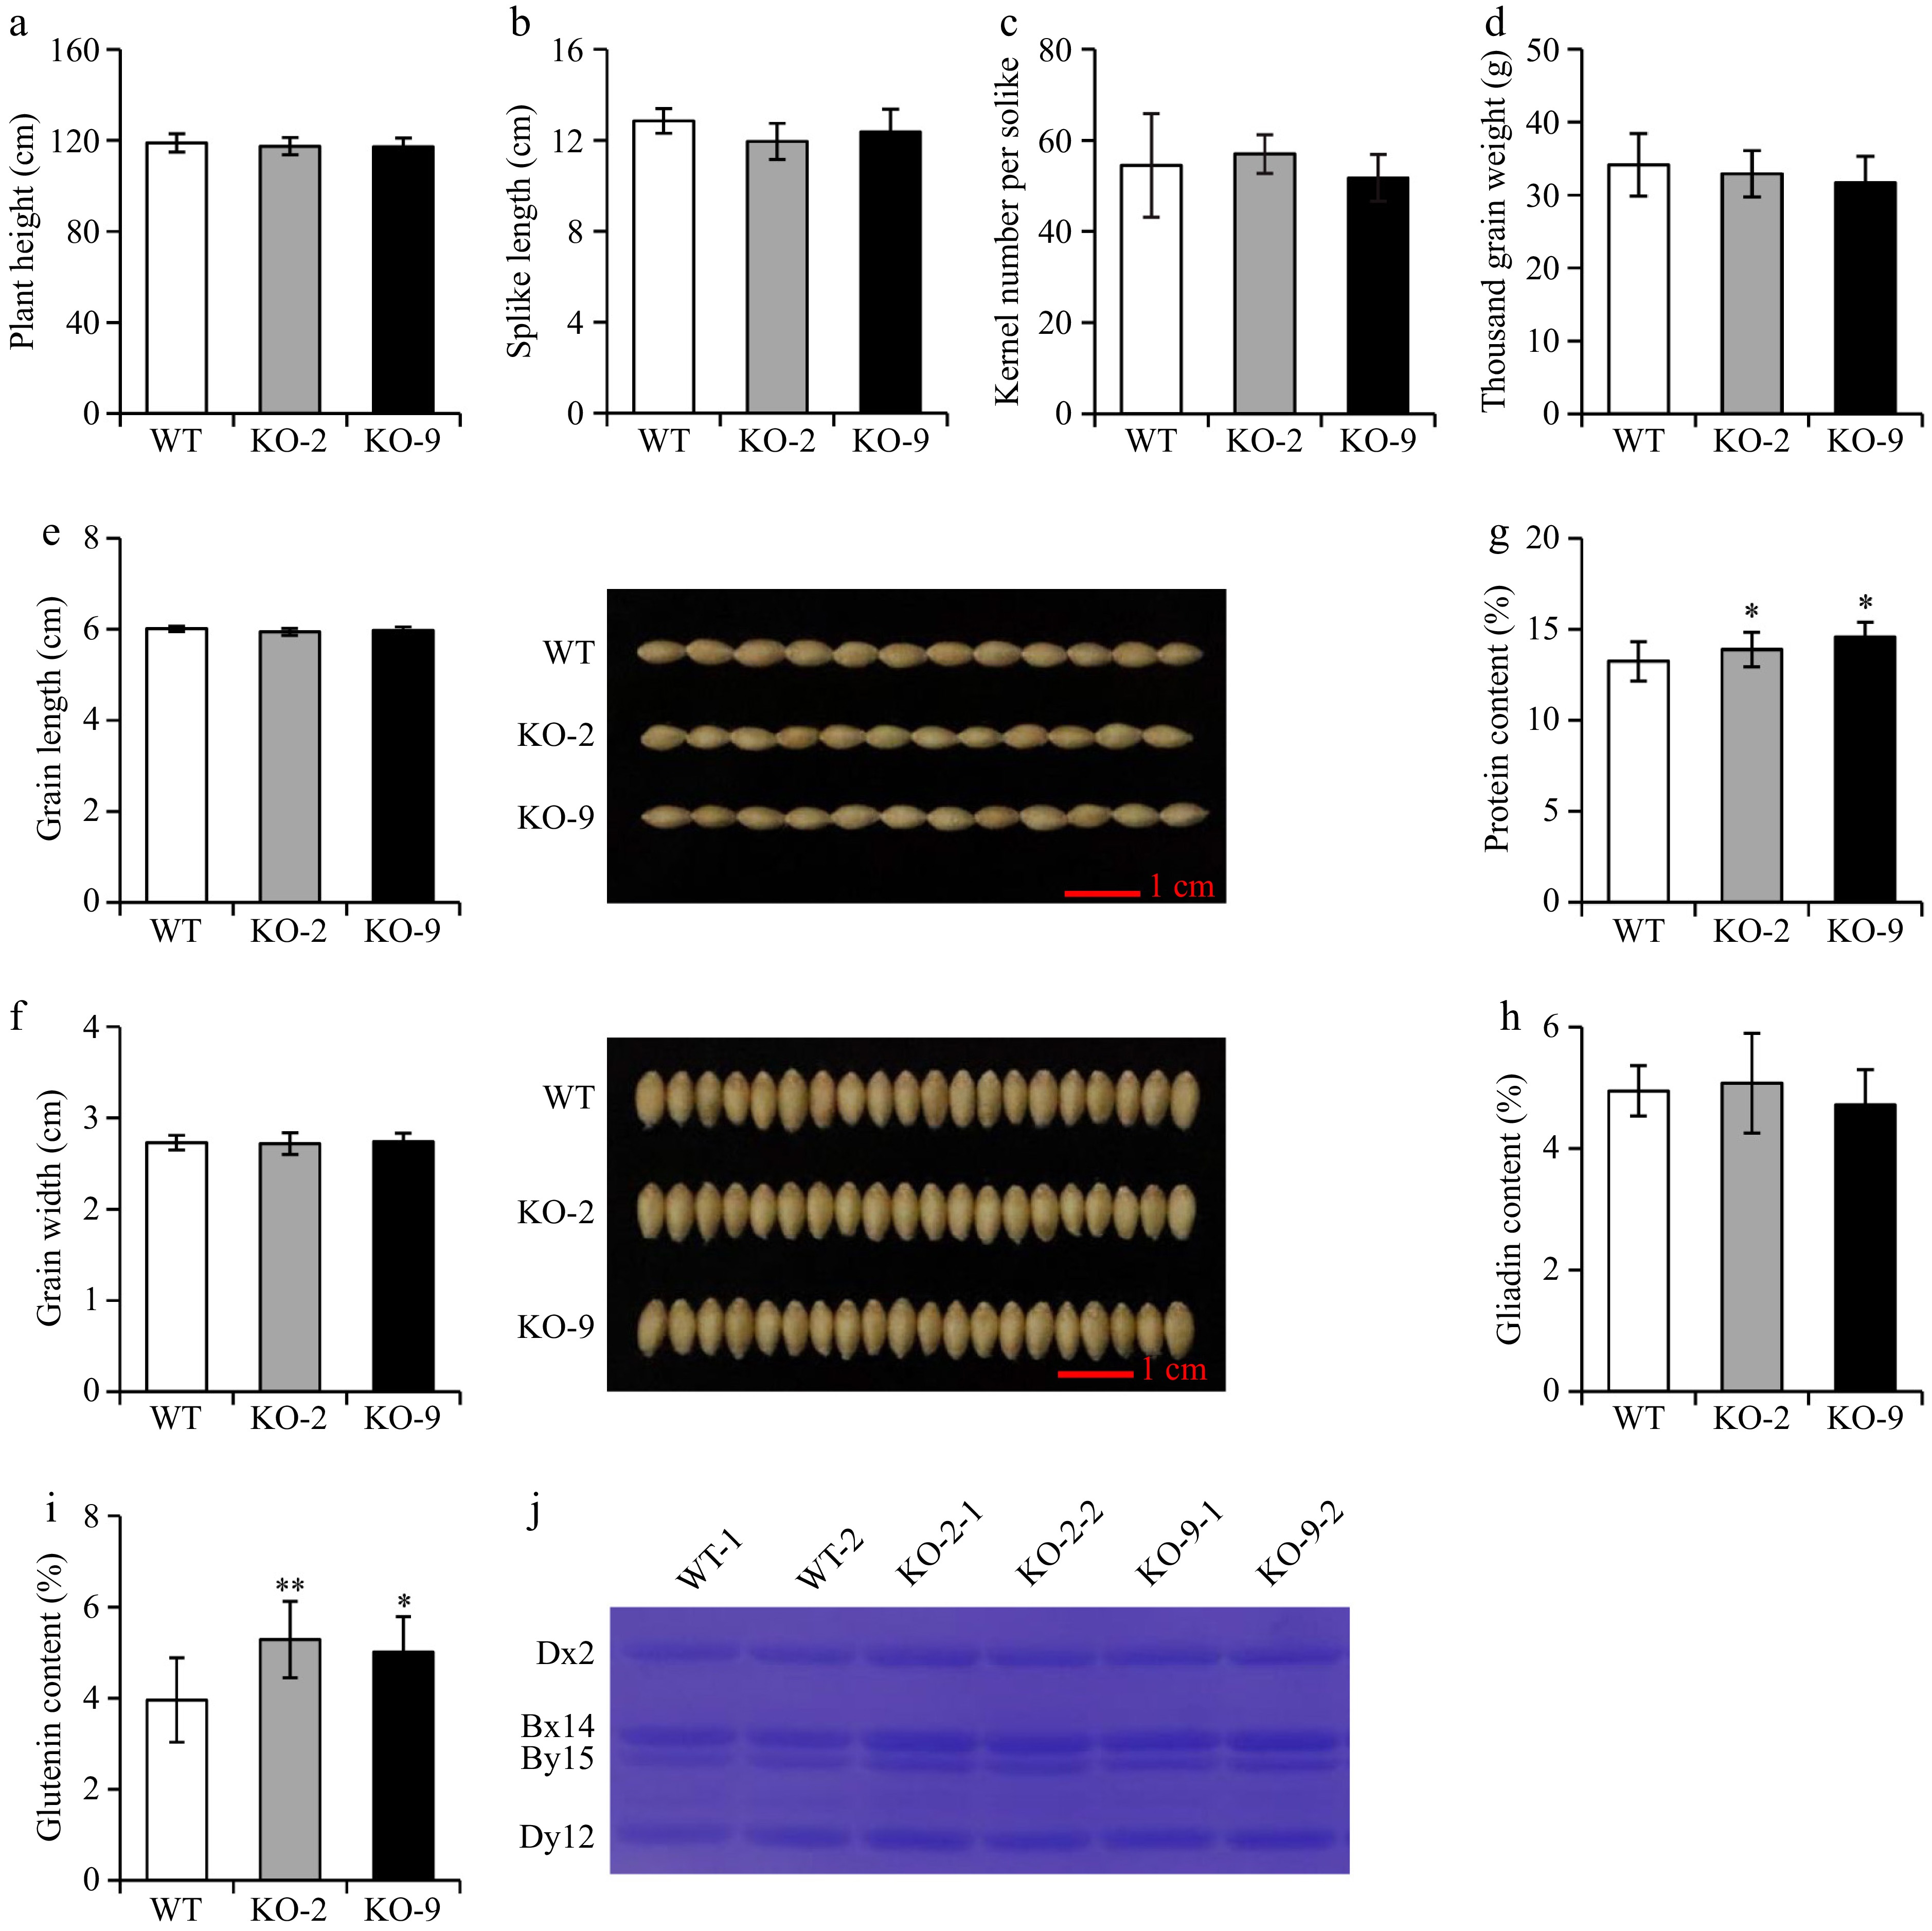
Figure 3.
Phenotypes of TaMYB44 knockout lines. (a) Plant height, (b) spike length, (c) kernel number per spike of WT and TaMYB44 knockout lines. Three repeats were carried out for each line to measure these phenotypes. (d) 1,000-grain weight, (e) grain length, (f) and grain width. Ten repeats were carried out for each line to measure these phenotypes. (g) Protein content analysis using near-infrared spectrometry. Twelve repeats were carried out for each line to measure these phenotypes. (h, i) Gliadins and gluten content analysis using the biuret method. Three repeats were carried out for each line to measure these phenotypes. (j) HMW-GS from KO-2, KO-9, and WT determined by Coomassie brilliant blue protein gel staining. The single and double asterisks represent significant differences compared with the WT as determined by Student's t-test at p < 0.05 and p < 0.01, respectively.
-
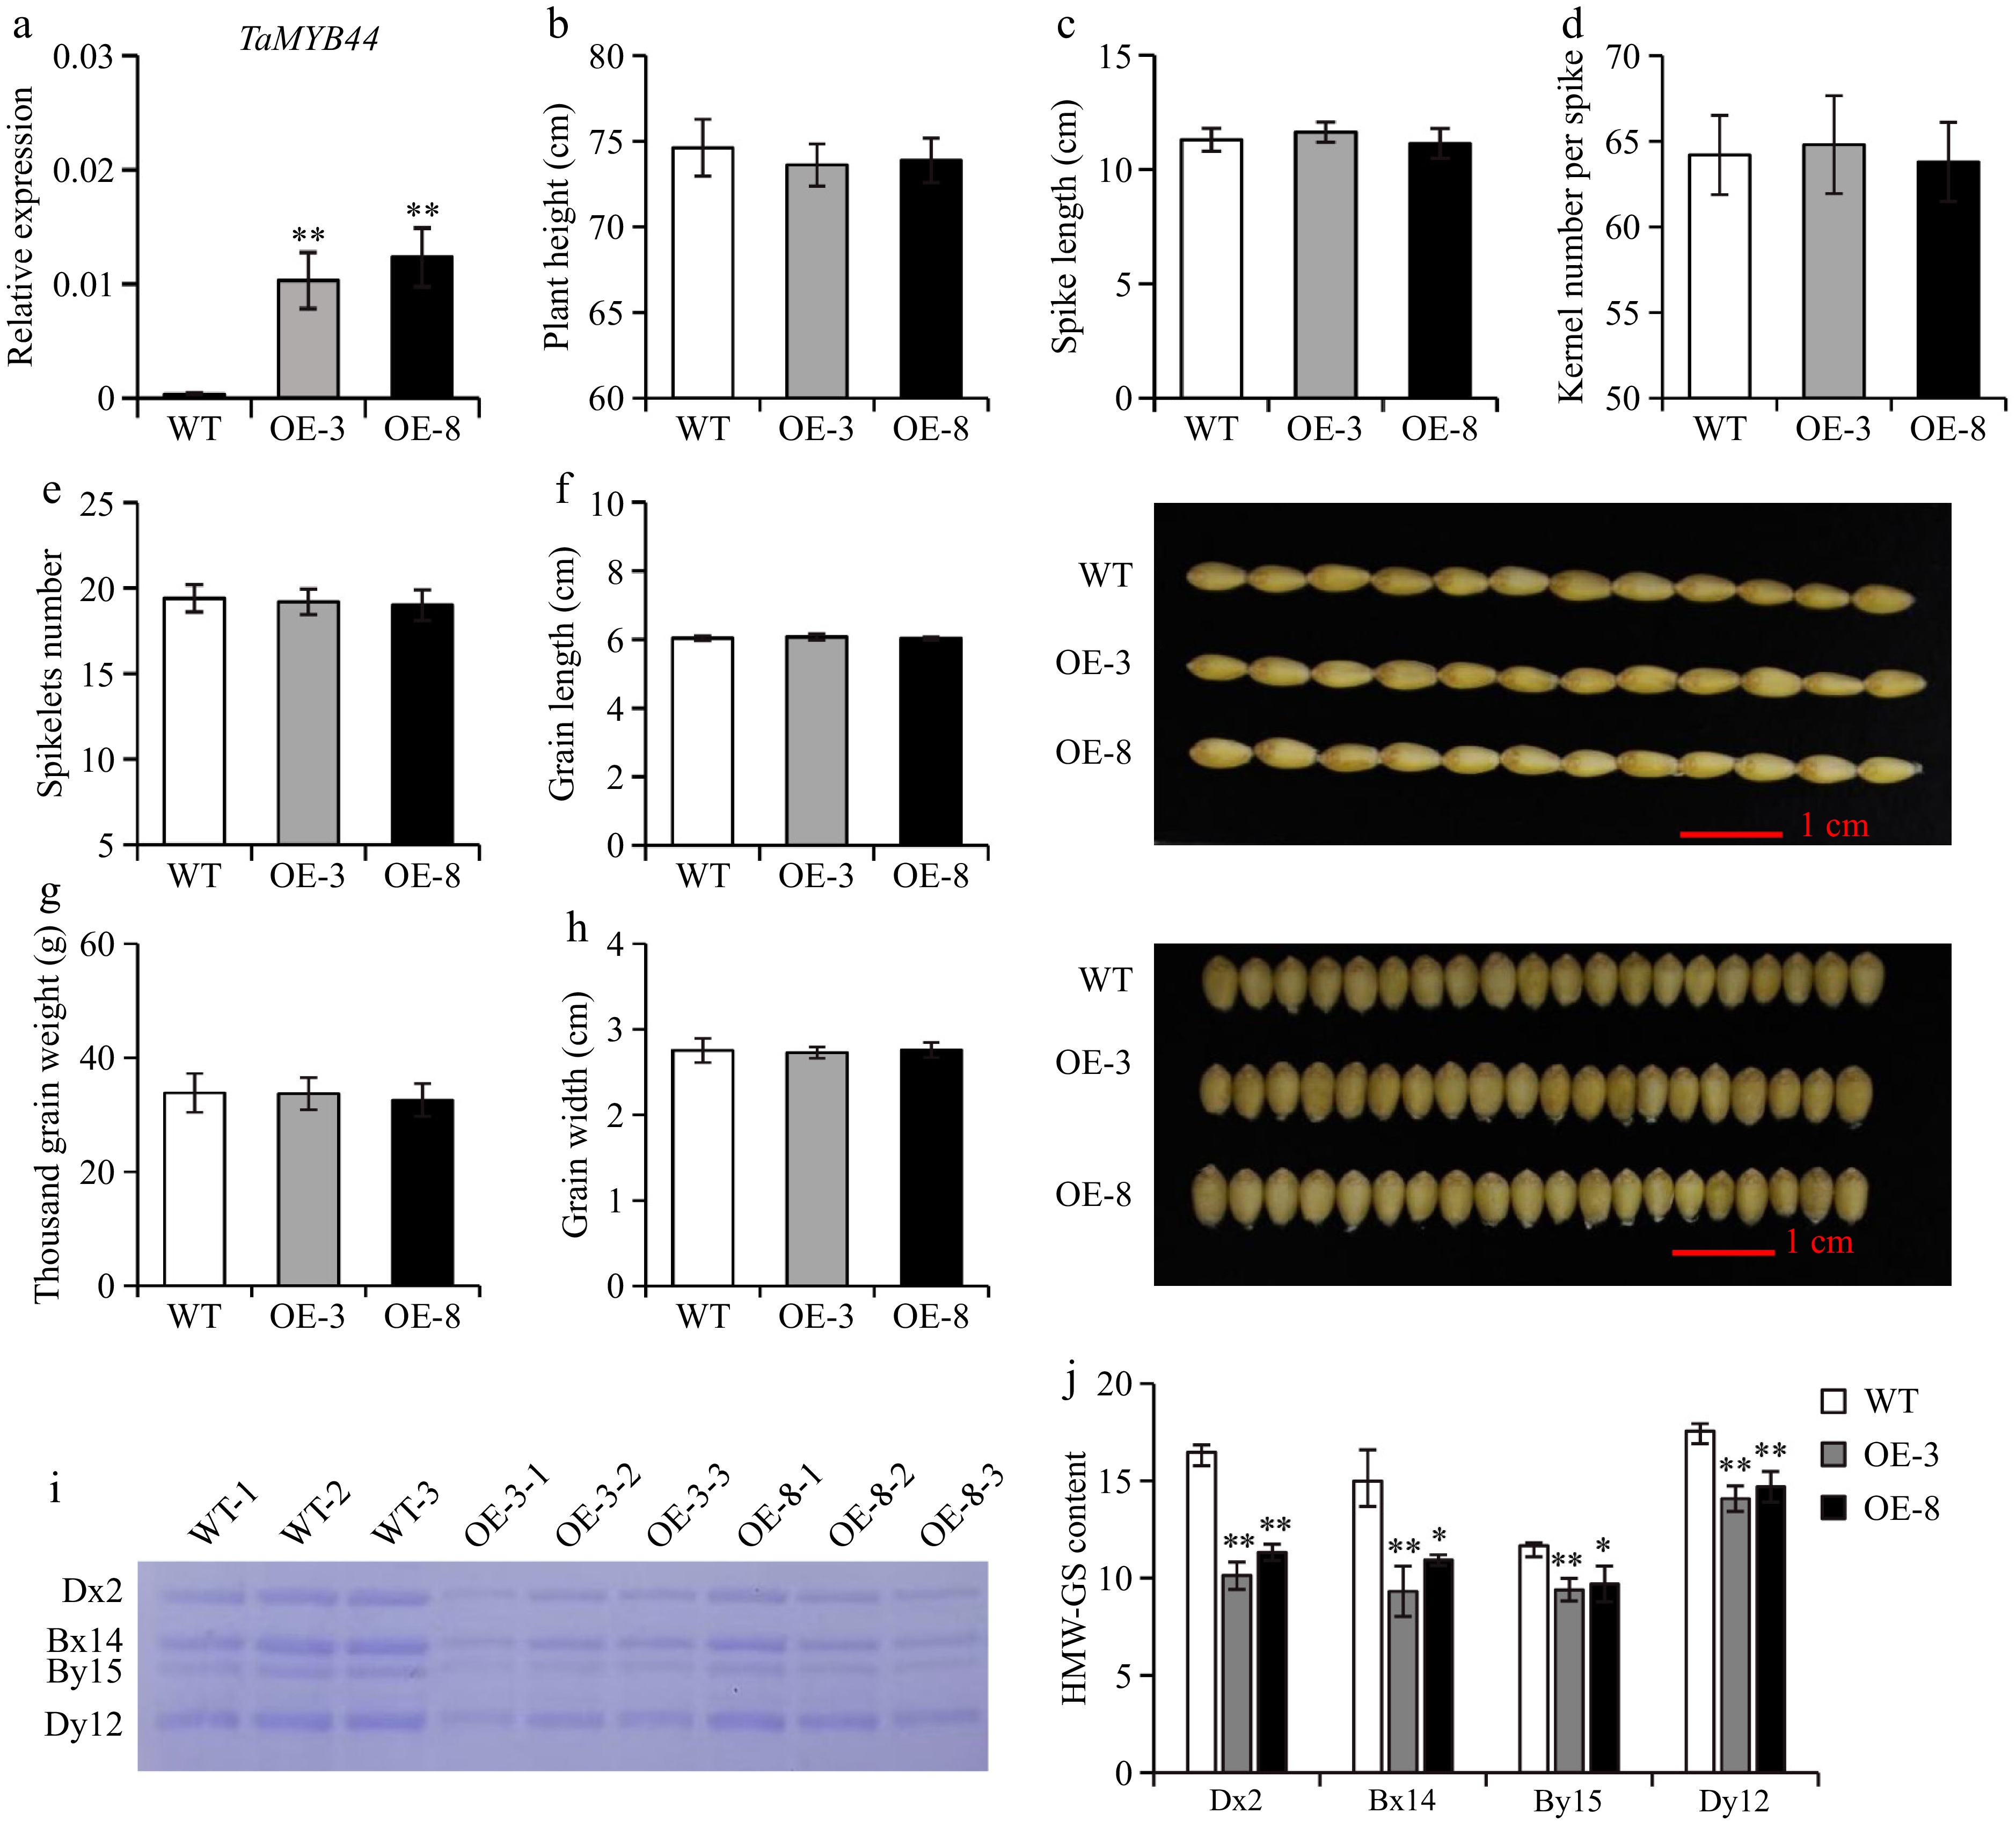
Figure 4.
Phenotypes of TaMYB44 overexpression lines. (a) Relative transcript levels of TaMYB44 in WT and TaMYB44 overexpression lines (OE-3 and OE-8), as determined by RT-qPCR. Data were normalized to wheat TaACTIN, shown as the mean ± standard deviation (SD) (n = 3). (b) Plant height, (c) spike length, (d) kernel number per spike, and (e) spikelets number of WT and TaMYB44 overexpression lines. Three repeats were carried out for each line to measure these phenotypes. (f) Grain length, (g) 1,000-grain weight, and (h) and grain width of WT and TaMYB44 overexpression lines are measured. Nine repeats were carried out for each line to measure these phenotypes. (i) HMW-GS from OE-3, OE-8, and WT revealed by Coomassie brilliant blue-stained SDS-PAGE gel. (j) Quantification of individual HMW-GS bands was performed using Image J software. Three repeats were carried out for each sample to measure the phenotype. The single and double asterisks represent significant differences compared with the WT and determined by Student's t-test at p < 0.05 and p < 0.01, respectively.
-
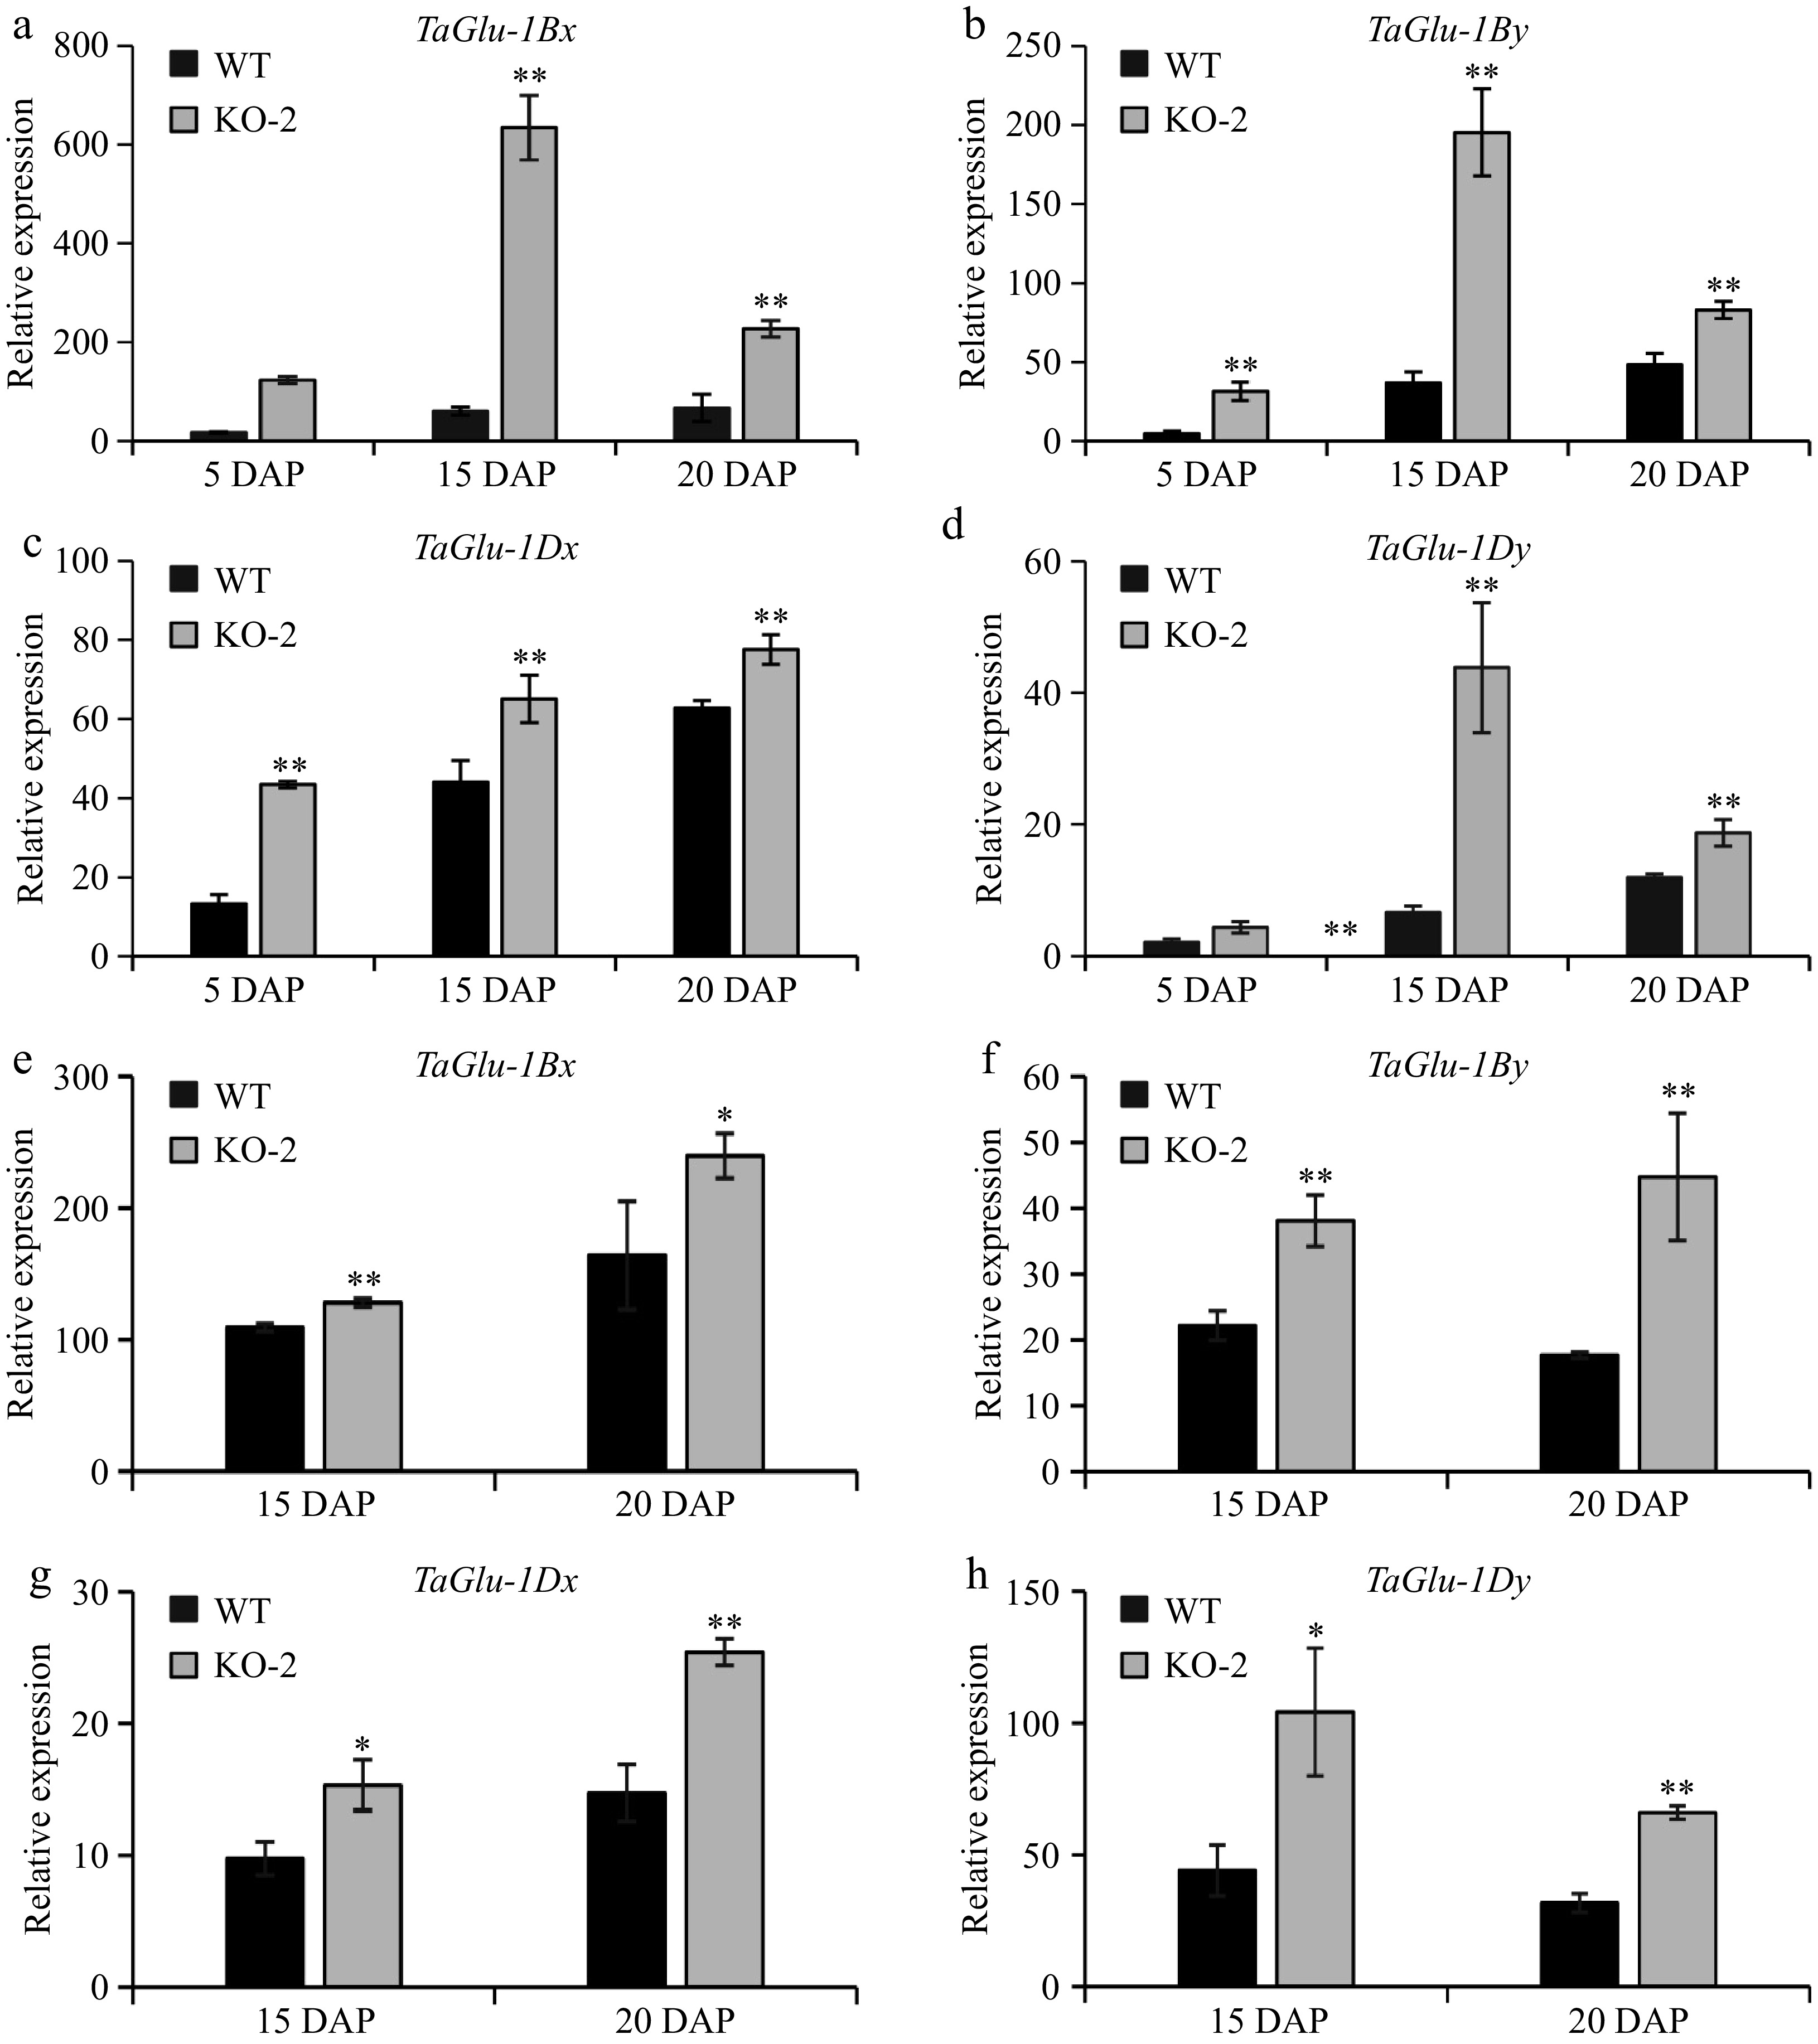
Figure 5.
HMW-GS genes expression regulated by TaMYB44. (a–d) RT-qPCR analysis of the HMW-GS genes (TaGlu-1Bx, TaGlu-1By, TaGlu-1Dx, and TaGlu-1Dy) expressed in WT and KO-2 seeds at 5, 15, and 20 DAP. Data were normalized to wheat TaACTIN and are shown as mean ± SD (n = 3). The single and double asterisks represent significant differences compared with WT and determined by Student's t-test at p < 0.05 and p < 0.01, respectively. (e, f) RT-qPCR analysis of the HMW-GS genes (TaGlu-1Bx, TaGlu-1By, TaGlu-1Dx, and TaGlu-1Dy) expressed in WT and KO-9 seeds at 15 and 20 DAP. Data were normalized to wheat TaACTIN, shown as the mean ± SD (n = 3). The single and double asterisks represent significant differences compared with WT and determined by Student's t-test at p < 0.05 and p < 0.01, respectively.
-
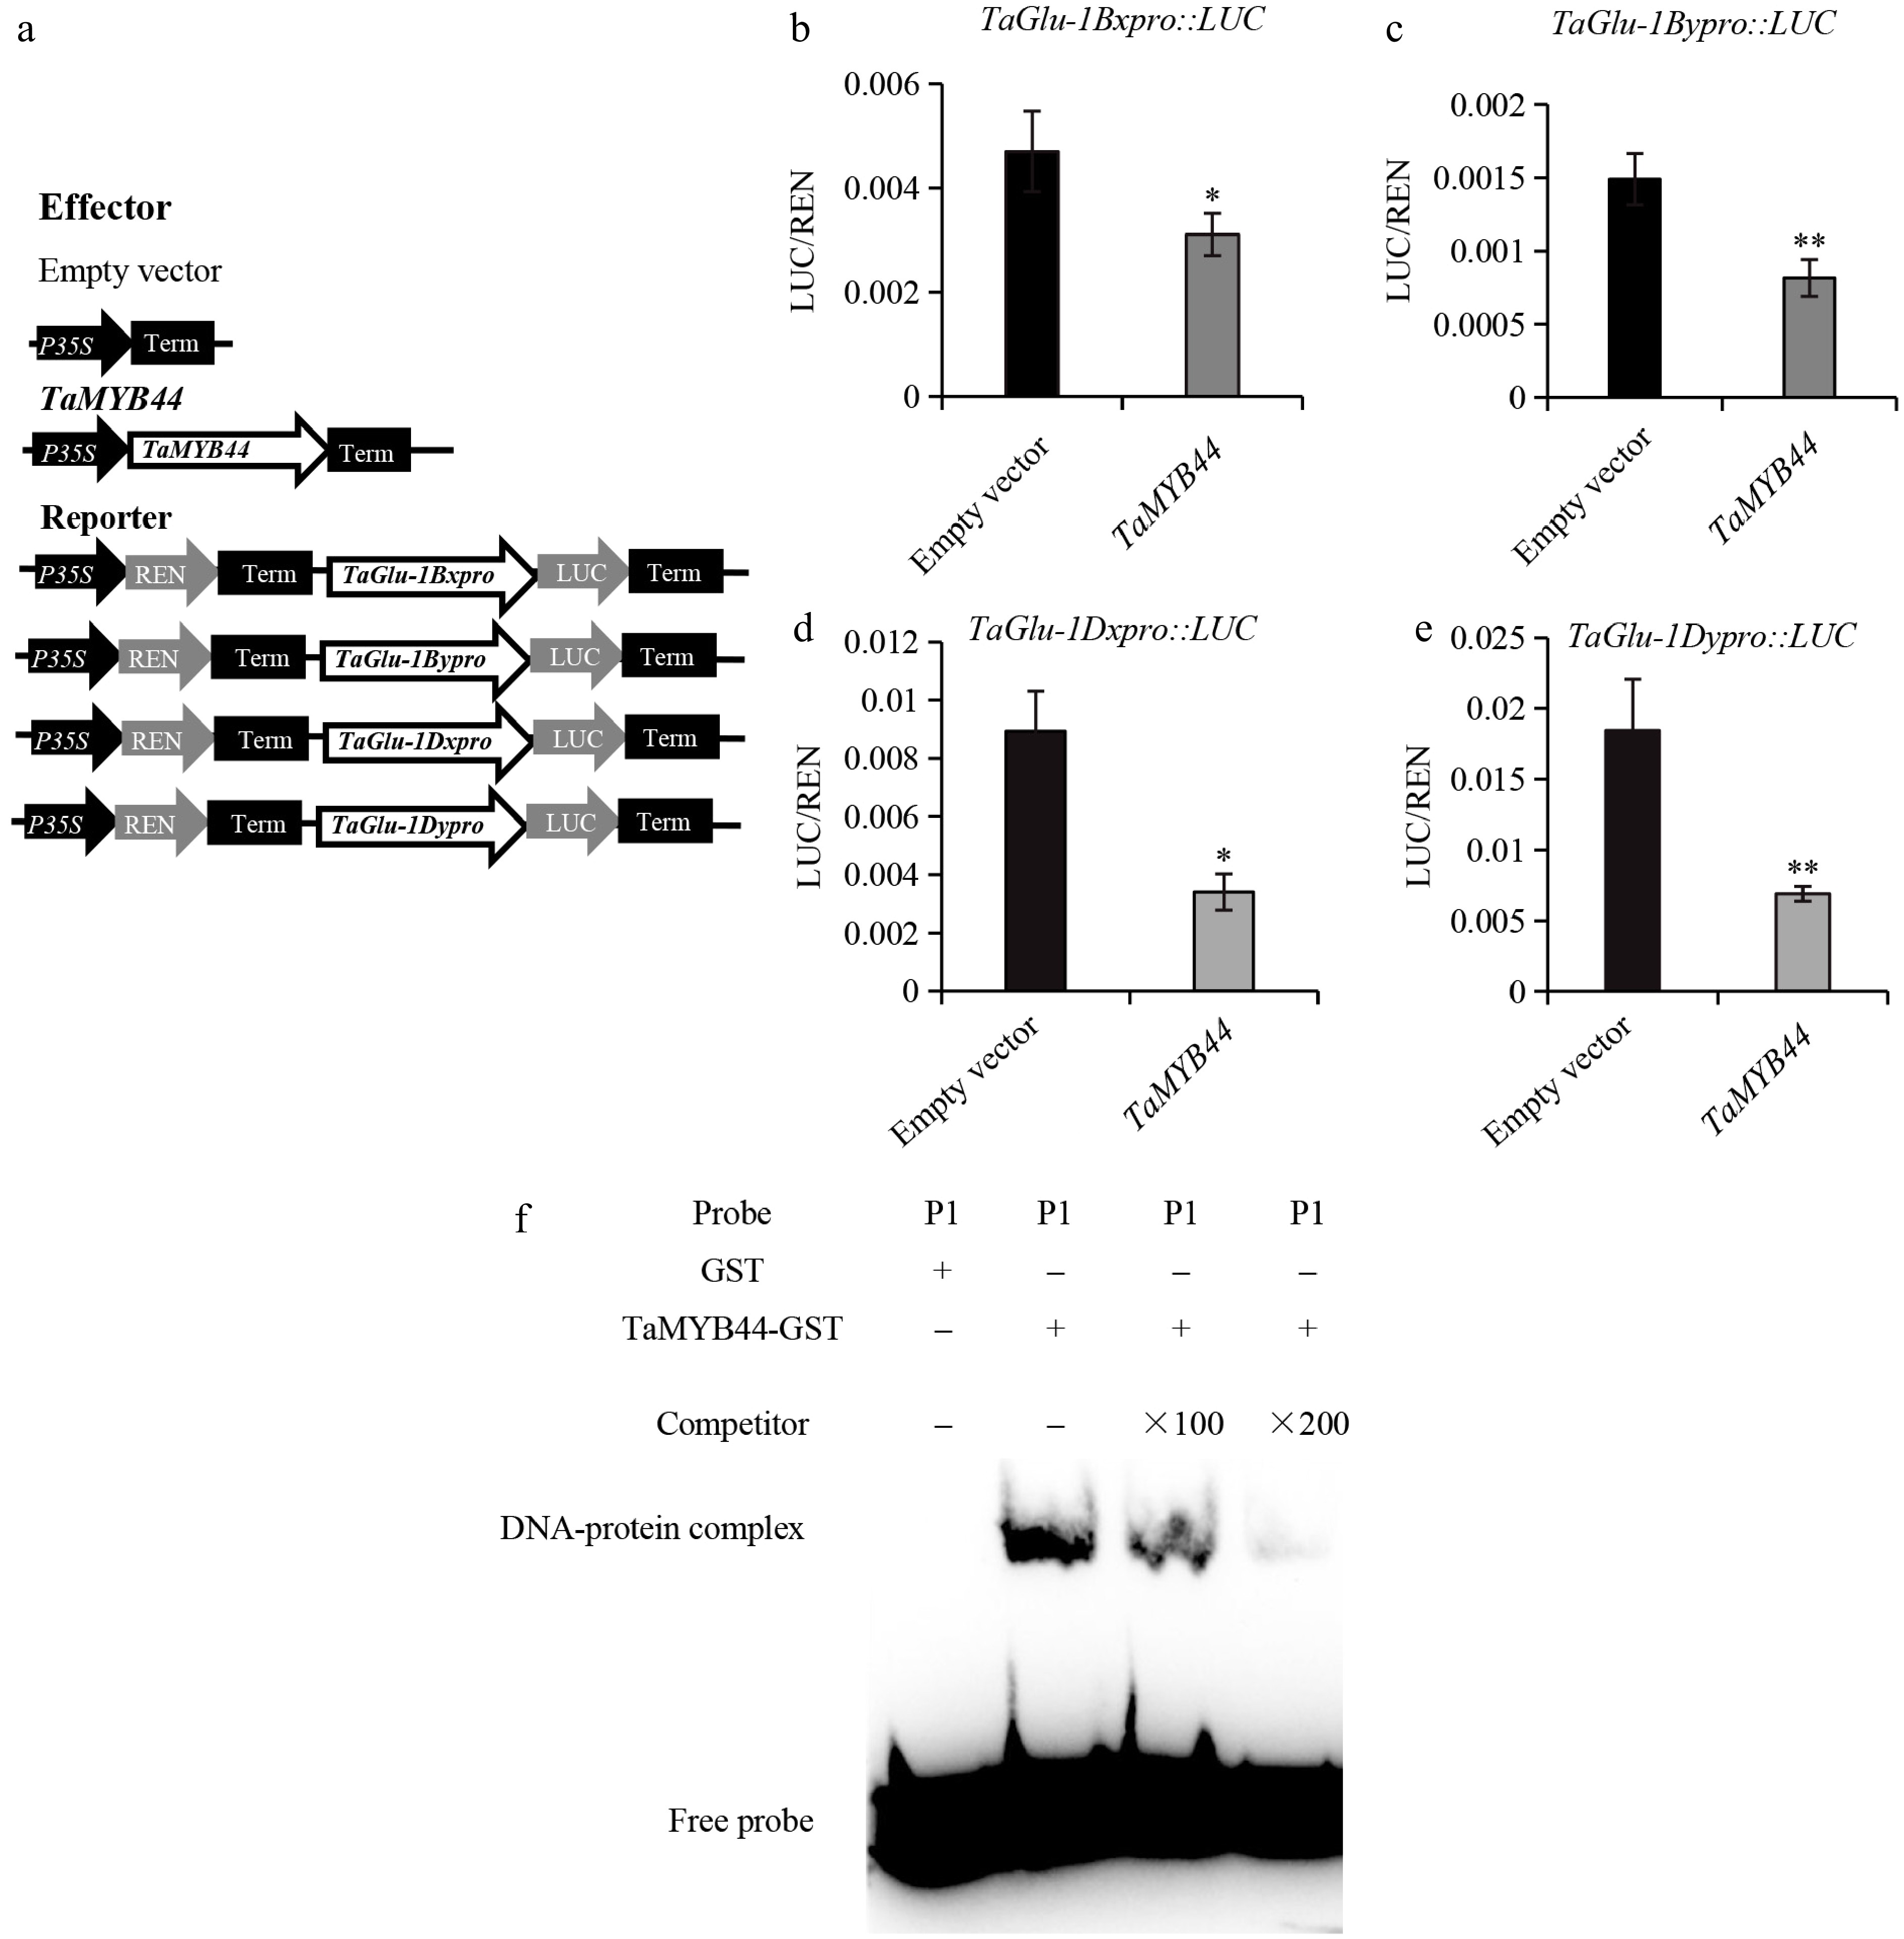
Figure 6.
TaMYB44 binds to TaGlu promoters to repress the expression of TaGlu. (a) Schematic diagrams of the effector and reporter plasmids. (b–e) Dual luciferase transcriptional activity assay to assess the ability of TaMYB44 to repress the expressions of target genes (TaGlu-1Bx, TaGlu-1By, TaGlu-1Dx, and TaGlu-1Dy). On the y-axis, LUC/REN indicates the ratio of the signal detected for firefly luciferase (LUC) and Renilla reniformis luciferase (REN) activity. Error bars represent the SD for three replicates. The single and double asterisks represent significant differences determined by Student's t-test at p < 0.05 and p < 0.01, respectively. (f) A P1 probe which contained the binding site of MYB TFs was used in EMSAs with TaMYB44-B-GST recombinant protein. "+" and "–" indicate the presence and absence of protein, respectively.
Figures
(6)
Tables
(0)