-
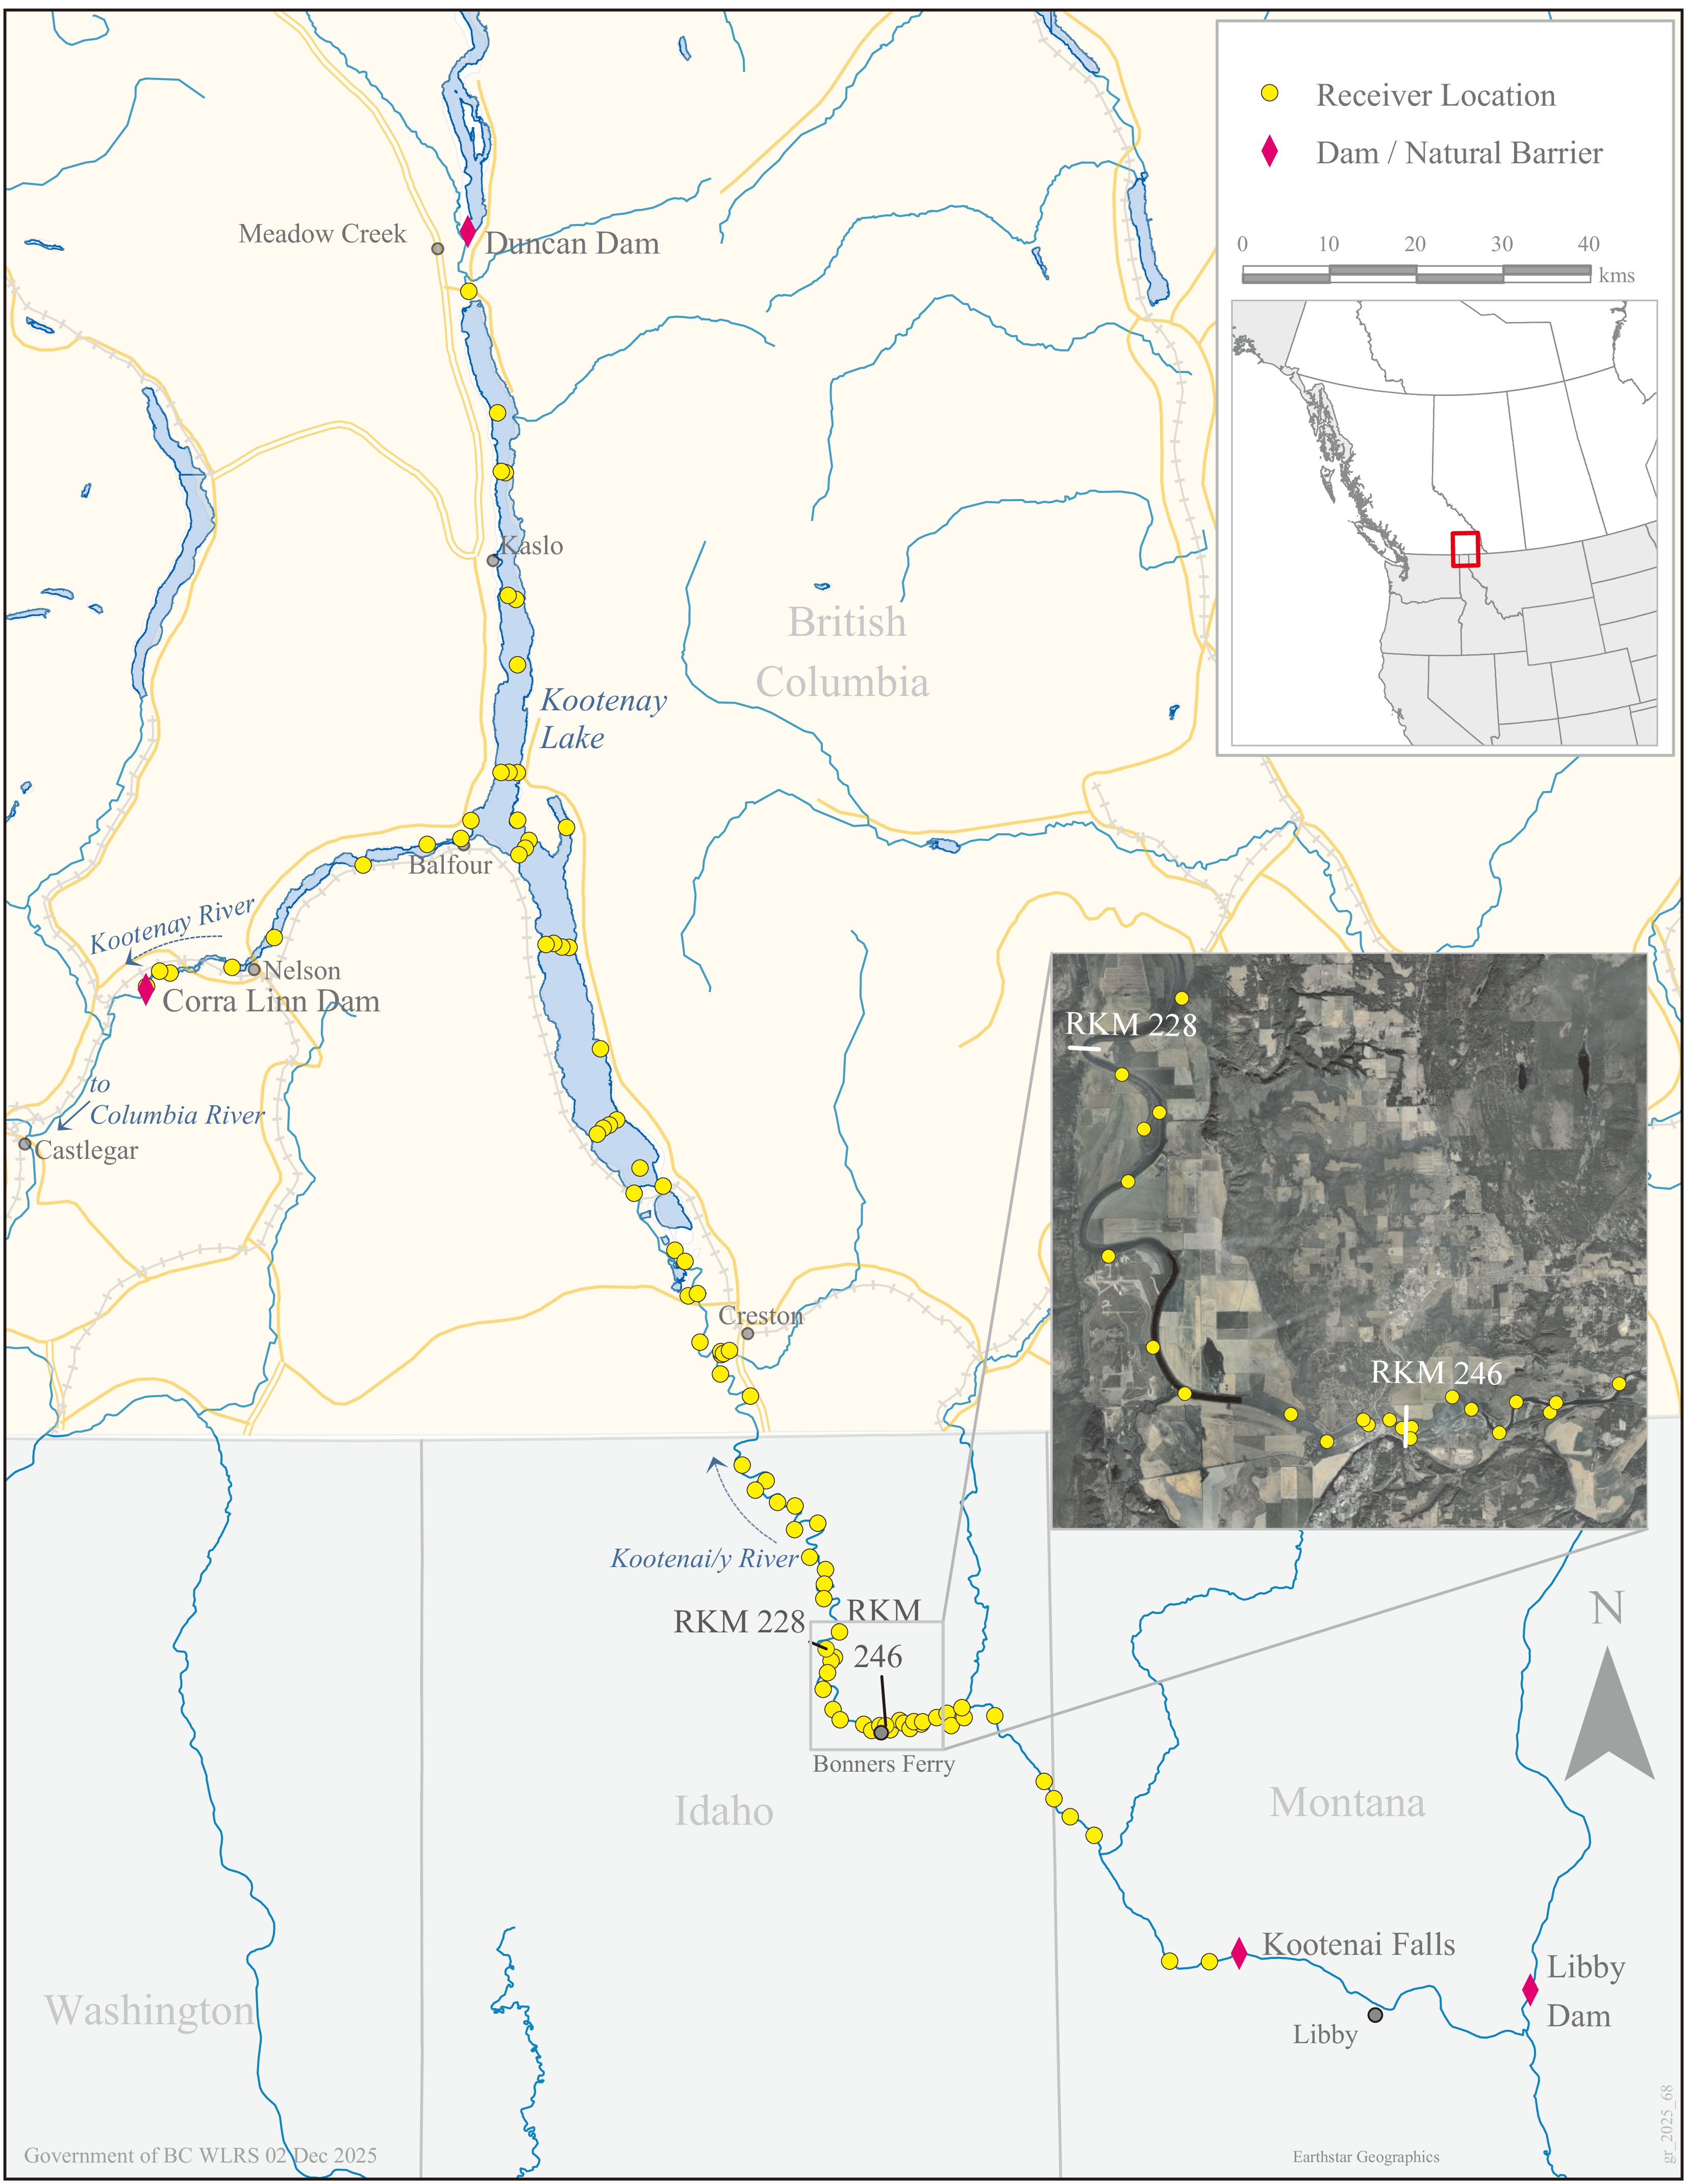
Figure 1.
Map of the transboundary range of Kootenay River White Sturgeon (Acipenser transmontanus). Yellow circles indicate receiver locations and pink diamonds identify dams and natural barriers. The river flows downstream from Libby Dam to Kootenay Lake and out through Corra Linn Dam before joining the Columbia River. Arrows indicate the direction of flow. The inset map shows the spawning area between RKM 228 and 246.
-
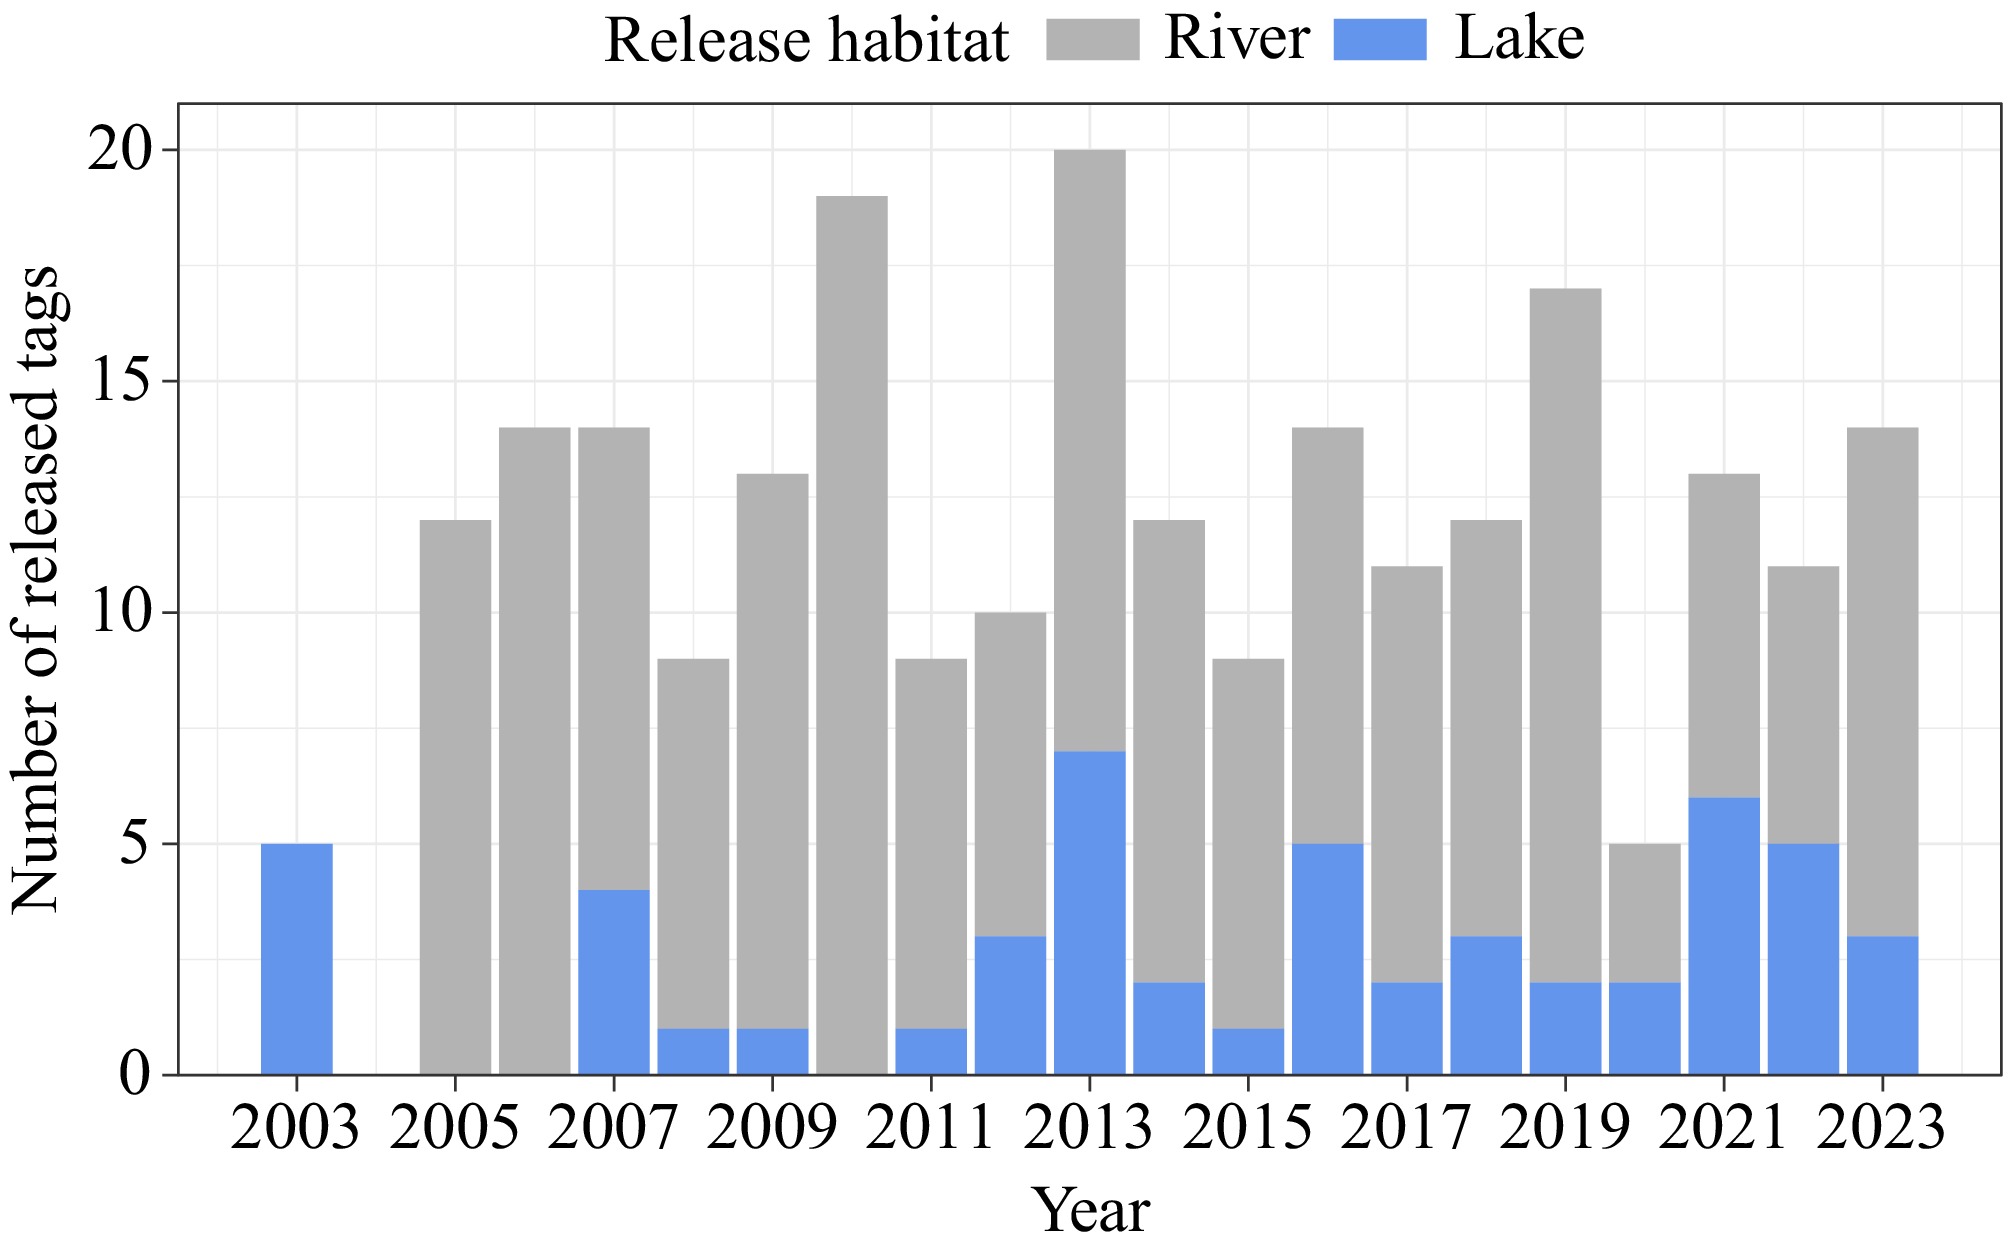
Figure 2.
Number of acoustic tags released in each sampling year in the Kootenay River, ID (grey) and Kootenay Lake, BC (blue).
-
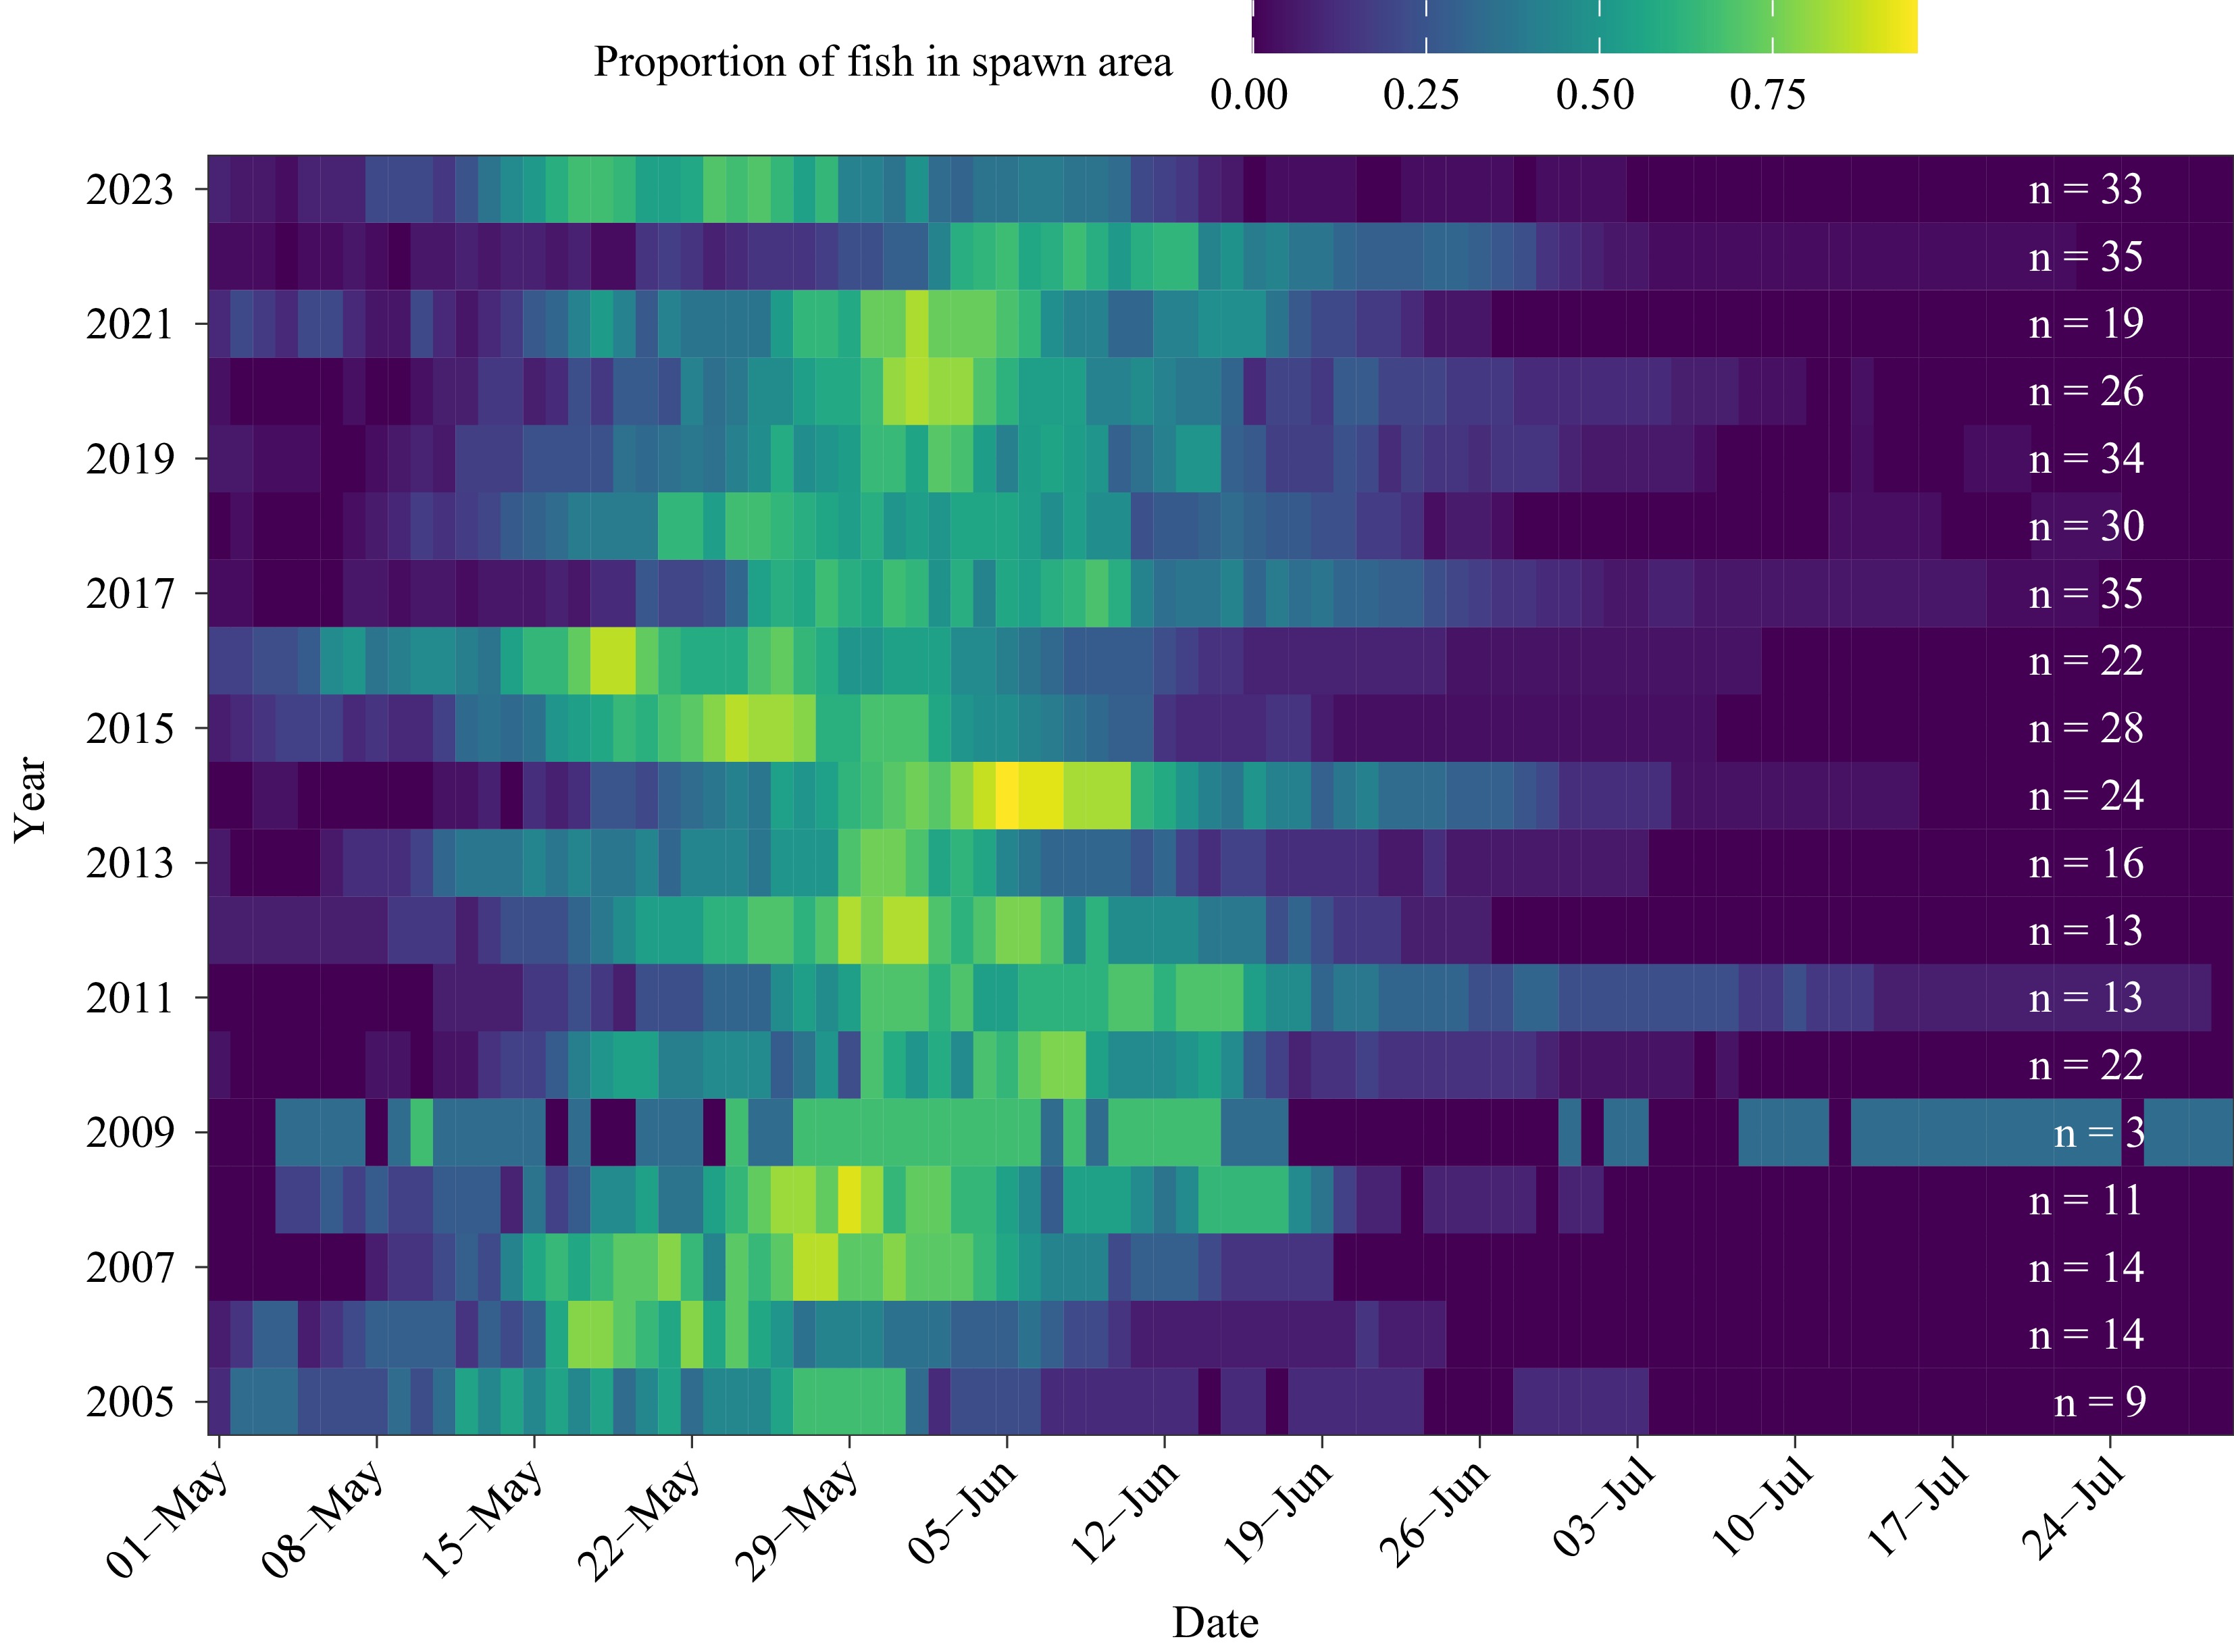
Figure 3.
Proportion of fish detected in the spawning area in a given year, by day and year. The sample size (n) was the number of females for which time in the spawning area was calculated for that year.
-
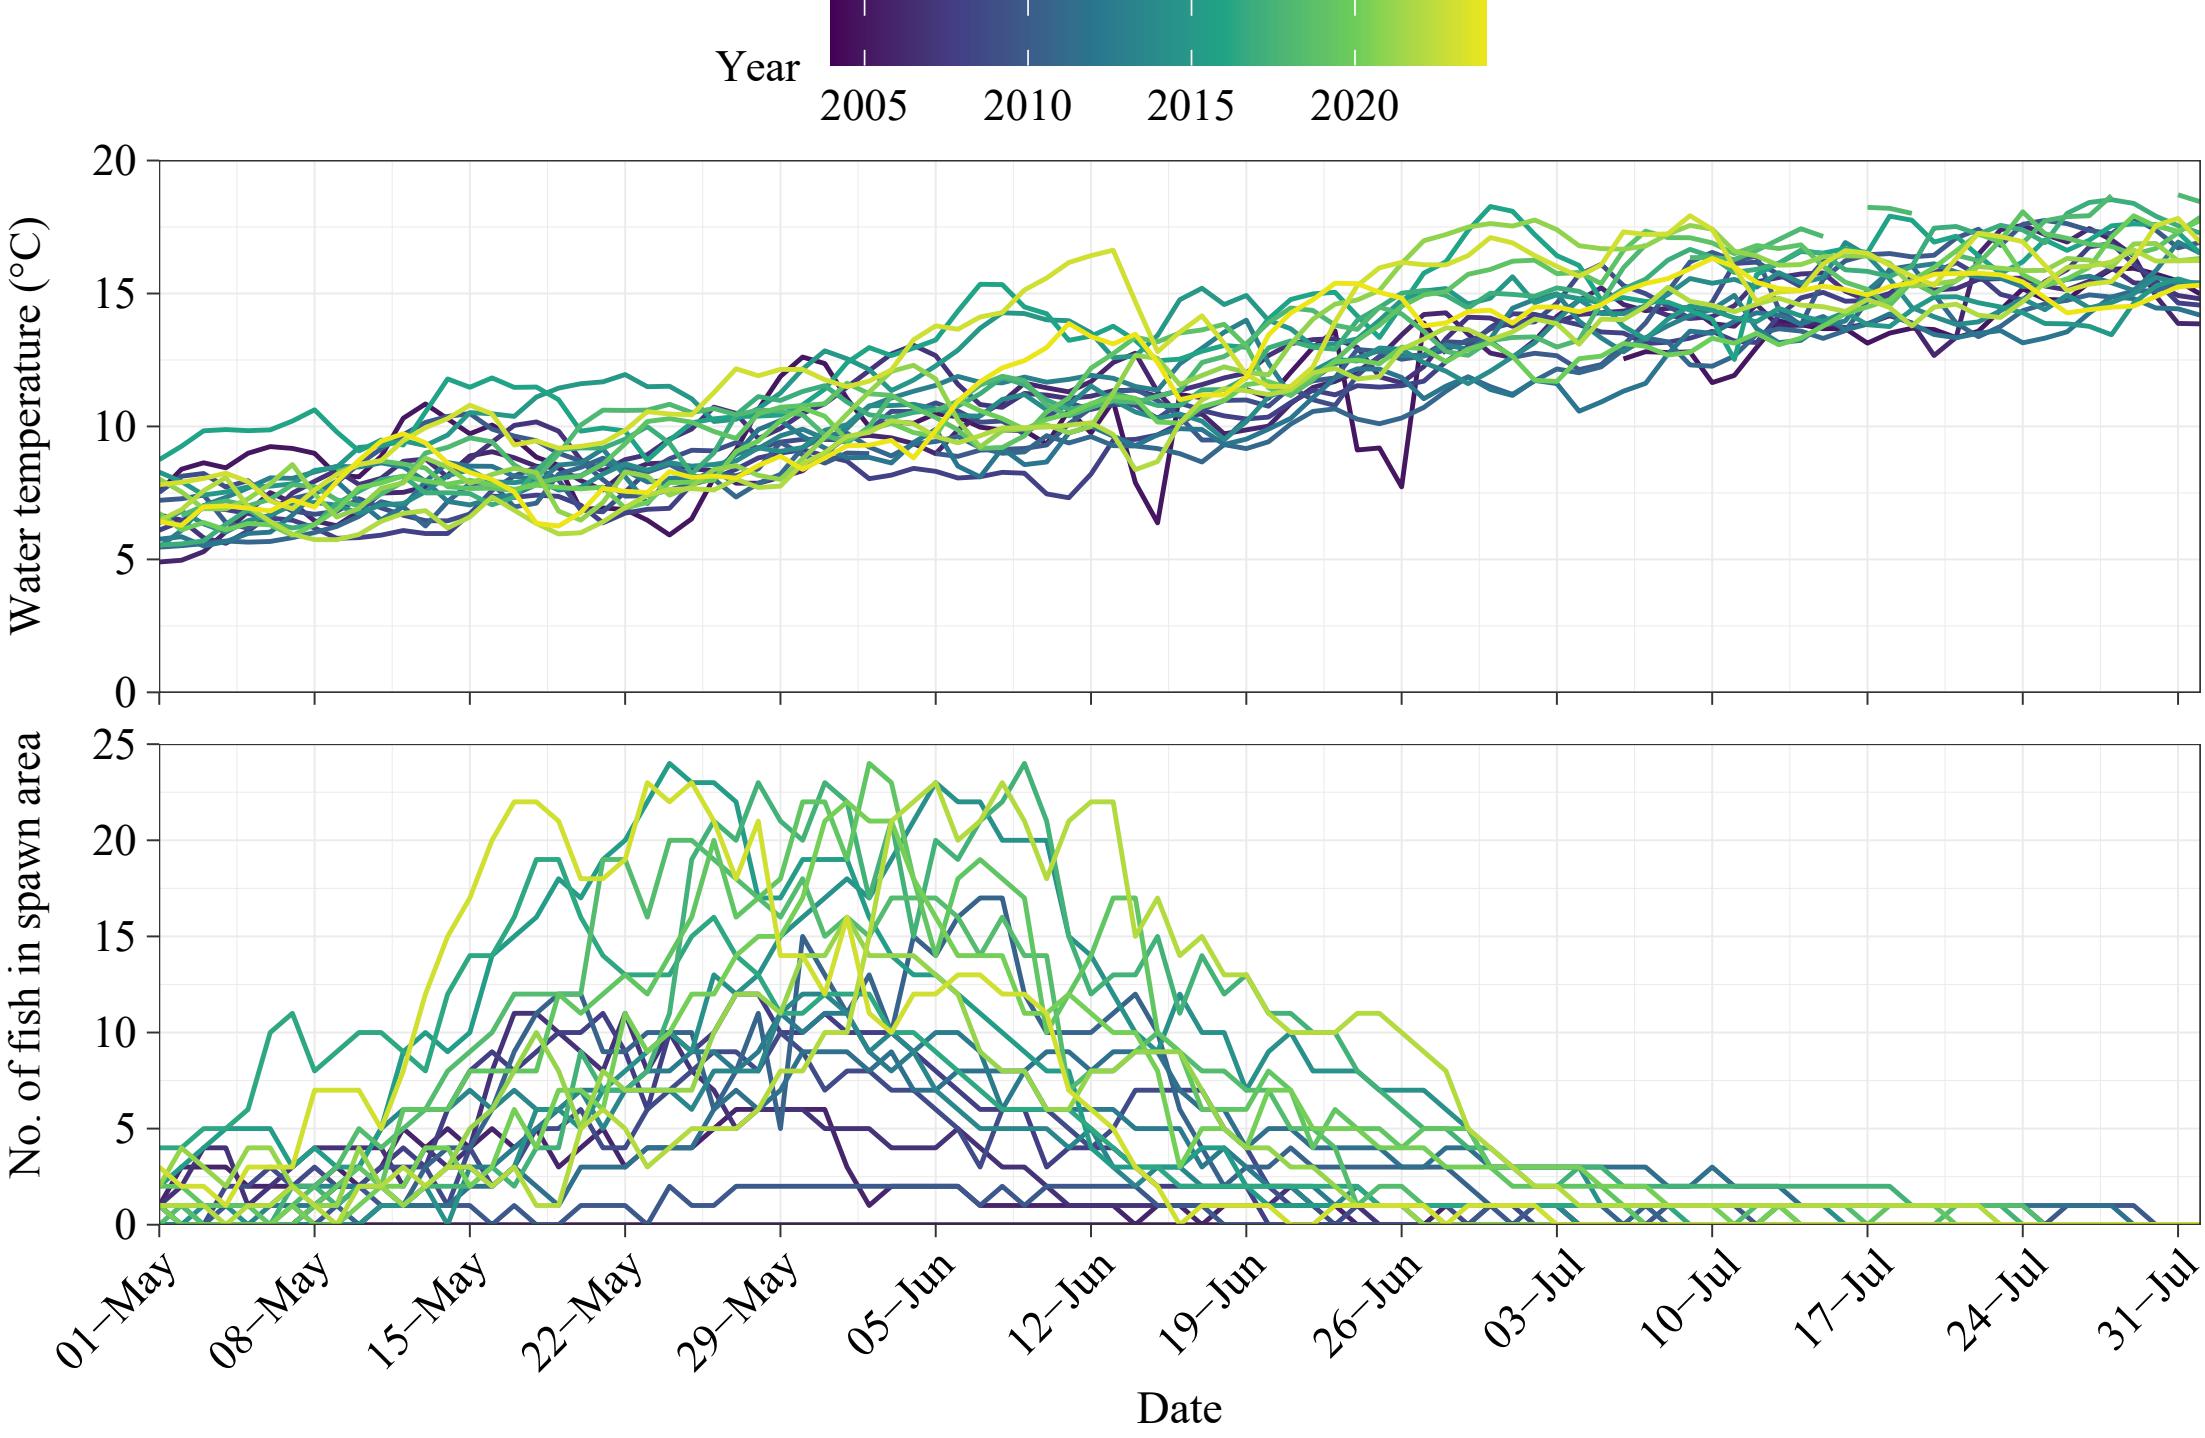
Figure 4.
Daily water temperature (°C; upper panel) and daily number of tagged fish present in the spawning area (lower panel). Tagged fish are only those included in the time-in-spawning-area analysis.
-
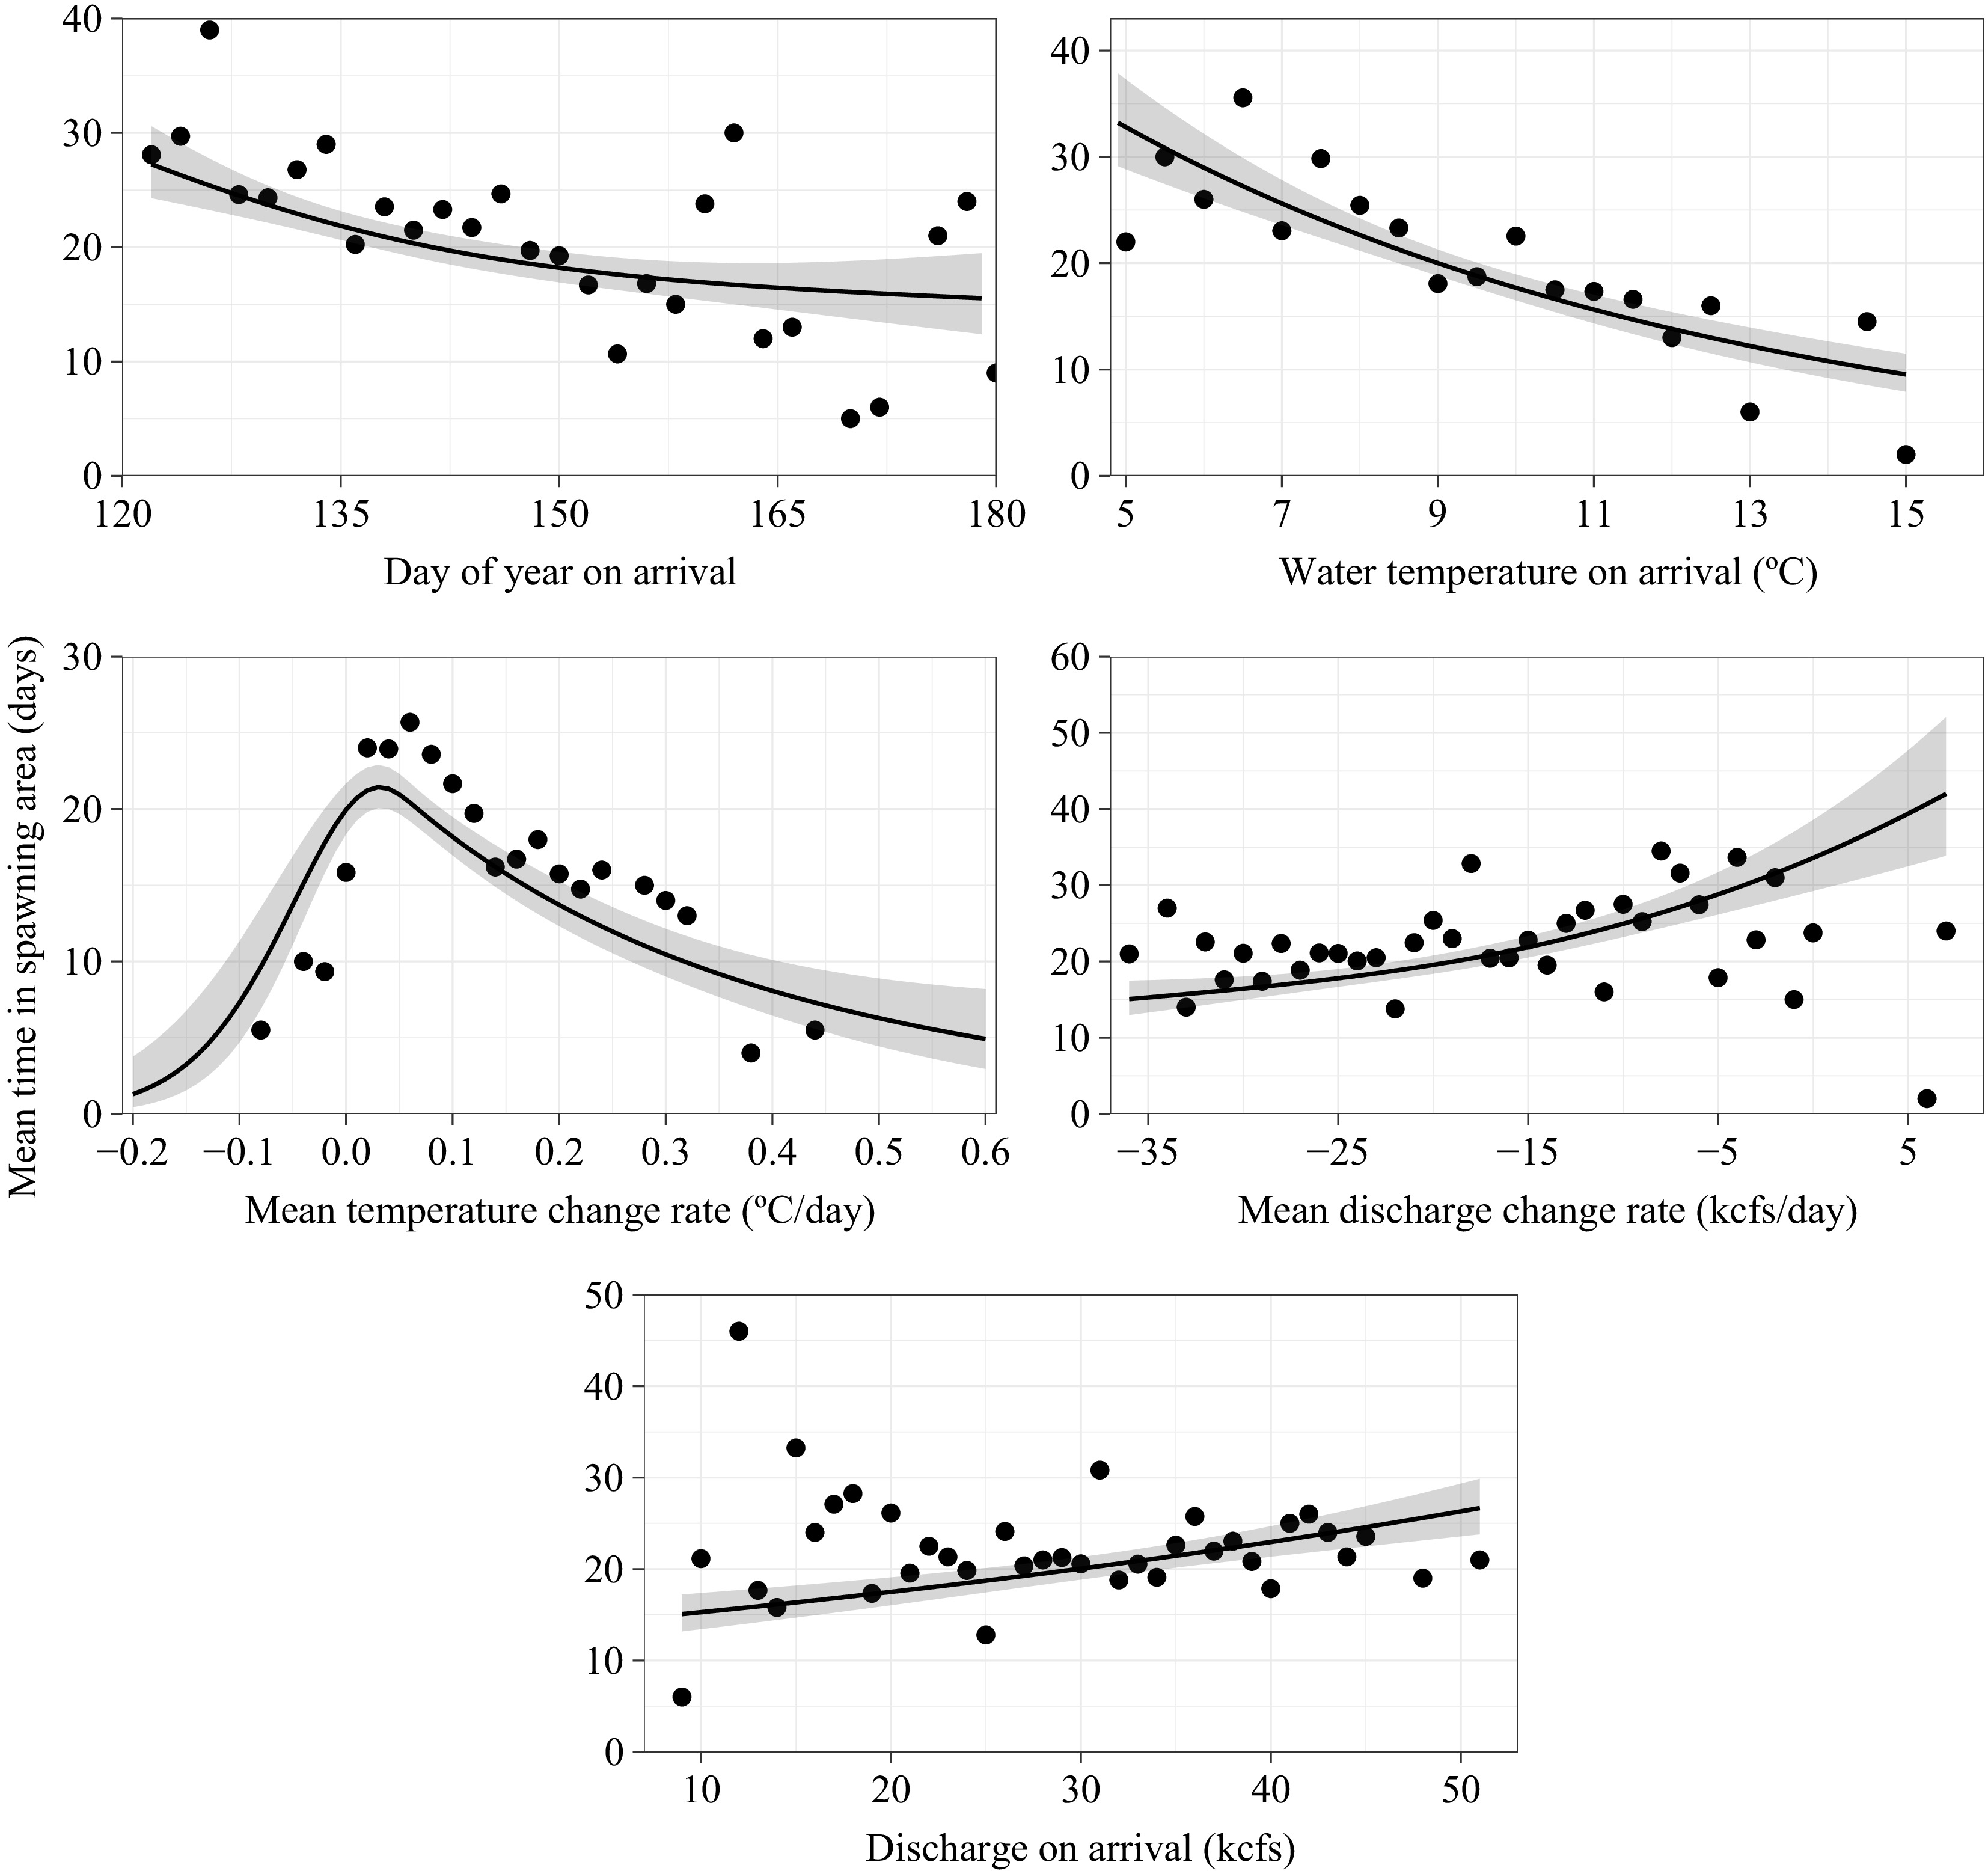
Figure 5.
Observed (points) and model-predicted (lines and ribbons) lengths of time in the spawning area (d) based on the temperature on arrival (°C) and the rate of change in temperature for unique fish-year combinations. For visualization purposes, observed values were averaged within each 0.2 °C step in temperature change and within each 2 °C step in temperature on arrival. Grey ribbons are the 95% confidence intervals associated with model predictions.
-
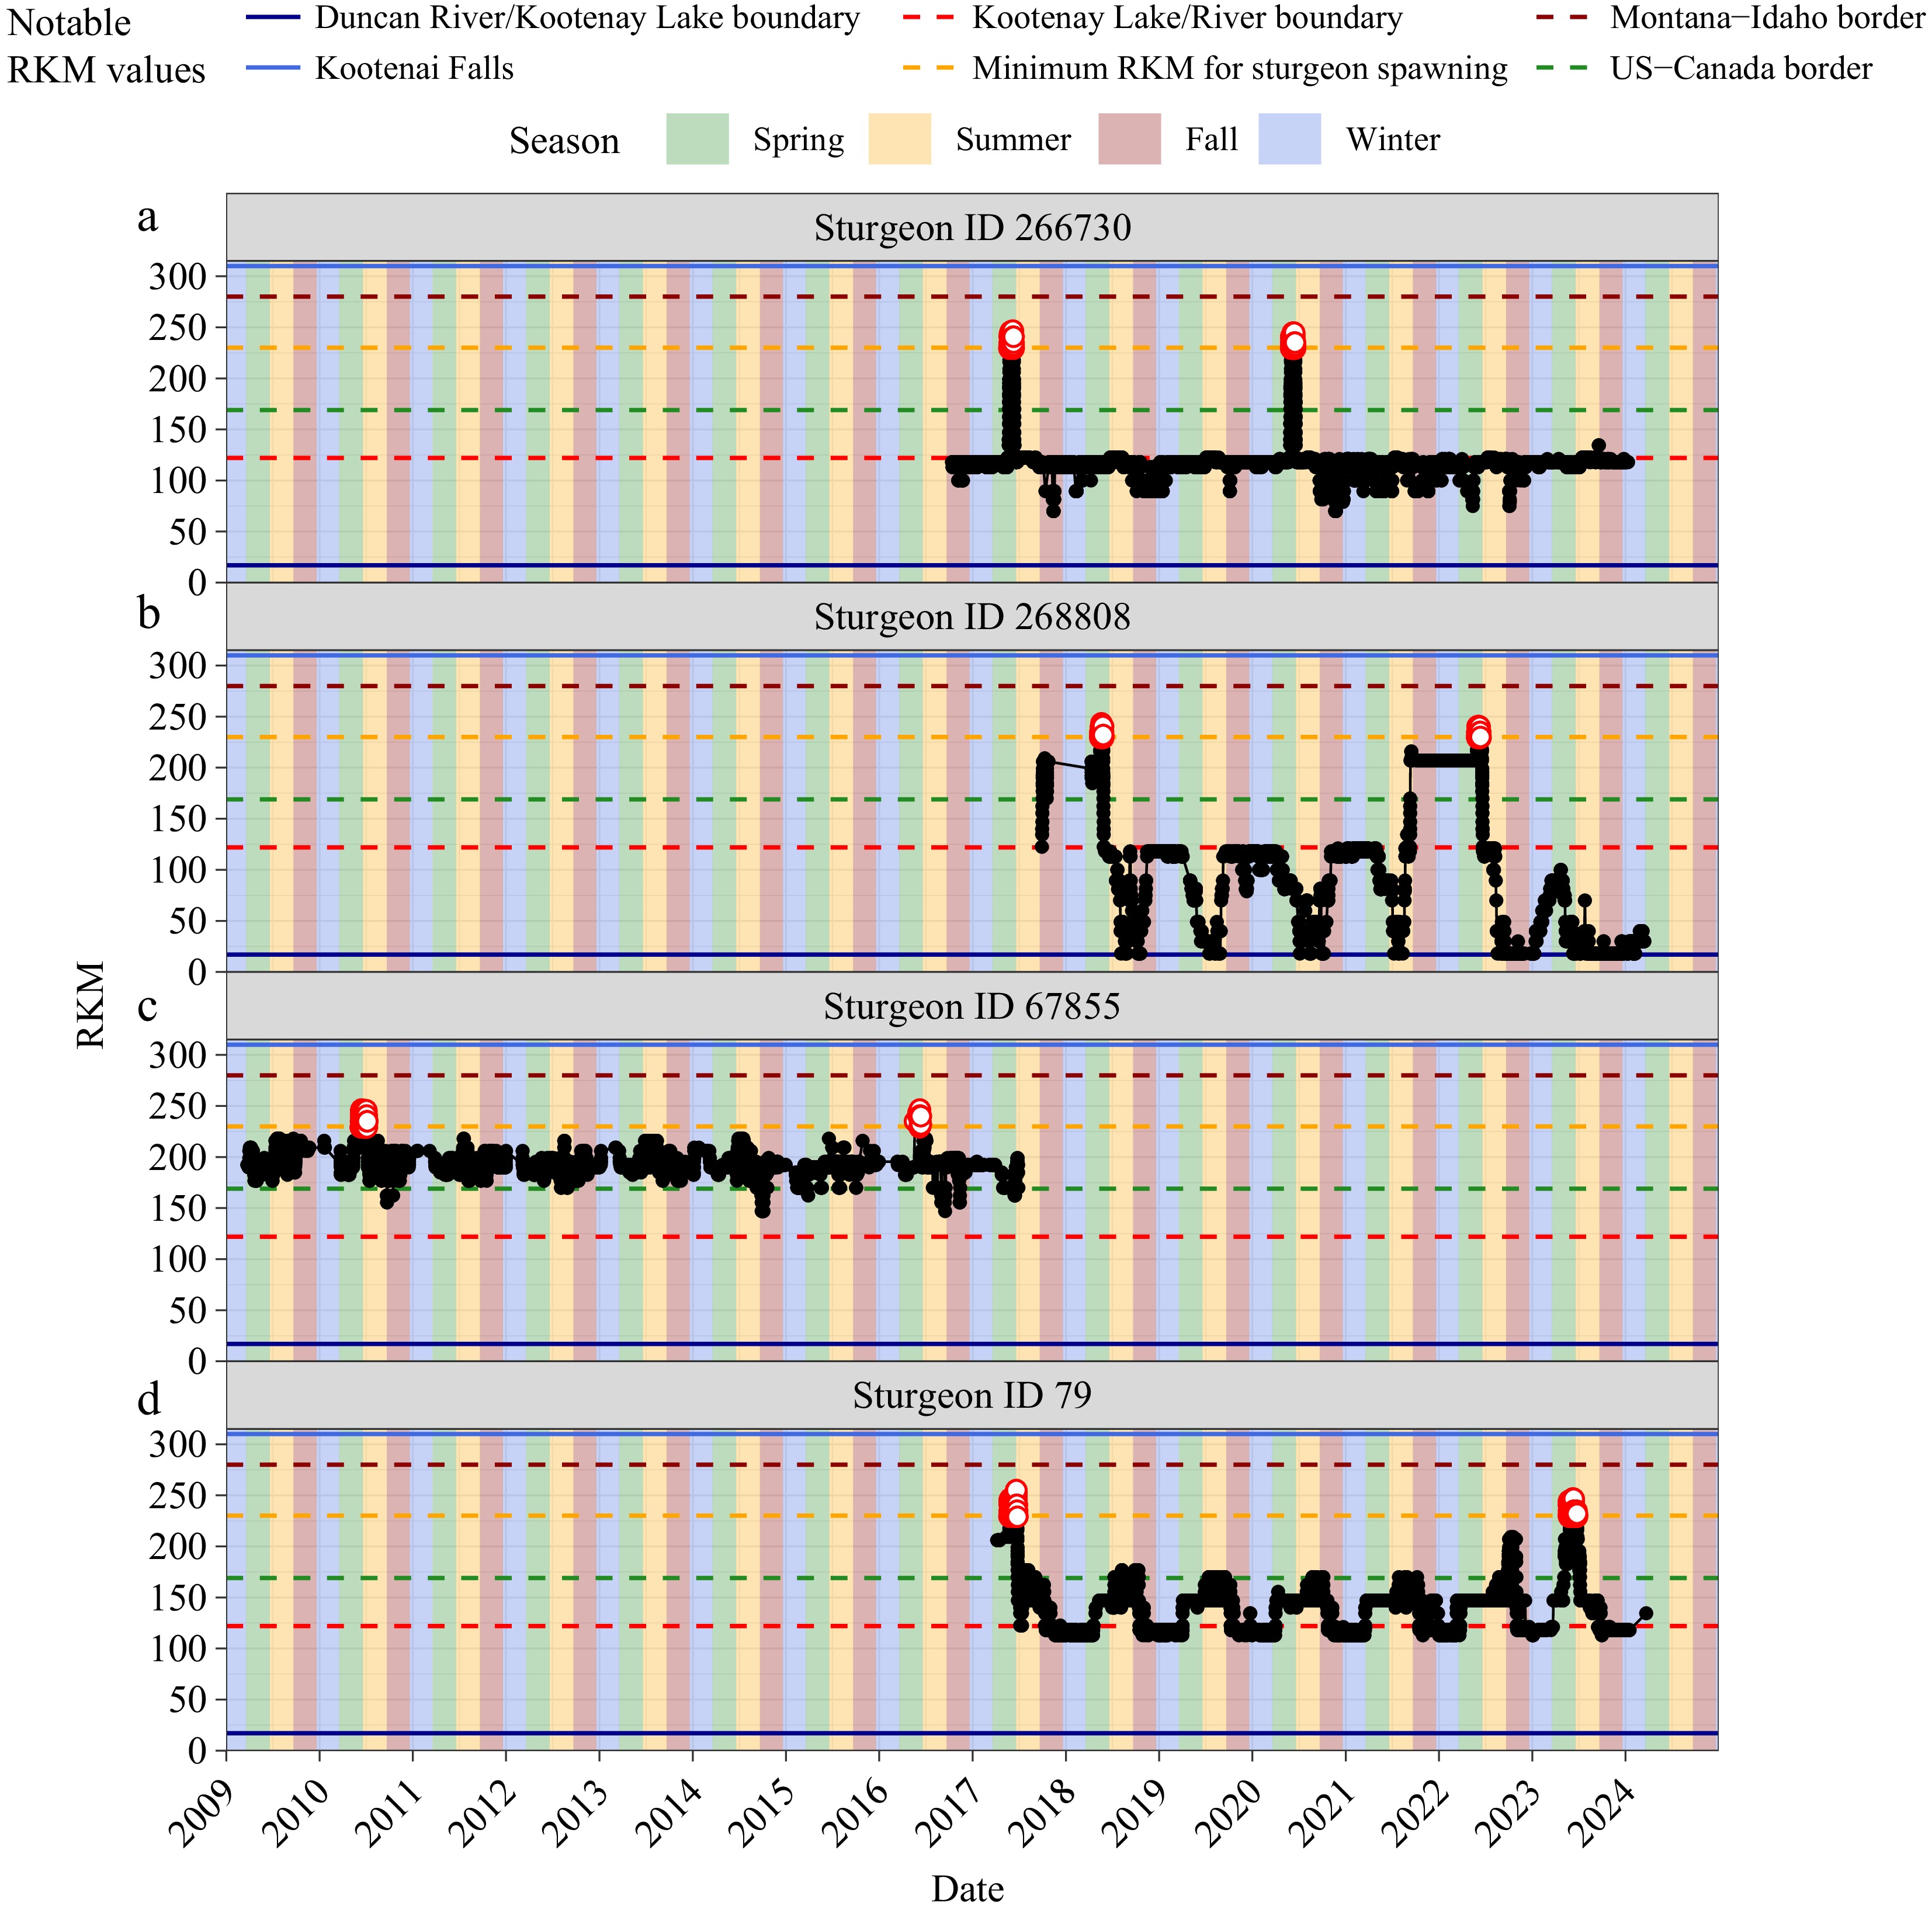
Figure 6.
Movement of four example females; detections from all receivers with locations identified by river kilometer (RKM). Key areas are identified with horizontal lines, vertical colours identify season within each year, and the red dots are the detections on the spawning area. Plots A and B are examples of females who reside in the lake outside of spawning, with spawn intervals of three and four years, respectively; female B does a pre-spawn migration the year before, and female A does not. Female C is an example of a river resident with a six-year spawn interval, and female D is an example of a female that has time in both the river and lake outside of spawn and a six-year spawn interval.
-
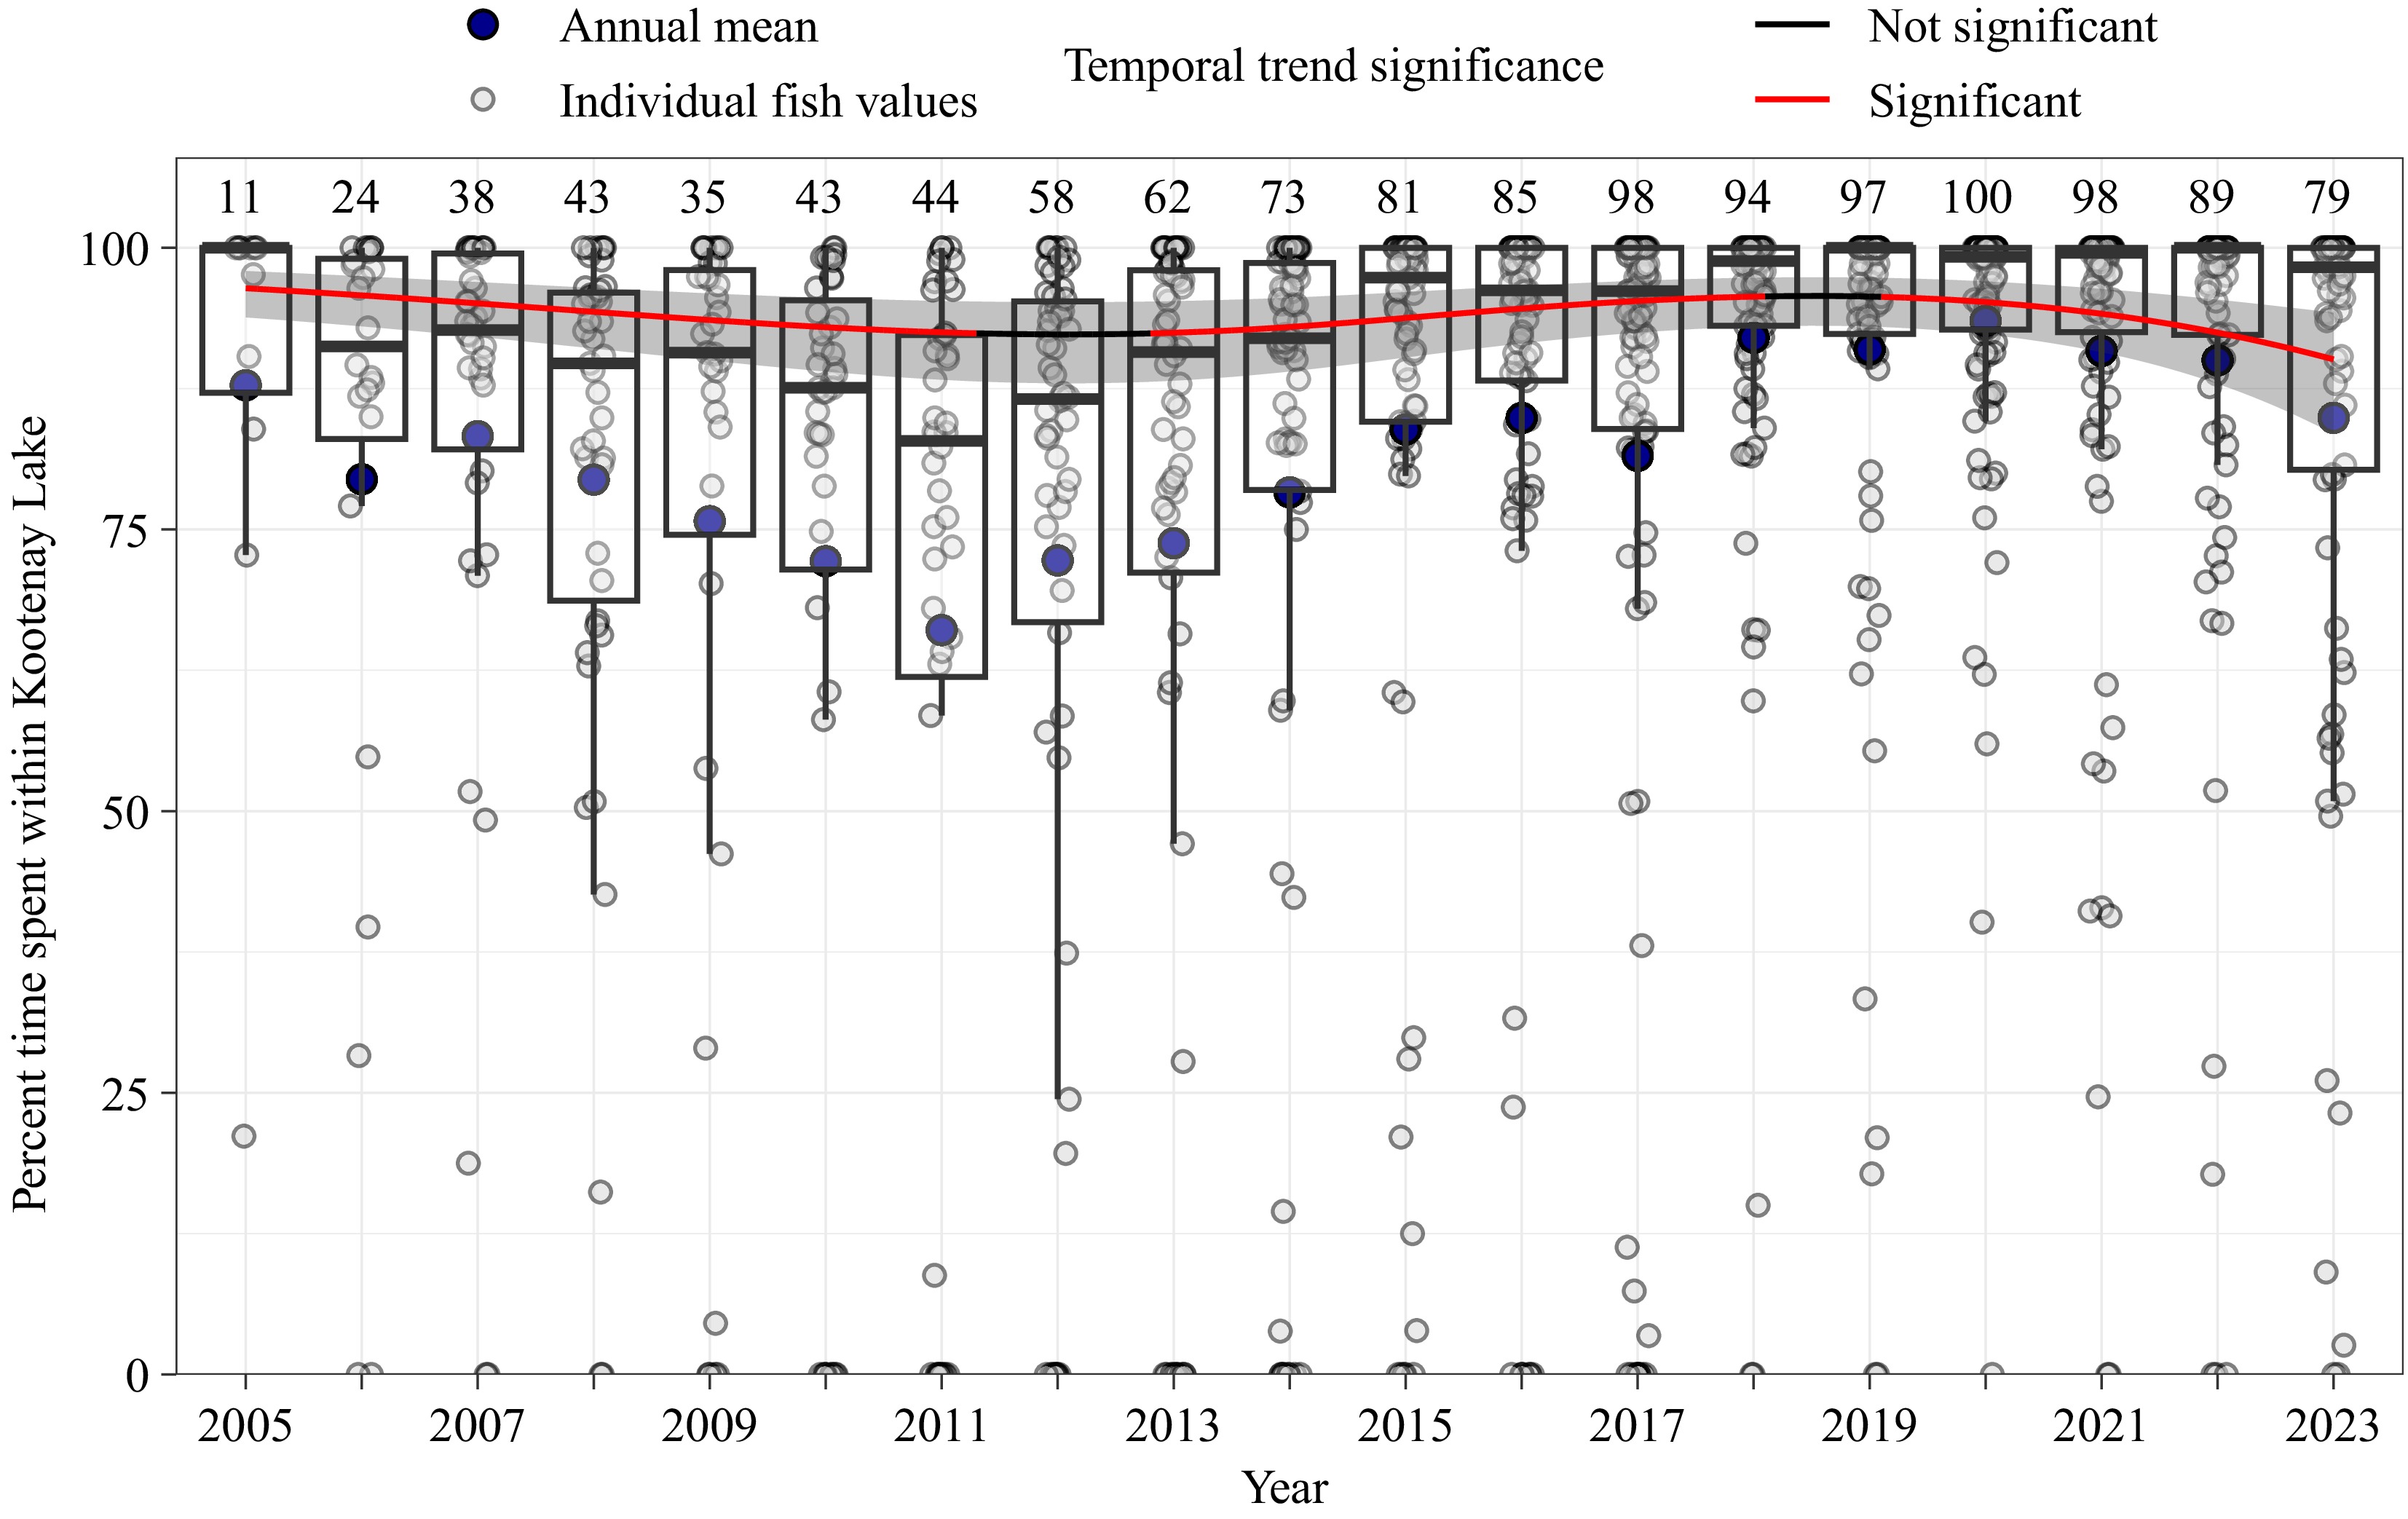
Figure 7.
Observed (points and boxplots) and model-predicted (line and ribbon) time (%) spent in Kootenay Lake, outside of spawn year, over time. Open points are observed values for each fish-year combination. Boxplots show the annual median (thick line) and 25th and 75th quantiles (bottom and top of box); whiskers extend to 1.5 times the quartile values. Large blue points show observed annual mean values. The grey ribbon is the 95% confidence interval associated with model predictions.
-
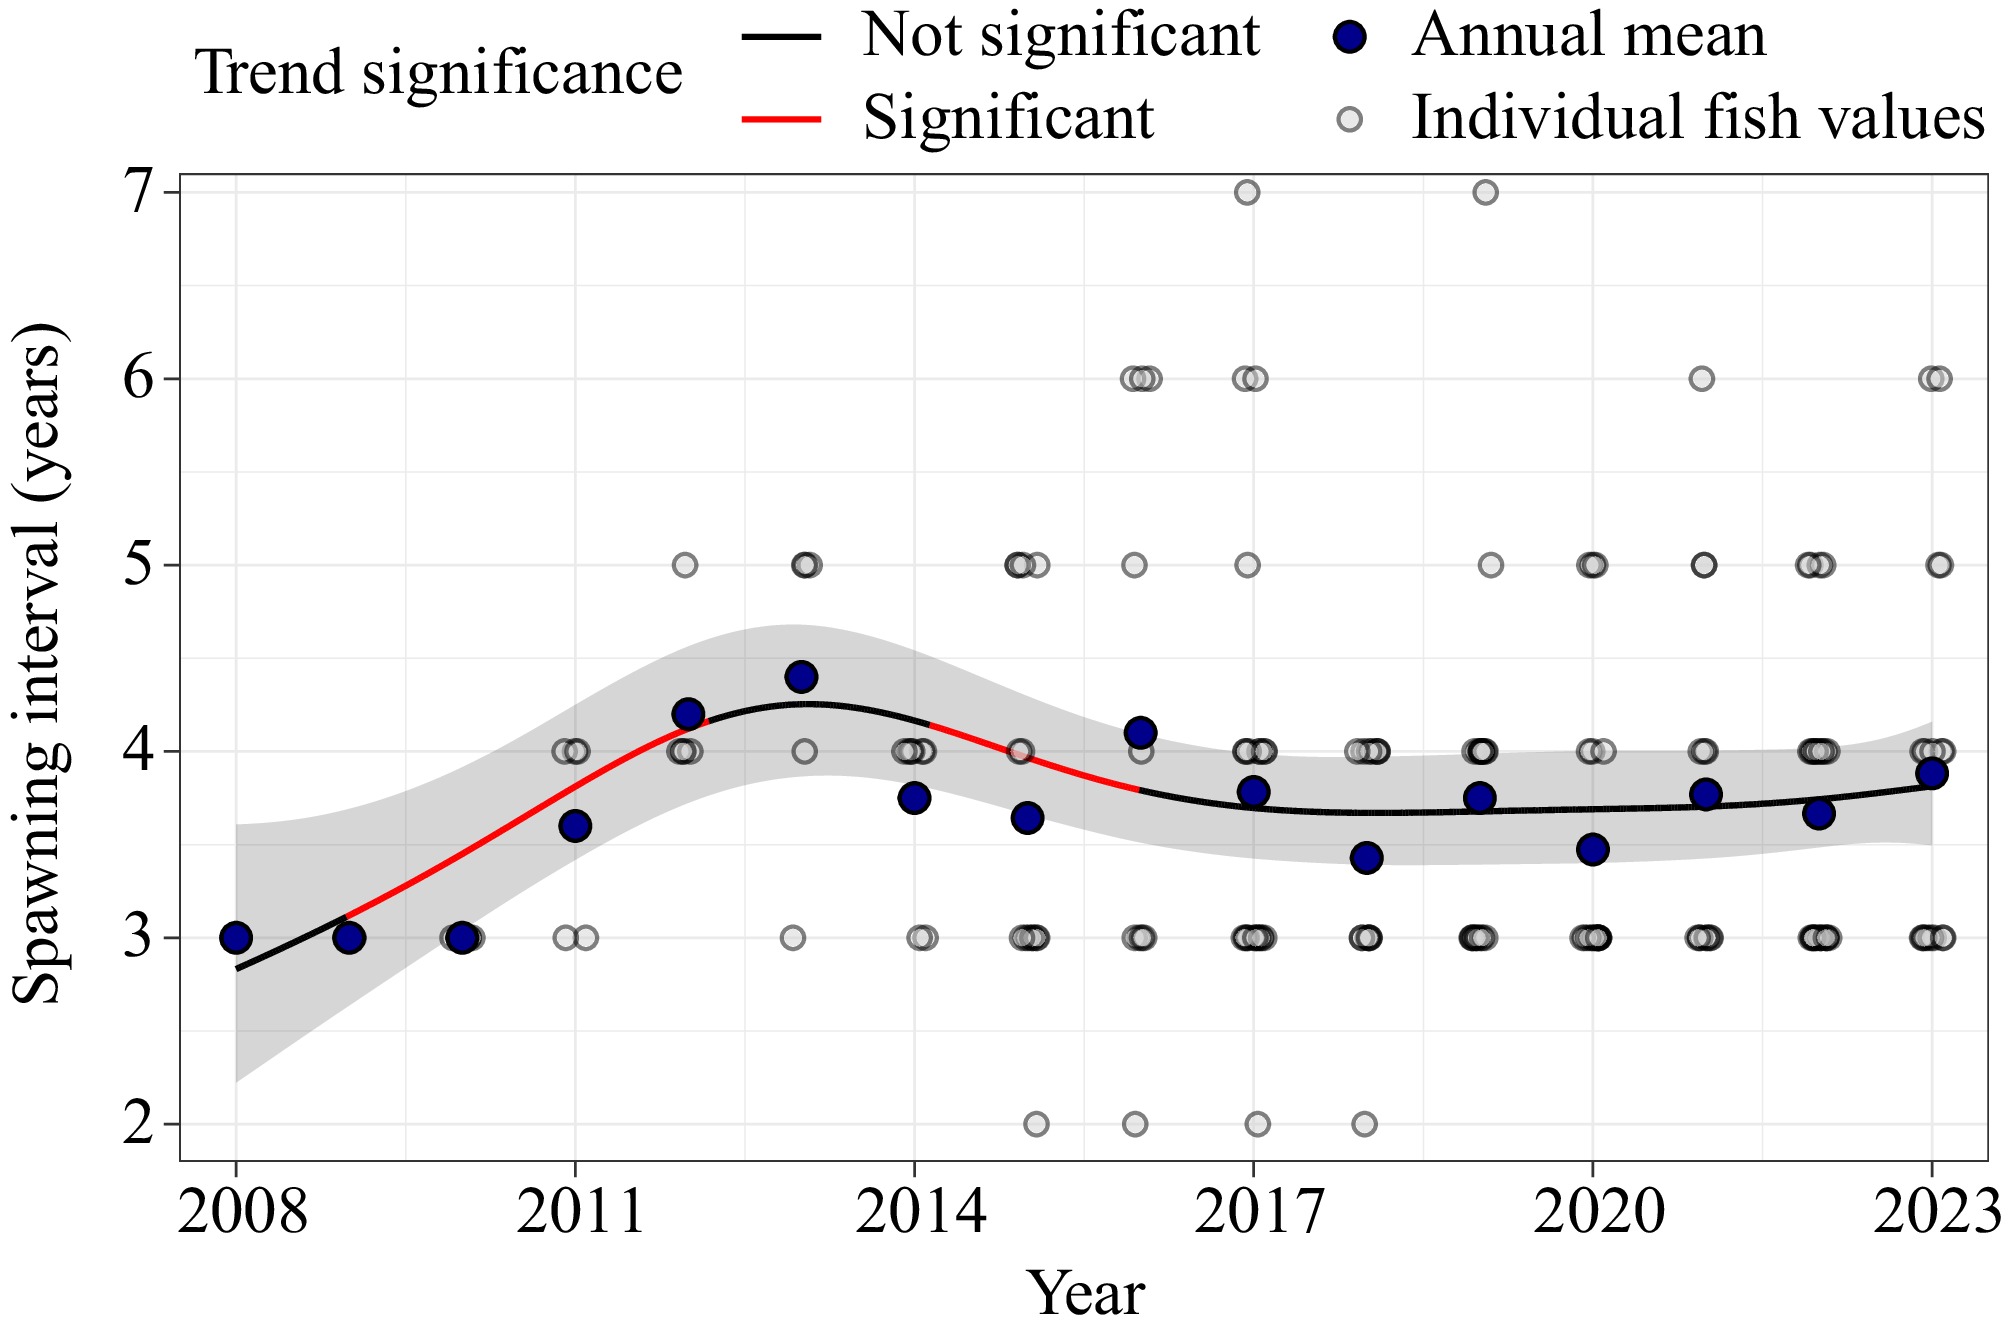
Figure 8.
Observed (points) and model-predicted (line and ribbon) trend in spawning interval (i.e., years since previous spawn) over time. Open points are observed values for each fish-year combination. Large blue points show observed annual mean values across all fish. The grey ribbon is the 95% confidence interval associated with model predictions.
-
Terms χ2-value df p Temperature on arrival 85.370 1 < 0.001 Discharge on arrival 25.271 1 < 0.001 Mean rate of change in temperature 103.235 3 < 0.001 Mean rate of change in discharge 82.006 2 < 0.001 Day of year on arrival 29.211 2 < 0.001 Table 1.
Generalized linear model (GLMM) results of the analysis of length of time on the spawning grounds.
-
Terms χ2-value df p Year 21.662 3 < 0.001 Table 2.
Generalized linear model (GLMM) results of the analysis of percent time spent in Kootenay Lake.
-
Terms Edf F-value p Time in lake 1 0.091 0.763 Year 4.519 3.559 0.019 Table 3.
Generalized additive mixed model (GAMM) results of the analysis of percent time spent in Kootenay Lake since the previous spawning (time in lake) and year on the length of spawning intervals. Edf: effective degrees of freedom.
Figures
(8)
Tables
(3)