












-
Large migratory fish species are declining globally due to multiple threats, including overfishing, dam construction, and habitat loss[1−3]. Migratory species require a suite of spatial and temporal habitat characteristics to satisfy broad life history needs, including growth, reproduction, and refuge. However, because of these broad habitat needs, these species are particularly vulnerable to habitat fragmentation and alteration[4]. Nearly all sturgeon populations that are at risk occur in fragmented and regulated river systems[5] which often overlap with hydropower production.
Construction and operation of dams dramatically alter riverine habitats[6]. Alterations to the natural hydrologic regime include increased winter flows, reduced spring freshet flows, and the timing of peak spring flows[7,8]. In addition to timing and magnitude of downstream flows, dam operations can alter spring and summer water temperatures. The timing of warming temperatures is directly linked to White Sturgeon (Acipenser transmontanus) spawning, and these changes can result in spawning at sub-optimal times and locations[9,10]. Understanding environmental cues and timing in spawning areas is essential for informing water management and flow planning activities.
White Sturgeon are a large, late-maturing migratory species, with populations experiencing recruitment failure threatening long-term persistence[11]. White Sturgeon display a classic periodic spawning life history[12] and can take more than 30 years to reach sexual maturity. Size at sexual maturity can be greater than 150 cm fork length or 35–45 kg[13,14]. Generation time and age at maturity exert major influences on population growth and trajectory. As such, understanding spawning intervals of female White Sturgeon is critical to predicting population trajectories and persistence as well as achieving conservation goals.
Knowledge of spawn intervals is critical to monitoring and evaluation programs, as it is needed to develop sampling designs, construct population models, and a variety of other analyses. However, spawn intervals for White Sturgeon are not well defined in the literature, primarily because they are difficult to measure in this long-lived species that inhabits large river systems. Previous estimates of spawn intervals have relied on physical recaptures of spawning individuals and/or telemetry studies over insufficient temporal scales to determine spawn intervals of females in the wild. Although it takes 18 months to complete vitellogenesis[15], documented spawn intervals include three to five years in the Kootenay[16] and the Snake River[11] and five years in the upper Columbia[17]. Telemetry studies over a sufficient time scale to capture the variation in spawning life history of White Sturgeon have been identified as an important need to more precisely estimate and adequately capture the variation in spawning intervals for wild female White Sturgeon[11].
The Kootenay (spelled Kootenai in the USA, but spelled Kootenay hereafter) White Sturgeon population was federally listed as endangered in the USA in 1994[18] and in Canada in 2006[19]. Research and monitoring span over 30 years, and a permanent telemetry array has been in place since 2003. Similar to other sturgeon populations that have declined after dam construction and operation, the Kootenay population declined due to historic overfishing, habitat degradation, and eventually recruitment failure after completion of Libby Dam in 1972[20]. The range of Kootenay White Sturgeon spans over 300 km in two USA states and into British Columbia (BC) in Canada, but all spawning occurs in spring, or early summer, in the Idaho portion of the Kootenay River. Adults arrive at the spawning area in May, with males arriving earlier and staying later than females[21].
This study spans two decades of continuous monitoring, the most comprehensive telemetry dataset available for White Sturgeon. This dataset includes females with known spawn condition using a well-defined spawning area confirmed by observed egg deposition. It further builds off earlier work in the Kootenay system that identified the importance of using females for investigating spawn timing and the connection to temperature for arrival time to the spawn area[21]. This earlier work only had six years of telemetry data from 49 reproductive individuals but identified that females arrived later and had shorter stays than males. However, six years was not enough to capture the variation across a large enough time span and to evaluate time between spawns, given the range of estimated spawning intervals of females, and more recent advances in telemetry and tag technology supported a more robust data set.
This study aims to fill the knowledge gap for female White Sturgeon spawn intervals, time in spawning area, and habitat used outside of spawning. Filling these knowledge gaps is necessary to guide recovery actions, including hydrosystem operations, to improve monitoring, and to ensure protections for White Sturgeon during critical time periods. Measuring spawn intervals can be difficult for populations that do not have the extensive receiver network and a single, inclusive spawning reach as is in the Kootenay and therefore is valuable to managers and researchers working with other populations, either for comparative purposes or as a surrogate for understanding populations for which spawn intervals and time in spawning reach cannot be measured.
-
The range of Kootenay White Sturgeon extends from Montana in the USA, downstream through Idaho, and into south-eastern British Columbia in Canada (Fig. 1). The riverine component covers nearly 200 km and flows north into Kootenay Lake[22]; a fjord-like lake with a length of 103 km and a total area of 420 km2. The lake extends into the west arm an additional 47 km before the first dam, Corra Linn, then flows towards the Columbia River. Duncan Dam, Corra Linn Dam, and Kootenai Falls (a natural upstream barrier downstream of Libby Dam) currently restrict the distribution of Kootenay White Sturgeon. Previous studies determined that spawning occurs 106 km upstream of Kootenay Lake in the Idaho portion of the river, in an approximately 18 km stretch of river upstream of river kilometer (RKM) 228[21].
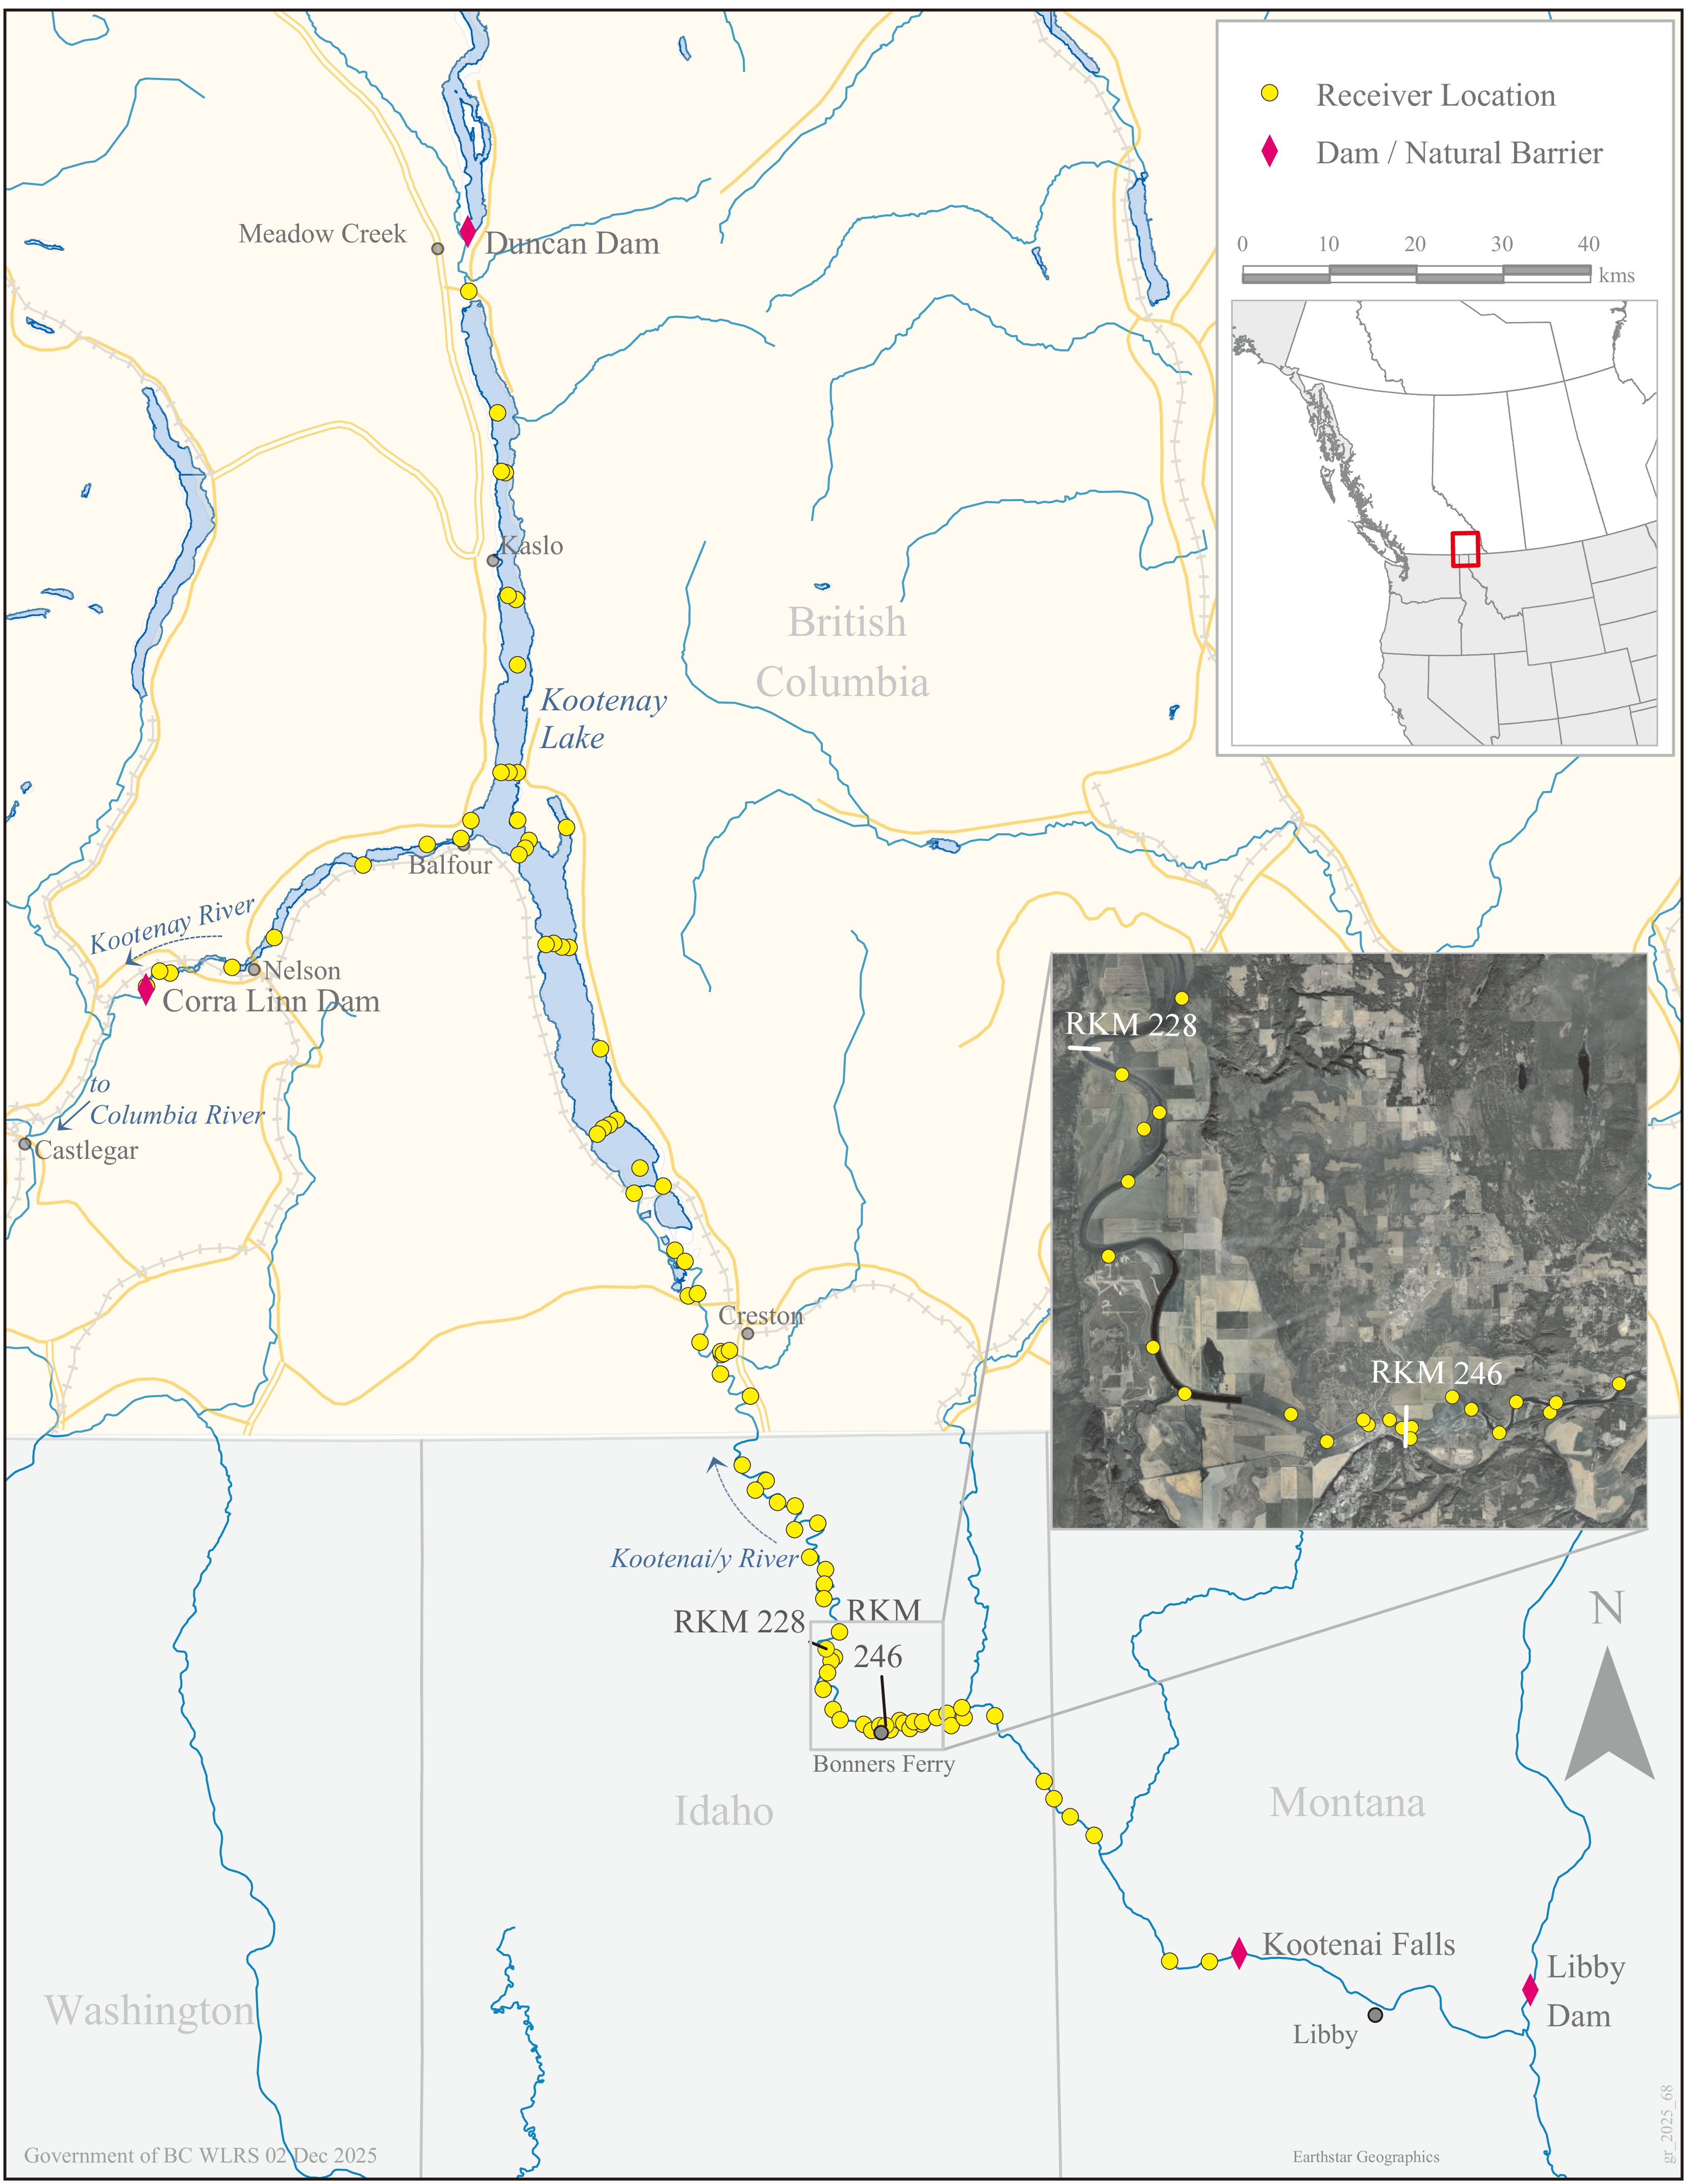
Figure 1.
Map of the transboundary range of Kootenay River White Sturgeon (Acipenser transmontanus). Yellow circles indicate receiver locations and pink diamonds identify dams and natural barriers. The river flows downstream from Libby Dam to Kootenay Lake and out through Corra Linn Dam before joining the Columbia River. Arrows indicate the direction of flow. The inset map shows the spawning area between RKM 228 and 246.
A permanent array of Innovasea receivers was established in 2003, covering over 300 km from Montana, downstream through Idaho and BC (Fig. 1). Although additional receivers (VR2, VR2W, VR2Tx) were deployed at various times and locations over the course of the study, the base array of VR2 receivers was established as a gate or curtain system[23]. The receivers were deployed where the range of the receiver would cover the width of the river and the line of receivers in the lake would detect fish across that transect as they move through the length of the lake[24]. As of 2024, there were 35 receivers in the lake (ranging from 1 to 13 km apart), one in the Duncan River and 59 in the Kootenay River (ranging from 0.1 to 8 km apart), including key connected off-channel habitat and tributaries, and the spawning area. The highest density of receivers was in the spawning area, to increase detection probability as detectability of tags may be lower during high flows concurrent with spawning (12 receivers, 1.5 km mean distance apart and a range of 0.2–5.0 km apart).
Tagging
-
The wild female sturgeon used in this study were tagged during annual mark-recapture studies in Idaho and BC from 2003 to 2023[25,26]. Females were selected for tagging based on surgical assessment of ovarian development that would maximize the number of times a fish would spawn within the life of the acoustic tag. A female was targeted for tagging if she had pigmented eggs > 2.2 mm in diameter, suggesting she was likely to spawn within the year[27]. In rare cases where a female was recaptured with an expired or soon-to-be-expired tag, she was fitted with a second tag, regardless of egg size, to extend the duration of the study for that individual. Tag insertion and sexual maturity assessment are described in detail by Stephenson et al.[26]. Surgical assessment was done with an incision (~2 to 5 cm in length) adjacent to the ventral midline, aligned with the fourth lateral scute anterior to the pelvic fin. The incision was completed using a sterile #10 scalpel blade and was closed with 2/0 Ethicon sutures (CT-2, 26 mm 1/2c taper). Annual efforts to deploy tags were completed in both the lake and river, but the majority of tagging was completed in the river where pre-spawn fish were encountered. All sturgeon caught in the Kootenay system can be individually identified via their unique passive integrated transponder (PIT) tag. The current PIT tags used are International Organization for Standardization-compliant FDX-B tags (134.2 kHz). Over the course of the study, a range of V16 tags were used, including V16P-6x, V16-6x, V16TP-6x, V16-4x, and V16TP-4x. The nominal delay was set at 120 or 180 s, and battery life ranged from 1,092 to 3,650 d. The tag burden of the acoustic tags ranged from 0.005% to 0.07% of the fish's body weight. Females were excluded from analyses if they did not have an identified spawn movement or if they resided in or around the spawning area outside of the spawn period, as telemetry data would not identify spawn movement. We defined a spawning movement as an individual moving into the spawning area between 1 May and 1 July. To remove possible false detections, detection data were filtered to include only data points when fish had more than three detections within a 24 h period. Most fish had multiple years of telemetry data. To account for individual variability between fish, summary statistics were reported on individual fish (i.e., across multiple years of data, resulting in a single data point per fish). To account for interannual variability in behaviour, summary statistics were also calculated for the individual fish-year combinations; i.e., summarizing each year of data within each fish, resulting in a single point for each year in that fish's tag history.
Time in spawning area
-
Tagged fish were assumed to have spawned if they were detected at or upstream of RKM 228 between 1 May and 1 July. Kootenay White Sturgeon have previously been found to spawn in areas upstream of RKM 228 through monitoring of egg deposition and earlier telemetry studies[25]. Fish that were tagged in the spawning area and during the spawn period were excluded from time in spawning area calculations (for that year) as arrival date was unknown. Additionally, fish were excluded from analyses if there were detection gaps greater than 10 d during the spawning period, suggesting tag detection issues. The application of the 10-d detection gap resulted in 37 fish-year cases where spawning start was not known, two fish-year cases where spawning end was not known, and four fish-year cases where both spawning start and end were not known. This accounted for 2% of all fish-year cases and was considered a reasonable loss of data quantity to improve data quality.
In order to calculate time in the spawning area, a fish needed to have both an arrival and departure date. The detection criteria used in this study may introduce bias toward fish exhibiting more detectable movements; however, due to the high density of receivers in the spawning area, this bias was considered minimal.
The length of stay in the spawning area was analyzed using a Poisson generalized linear mixed model (GLMM), with fixed effects of water temperature on arrival (°C), mean rate of temperature change during each fish's spawning period (°C/day), discharge on arrival (kcfs), mean rate of discharge change during each fish's spawning period (kcfs/d), the day of year on arrival, and a random effect of unique fish. Temperature and discharge on arrival were the recorded daily mean temperature and discharge for each fish's first day in the spawning area. For the rate of temperature and discharge change, the mean value of the step changes in water temperature and in discharge between every two consecutive days was calculated for each female's spawning period. The effects of temperature and discharge on arrival were modeled as linear (on the log link scale). To account for nonlinear relationships, splines were used to model the effect of day of year on arrival (two degrees of freedom), the mean rates of change in temperature (two degrees of freedom), and discharge (three degrees of freedom). The model was fit using the package glmmTMB[28] in R v.4.4.2[29]. Prior to modeling, potential multicollinearity of predictor variables was assessed using a variance inflation factor[30]. Models were constructed such that all selected predictors had a variance inflation value below three, which would indicate a lack of multicollinearity[30,31]. Following the modeling step, model assumptions were checked using simulated residuals using the 'DHARMa' package in R[32]. This included QQ-plots of the simulated residuals, as well as Kolmogorov-Smirnov tests for assessing deviations from expected residual distribution and dispersion tests to evaluate potential heteroscedasticity. In addition, the simulated residuals were plotted against model predictions and against each individual model predictor to assess residual trends that may be indicative of poor fit. Daily mean temperature and discharge data used were from the US Geological Survey (USGS: 2005–2022) and the US Army Corps of Engineers (USACE: 2022–2023) stations in the spawning area of the Kootenay River.
Habitat use outside of spawn
-
To assess habitat use between spawns, pre- and post-spawning migrations were excluded from the habitat use analysis. Since females in this system are often observed migrating from the lake into the river as early as the summer prior to migrating to the spawning area, time outside of spawn was defined as prior to 1 July of the year before spawning and two weeks following the last day in the spawning area. Habitat use outside of spawning was classified as lake, river, or mixed use. Lake use was defined as spending > 50% of time outside of spawning in the lake, which constitutes a majority of time spent in the lake when not spawning. River use was defined as spending no time in the lake, and mixed use was defined as spending between 0% and 50% of time outside spawning in the lake.
A minimum of 100 d of data were needed in a given year to include data from a given tag (tag-year) in order to ensure sufficient data for habitat classification. A minimum of 100 d of retained habitat use data was required for all spawners in the study, but 3% of the tag-year combinations were removed, primarily for data, either at the start or end of the tag life. Habitat use was analyzed using a logistic GLMM, with a fixed effect of year, and crossed random effects of year (as a categorical variable) and unique fish. The effect of year was modeled as a natural spline with three degrees of freedom, to account for the nonlinearity of the relationship. The response variable was a matrix of the annual number of days spent in the lake and the annual number of days spent in the river. The model was fit using the same packages and methods described above.
Spawn intervals
-
The data subset used to analyze spawn intervals only included fish that spawned at least twice with an active tag. The time between spawns was analyzed using a mixed-effects quasi-Poisson generalized additive mixed model (GAMM) with fixed effects of year and percent time spent in the Kootenay Lake since the previous spawn, and a random intercept for unique fish. Fish size was not included as a predictor due to lack of recapture data in a system with highly variable growth; therefore, the size at each spawn is unknown[26]. The response variable was the number of years since previous spawning. The effects of year and percent time spent in Kootenay Lake since the previous spawn were both modeled using penalized thin plate splines with the upper limit on the degrees of freedom set to 10. The use of a GAMM with a quasi-Poisson distribution was necessitated by the data structure, since using GLMMs with the available distribution families invariably resulted in failed model convergence or failed residual diagnostics. The model was fit using the package mgcv[33] in R v.4.4.2[29]. Slope significance along the time series was estimated using the package gratia[34].
-
In total, 225 females were tagged between 2003 and 2023. The size of tagged females ranged from 121 to 274 cm (median = 187 cm) in fork length and 21 to 190 kg (median = 61 kg).
The number of tags released per year ranged from five (in 2003 and 2020) to 20 (in 2013). Of the 225 individual females, 18 received more than one tag over the course of the study. Of those 18, five fish were tagged in a different habitat the second time (i.e., if tagged in the lake the first time, they were tagged in the river the second time and vice versa). The majority of tags were deployed into fish captured in the Kootenay River (78%; Fig. 2). Annually, this percentage varied from 54% (in 2021) to 100% (in 2005–2006 and 2010).
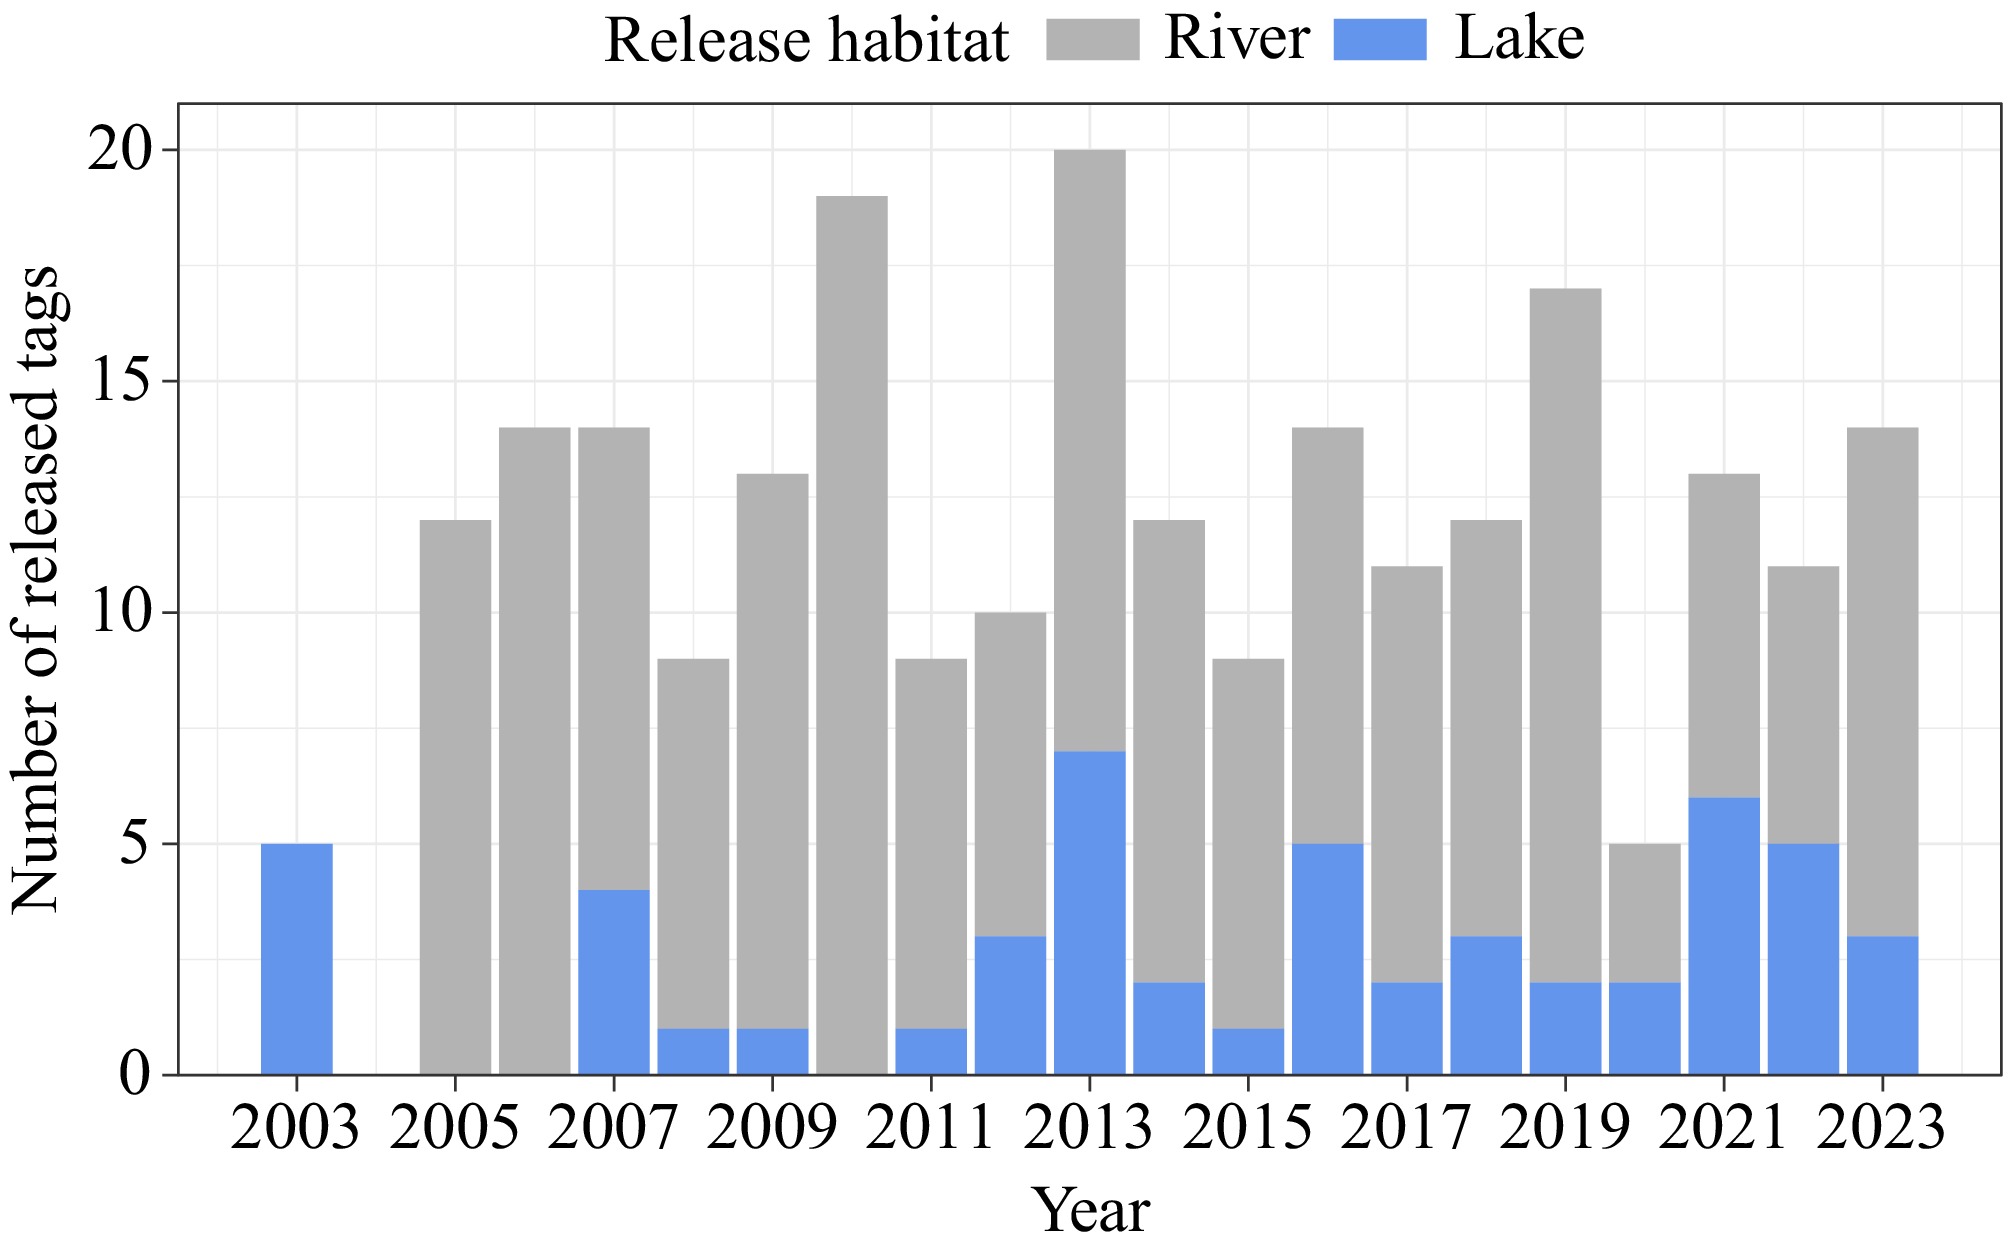
Figure 2.
Number of acoustic tags released in each sampling year in the Kootenay River, ID (grey) and Kootenay Lake, BC (blue).
Of the 225 females, 204 females were included in the study; 21 females were removed from this analysis because they resided in or around the spawning area (n = 9, 4%), were tagged during the most recent spawning period (n = 8, 4%), or had limited detection data from tag malfunction or mortality before spawn movement was captured (n = 4, 2%).
Time in spawning area
-
Date of arrival was calculated from a total of 197 unique fish and 360 unique combinations of fish and year. Date of departure from the spawning area was calculated from a total of 203 unique fish and 395 unique combinations of fish and year. The length of time spent in the spawning area was calculated for fish that had both an arrival and departure date: 197 unique fish and 358 unique combinations of fish and year.
The temporal distribution of fish presence in the spawning area differed between years (Fig. 3). Fish arrived in the spawning area between 1 May and 27 June, with an overall median date of arrival of 18 May. After spawning, tagged females left the spawning area between 7 May and 29 July, with an overall median departure date of 12 June.
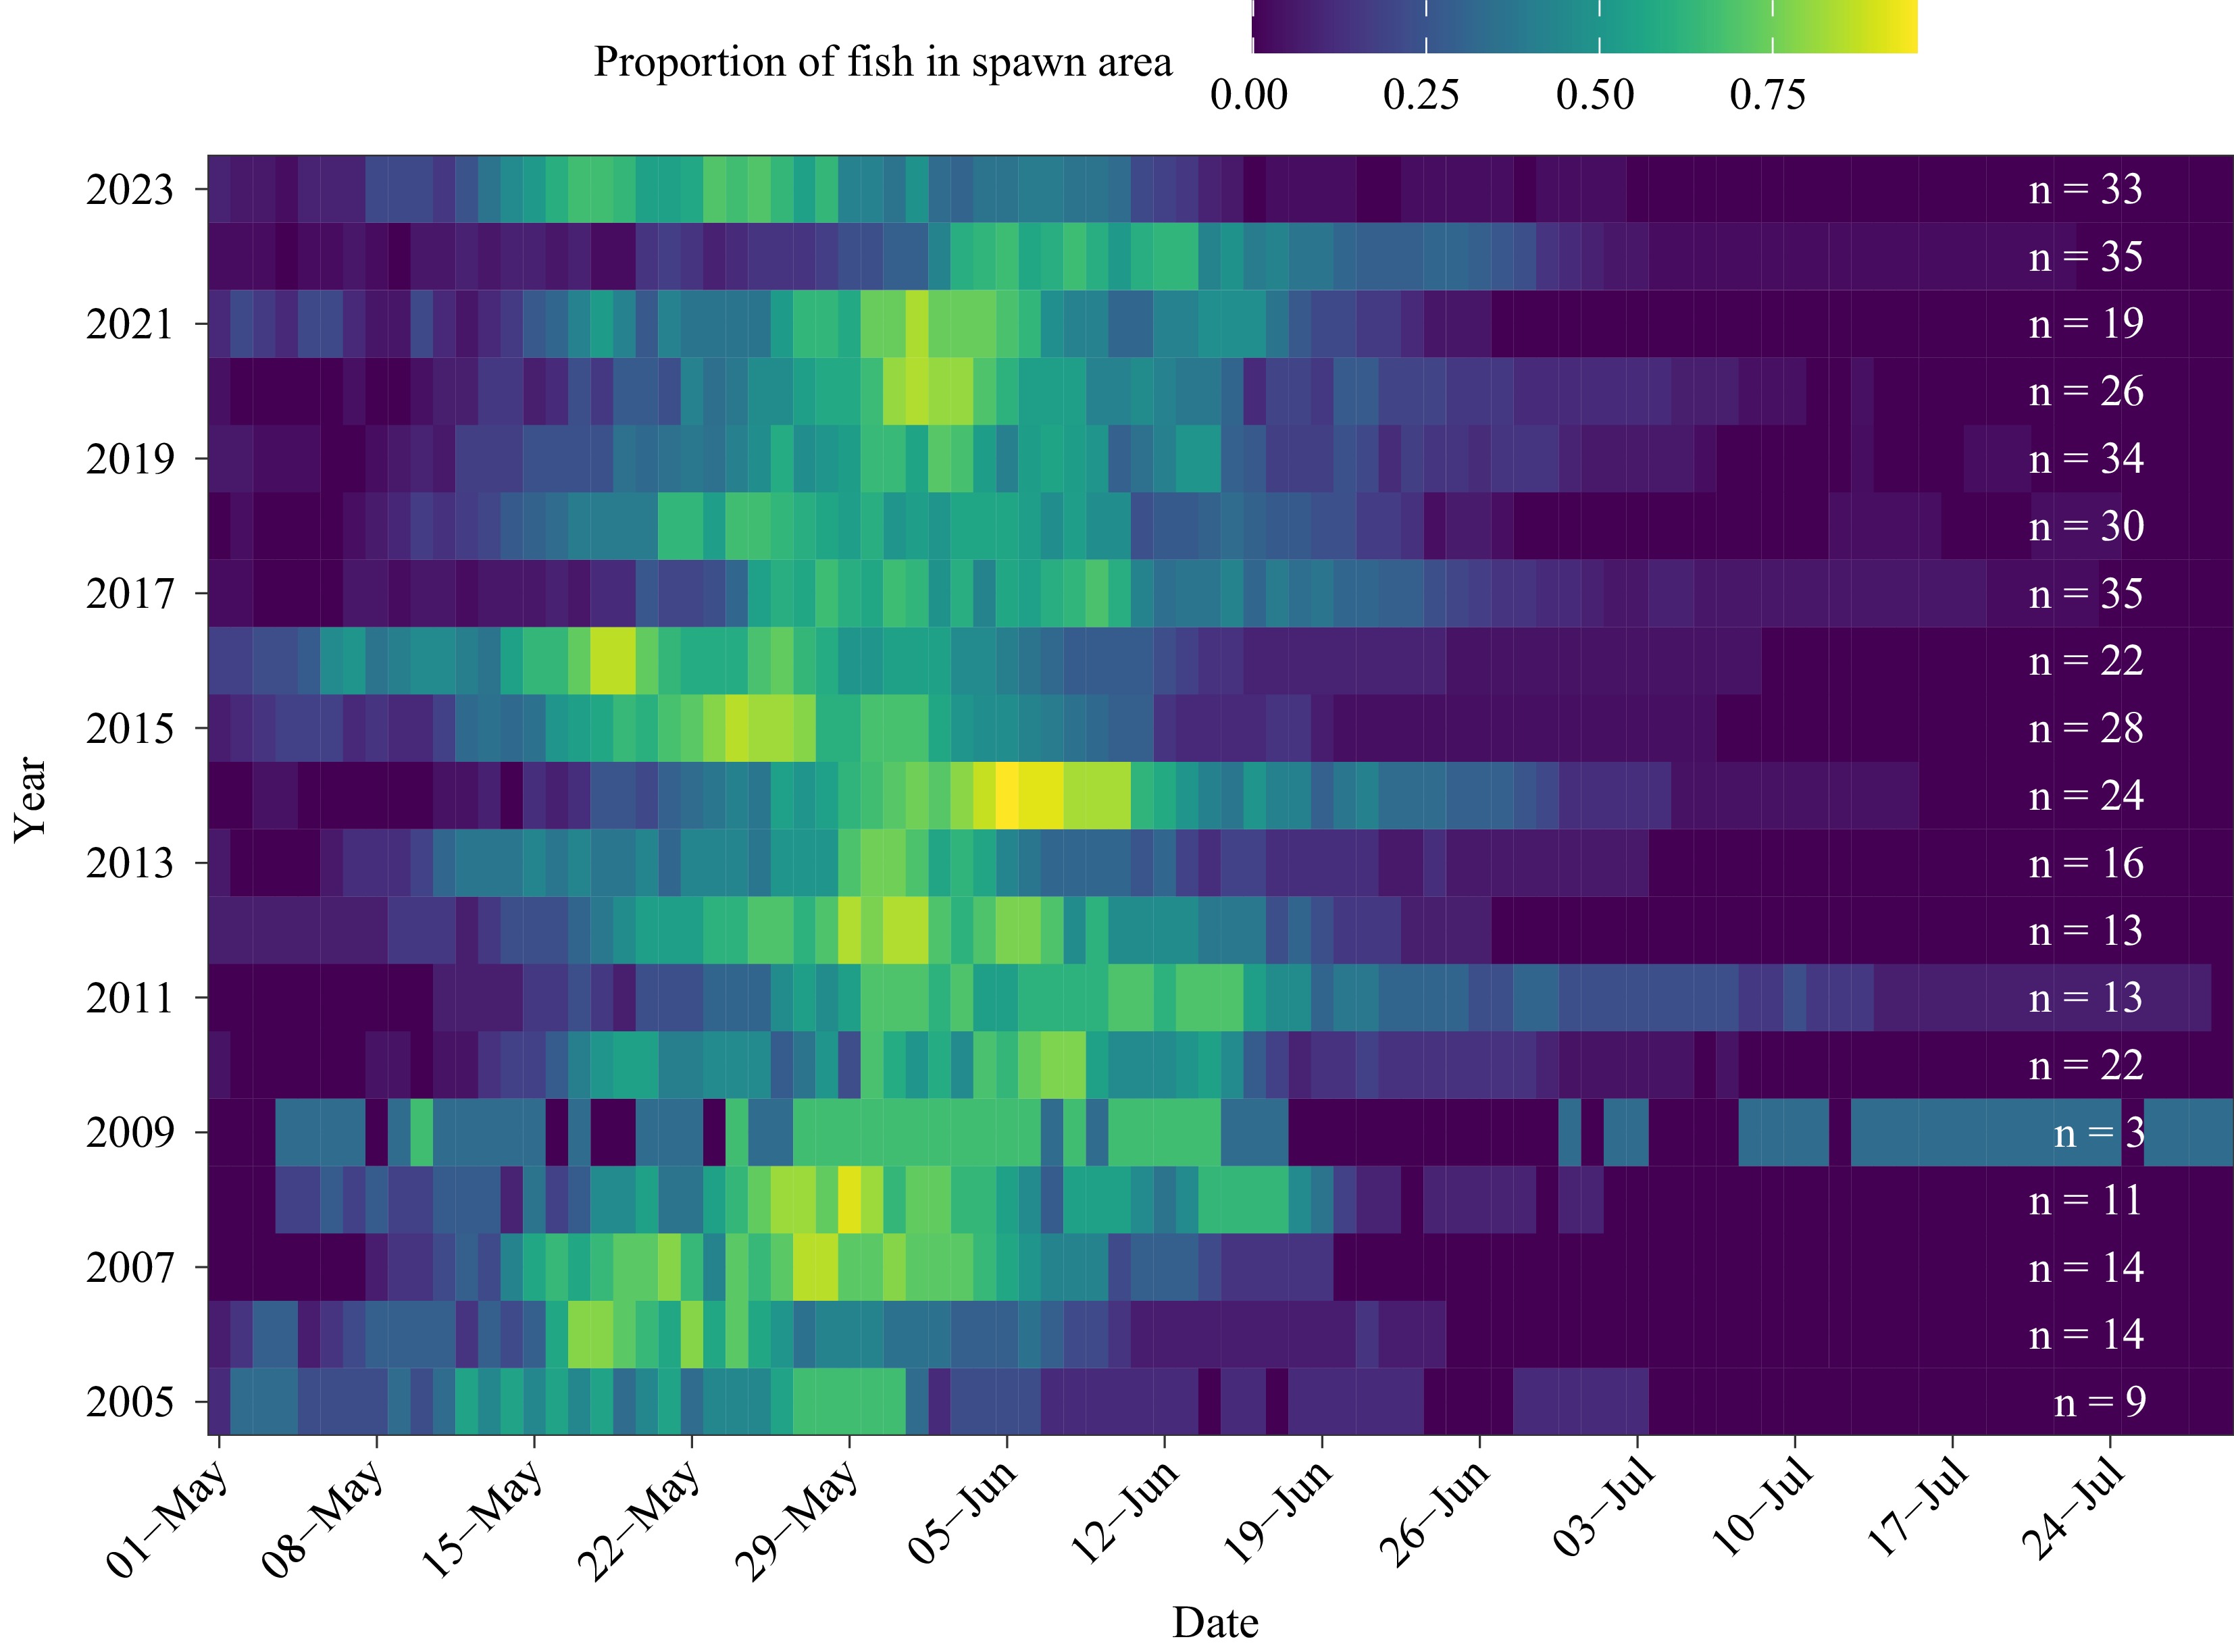
Figure 3.
Proportion of fish detected in the spawning area in a given year, by day and year. The sample size (n) was the number of females for which time in the spawning area was calculated for that year.
The number of days individual fish spent in the spawning area ranged from 3 (in 2006) to 71 d, with an overall median of 24 d. In addition, one fish in 2022 left on the day of arrival, resulting in 0 d in the spawning area.
Females arrived in the spawning area as water temperatures increased in the spring months (Fig. 4). The median temperature at the time of arrival in the spawning area for all fish in all years was 9 °C. The lowest temperature when a female was detected in the spawning area was 4.9 °C in 2006.
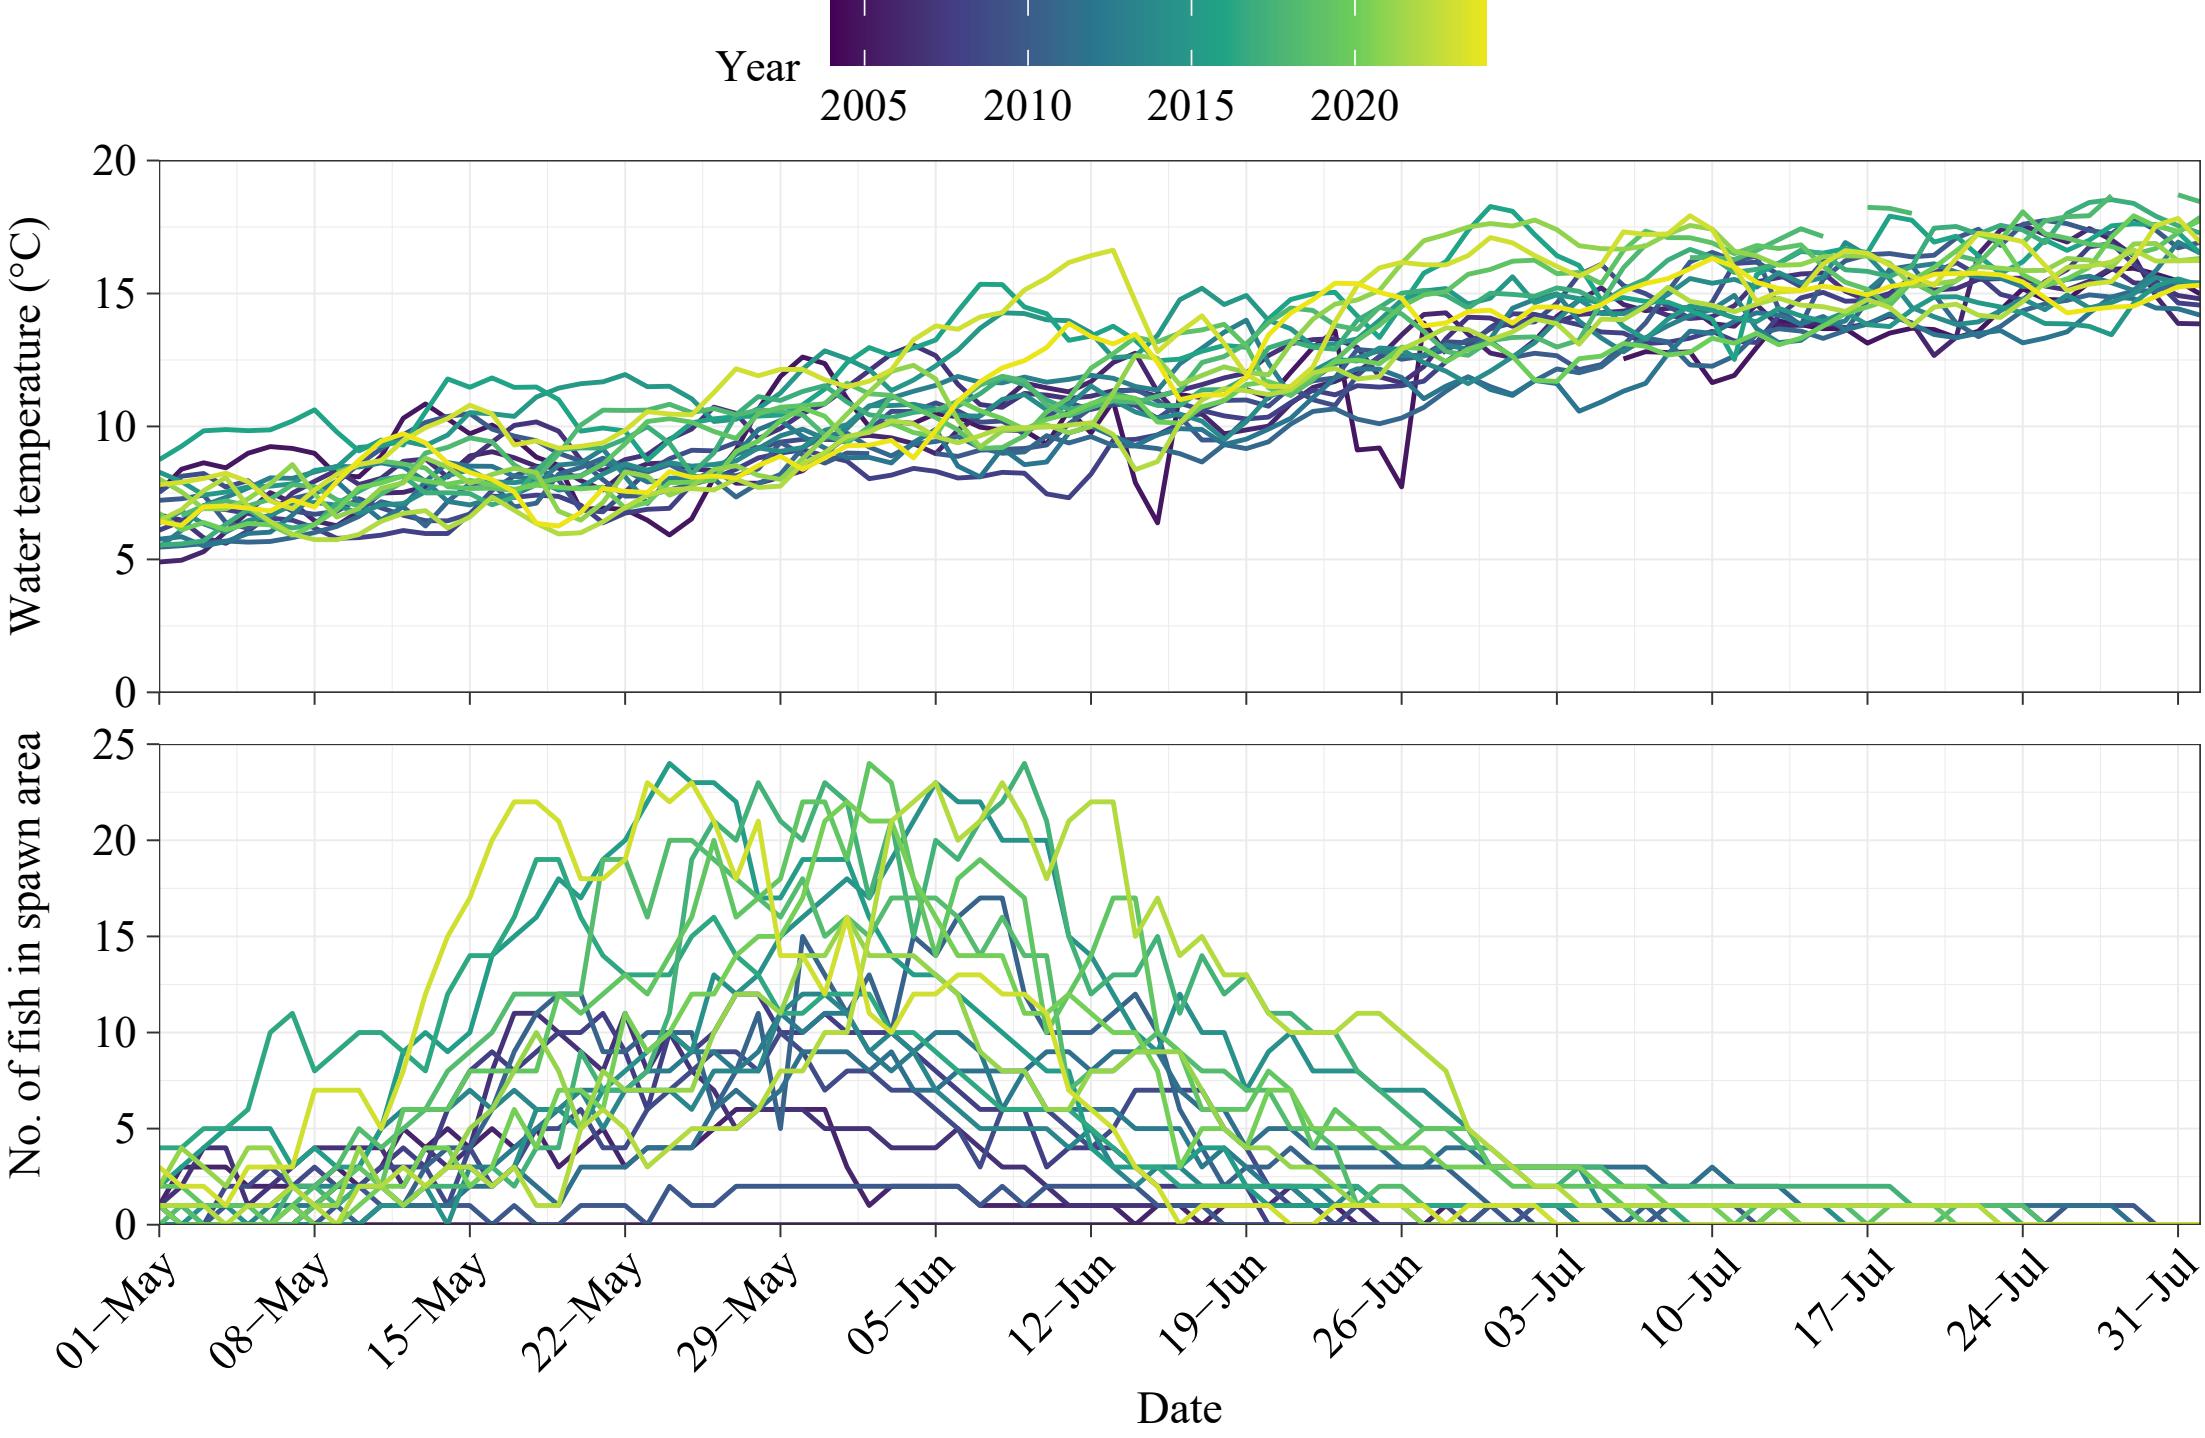
Figure 4.
Daily water temperature (°C; upper panel) and daily number of tagged fish present in the spawning area (lower panel). Tagged fish are only those included in the time-in-spawning-area analysis.
In the analysis of length of stay in the spawning area, all modeled effects were found to be significant (p < 0.001 for all, Table 1). Length of stay in the spawning area decreased significantly (p < 0.001) with increasing water temperatures on arrival (Fig. 5), by 13% for every 1 SD (1.61 °C) increase in water temperature on arrival to the spawning area. On the other hand, length of stay in the spawning area increased significantly (p < 0.001) with increasing discharge on arrival (Fig. 5), by 12% for every 1 SD (8.72 kcfs) increase in discharge on arrival to the spawning area.
Table 1. Generalized linear model (GLMM) results of the analysis of length of time on the spawning grounds.
Terms χ2-value df p Temperature on arrival 85.370 1 < 0.001 Discharge on arrival 25.271 1 < 0.001 Mean rate of change in temperature 103.235 3 < 0.001 Mean rate of change in discharge 82.006 2 < 0.001 Day of year on arrival 29.211 2 < 0.001 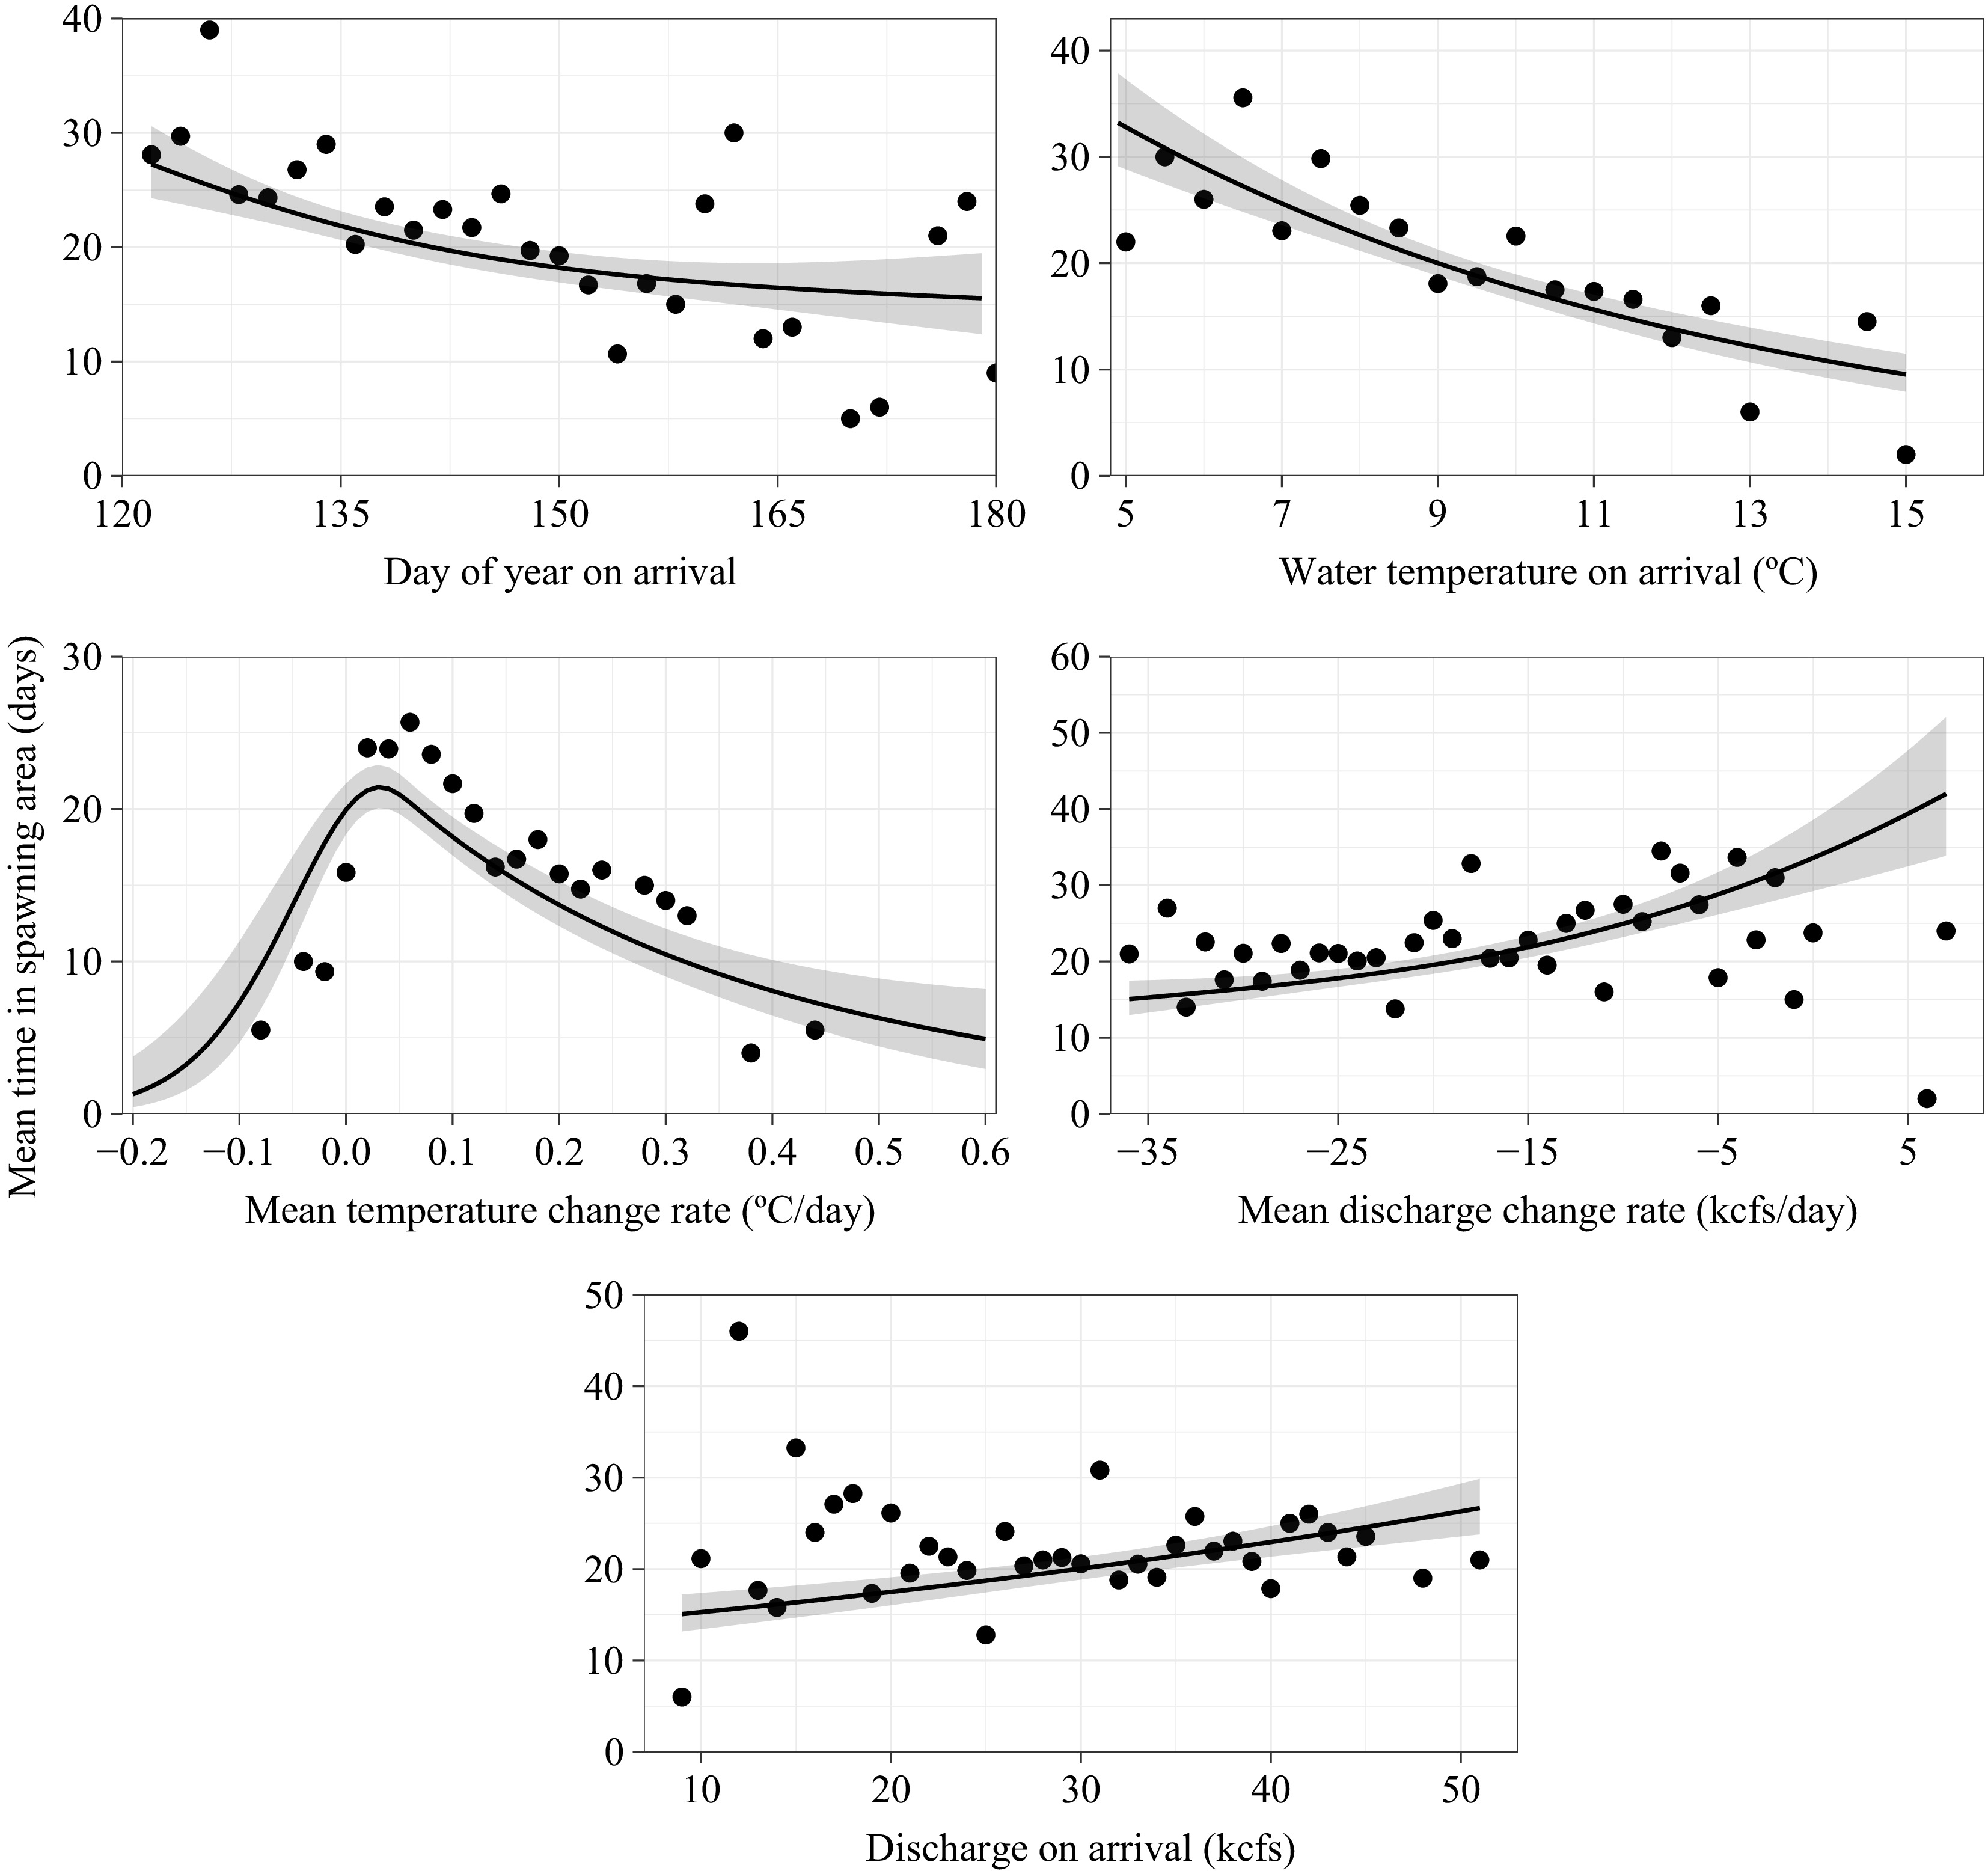
Figure 5.
Observed (points) and model-predicted (lines and ribbons) lengths of time in the spawning area (d) based on the temperature on arrival (°C) and the rate of change in temperature for unique fish-year combinations. For visualization purposes, observed values were averaged within each 0.2 °C step in temperature change and within each 2 °C step in temperature on arrival. Grey ribbons are the 95% confidence intervals associated with model predictions.
The effect of rate of temperature change during the period when the fish were at the spawning area was non-linear and depended on whether the rate of temperature change was low or high. When temperatures were relatively stable (rate of temperature change below 0.03 °C/d), the length of time in the spawning area increased rapidly with increasing rate of temperature change, up to 255% for every 1 SD (0.07 °C/d) increase in rate of temperature change. When the rate of temperature change was above 0.03 °C/d, the length of time in the spawning area slowly declined by 17%–20% for every 1 SD increase in temperature change rates.
The effect of the rate of discharge change during the period when the fish were in the spawning area was also non-linear. When the rate of discharge change was below –16 kcfs/d, the length of the spawning period increased by 11% to 19% per 1 SD (8.24 kcfs/d) increase. When the rate of discharge change was above –16 kcfs/d, the length of time in the spawning area increased faster, by 26% to 33% for every 1 SD increase in discharge change rates.
The effect of day of arrival to the spawning area was also non-linear. When fish arrived before day 150 (29th May), length of spawning period decreased by 10%–19% per 1 SD (11.8 d) increase. When fish arrived after day 150, the length of time in the spawning area decreased more slowly, by 3% to 6% for every 1 SD increase in day of arrival.
Habitat use outside of spawn
-
Females predominantly resided in the lake outside of spawning. Of the 196 unique fish and 1,252 unique fish-year combinations, 185 (94%) fish and 1,119 (89%) fish-year combinations were 'lake residents' (i.e., they resided in the lake more than 50% of the year). Of these lake residents, the median time in the lake was 356 d or 97.8% of the year. Most lake residents (68%) made a pre-spawn migration into the river (e.g., panel B in Fig. 6), either in the summer or fall before spawning and overwintered in the river or went back to the lake and returned the following spring. All lake residents returned immediately to the lake after leaving the spawning area. The finer-scale habitat selection within each habitat varied by individual, and distance to the spawning area from a lake resident fish ranges from 110–230 km (examples of four of the 196 females are shown in Fig. 6).
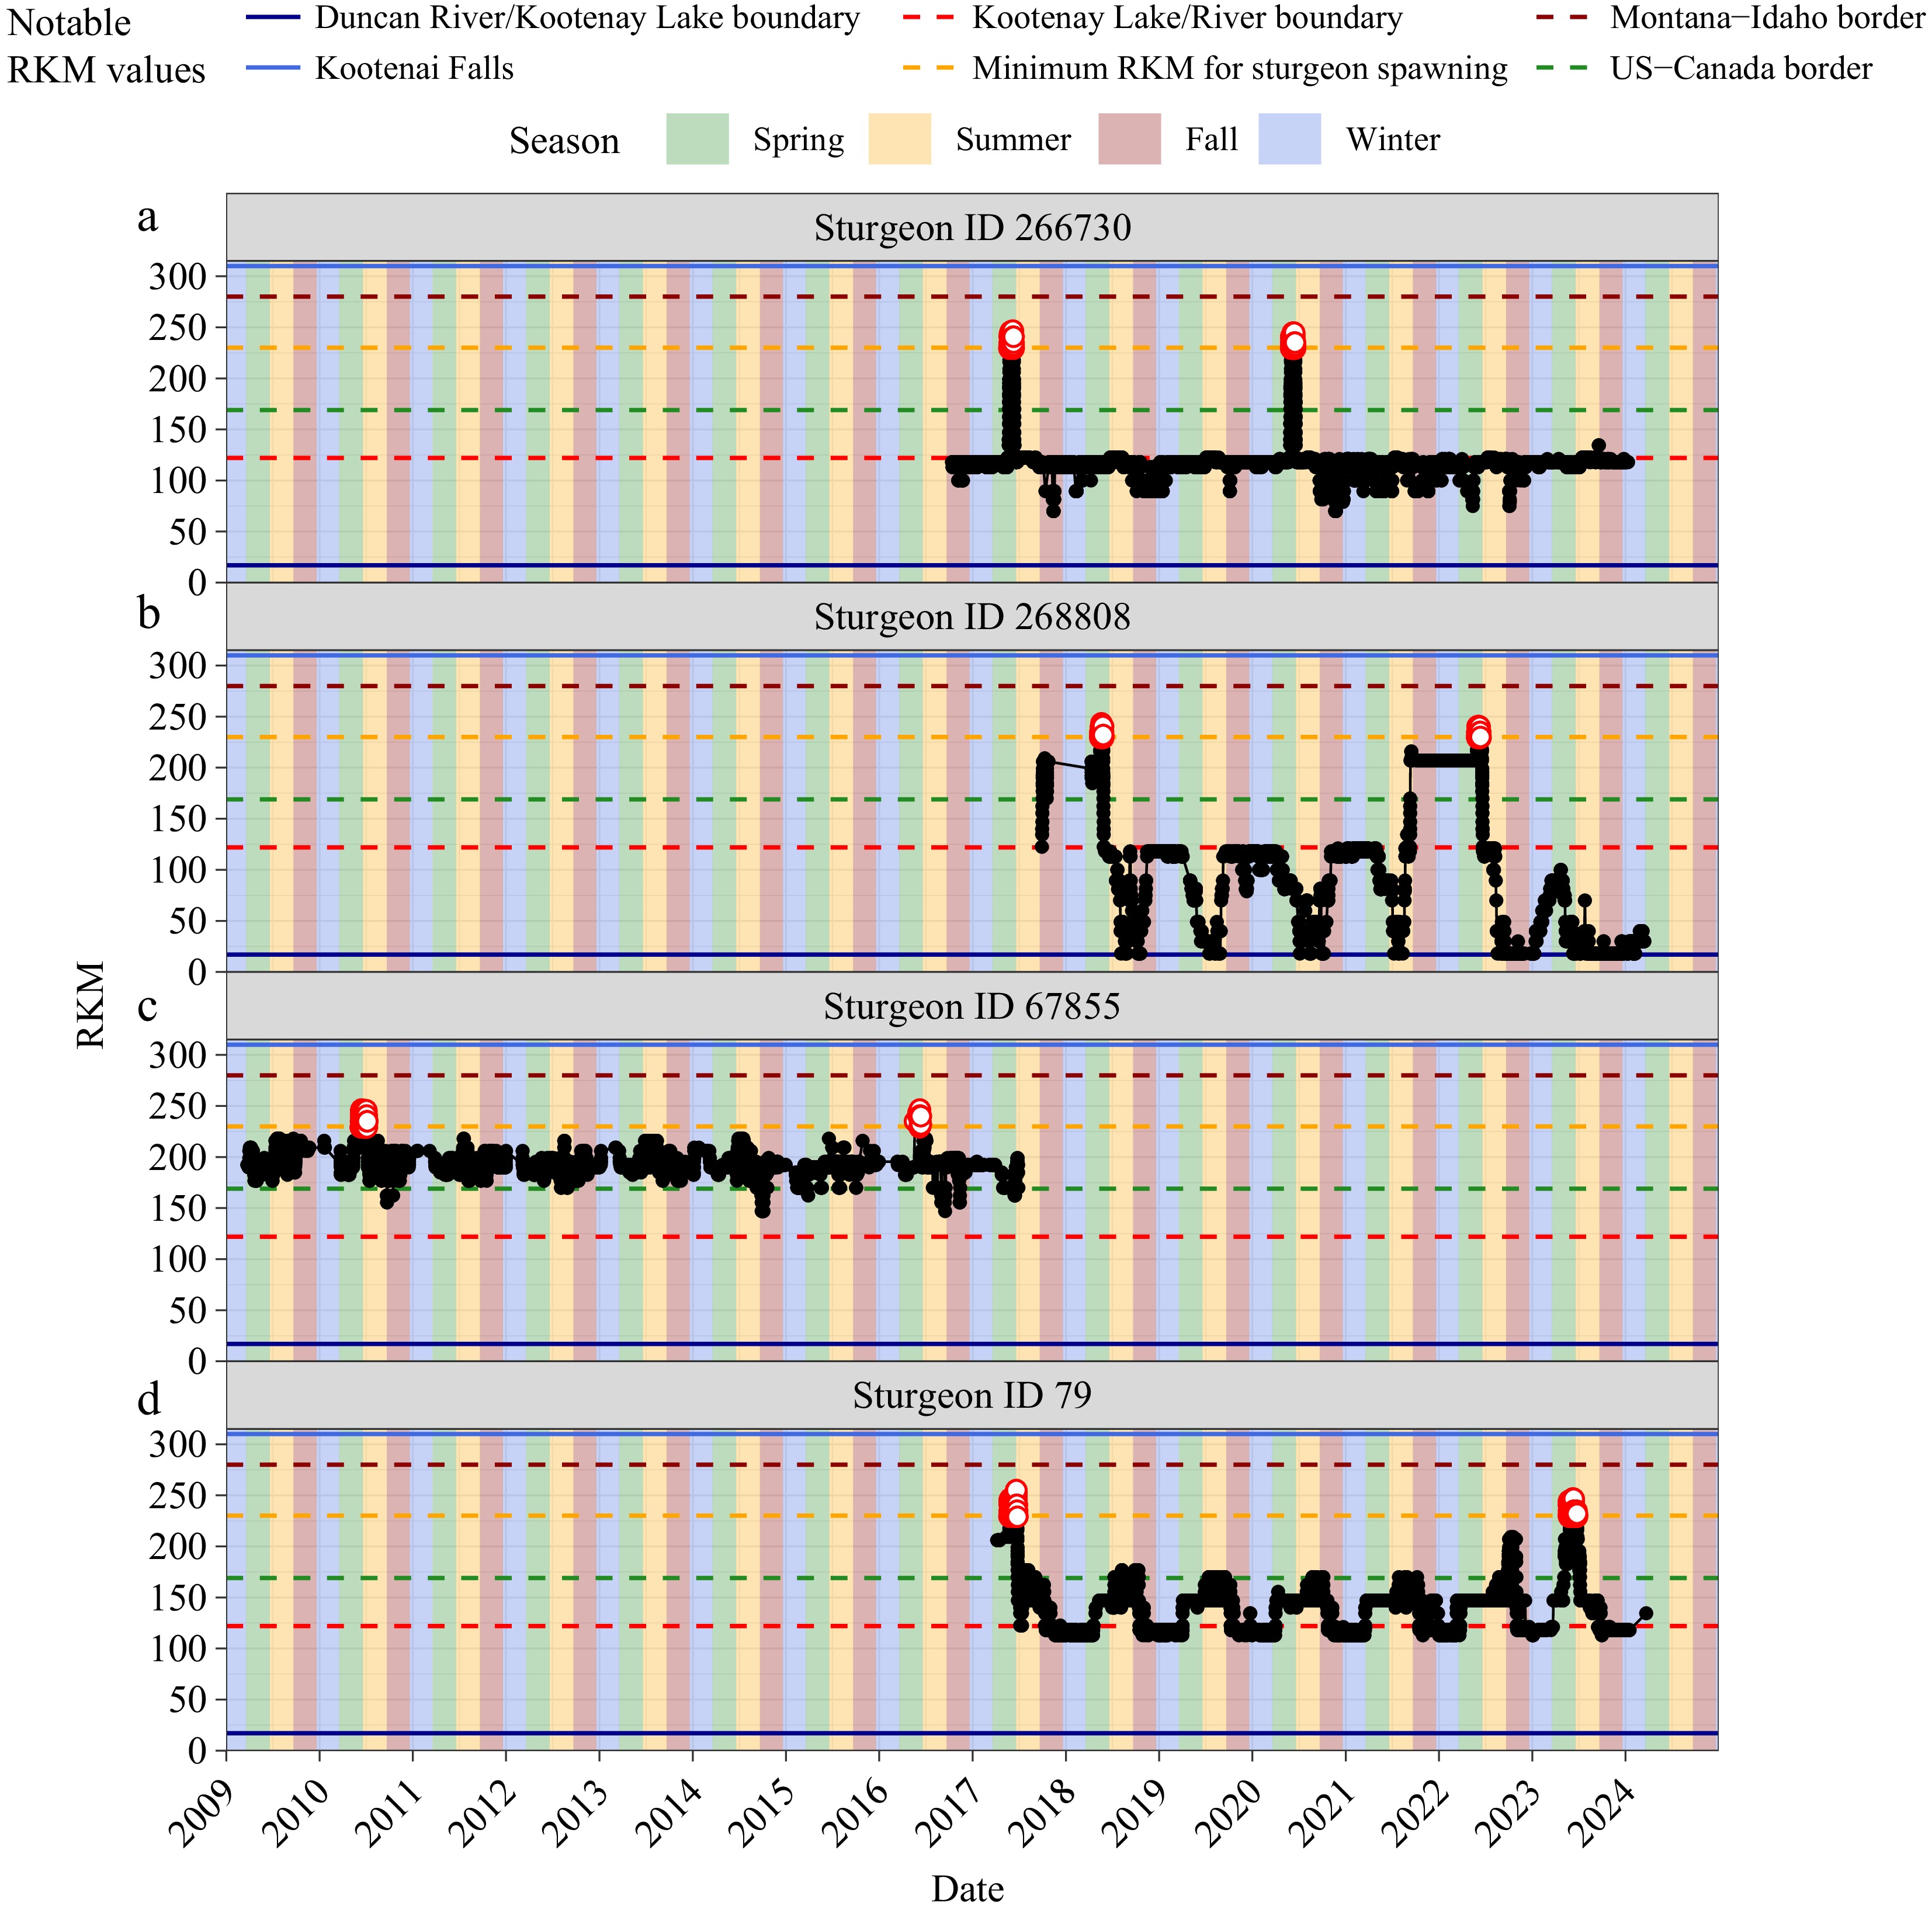
Figure 6.
Movement of four example females; detections from all receivers with locations identified by river kilometer (RKM). Key areas are identified with horizontal lines, vertical colours identify season within each year, and the red dots are the detections on the spawning area. Plots A and B are examples of females who reside in the lake outside of spawning, with spawn intervals of three and four years, respectively; female B does a pre-spawn migration the year before, and female A does not. Female C is an example of a river resident with a six-year spawn interval, and female D is an example of a female that has time in both the river and lake outside of spawn and a six-year spawn interval.
A small portion of the fish resided exclusively in the river outside of spawning: 16 (8%) of fish and 88 (7%) of fish-year combinations. In addition, 20 (10%) of the fish and 50 (4%) of the fish-year combinations had a mix of lake and river use outside of spawning (residing in the lake less than 50% of the year). Of the 196 unique fish, 176 fish (90%) selected the same habitat outside of spawning for all years of tag data. The remaining 20 fish (10%) varied in their habitat use across years.
In the analysis of temporal changes in lake use, the effect of year for lake use was significant (p < 0.01) (Fig. 7, Table 2). While fish spent most of their time within the lake, temporal trends in habitat use suggested long-term shifts. The odds of a female residing in the lake decreased significantly between 2006 and 2011 by 5%–15% year-over-year (p ≤ 0.023), then increased significantly between 2013 and 2018 by 4%–16% year-over-year (p ≤ 0.045). Between 2021 and 2023, the odds of female fish being in the lake decreased again, up to 26% year-over-year (p < 0.01 for all).
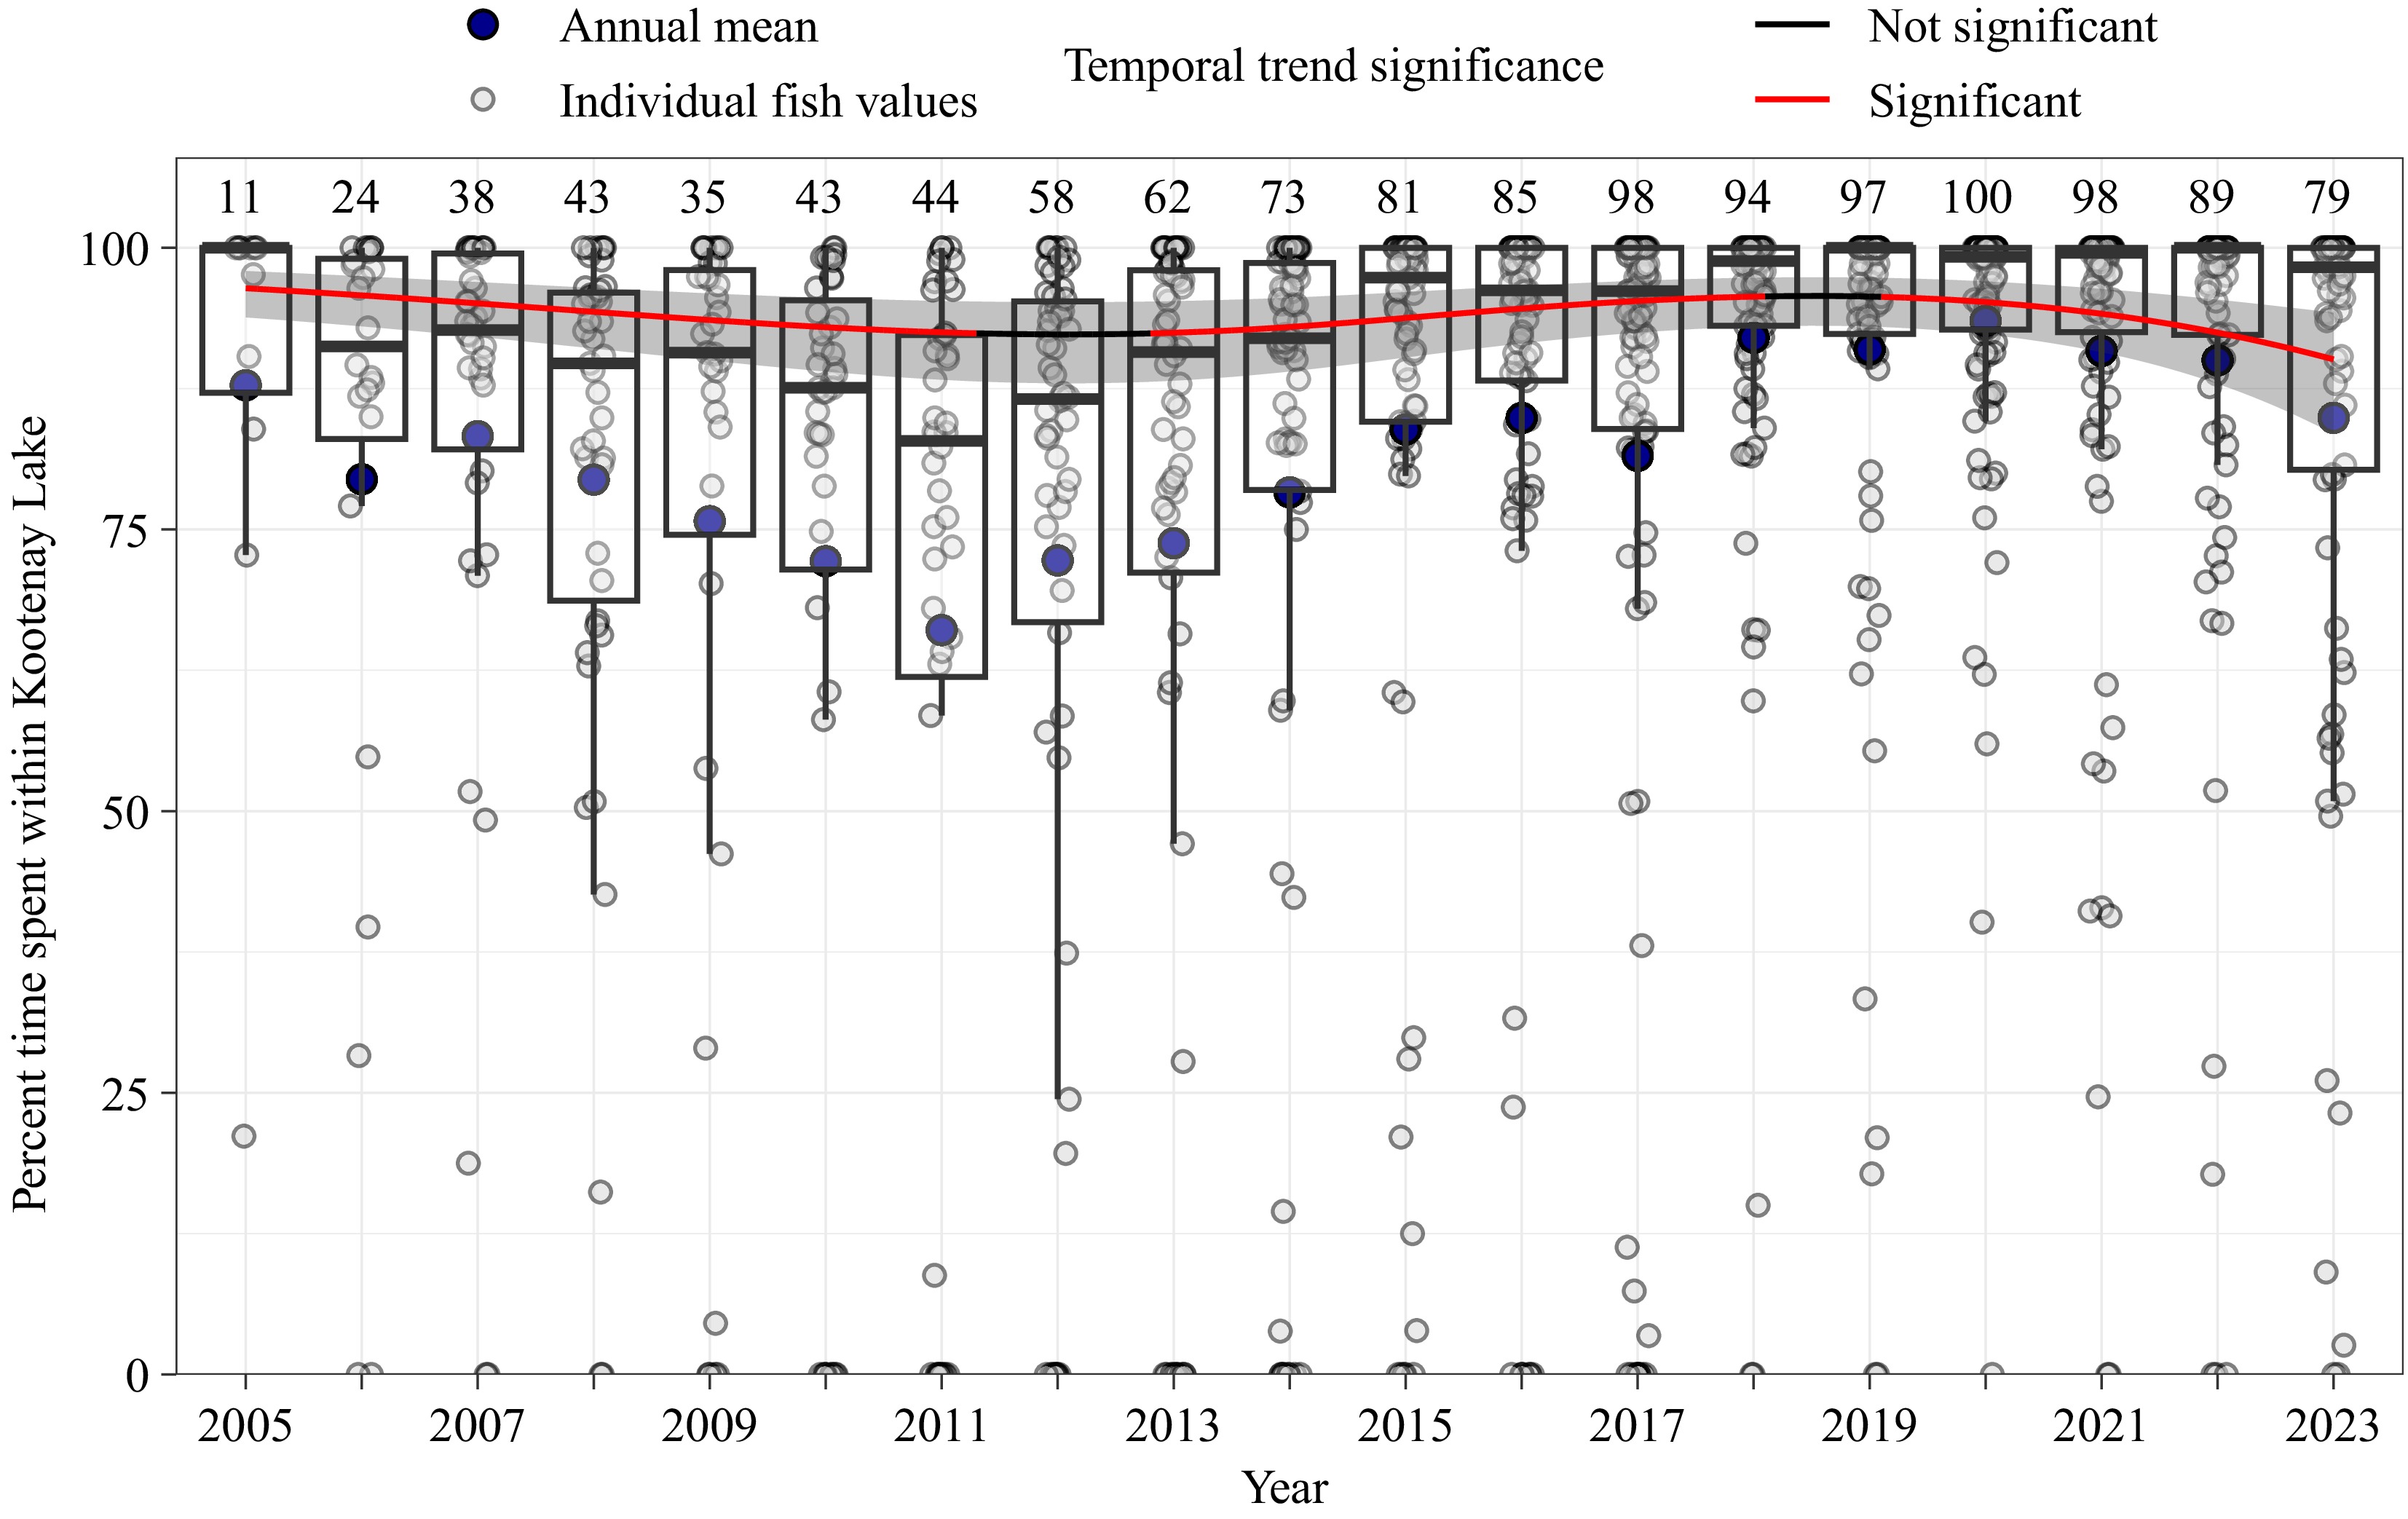
Figure 7.
Observed (points and boxplots) and model-predicted (line and ribbon) time (%) spent in Kootenay Lake, outside of spawn year, over time. Open points are observed values for each fish-year combination. Boxplots show the annual median (thick line) and 25th and 75th quantiles (bottom and top of box); whiskers extend to 1.5 times the quartile values. Large blue points show observed annual mean values. The grey ribbon is the 95% confidence interval associated with model predictions.
Table 2. Generalized linear model (GLMM) results of the analysis of percent time spent in Kootenay Lake.
Terms χ2-value df p Year 21.662 3 < 0.001 Spawn intervals
-
Spawning intervals were calculated from 136 unique fish and 189 unique combinations of fish and year. The time between spawns ranged from two to seven years (Fig. 8). Of the 136 tags, 65 had intervals of three years, and 58 had intervals of four years, accounting for 49% and 32% of the annual spawn cases, respectively. The median time between spawns was three years (mean = 3.7 years). Spawn intervals remained the same over time for 80% of the fish. Spawning intervals changed significantly over time (p = 0.019) but did not have a significant relationship with time spent in Kootenay Lake since the previous spawning (p = 0.8; Table 3). Spawning intervals increased by 8%–10% year-over-year between 2009 and 2012 (all slopes statistically significant), followed by 2%–5% year-over-year decreases between 2014 and 2017 (slope significant for 2015). Since 2018, spawning intervals have remained stable, with year-over-year changes ranging from –0.7% (in 2018) to +1.9% (in 2024).
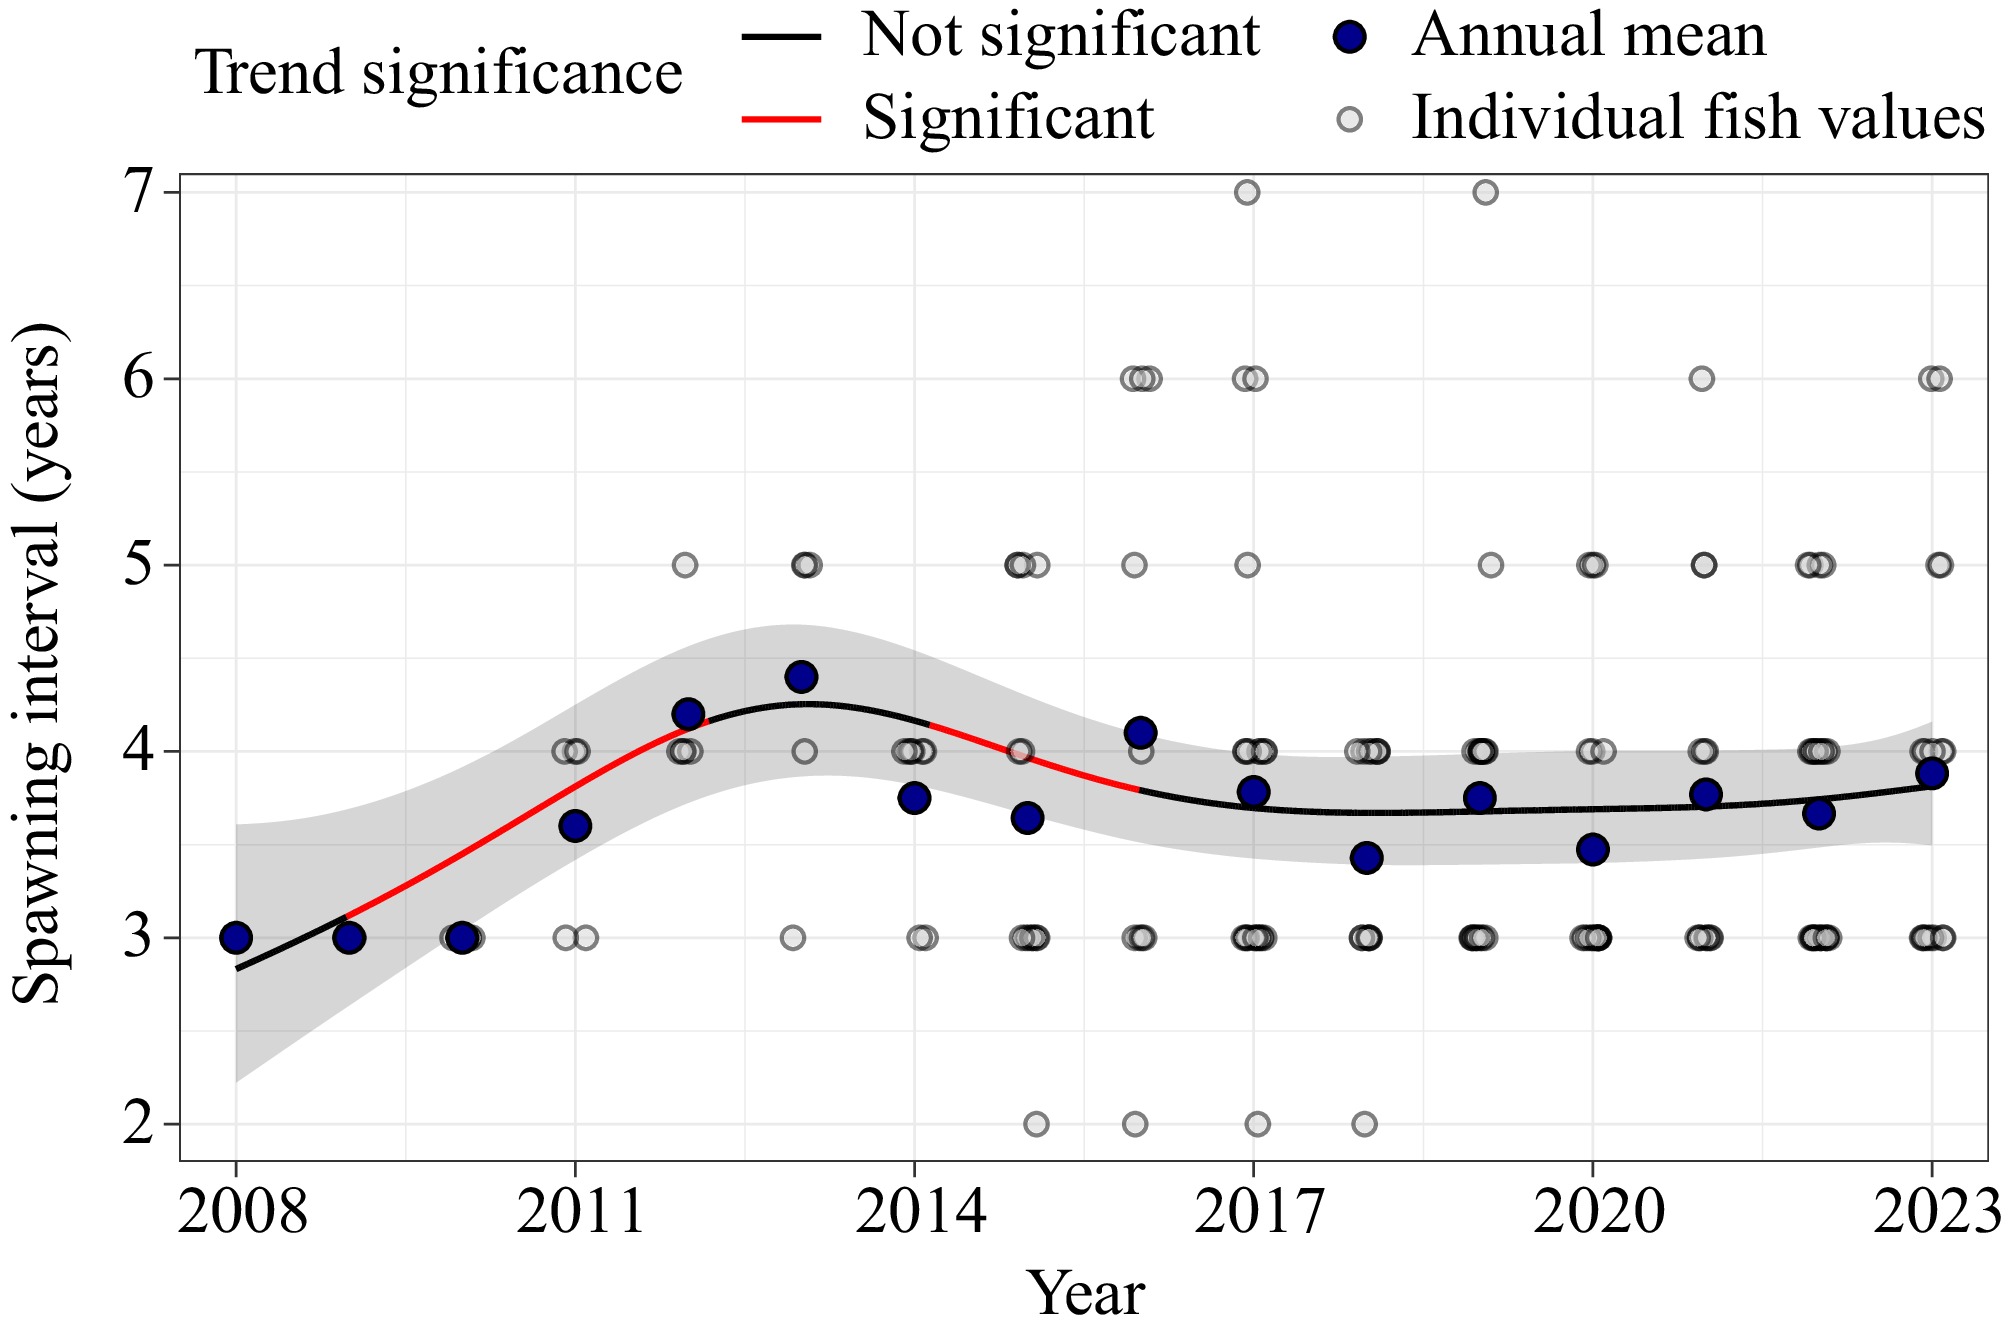
Figure 8.
Observed (points) and model-predicted (line and ribbon) trend in spawning interval (i.e., years since previous spawn) over time. Open points are observed values for each fish-year combination. Large blue points show observed annual mean values across all fish. The grey ribbon is the 95% confidence interval associated with model predictions.
Table 3. Generalized additive mixed model (GAMM) results of the analysis of percent time spent in Kootenay Lake since the previous spawning (time in lake) and year on the length of spawning intervals. Edf: effective degrees of freedom.
Terms Edf F-value p Time in lake 1 0.091 0.763 Year 4.519 3.559 0.019 -
Temporally appropriate datasets are required to capture spawning behaviour for long-lived, periodic spawning species such as White Sturgeon. After 20 years of tagging and monitoring, this study improved our understanding of female White Sturgeon spawning movements and habitat use. Although telemetry data cannot confirm spawning by the females in the study, egg mat monitoring confirmed spawning (e.g., study by Hardy et al.[25]) in the spawning area in all years of this study. The females used in this study did not reside in the spawning area outside of the time that spawning occurs. Additionally, the stage of egg development was known for all females at tagging, further supporting movements to the spawning area as spawning. The extent of the spawning area, as confirmed by egg mats, has been consistent over the study period, and adults typically do not spend time in this area outside of the spawn period[21,25]. Telemetry data collected in the current and prior studies did not indicate any additional spawning areas.
The time spent in the spawning area by females in this study was more than twice as long as reported in the earlier study on the Kootenay. Paragamian & Kruse[21] reported that females in the Kootenay system spent on average 10.5 d, whereas it was 24 d in this study. This finding is not likely related to environmental changes, but rather the earlier study had a shorter study length, smaller sample size, and was limited to active tracking. This study had a more robust dataset and used the permanent acoustic telemetry array established in 2003. The time in the spawning area reported in this study is similar to data reported for other sturgeon species. For instance, Breece et al.[35] reported Atlantic Sturgeon females spent on average 21 d in the spawning areas.
This study can be used to inform protection needs for White Sturgeon during the spawning window. Because female sturgeon spend less time in the spawning areas, using females (vs males) is more informative for the window of spawning activity[21,35]. Female White Sturgeon median arrival date was 19 May, and the median departure date was 12 June, and over the course of this study the time in the spawning area encompassed a temporal period from 1 May to 29 July. In the Kootenay system, this would directly inform water management and flow planning focused on the spawning area. Although the time in the spawning area for the Kootenay system may not directly translate to other sturgeon populations, the timing should be considered for protection measures, such as in-stream activities or angling closures.
Similar to what was reported in previous studies, the arrival time for spawning females was connected with warming temperatures[36]. Additionally, this study documented the linkage with length of stay in the spawning area and the rate of warming. The period on the spawning area is generally concurrent with peak spring flows. However, flows can be highly variable in this managed system, and time in the spawning area, as well as other egg deposition studies in the Kootenay system, focus on the connection with increasing temperatures during spring flows. The median temperature for arrival (9 °C) aligns with when embryos are typically first collected in the Kootenay (8.5 and 12 °C[37]) and the optimal water temperature range of 9.5 to 12.5 °C[38]. Most White Sturgeon populations spawn when water temperatures reach 14 °C[11]. However, the Kootenay is generally colder than most other systems, and spawning begins just above the temperature where high egg mortality is observed (8 °C[11]). Spawn timing for Kootenay River White Sturgeon is likely adapted to occur when temperatures are high enough to avoid mortality[11], yet early enough that flows will be optimal for survival and dispersal of larvae[39]. Libby Dam is equipped with selective withdrawal, allowing water managers some ability to regulate temperature downstream of the dam[40]. An understanding of how temperature influences spawning is critical to planning water releases designed to benefit sturgeon during the spawn, and this study furthers our knowledge of temperature effects.
Habitat use outside of spawn has important implications for recovery actions and monitoring programs. While the amount of lake use varied over time, wild females predominantly used the lake outside of spawning in all years. This difference was regardless of the fact that most females were caught and tagged in river sampling, during spawning or pre-spawn migration. Spawning occurs in the river, but this study highlights the importance of the lake for maintaining a healthy adult population. Most females had pre-spawn staging migrations, beginning in the lake and moving up the river closer to the spawning area during the summer/fall prior to spawning, but a small portion of the females migrated straight to the spawning area from the lake immediately prior to spawning. The cause of temporal changes in lake use outside of spawning identified in this study is not well understood and does not appear to be correlated with obvious factors, such as density or prey availability. Monitoring abundance in the lake, with the decline of the wild population along with an increase in mature hatchery sturgeon, will be essential to ensure this habitat supports the energetic demands for egg development and spawn success. Furthermore, understanding the likelihood of adults occupying one habitat or the other could improve efforts to model trends in survival and abundance.
The spawn intervals in this study provide more precision than previously reported in the literature. Prior to this study, data on spawn intervals were lacking or often depended on recapture events within mark-recapture studies or brood stock programs in wild White Sturgeon populations[11]. The spawn intervals of the females in this study ranged from two to seven years, with a median of three years. This is lower than previously reported in White Sturgeon literature, which ranged dramatically, but the average was estimated at four years[11]. Green Sturgeon (Acipenser medirostris), a related species, was found to spawn every two to four years in the Rogue River, Oregon[41]. However, the tags used in this study would not detect intervals longer than four years[41]. The average spawn interval for lake sturgeon (Acipenser fulvescens) in the Black River, Michigan, was 3.19 years[42]. The analysis of spawn periodicity in this and other studies is inherently right-censored, as tags will typically expire between spawning events, therefore rendering the last event unobservable. This is particularly true for previous studies, for which tag life was shorter than the longest interval observed in the current study. The large sample size in this study and no recorded spawn intervals longer than seven years suggest the two- to seven-year range is representative of the population. However, there were six tags for which there was a single spawn migration and seven years of data prior to the tag expiring without recording another spawn migration, leaving the possibility of a longer spawn period not captured by the tags. It should be noted that if half of these six fish had a subsequent spawn interval longer than ten years, there would be little change to the mean spawn interval, but the median would increase to 3.5 years. If all six fish had subsequent spawn intervals longer than seven years, it would not change trends in the GAMM. That is, not capturing the subsequent spawn intervals in these six fish likely did not affect analysis results. Therefore, the three-year spawning interval from this study should be considered the best available estimate for white sturgeon.
All sturgeon species require a minimum of 18 months to complete vitellogenesis; however, the causes for variation in intervals between spawning are not known[15, 43]. The length of a reproductive cycle is likely influenced by many factors, including genetics, energetic demands, and other stressors. Although this study could not evaluate the size of females at spawning due to unknown growth since they were last encountered, the lake is more productive, and supports faster growth for juveniles[25,26]. The lake may better support energetic needs of adult sturgeon in preparation for spawning. However, our data did not support a relationship between time in the lake and the length of spawn interval. This may be due to the small sample size of fish residing only in the river outside of spawning, or spawn intervals may be more related to age or genetics, which are challenging to address with sturgeon.
Although this population is an ageing wild population facing recruitment failure since the 1970s, the year effect was variable, and the spawn intervals have been relatively stable since 2018. In addition to the ageing wild population, the Kootenay population also consists of known-age hatchery fish residing throughout the entire system, ranging from 1–33 years old. To date, no hatchery females have been encountered in spawning condition, but we would expect to see them entering the spawning population in the near future. Continuing to track spawning intervals as this wild population declines, and incorporating data from known age hatchery fish as they reach maturity, could inform the relationship with ageing.
-
This 20-year telemetry study significantly advances our understanding of wild female White Sturgeon spawning behavior, habitat use, and reproductive intervals. By providing estimates of time in spawning area, improved spawn interval data, and highlighting the critical role of both river and lake habitats, this research fills long-standing biological data gaps. The findings have direct implications for water management, habitat protection, and transboundary recovery planning. More broadly, this work strengthens the scientific foundation for conserving not only the Kootenay population but also informs strategies for other long-lived, periodic spawning sturgeon species across their range.
We respectfully acknowledge that this work took place on the traditional territories of the Ktunaxa, Sinixt, and Syilx First Nations. This work was completed with continued support of the Kootenay River White Sturgeon co-managers in the USA and Canada; in addition to the authors, this includes Montana Fish, Wildlife and Parks, Canada's Department of Fisheries and Oceans, US Fish and Wildlife Service, and US Army Corps of Engineers. As this was a long-term study, it was possible because of the foresight and efforts of many project staff who came before us, as well as many seasonal technicians who assisted with data collection over this period. Matthew Neufeld and Matthew Corsi, along with several anonymous reviewers, provided reviews which improved this manuscript.
-
Capture and handling of Kootenay White Sturgeon within the USA was conducted under permit PER0010212 or a previous version from the US Fish and Wildlife Service. Work performed in Canada was conducted under permit #24-PPAC-00005 from Fisheries and Oceans Canada.
-
The authors confirm contribution to the paper as follows: study conception and design: Stephenson SM; data collection: Stephenson SM, McGregor AE, Smith TW, Jensen NR; analysis and interpretation of results: Stephenson SM, Usvyatsov S; draft manuscript preparation: Stephenson SM, Usvyatsov S, Wilson SM, Smith TW, Bassett MC, McGregor AE, Jensen NR. All authors reviewed the results and approved the final version of the manuscript.
-
The data that support the findings of this study are available on request from the corresponding author.
-
The authors declare that they have no conflicts of interest.
- This is an open access article under the terms of the Creative Commons Attribution License, which permits use, distribution and reproduction in any medium, provided the original work is properly cited.
-
About this article
Cite this article
Stephenson SM, Usvyatsov S, Wilson SM, Smith TW, McGregor AE, et al. 2026. Spawning intervals, timing, and habitat use of endangered Kootenay White Sturgeon (Acipenser transmontanus). Journal of Applied Ichthyology 2026: e007 doi: 10.48130/jai-0026-0009 

Spawning intervals, timing, and habitat use of endangered Kootenay White Sturgeon (Acipenser transmontanus)
- Received: 30 May 2026
- Revised: 28 July 2026
- Accepted: 25 August 2026
- Published online: 23 September 2026
Abstract: Long-lived, slow-maturing species like White Sturgeon (Acipenser transmontanus) are especially vulnerable to changes in recruitment, making long-term data critical for understanding their life history. Listed as Vulnerable by the IUCN, and with many populations, including the Kootenay River population, receiving federal protection, this species faces conservation challenges compounded by generation times exceeding 30 years. Yet, fundamental aspects of their reproductive behavior, including spawning intervals and spawn habitat use, remain poorly understood. This study draws on over 20 years of passive acoustic telemetry data from more than 200 spawning females in the Kootenay River. Females spent a median of 24 d in the spawning area, longer than previously reported, highlighting the importance of extended habitat availability during this period. Water temperature, particularly the rate of change, played a key role in modulating this residency time, with faster increases in temperature associated with shorter stays. Spawning intervals were also shorter than previously documented, with a median interval of three years (range: 2−7 years). Notably, most females spent their non-spawning years in Kootenay Lake, more than 110 river km downstream, yet time spent in the lake did not predict the length of spawn intervals. These findings offer valuable insights into the spatial and temporal dynamics of White Sturgeon reproduction. They have direct implications for water management during critical spawning windows and for the protection of habitats essential for spawning females between spawning events. As the Kootenay River's wild population continues to age and hatchery-raised fish reach maturity, understanding this system will remain vital for conserving this iconic species.
-
Key words:
- White sturgeon /
- Spawning interval /
- Habitat use /
- Spawn timing