-
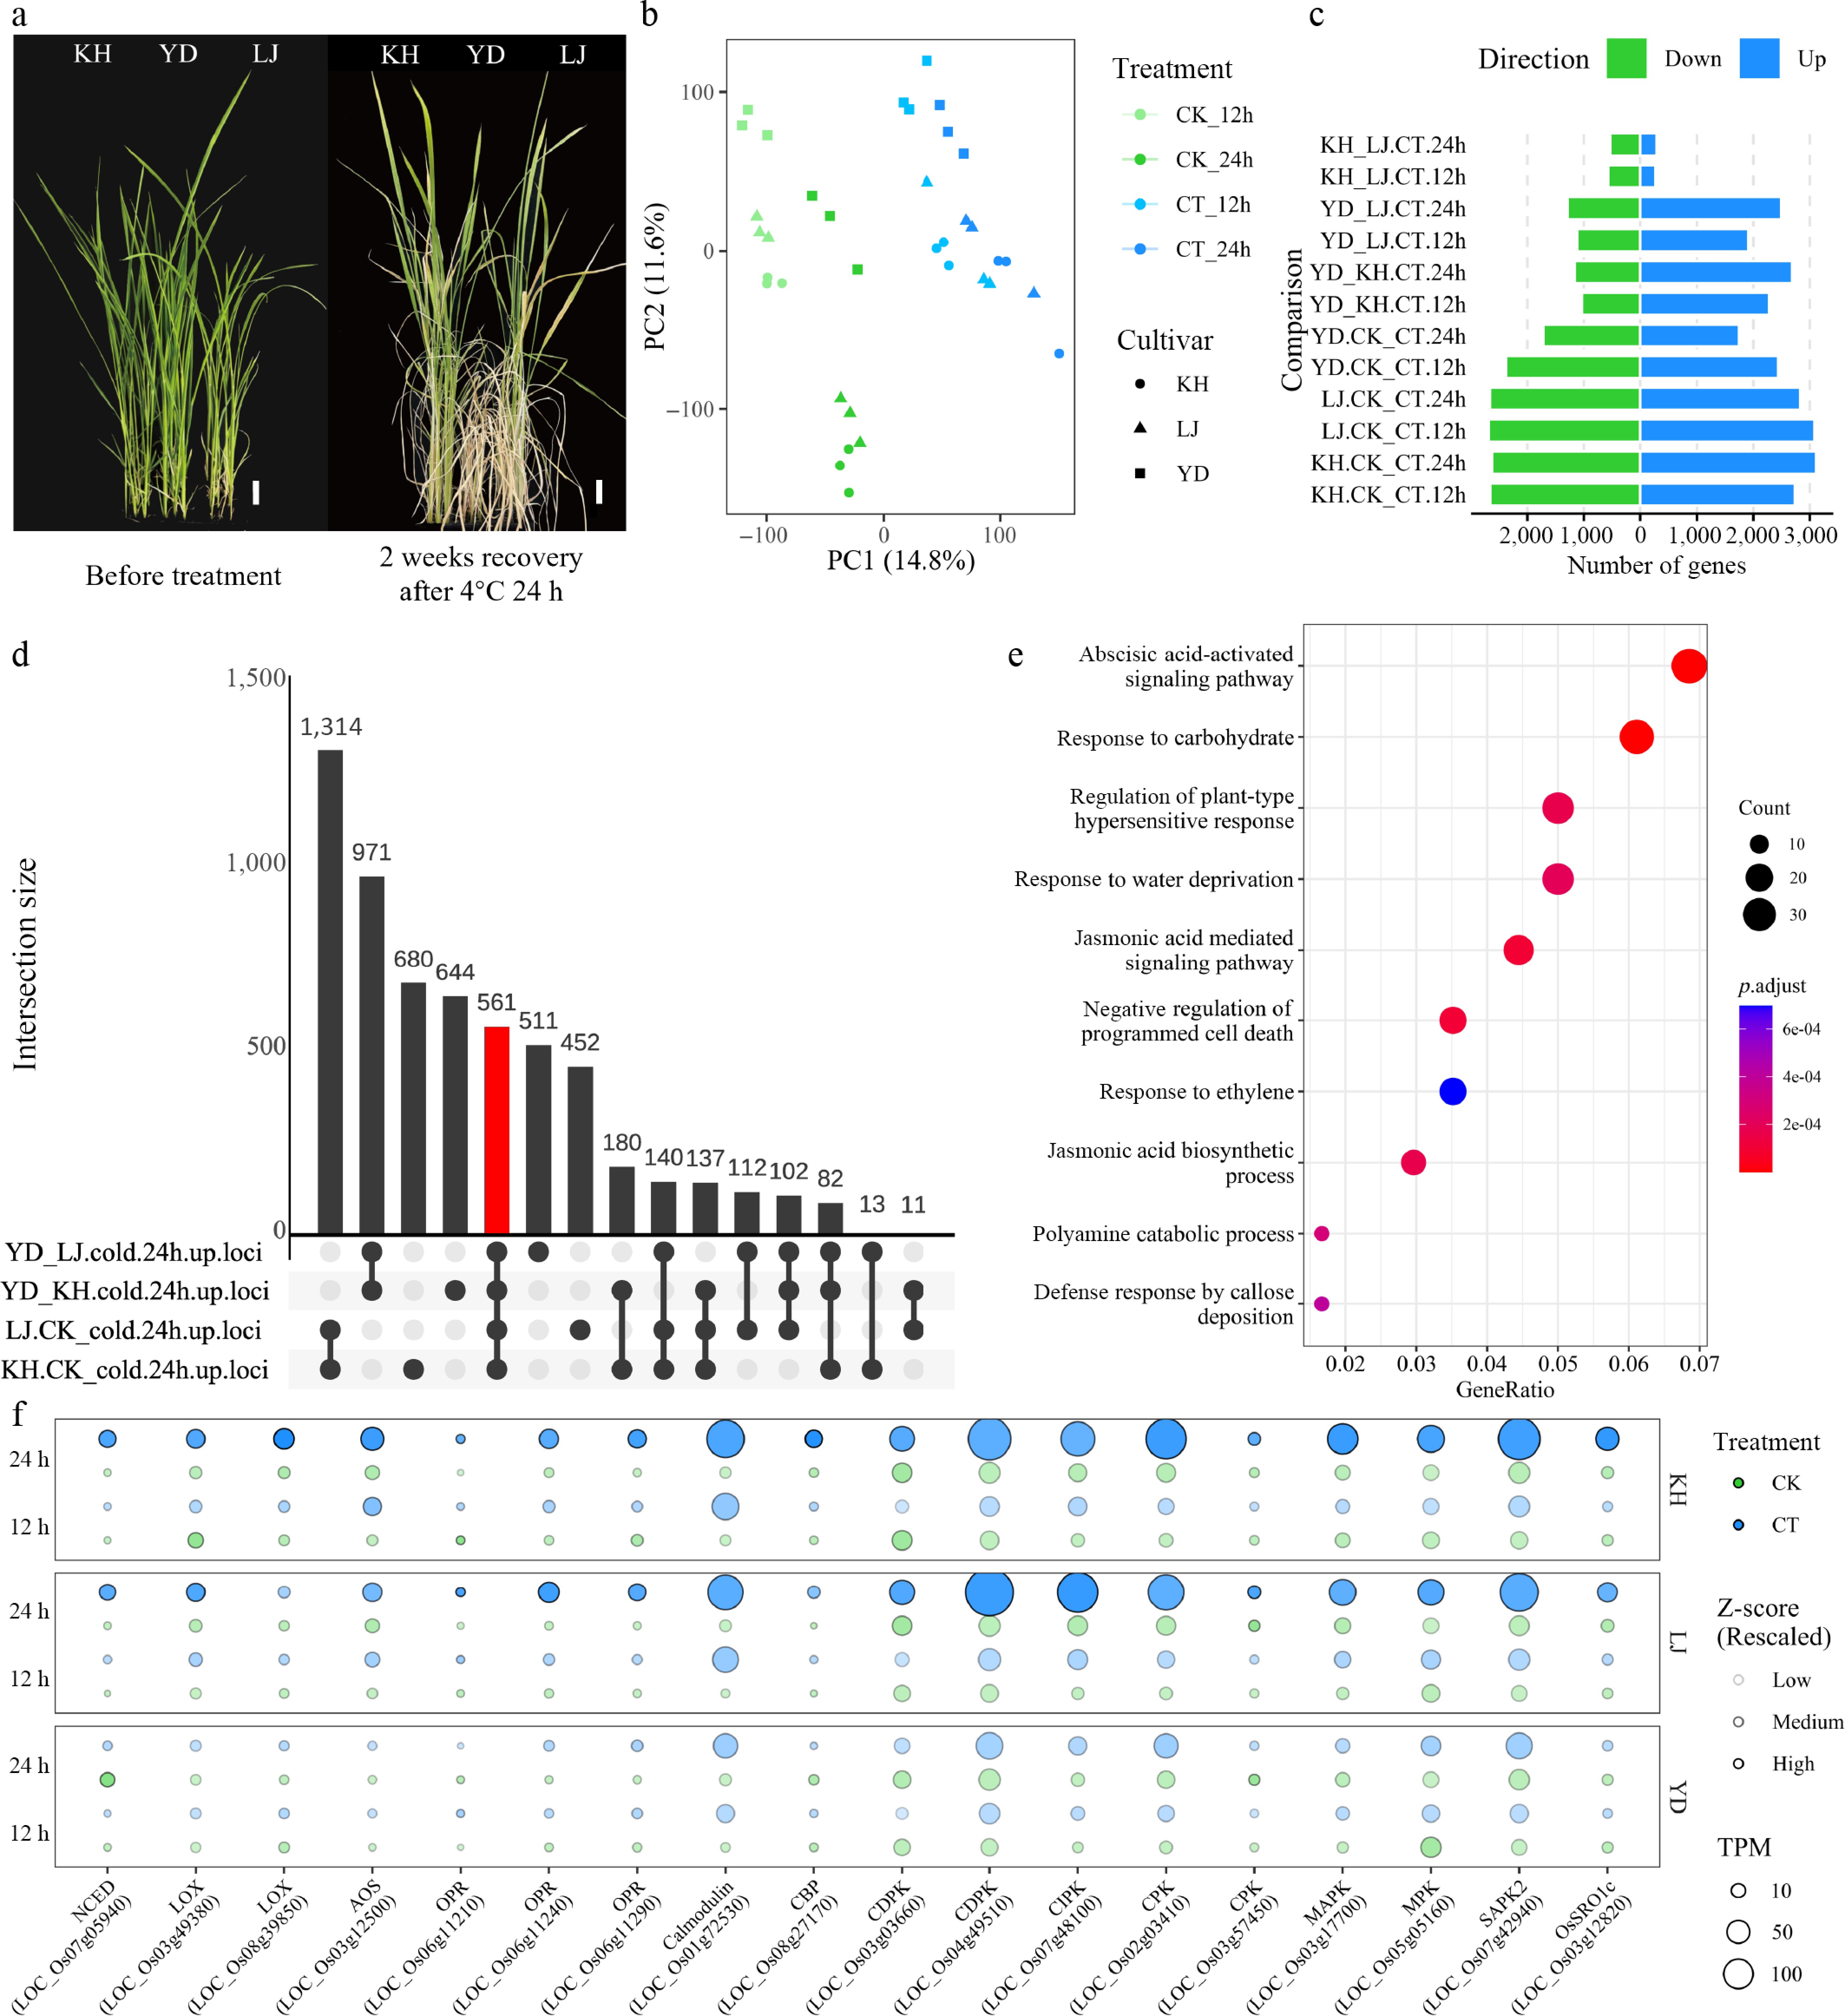
Figure 1.
Cold transcriptional responses of the three rice varieties. (a) Cold treatment phenotypes of the three rice varieties; the white scale bar represents 2 cm. (b) Principal component analysis (PCA) of the RNA-seq data. (c) Statistics of differentially expressed genes (DEGs). (d) Overlap analysis of DEGs at the 24 h time point. (e) Gene ontology (GO) enrichment analysis of genes with higher expression in KH and LJ compared to YD at the 24 h time point. (f) Selected cold-induced genes with higher expression in KH and LJ compared to YD.
-
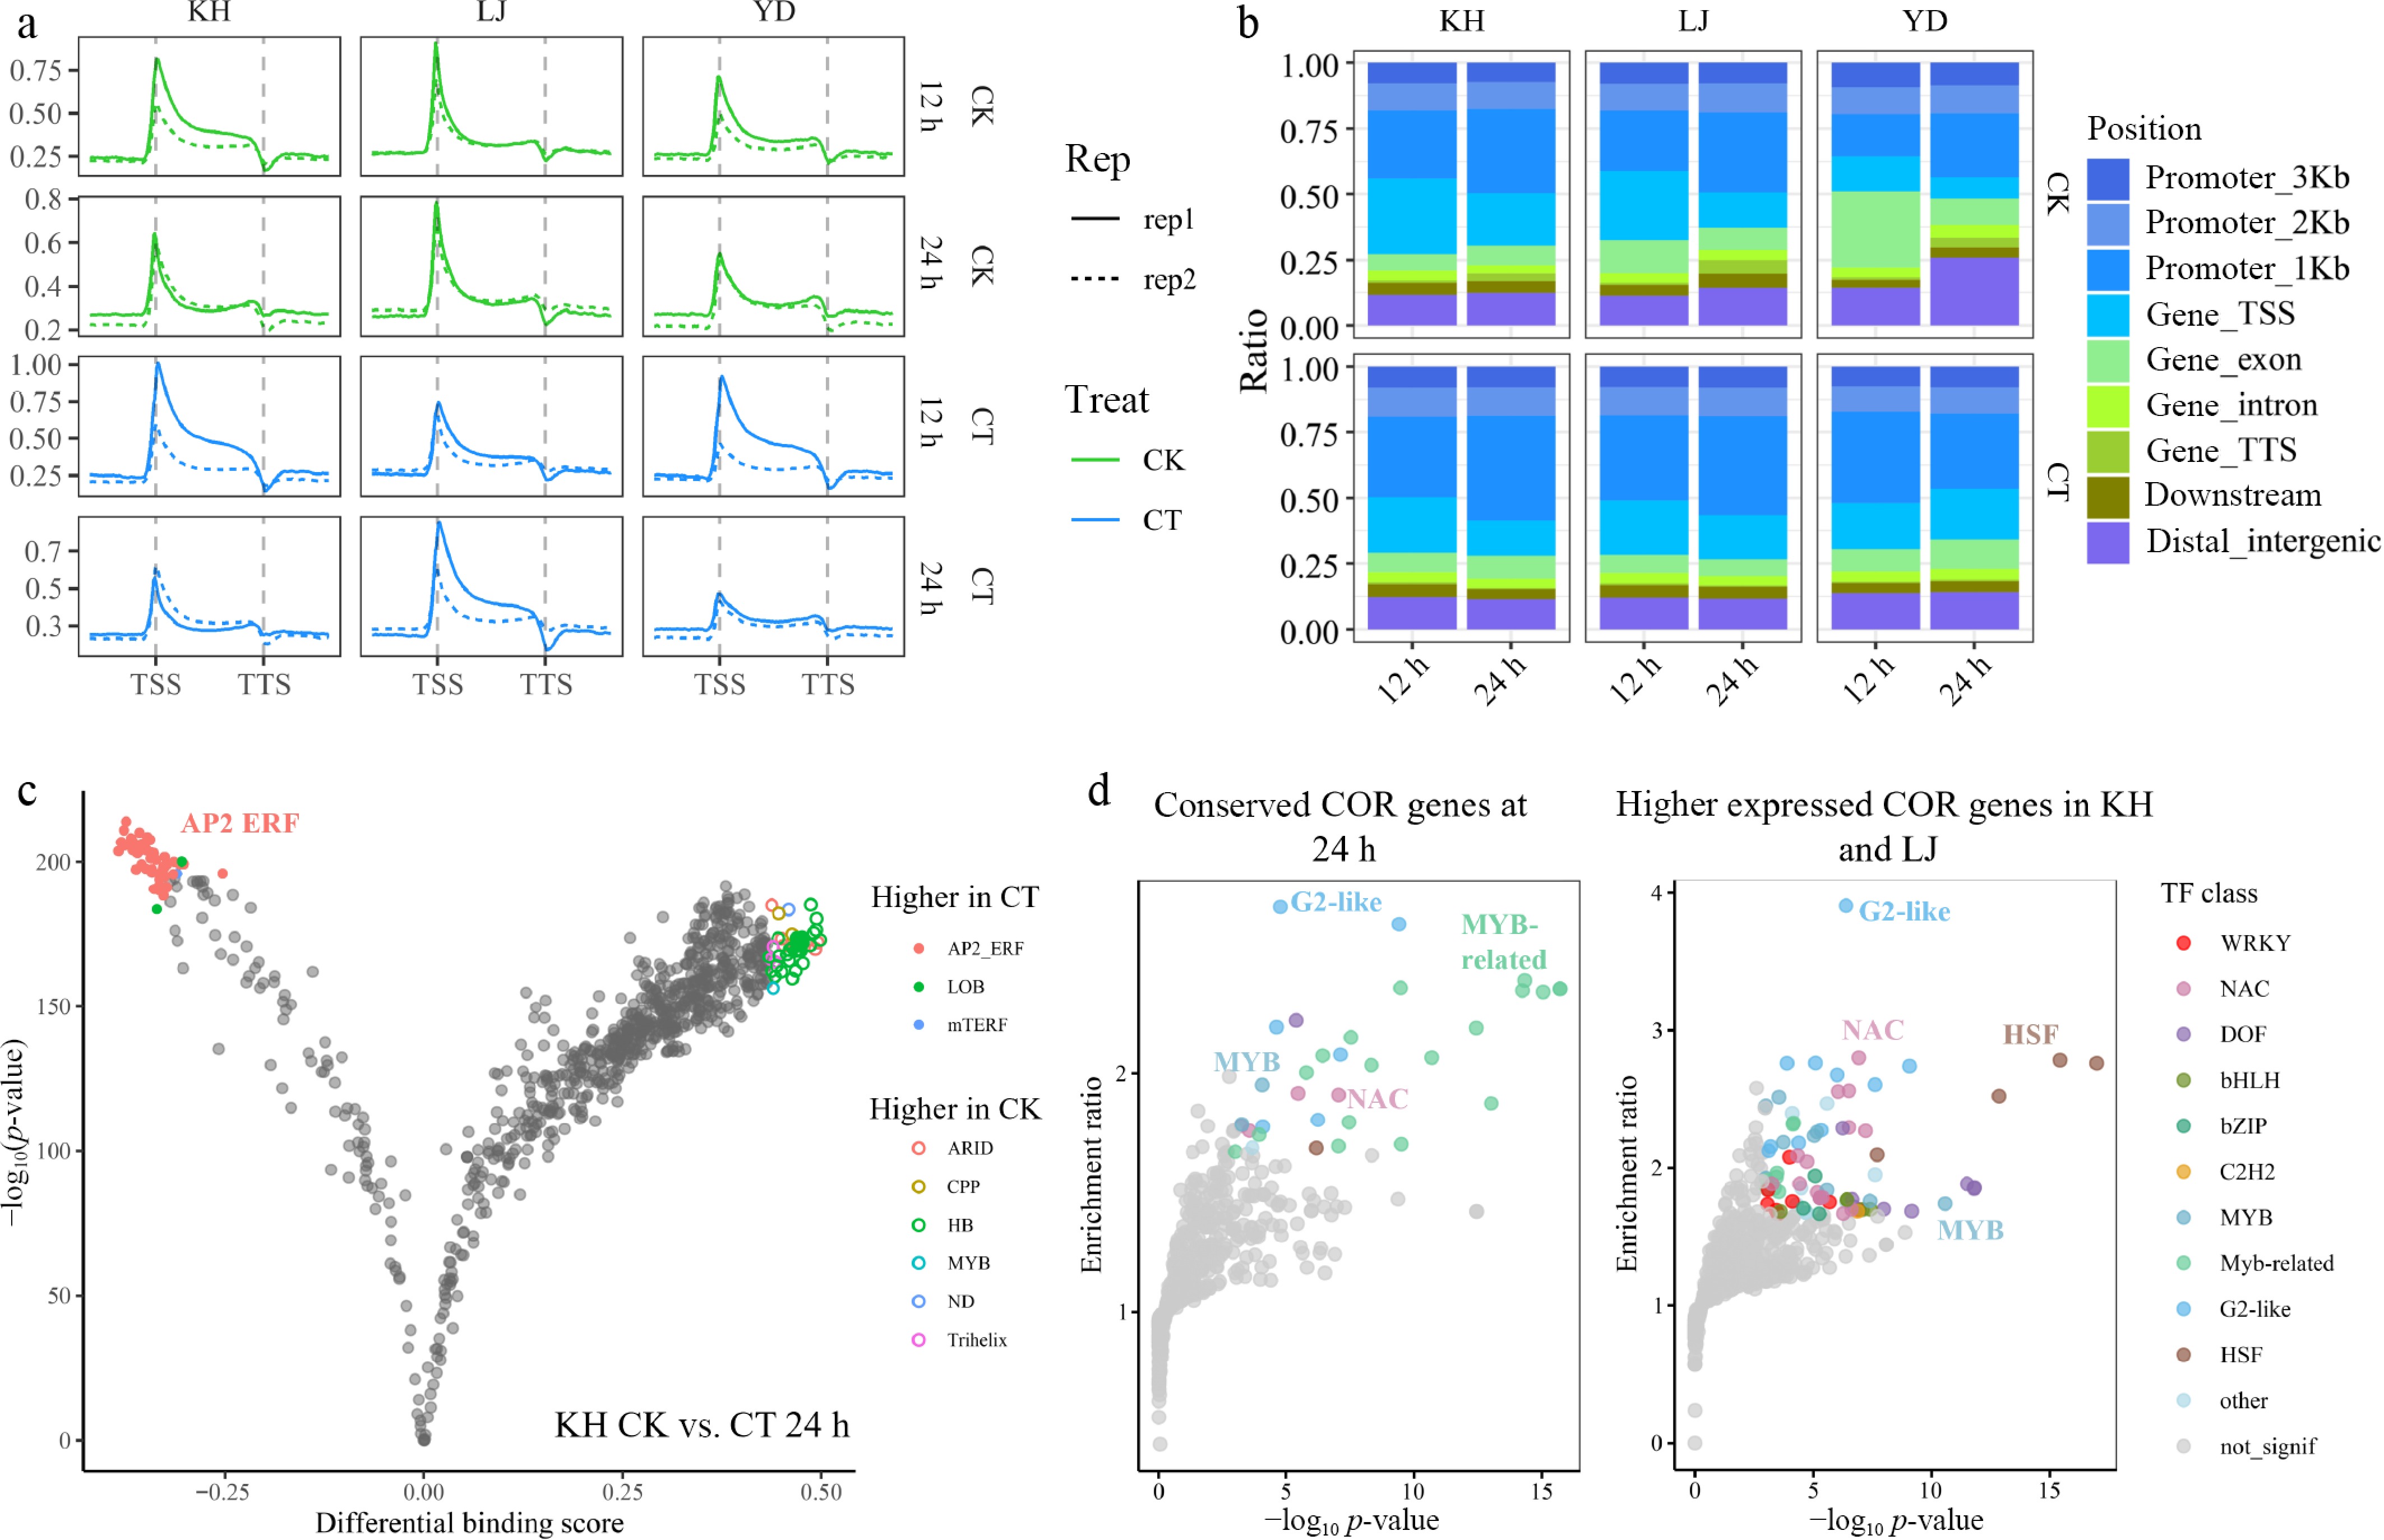
Figure 2.
Chromatin accessibility and transcription factor binding motif enrichment analysis. (a) Distribution of DNase-seq data relative to gene structures. (b) Distribution of chromatin accessibility signals relative to gene structures. (c) TOBIAS TF footprinting analysis of ACRs in KH at the 24 h time point; the differential binding score in TOBIAS is a normalized statistic summarizing the overall footprint score change of a TF's motifs between two conditions relative to background. (d) TF binding motif enrichment analysis in the promoter ACRs of DEGs: the enrichment ratio is defined as the proportion of transcription factor footprints present in promoter-associated ACRs of a specific gene set divided by that in all promoter-associated ACRs.
-
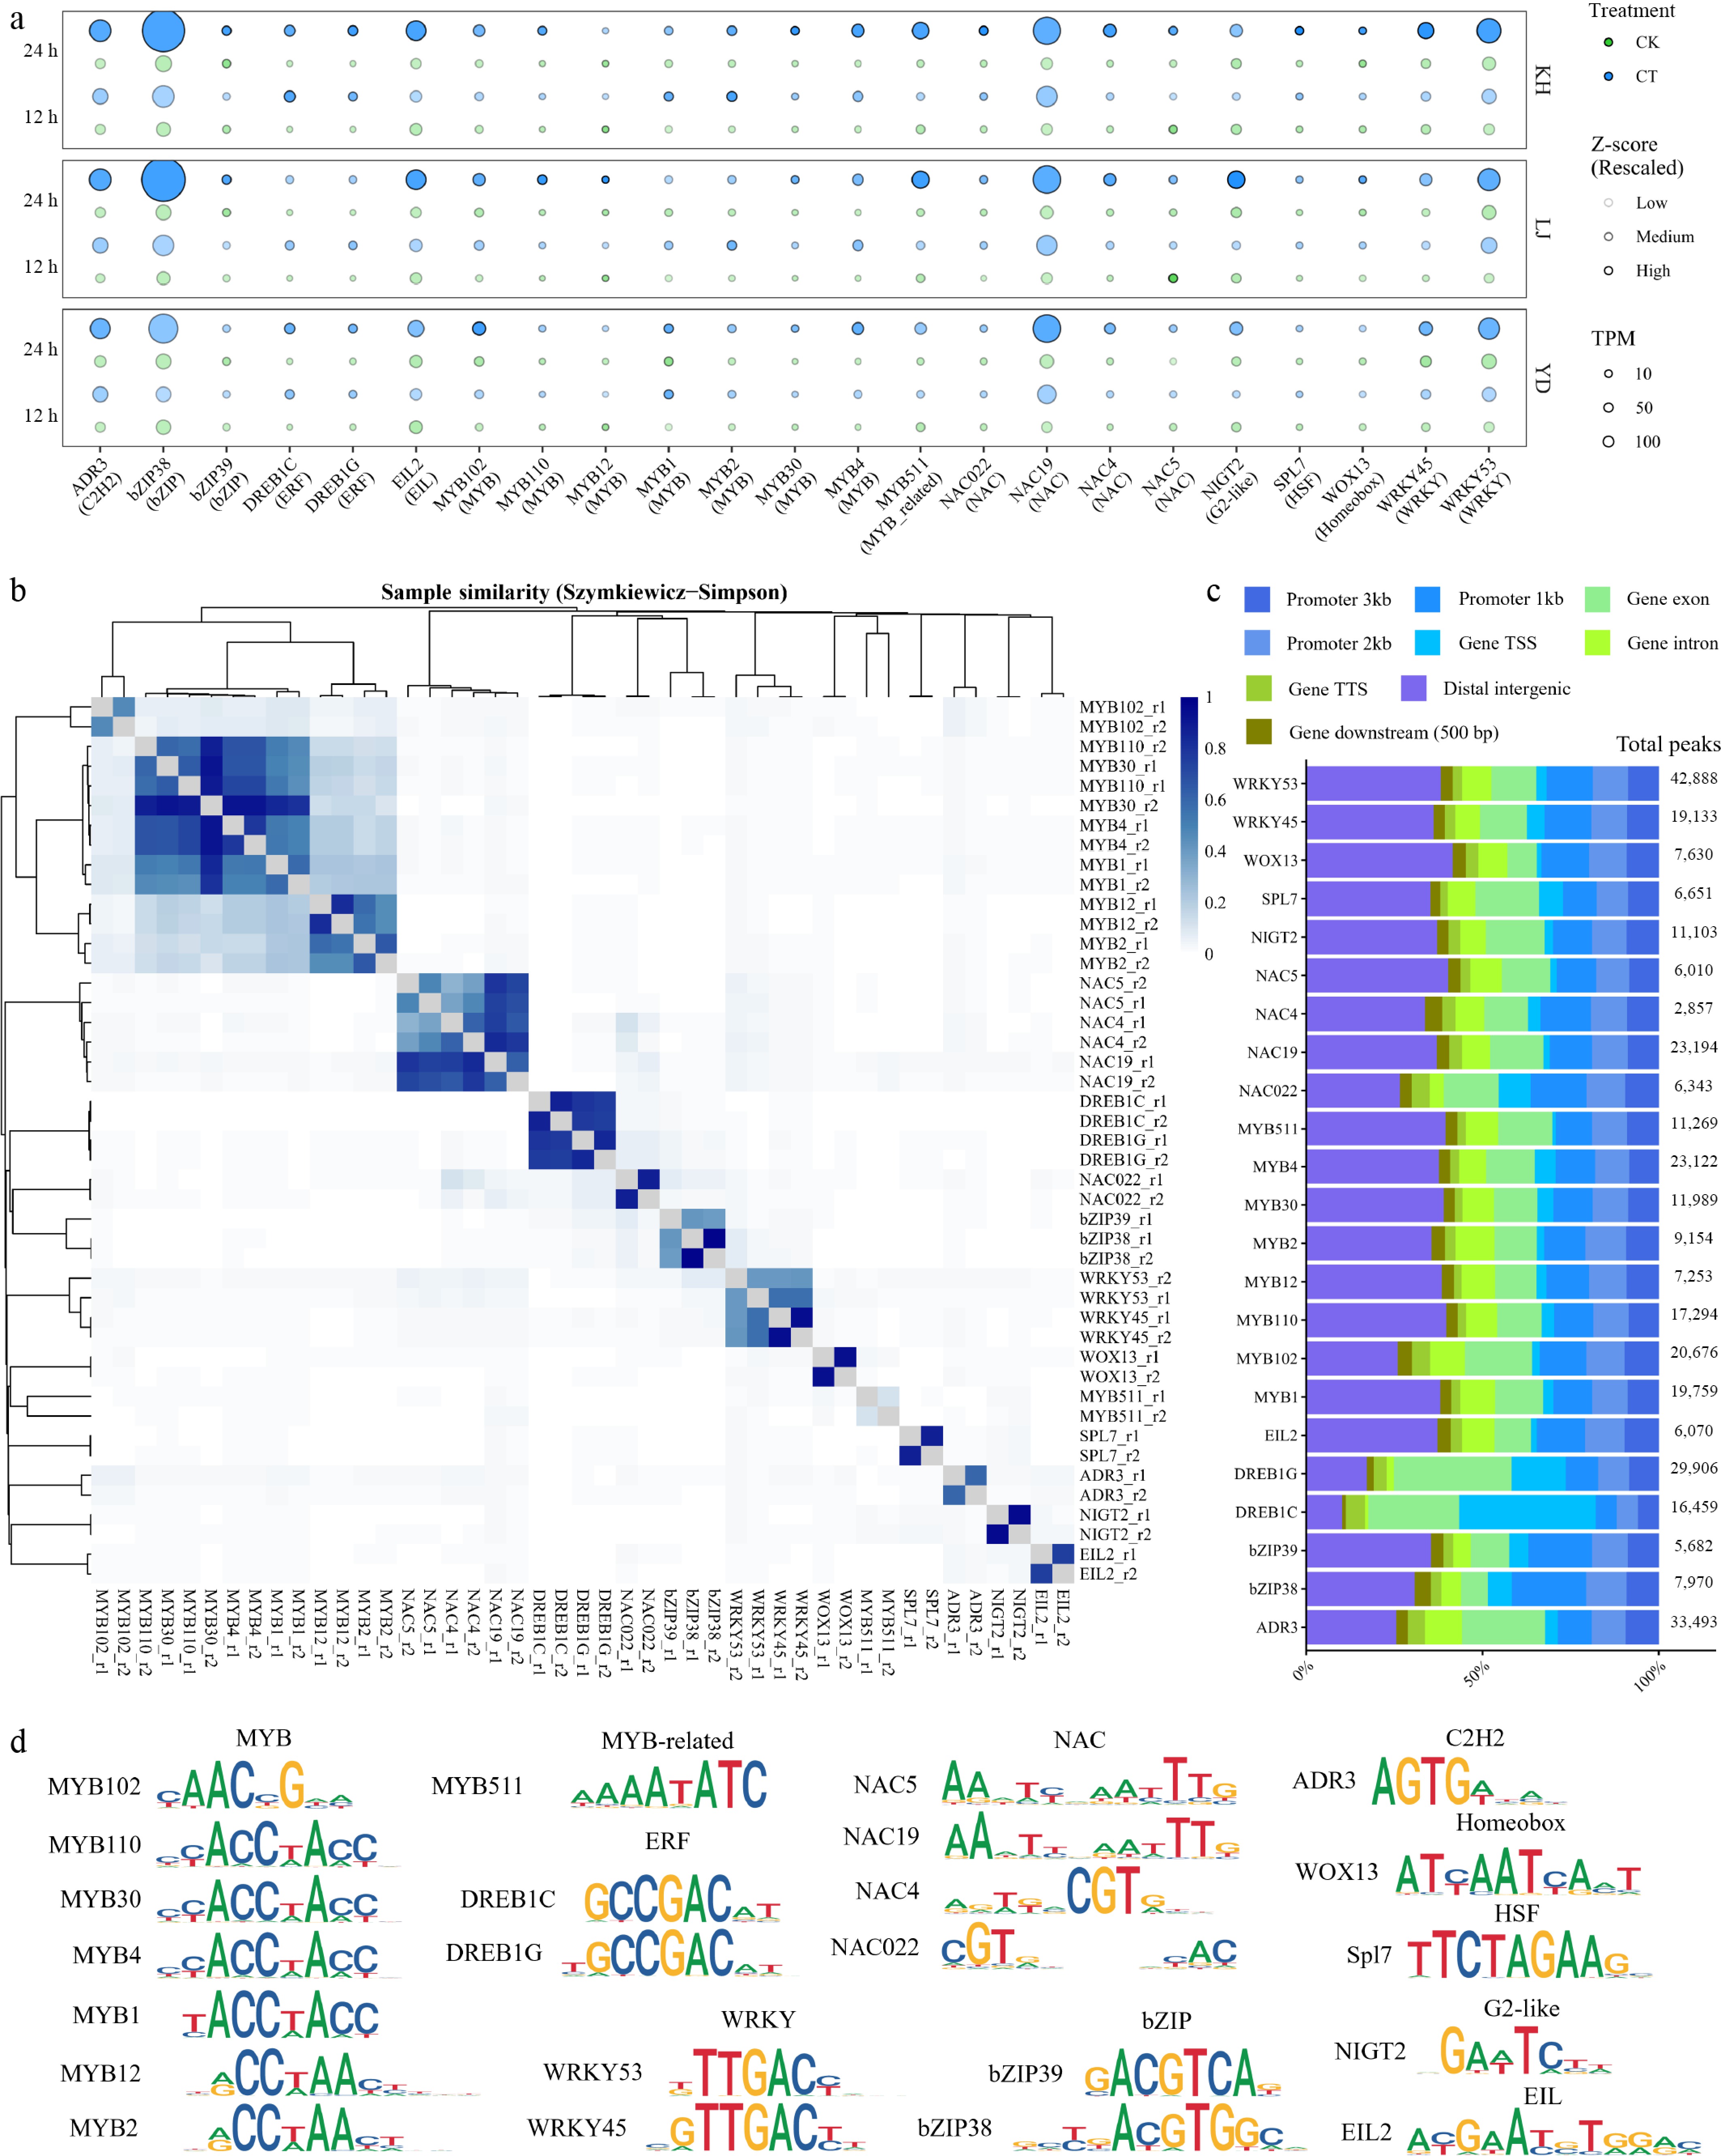
Figure 3.
DAP-seq data analysis of 23 cold-induced transcription factors. (a) Expression profiles of the 23 cold-induced transcription factors. (b) Clustering of DAP-seq sample signals based on the overlap (Szymkiewicz–Simpson) coefficient. (c) Number of peaks in DAP-seq samples and their distribution relative to gene structures. (d) TF motif enrichment analysis based on DAP-seq signals; the most significant motif identified through de novo prediction is used as the representative motif for the TF.
-
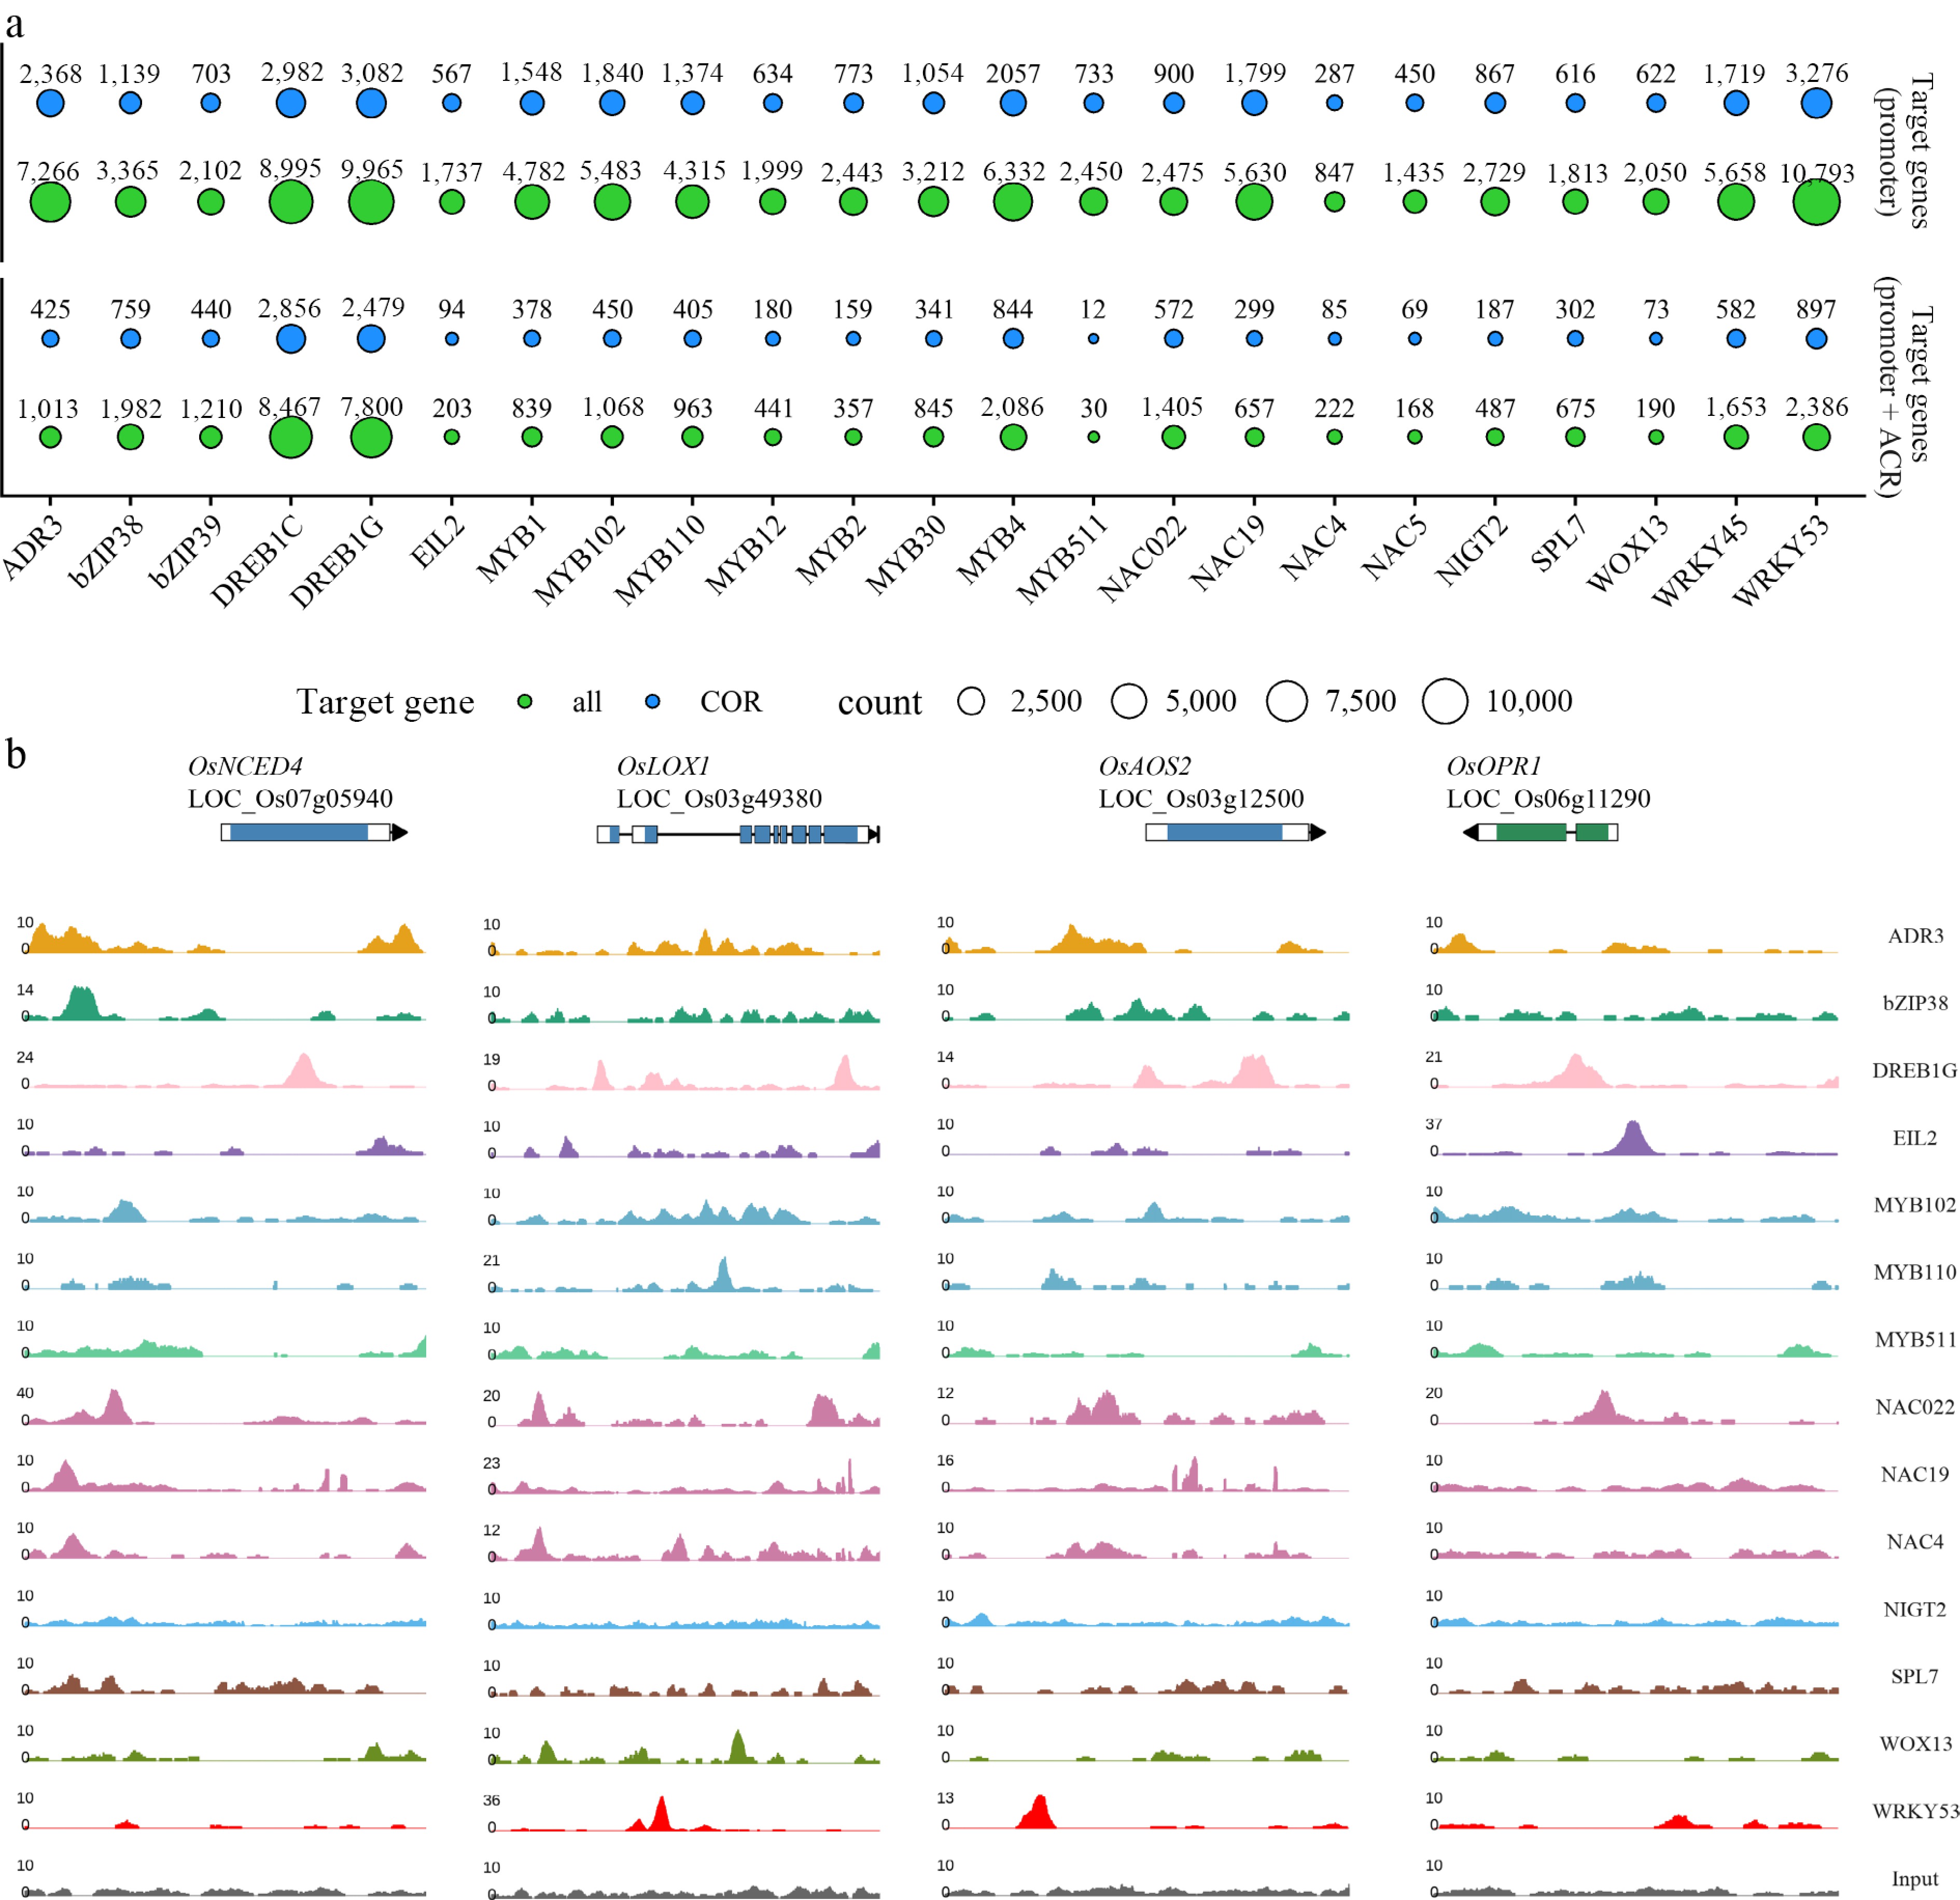
Figure 4.
DAP-seq defines potential TF-target gene regulatory relationships. (a) Number of potential target genes for each TF defined by DAP-seq and DNase-seq. The top panel shows the number of target genes defined by promoters containing DAP-seq signals, while the bottom panel shows the number of target genes defined by promoters containing overlapping signals from both DAP-seq and DNase-seq. (b) In vitro binding of TFs to the promoters of stress-related genes; the different colored tracks represent distinct transcription factor families.
-
Locus ID TF family Symbol DAP-seq data source LOC_Os05g03860 bZIP bZIP38 This study LOC_Os05g34050 bZIP bZIP39 [27] LOC_Os03g55540 C2H2 ADR3 This study LOC_Os07g48630 EIL EIL2 This study LOC_Os02g45450 ERF DREB1G This study LOC_Os06g03670 ERF DREB1C [28] LOC_Os07g02800 G2-like NIGT2 [26] LOC_Os01g60270 Homeobox WOX13 This study LOC_Os05g45410 HSF SPL7 This study LOC_Os11g10130 MYB MYB1 This study LOC_Os06g43090 MYB MYB102 This study LOC_Os10g33810 MYB MYB110 This study LOC_Os11g45740 MYB MYB12 This study LOC_Os03g20090 MYB MYB2 This study LOC_Os02g41510 MYB MYB30 This study LOC_Os04g43680 MYB MYB4 This study LOC_Os04g49450 MYB-related MYB511 This study LOC_Os03g04070 NAC NAC022 This study LOC_Os03g60080 NAC NAC19 This study LOC_Os01g60020 NAC NAC4 This study LOC_Os11g08210 NAC NAC5 This study LOC_Os05g27730 WRKY WRKY53 This study LOC_Os05g25770 WRKY WRKY45 This study Table 1.
Transcription factor genes used for DAP-seq in this study.
Figures
(4)
Tables
(1)