











-
Rice (Oryza sativa L.) is a staple crop that originated in the subtropics, and low temperatures at the seedling and booting stages severely affect its growth, development, and yield[1]. During its spread to higher latitudes and altitudes, the japonica subspecies acquired tolerance to low temperatures[2]. The low-temperature tolerance of rice is associated with the expression of a set of stress-related genes, and their transcriptional regulatory mechanisms are an important direction in research on rice cold tolerance[1]. CBF transcription factors (TFs) of the AP2/ERF family are considered core TFs in plant cold responses and have undergone complex convergent evolution and regulatory innovations in angiosperms to adapt to global climate changes[3,4]. However, CBF transcription factors may directly participate in the transcriptional regulation of only 10% to 20% of COR genes; many other TFs likely act as parallel regulators in controlling COR genes[5], necessitating a more comprehensive exploration of TF binding landscapes in cold-induced transcriptional regulation studies. For many cold-regulated (COR) genes, it remains unclear how many TFs are involved in their regulation and where their regulatory sequences are located. This question has not yet been comprehensively resolved. High-throughput sequencing-based transcriptional regulatory omics technologies, such as Assay for Transposase-Accessible Chromatin using Sequencing (ATAC-seq), DNase I Hypersensitive Sites Sequencing (DNase-seq), Chromatin Immunoprecipitation Sequencing (ChIP-seq), and DNA Affinity Purification sequencing (DAP-seq), make it possible to comprehensively decipher the transcriptional regulatory landscape in plants[6,7]. In this study, we selected three representative rice varieties: the cold-sensitive indica variety Yangdao 6 (YD, also known as 93−11), the high-latitude japonica variety Koshihikari (KH), and the high-altitude japonica variety Lijiangxintuanheigu (LJ) with relatively strong cold tolerance. Through low-temperature treatment at the seedling stage, as well as transcriptomic and chromatin accessibility analyses, we identified cold-regulated genes and clues related to their transcriptional regulation. A set of cold-responsive TFs was screened, and their genome-wide binding landscapes were mapped using DAP-seq, establishing potential regulatory relationships between TFs and COR genes. The data and insights generated here provide valuable reference information for further dissecting the molecular mechanisms of rice cold tolerance and for cis-engineering-based breeding via genome editing.
-
Three-leaf-stage seedlings of rice varieties KH, LJ, and YD were placed in artificial climate chambers at 4 °C (CT) and 28 °C (CK) (14-h light/10-h dark photoperiod, 65% relative humidity). Samples were harvested at 12 and 24 h time points, and DNA and RNA were extracted for subsequent RNA-seq and DNase-seq library preparation.
RNA-seq
-
Three biological replicates were included at each time point and treatment for each sample, with leaves collected from three rice seedlings per replicate for RNA extraction, library construction, and sequencing. RNA extraction and library preparation were performed following previously established protocols[6]. Sequencing was performed on an Illumina NovaSeq 6000 in PE150 mode. Quality control was performed using fastp (v0.20.1)[8]. The sequencing reads were aligned to the Nipponbare (NPB) reference genome[9] using HISAT2 (v2.2.1)[10], and SAMtools (v1.7)[11] was used for alignment quality filtering, sorting, and sequencing depth calculation. Gene expression was quantified using StringTie (v2.2.1)[12], and differential expression analysis was performed using the R package DESeq2 (v1.36.0)[13].
DNase-seq
-
For each sample at each time point and treatment, two biological replicates were included. For each replicate, leaves from three rice seedlings were pooled for nuclei isolation and DNase-seq library preparation. Nuclei isolation was performed according to our previous study[6]. Briefly, 2 g of rice leaf powder was added to 40 mL nucleus extraction buffer (0.25 M sucrose, 1% Triton X-100, 1 × protease inhibitor in 1 × PBS, pH 7.5) and incubated at 4 °C for 15 min. The sediment was collected after centrifugation and then washed twice with nucleus extraction buffer. The sediment was treated with 0.5 U DNase (Cyanase, RiboSolutions) at 37 °C for 3 min, and the digested DNA was separated and recovered by electrophoresis. The purified DNA was then used to create sequencing libraries with an Illumina TruSeq kit. Two biological replicates were prepared for each tissue. Sequencing was performed on an Illumina NovaSeq 6000 in PE150 mode.
Quality control was performed using fastp. The sequencing reads were aligned to the NPB reference genome using BWA-MEM2 (v2.2.1)[14]. SAMtools (v1.16) was used for alignment quality filtering, PCR duplicate removal, sorting, and sequencing depth calculation. The bamCoverage function from deepTools (v3.5.1)[15] was used to convert BAM files to bigWig format. The computeMatrix function from deepTools was used to calculate the distribution of sequencing data relative to gene structures. MACS2 (v2.2.6)[16] was used to identify accessible chromatin regions (ACRs). BEDTools (v2.30.0)[17] was used to merge the alignment results and intersect them with gene structures and other genomic features. DNase-seq samples with TSS enrichment score > 1.5, peak number > 5,000, and FRiP (Fraction of Reads in Peaks) > 0.02 were retained for subsequent analysis. ACRs supported by at least three DNase-seq samples were used for further analysis. Footprinting analysis was performed using TOBIAS (v0.13.2)[18] with the parameters -read-shift 0 0 and -k_flank 6 in the biasprocess with the TOBIAS ATACorrect tool. Motif prediction and enrichment analysis were performed using the fimo tool (v4.12.0) from the MEME suite, in combination with the JASPAR TF binding motif database (2024 version)[19]. Data visualization was performed with the R package ggplot2.
DAP-seq
-
Total RNA isolated from the rice reference cultivar NPB was used as a template for cDNA synthesis and subsequent cloning of the target TFs. Genomic DNA (gDNA) was extracted from NPB rice seedlings using the CTAB method. gDNA was fragmented to about 200 bp by sonication. DAP-seq libraries were prepared as described in previous studies[20,21]. Two biological replicates were sequenced for each experiment. Sequencing was performed on an Illumina NovaSeq 6000 in PE150 mode.
Quality control of raw reads was performed using fastp. The clean reads were then aligned to NPB reference genomes using BWA-MEM2 with default parameters. The mapping results were transformed, sorted, and indexed using SAMtools. BAM files were converted to bigWig format using the bamCoverage function of deepTools. Signal peaks were called using MACS2. TF binding motif enrichment analysis was performed using HOMER (v4.11)[22]. DAP-seq samples with more than 500 peaks and an FRiP value greater than 0.02[23] were retained for subsequent analysis. For each TF, peaks detected in both DAP-seq replicates were used for HOMER motif enrichment analysis to identify their representative binding motifs. Subsequently, peaks supported by both replicates or containing the representative motif were retained for downstream analysis. Data visualization was performed with the R package ggplot2.
Gene ontology (GO) enrichment analysis
-
Rice GO annotation information was obtained from GOMAP[24]. GO enrichment analysis was performed using the R package clusterProfiler (v4.4.4)[25].
-
Seedlings of three rice cultivars with different cold sensitivity, namely Koshihikari (KH), Lijiangxintuanheigu (LJ), and Yangdao 6 (YD) were treated at normal (28 °C) and low (4 °C) temperatures for 24 h and then recovered for 2 weeks (Fig. 1a). Samples were collected from the cold-treated (CT) and control (CK) materials at two time points (12 and 24 h), followed by RNA extraction and RNA-seq. Principal component analysis (PCA) of the RNA-seq samples revealed that the first principal component separated the CT samples from the CK samples, while the second principal component primarily separated the indica variety YD from the japonica varieties KH and LJ (Fig. 1b). By analyzing the transcriptional responses to CT in the three varieties at two time points, a total of 12,346 CT-responsive differentially expressed genes (DEGs) were identified, of which 6,778 were induced by CT in at least one variety (Fig. 1c). Genes whose expression was activated or repressed (|log2 fold change| > 1) under CT are defined in this study as COR genes. The stronger cold tolerance of the two japonica varieties, KH and LJ, compared to the indica variety YD, may be associated with their transcriptional differences. Among the upregulated COR genes at 24 h, 561 exhibited significantly higher expression in KH and LJ than in YD (Fig. 1d); these genes were enriched in Gene Ontology (GO) terms related to hormone biosynthesis and signaling pathways, such as ABA, JA, and SA (Fig. 1e). A series of genes associated with ABA and JA biosynthesis, as well as stress signal transduction, were induced by CT in KH and LJ, and exhibited higher expression levels than in YD (Fig. 1f), which may be related to the differences in cold tolerance among the varieties at the seedling stage.
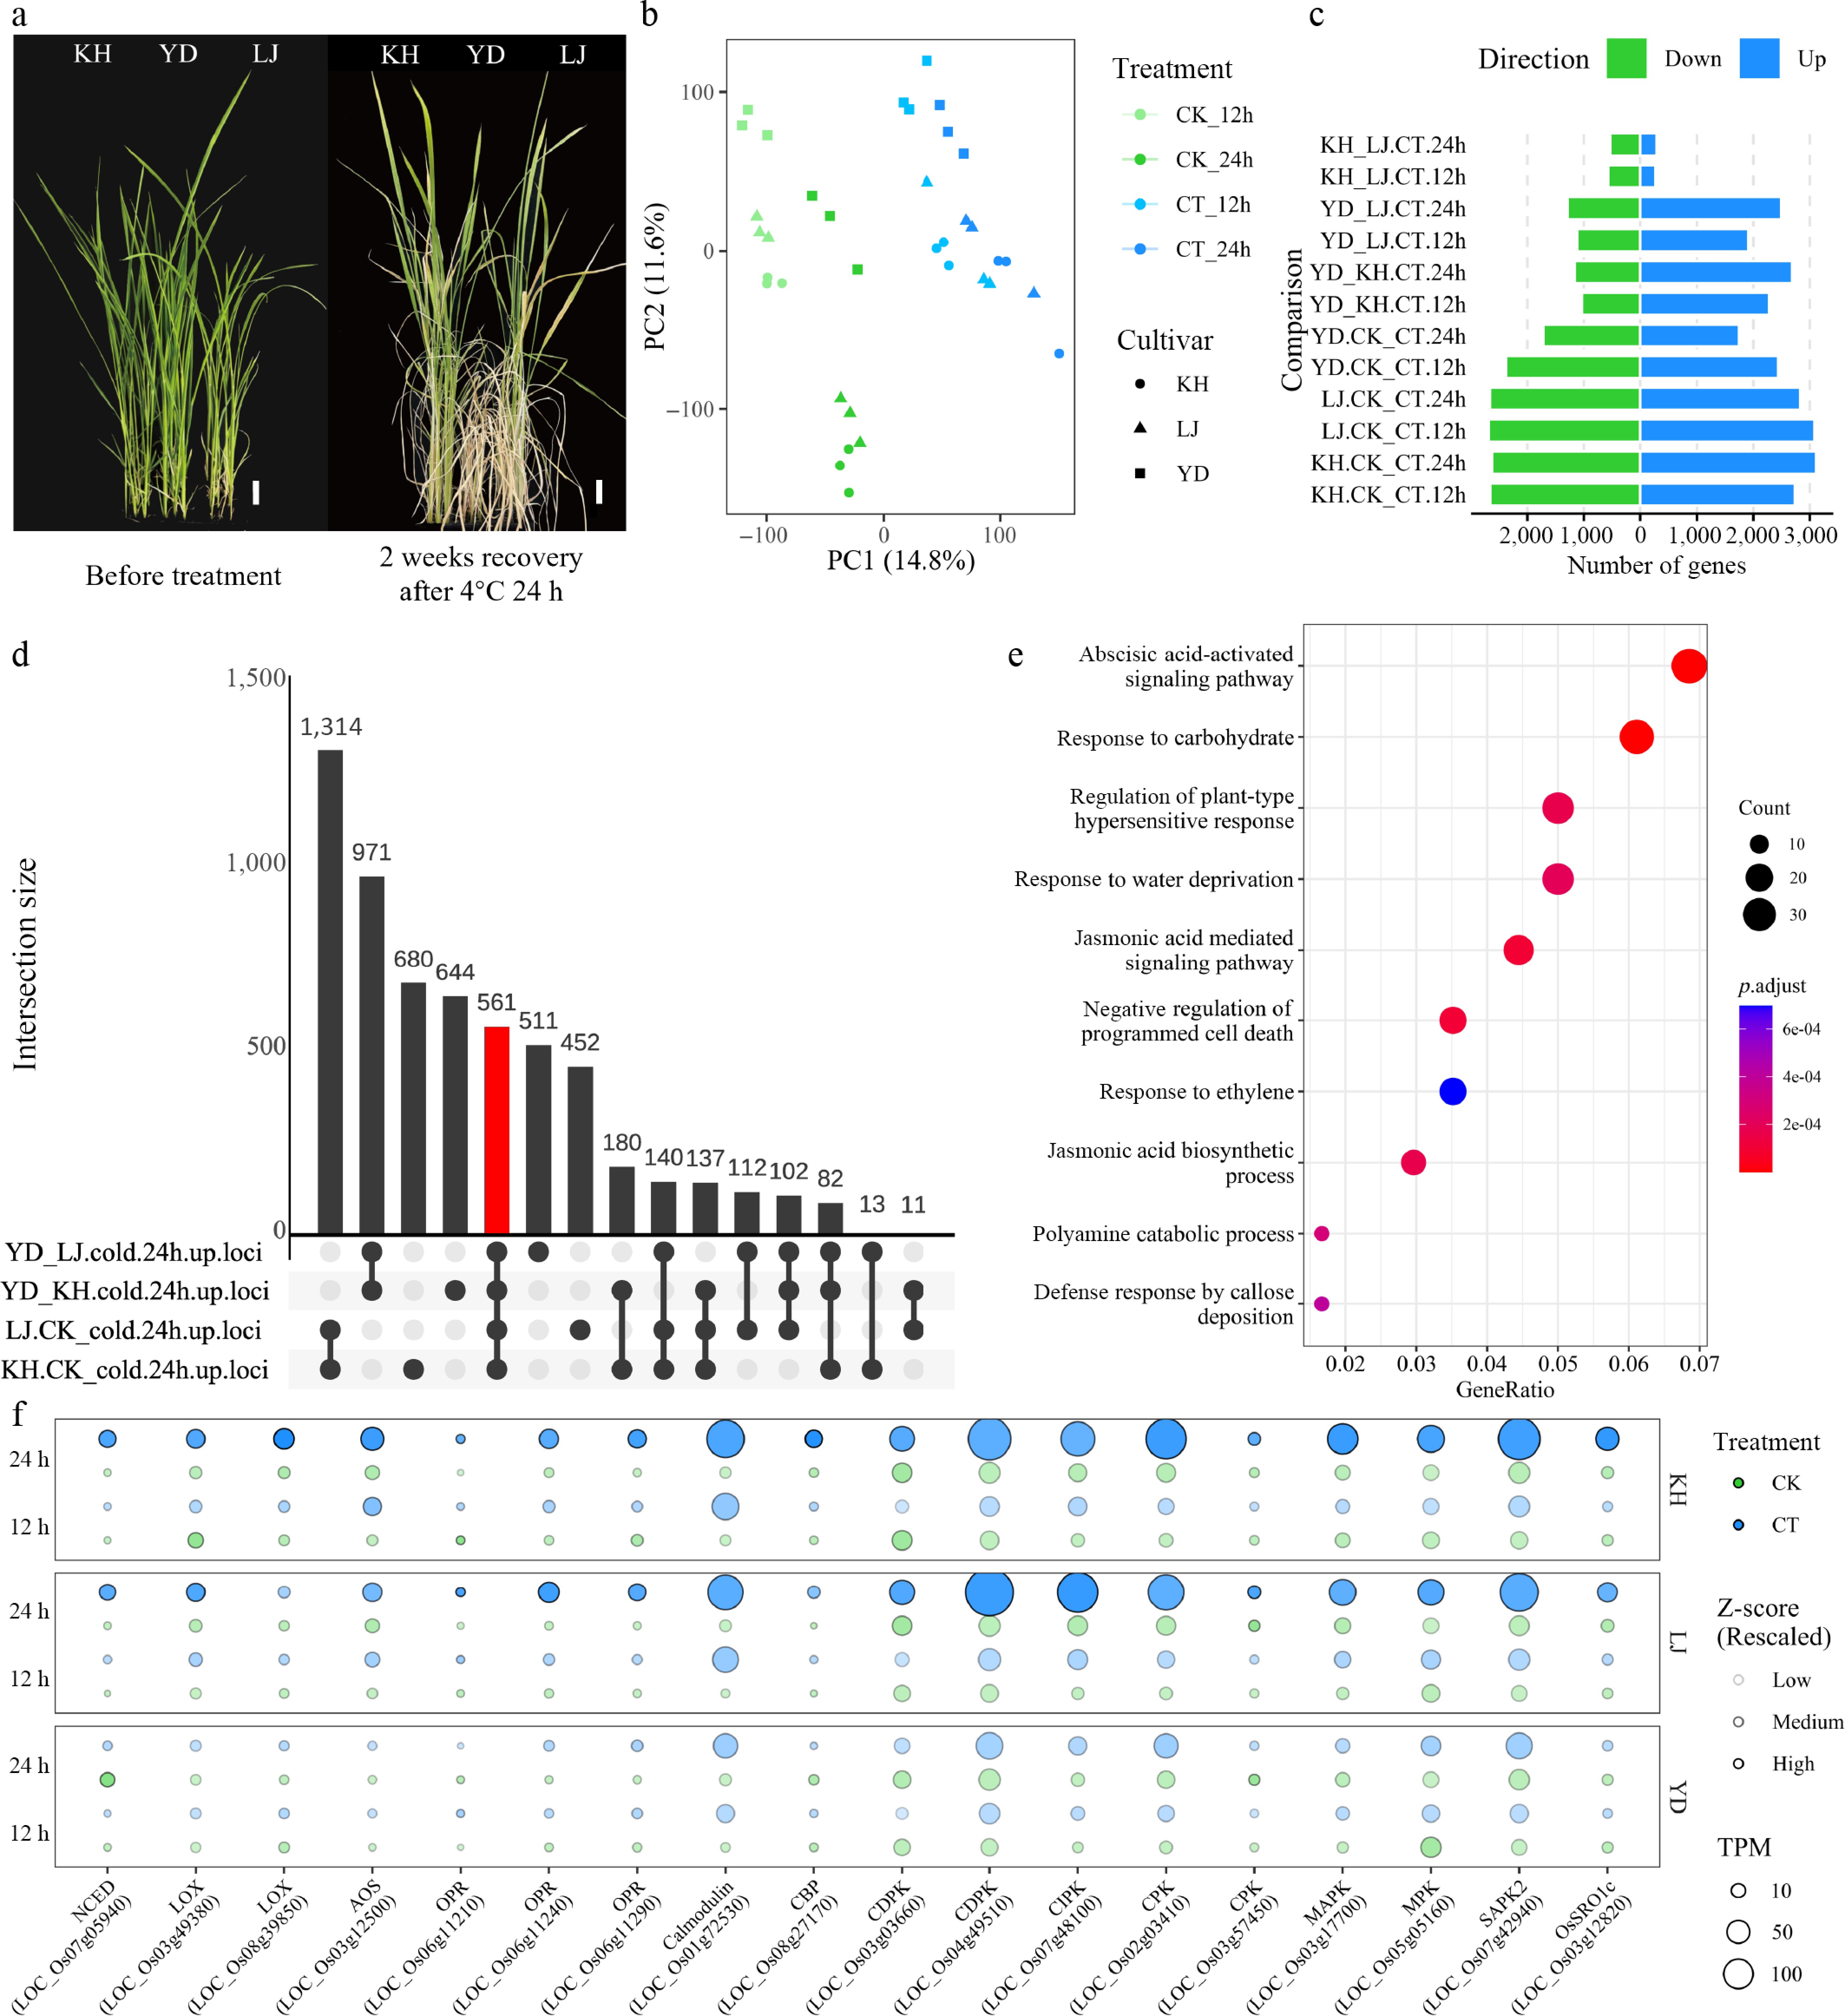
Figure 1.
Cold transcriptional responses of the three rice varieties. (a) Cold treatment phenotypes of the three rice varieties; the white scale bar represents 2 cm. (b) Principal component analysis (PCA) of the RNA-seq data. (c) Statistics of differentially expressed genes (DEGs). (d) Overlap analysis of DEGs at the 24 h time point. (e) Gene ontology (GO) enrichment analysis of genes with higher expression in KH and LJ compared to YD at the 24 h time point. (f) Selected cold-induced genes with higher expression in KH and LJ compared to YD.
Gene expression is regulated by TFs and cis-elements, with accessible chromatin often playing crucial transcriptional regulation roles. We analyzed the chromatin accessibility of the three rice varieties under CK and CT using DNase-seq. The results showed that the mapped DNase-seq reads were enriched near the transcription start sites (TSSs) of genes (Fig. 2a), consistent with the general distribution pattern of accessible chromatin regions (ACRs). The identification of ACRs using MACS2 software further confirmed their predominant distribution around TSSs and promoter regions (Fig. 2b). TOBIAS TF footprinting analysis revealed that, at the 24 h time point, the binding footprints of AP2/ERF TFs were enriched in CT compared to CK, which may be associated with the regulatory role of CBF transcription factors (Fig. 2c). Furthermore, TF binding motif enrichment analysis within the promoter ACRs of DEGs revealed that for genes induced by CT across all three varieties (KH, LJ, and YD) at the 24 h time point, their promoter ACRs were enriched with binding motifs of TF families such as MYB-related, G2-like, MYB, and NAC. For cold-induced genes that exhibited higher expression in KH and LJ than in YD at 24 h, their promoter ACRs were further enriched with binding motifs of HSF, WRKY, bZIP, and C2H2 TF families (Fig. 2d). These findings suggest that multiple TF families are involved in the cold transcriptional response in rice, particularly potentially contributing to the differential expression among varieties.
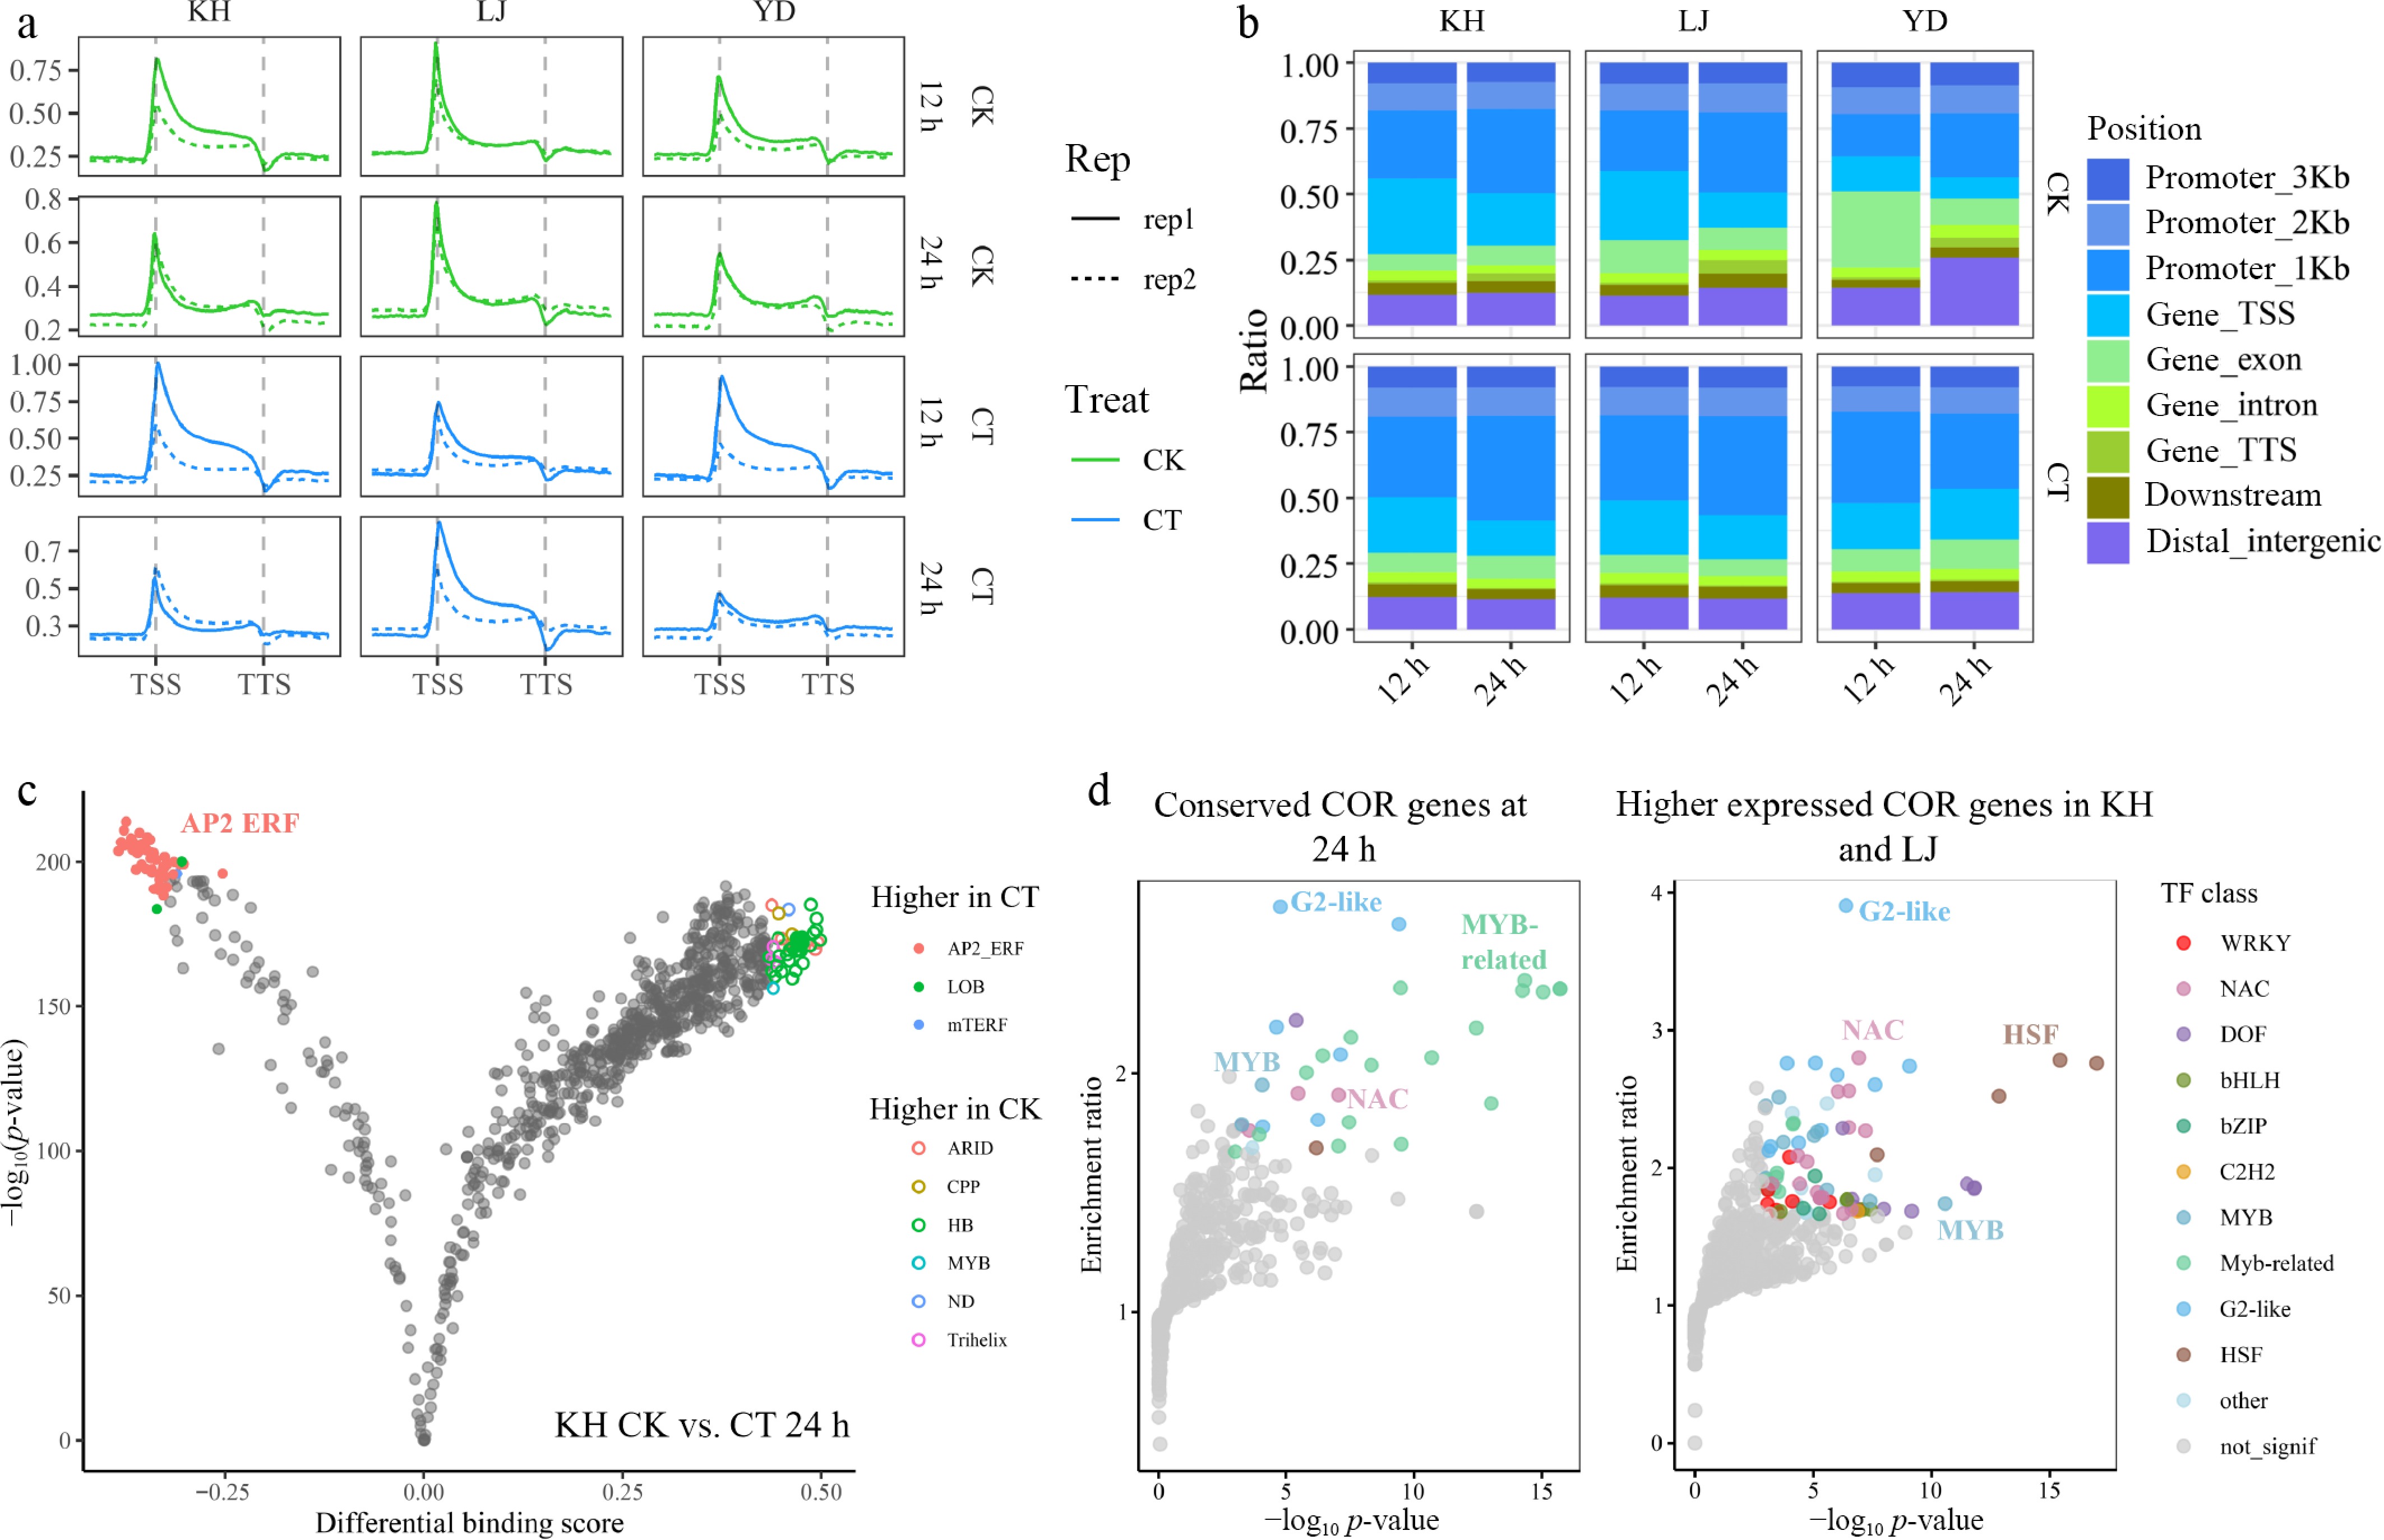
Figure 2.
Chromatin accessibility and transcription factor binding motif enrichment analysis. (a) Distribution of DNase-seq data relative to gene structures. (b) Distribution of chromatin accessibility signals relative to gene structures. (c) TOBIAS TF footprinting analysis of ACRs in KH at the 24 h time point; the differential binding score in TOBIAS is a normalized statistic summarizing the overall footprint score change of a TF's motifs between two conditions relative to background. (d) TF binding motif enrichment analysis in the promoter ACRs of DEGs: the enrichment ratio is defined as the proportion of transcription factor footprints present in promoter-associated ACRs of a specific gene set divided by that in all promoter-associated ACRs.
Integrating the DEGs and the TF binding footprint enrichment results based on accessible chromatin, we selected and performed DAP-seq experiments and analysis on 20 cold-induced TFs (Table 1; Fig. 3a). Furthermore, we selected DAP-seq data for three cold-induced transcription factor genes (DREB1C, NIGT2, and bZIP39) from published datasets[26−28] and integrated them with our newly generated data for analysis. In total, we analyzed the genome-wide binding profiles of 23 cold-induced TFs across 11 families. These TF families include ERF, WRKY, NAC, MYB, MYB-related, bZIP, EIL, C2H2, G2-like, HSF, and Homeobox. Clustering analysis of the DAP-seq signals revealed that the samples clustered clearly according to the DNA-binding properties of their respective families (Fig. 3b). The distribution of different transcription factors relative to gene structures also exhibited certain variations; notably, the CBF transcription factors DREB1C and DREB1G appeared to have a higher proportion of binding at gene and promoter regions (Fig. 3c). Transcription factor binding motif enrichment analysis demonstrated that most transcription factors were enriched for their family-specific motifs, although the binding motifs of different members within the same family also showed some variations (Fig. 3d).
Table 1. Transcription factor genes used for DAP-seq in this study.
Locus ID TF family Symbol DAP-seq data source LOC_Os05g03860 bZIP bZIP38 This study LOC_Os05g34050 bZIP bZIP39 [27] LOC_Os03g55540 C2H2 ADR3 This study LOC_Os07g48630 EIL EIL2 This study LOC_Os02g45450 ERF DREB1G This study LOC_Os06g03670 ERF DREB1C [28] LOC_Os07g02800 G2-like NIGT2 [26] LOC_Os01g60270 Homeobox WOX13 This study LOC_Os05g45410 HSF SPL7 This study LOC_Os11g10130 MYB MYB1 This study LOC_Os06g43090 MYB MYB102 This study LOC_Os10g33810 MYB MYB110 This study LOC_Os11g45740 MYB MYB12 This study LOC_Os03g20090 MYB MYB2 This study LOC_Os02g41510 MYB MYB30 This study LOC_Os04g43680 MYB MYB4 This study LOC_Os04g49450 MYB-related MYB511 This study LOC_Os03g04070 NAC NAC022 This study LOC_Os03g60080 NAC NAC19 This study LOC_Os01g60020 NAC NAC4 This study LOC_Os11g08210 NAC NAC5 This study LOC_Os05g27730 WRKY WRKY53 This study LOC_Os05g25770 WRKY WRKY45 This study 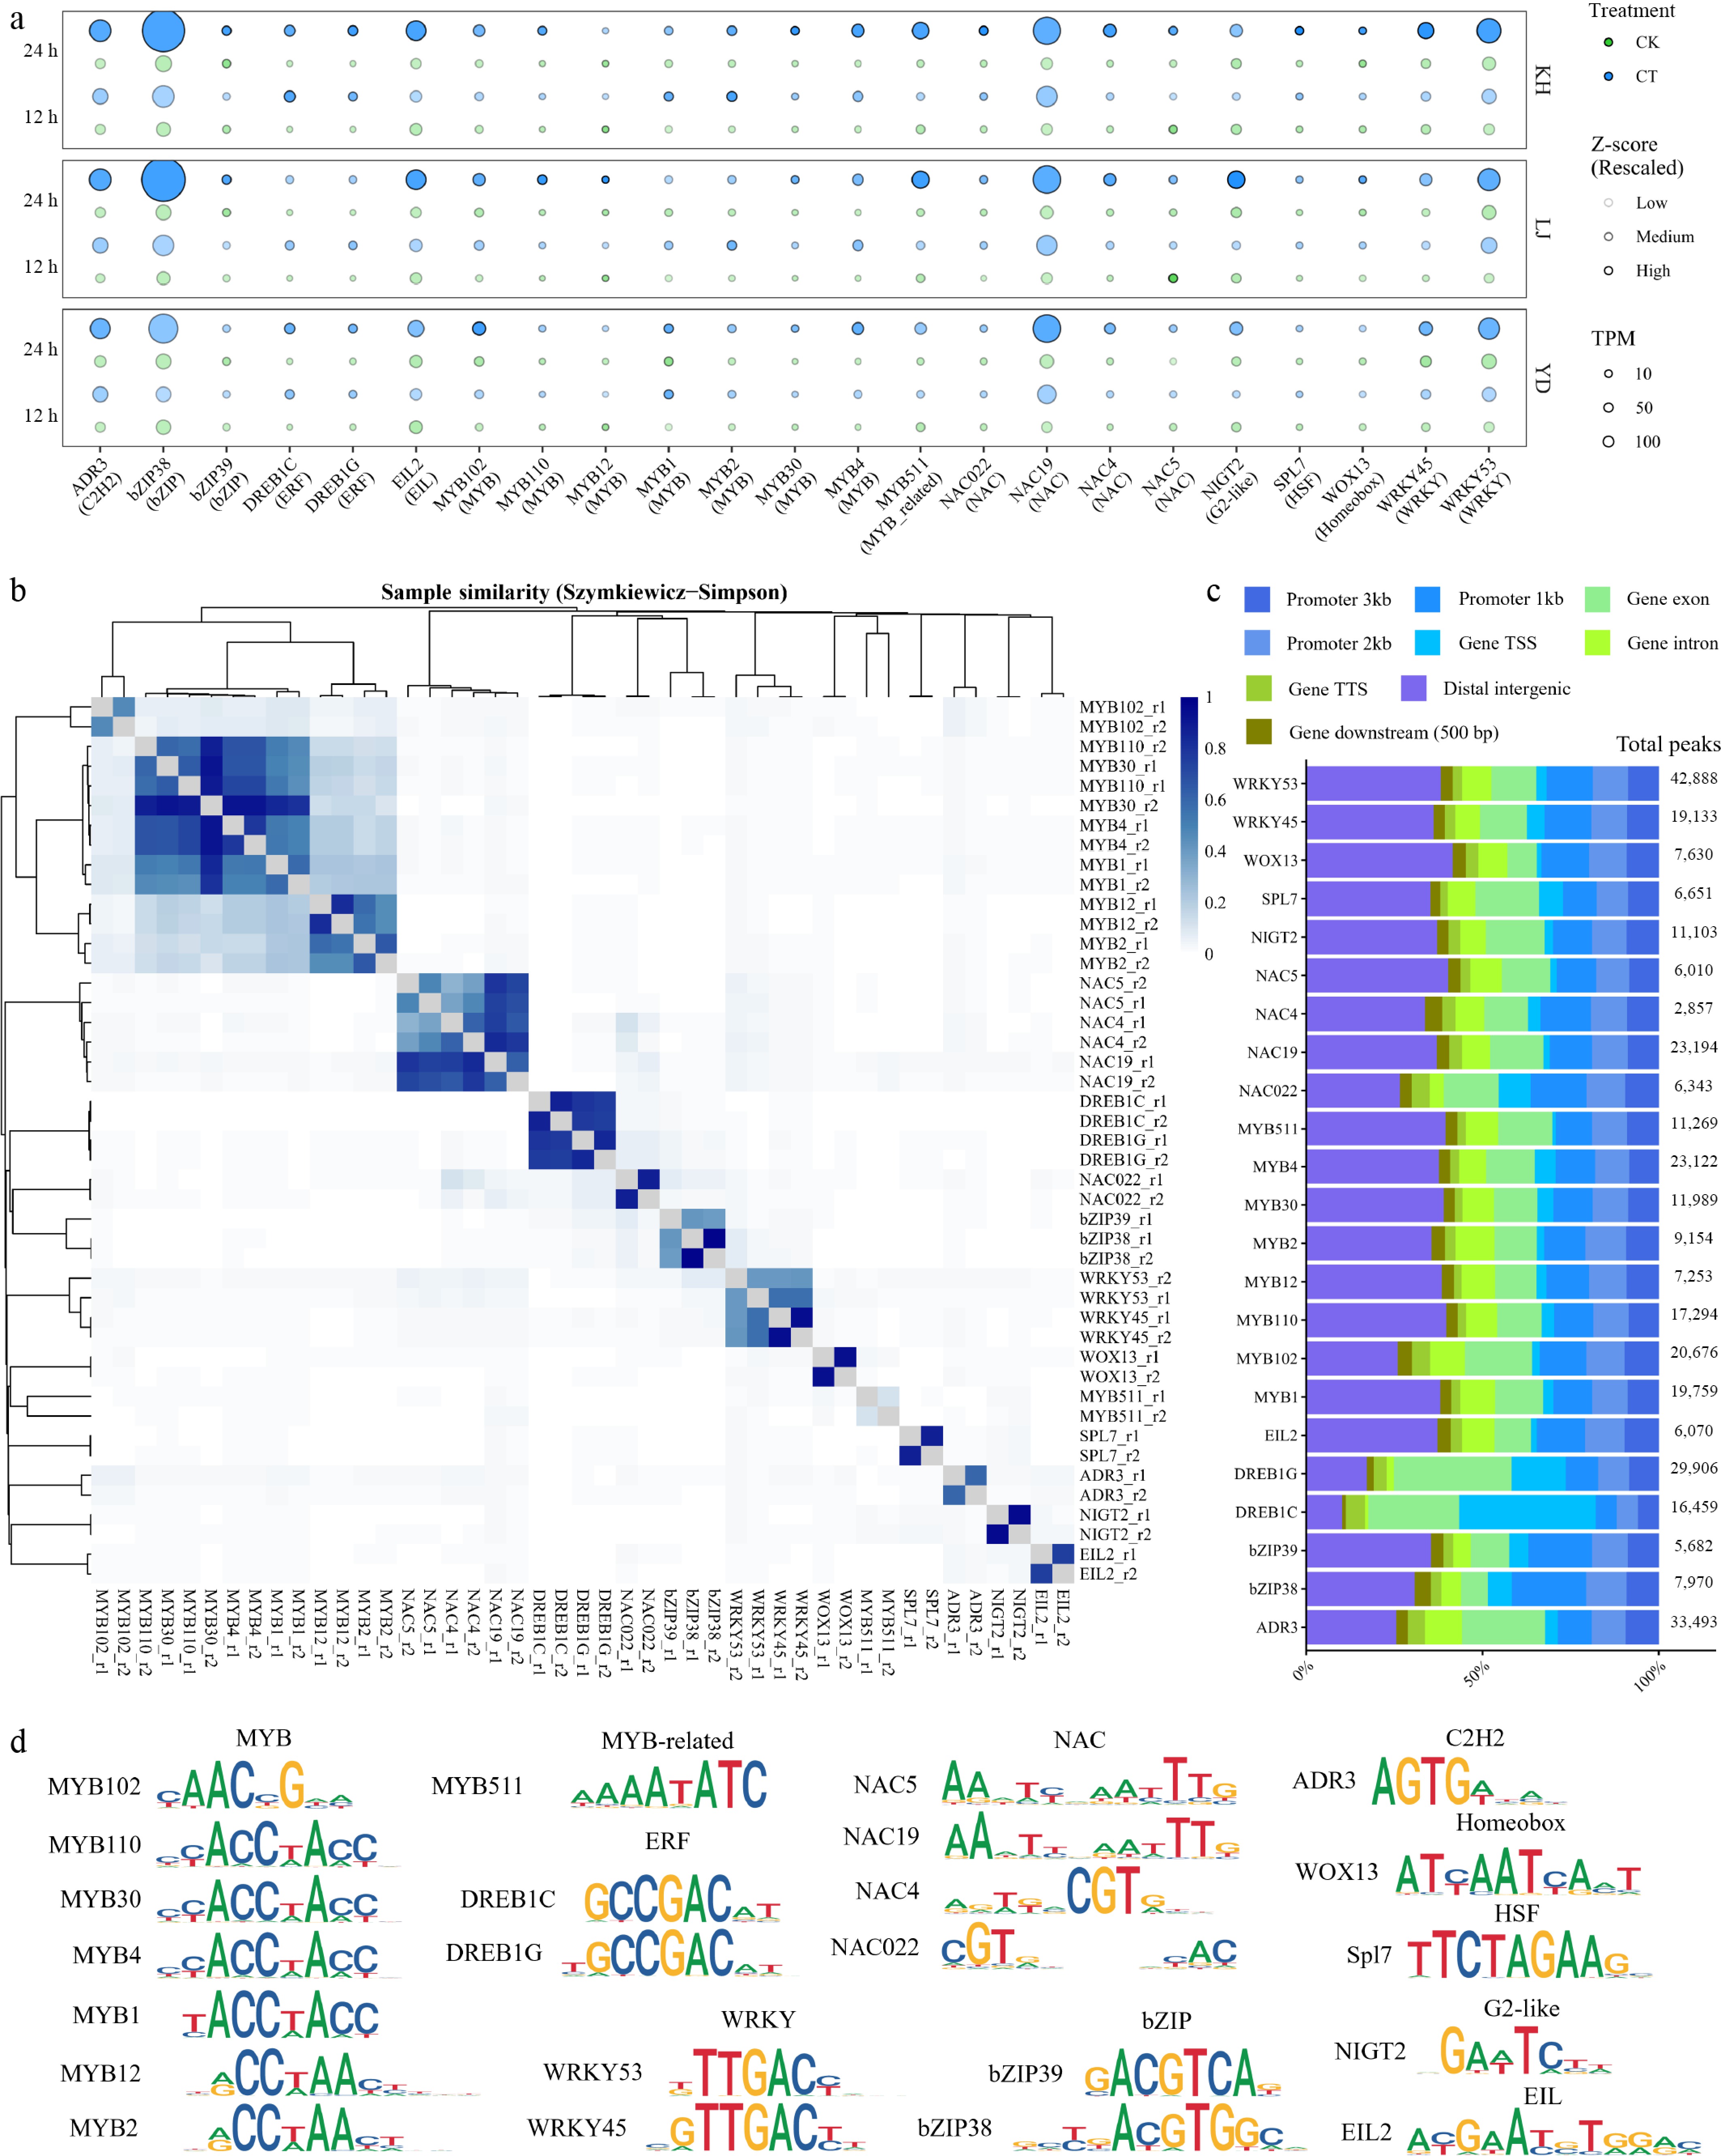
Figure 3.
DAP-seq data analysis of 23 cold-induced transcription factors. (a) Expression profiles of the 23 cold-induced transcription factors. (b) Clustering of DAP-seq sample signals based on the overlap (Szymkiewicz–Simpson) coefficient. (c) Number of peaks in DAP-seq samples and their distribution relative to gene structures. (d) TF motif enrichment analysis based on DAP-seq signals; the most significant motif identified through de novo prediction is used as the representative motif for the TF.
By filtering DAP-seq signals located within gene promoters (2 kb upstream of TSSs), we obtained a total of 95,131 peaks involving 33,549 genes; among them, 32,149 peaks overlapped with ACRs, involving 17,243 genes. Among 12,346 COR genes, 10,312 contained at least one TF binding signal in their promoter regions, and 6,142 contained at least one signal where a TF peak overlapped an ACR in the promoter (Fig. 4a). This in vitro TF-target binding information provides valuable clues for understanding in vivo transcriptional regulation. For example, OsNCED4[29], a key gene in ABA biosynthesis that shows higher expression in KH and LJ than in YD (Fig. 1f), contains binding signals for multiple TFs in its promoter, including ADR3[30], bZIP38, MYB102, NAC022, NAC19, and NAC4 (Fig. 4b); DREB1G[31] can bind to the promoters of JA biosynthesis-related genes OsLOX1 and OsAOS2; and EIL2[32] can bind to the promoter of the JA biosynthesis enzyme gene OsOPR1 (Fig. 4b). These data provide important reference information for subsequent experimental validation of transcriptional regulation. We provide an online visualization website (
http://plantencode.fun/regulome/rice ) to allow researchers to more comprehensively explore the transcriptional regulatory data and download the datasets generated in this study.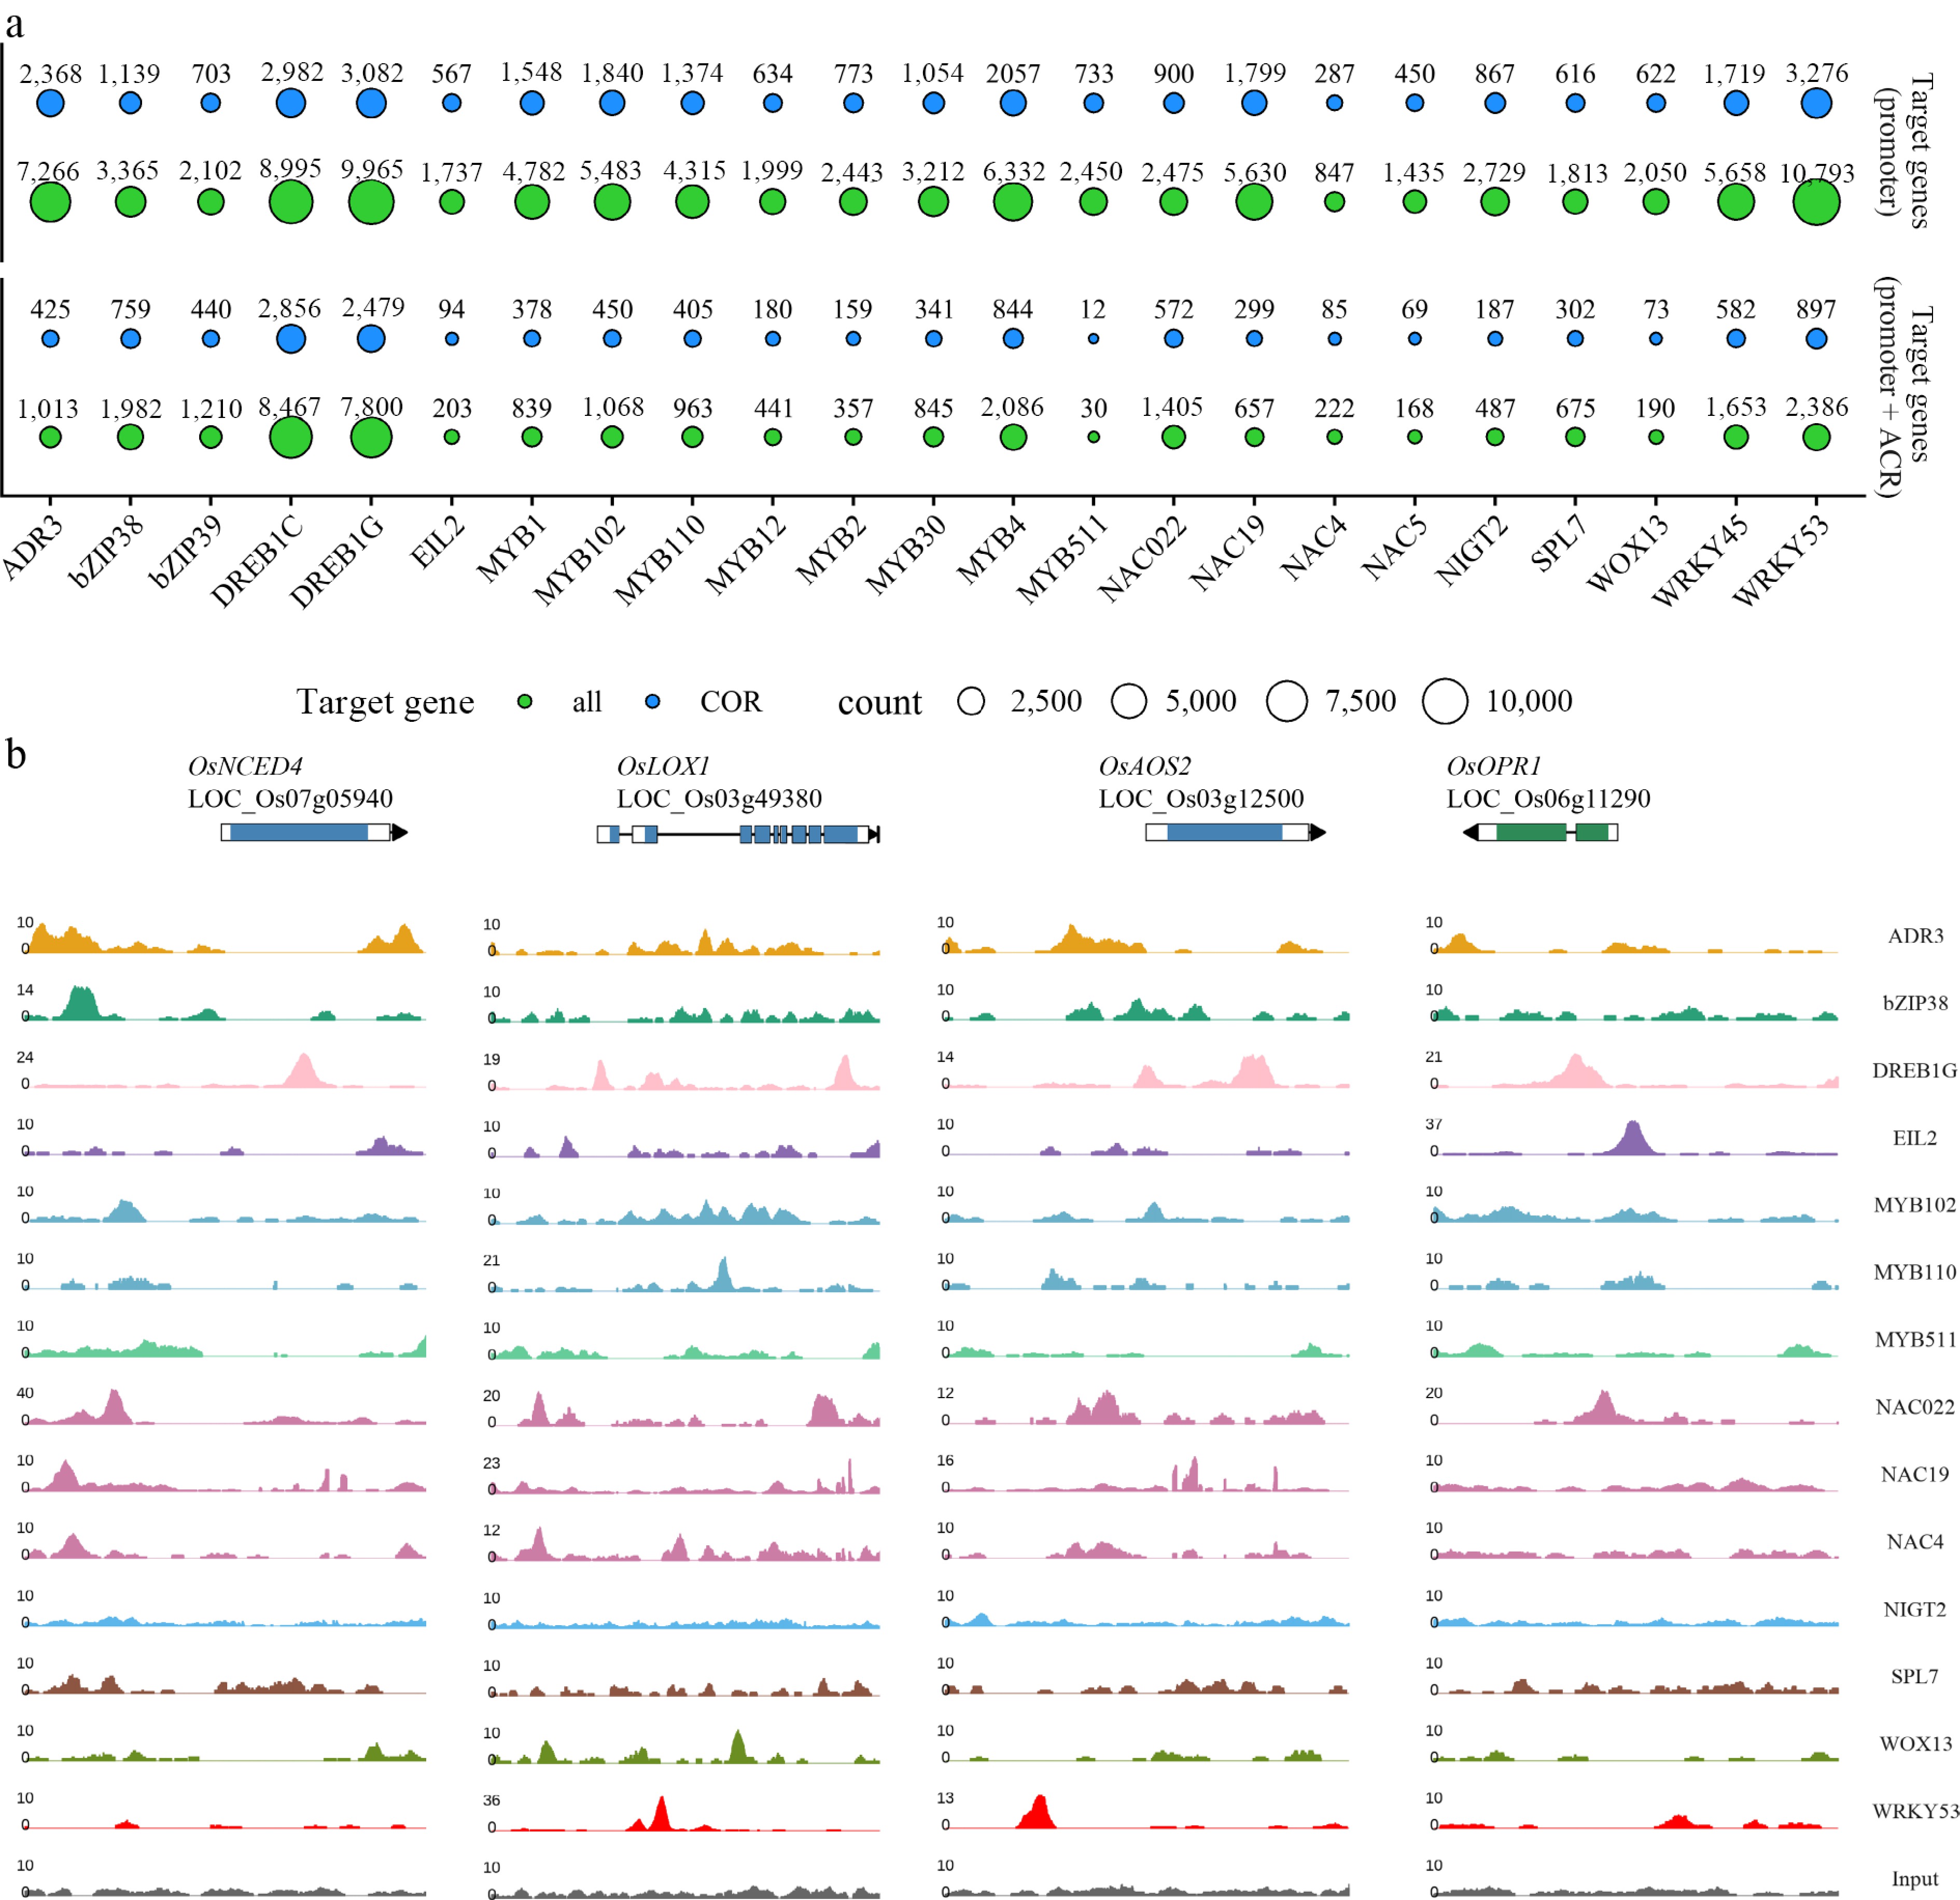
Figure 4.
DAP-seq defines potential TF-target gene regulatory relationships. (a) Number of potential target genes for each TF defined by DAP-seq and DNase-seq. The top panel shows the number of target genes defined by promoters containing DAP-seq signals, while the bottom panel shows the number of target genes defined by promoters containing overlapping signals from both DAP-seq and DNase-seq. (b) In vitro binding of TFs to the promoters of stress-related genes; the different colored tracks represent distinct transcription factor families.
-
Based on high-throughput transcriptional regulatory omics technologies, this study provides an extensive yet preliminary elucidation of the cold transcriptional regulatory landscape in three rice varieties at the seedling stage. We present the genome-wide in vitro binding profiles of multiple representative cold-responsive TFs. It should be noted that while the general workflow of DAP-seq is standardized, data generated from different sources—owing to variations in experimental materials, physiological states, protocols, and sequencing platforms—are not directly comparable. In this study, the three publicly available DAP-seq datasets were utilized solely to expand the repertoire of potential regulatory relationships, rather than to be quantitatively compared with our newly-generated DAP-seq data. Furthermore, the absence of overlap between DAP-seq signals and DNase-seq-defined ACRs does not preclude transcriptional regulatory activity. Conversely, the functional impact of a TF's binding at a gene promoter ultimately requires validation via molecular and genetic experiments. Although not yet supported by sufficient molecular and genetic experimental evidence, we believe these data remain an important reference for research on transcriptional regulation in rice.
-
This study provides a comprehensive transcriptional regulatory landscape of cold response at the seedling stage across three rice cultivars with varying cold tolerance. It reveals the in vitro genome-wide binding profiles of key COR TFs and, by integrating chromatin accessibility data, establishes potential regulatory associations between these TFs and COR genes. Leveraging online database platforms, the data generated in this study are expected to serve as a valuable reference for rice cold stress research and gene-editing-based breeding.
-
The authors confirm their contributions to the paper as follows: conceived, designed and supervised the project: Lü P, Chen Z; performed RNA-seq, DAP-seq, DNase-seq, and other experiments: Tang L, Chen J, Cai D, Jiang Y; analyzed the data: Chen Z, Fan X, Xie R; wrote the manuscript: Chen Z, Tang L, Chen J, Fan X, Cai D, Xie R, Jiang Y, Lü P. All authors reviewed the results and approved the final version of the manuscript.
-
All data generated or analyzed during this study are included in this published article, and large data tables (Gene expression matrix, DAP-seq peaks, and target gene information) are available at: http://plantencode.fun/regulome/rice. The sequencing data generated in this study have been deposited in the NGDC database under accession number PRJCA066654.
-
The authors declare that they have no conflict of interest.
-
Received 12 June 2026; Accepted 28 August 2026; Published online 24 September 2026
-
# Authors contributed equally: Zhuo Chen, Lingxian Tang, Jialin Chen
- Copyright: © 2026 by the author(s). Published by Maximum Academic Press on behalf of Hainan University. This article is an open access article distributed under Creative Commons Attribution License (CC BY 4.0), visit https://creativecommons.org/licenses/by/4.0/.
-
About this article
Cite this article
Chen Z, Tang L, Chen J, Fan X, Cai D, et al. 2026. Cis-regulatory landscape of cold transcriptional response in rice seedlings. Tropical Plants 5: e034 doi: 10.48130/tp-0026-0034 

Cis-regulatory landscape of cold transcriptional response in rice seedlings
- Received: 12 June 2026
- Revised: 29 July 2026
- Accepted: 28 August 2026
- Published online: 24 September 2026
Abstract: As a crop that originated in the subtropics, rice (Oryza sativa L.) has acquired low-temperature tolerance during its expansion to high-latitude and high-altitude regions. Transcriptional regulation of cold-regulated (COR) genes plays a crucial role in this adaptation process. In this study, we used one cold-sensitive indica cultivar (Yangdao 6) and two cold-tolerant japonica cultivars (Koshihikari and Lijiangxintuanheigu) to dissect the cis-regulatory landscape of COR genes at the seedling stage. Through transcriptomic and chromatin accessibility analyses, we identified a set of transcription factors (TFs) associated with COR-related cis-regulation. Using DNA Affinity Purification sequencing (DAP-seq), we profiled the genome-wide binding landscapes of 23 COR TFs from 11 families, including ERF, MYB, NAC, WRKY, and bZIP. By integrating DAP-seq and chromatin accessibility data, we constructed a position-resolved transcriptional regulatory network that encompasses 51.9% of the COR genes. The datasets analyzed in this study are accessible via the online database (http://plantencode.fun/regulome/rice) and are expected to serve as a valuable reference for fundamental research on rice transcriptional regulation and genomic editing breeding based on cis-engineering.
-
Key words:
- Rice /
- Transcription factor /
- DAP-seq /
- Cold stress