-
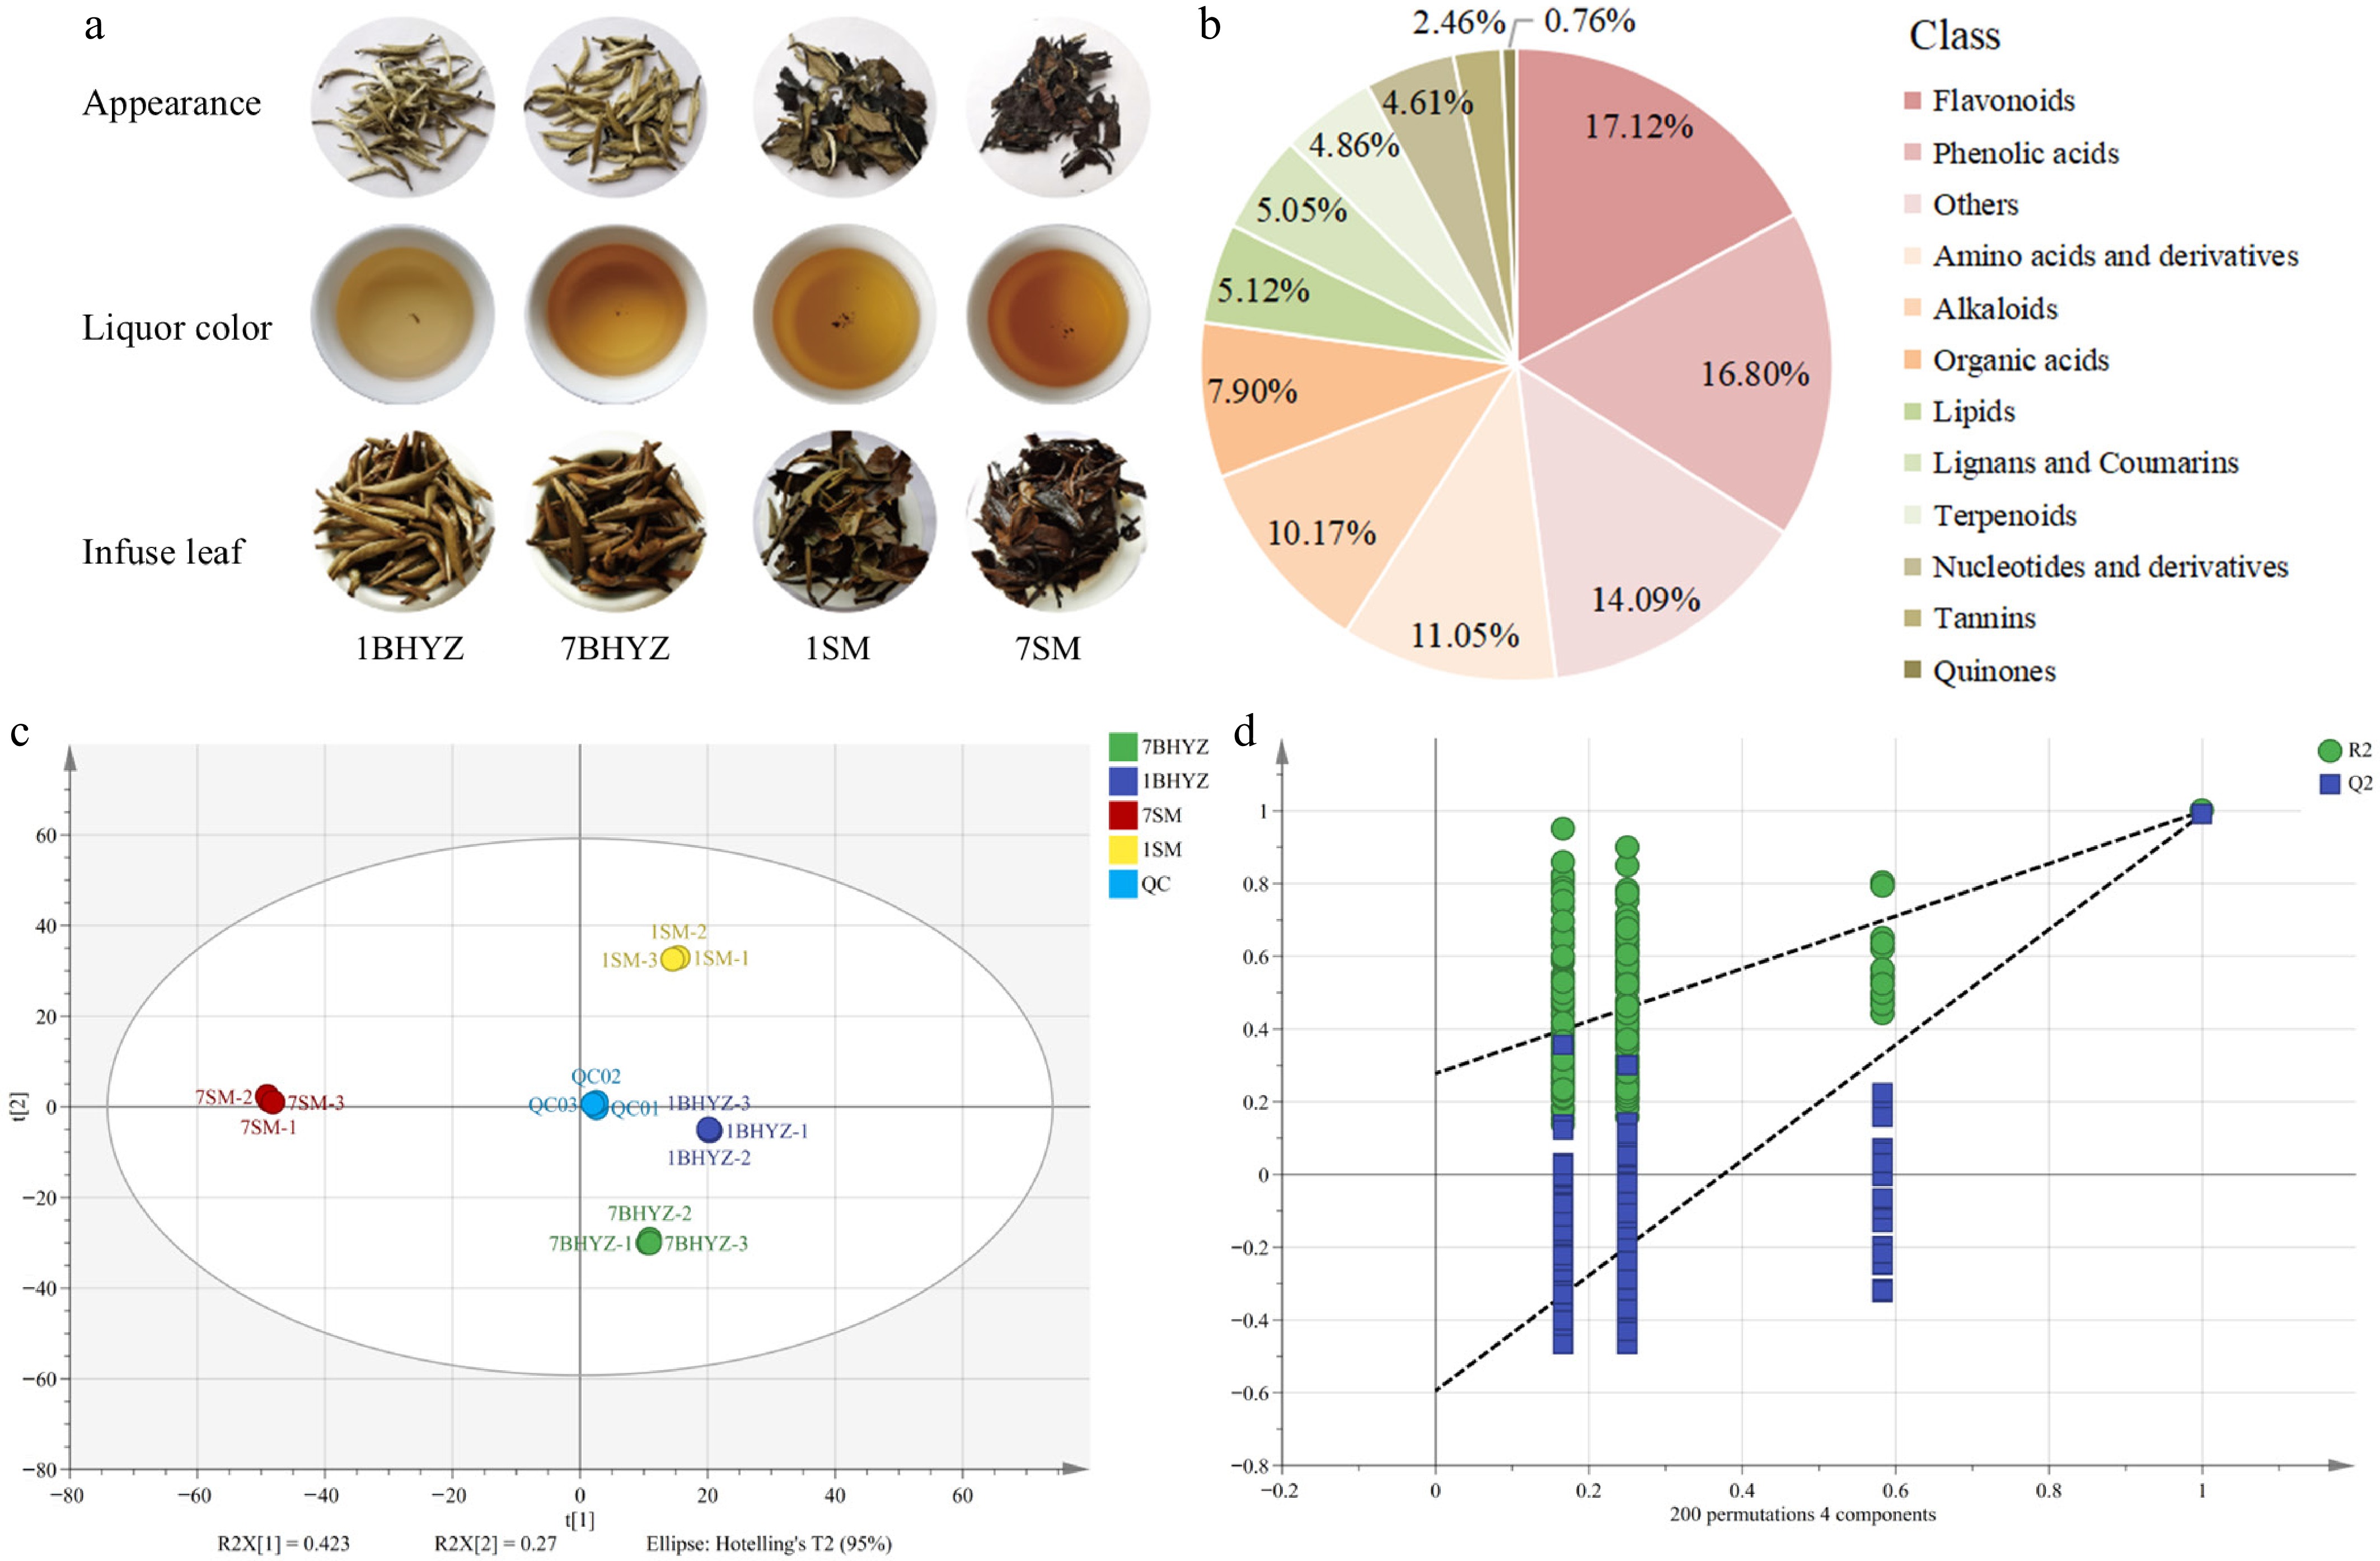
Figure 1.
Flavor and metabolomics analysis of new and aged white tea samples. (a) Tea appearance, tea soup color, and tea leaves. (b) Metabolite category composition pie chart. (c) PLS-DA score scatter plot. (d) Permutation test plot. (e) Hierarchical cluster analysis plot.
-
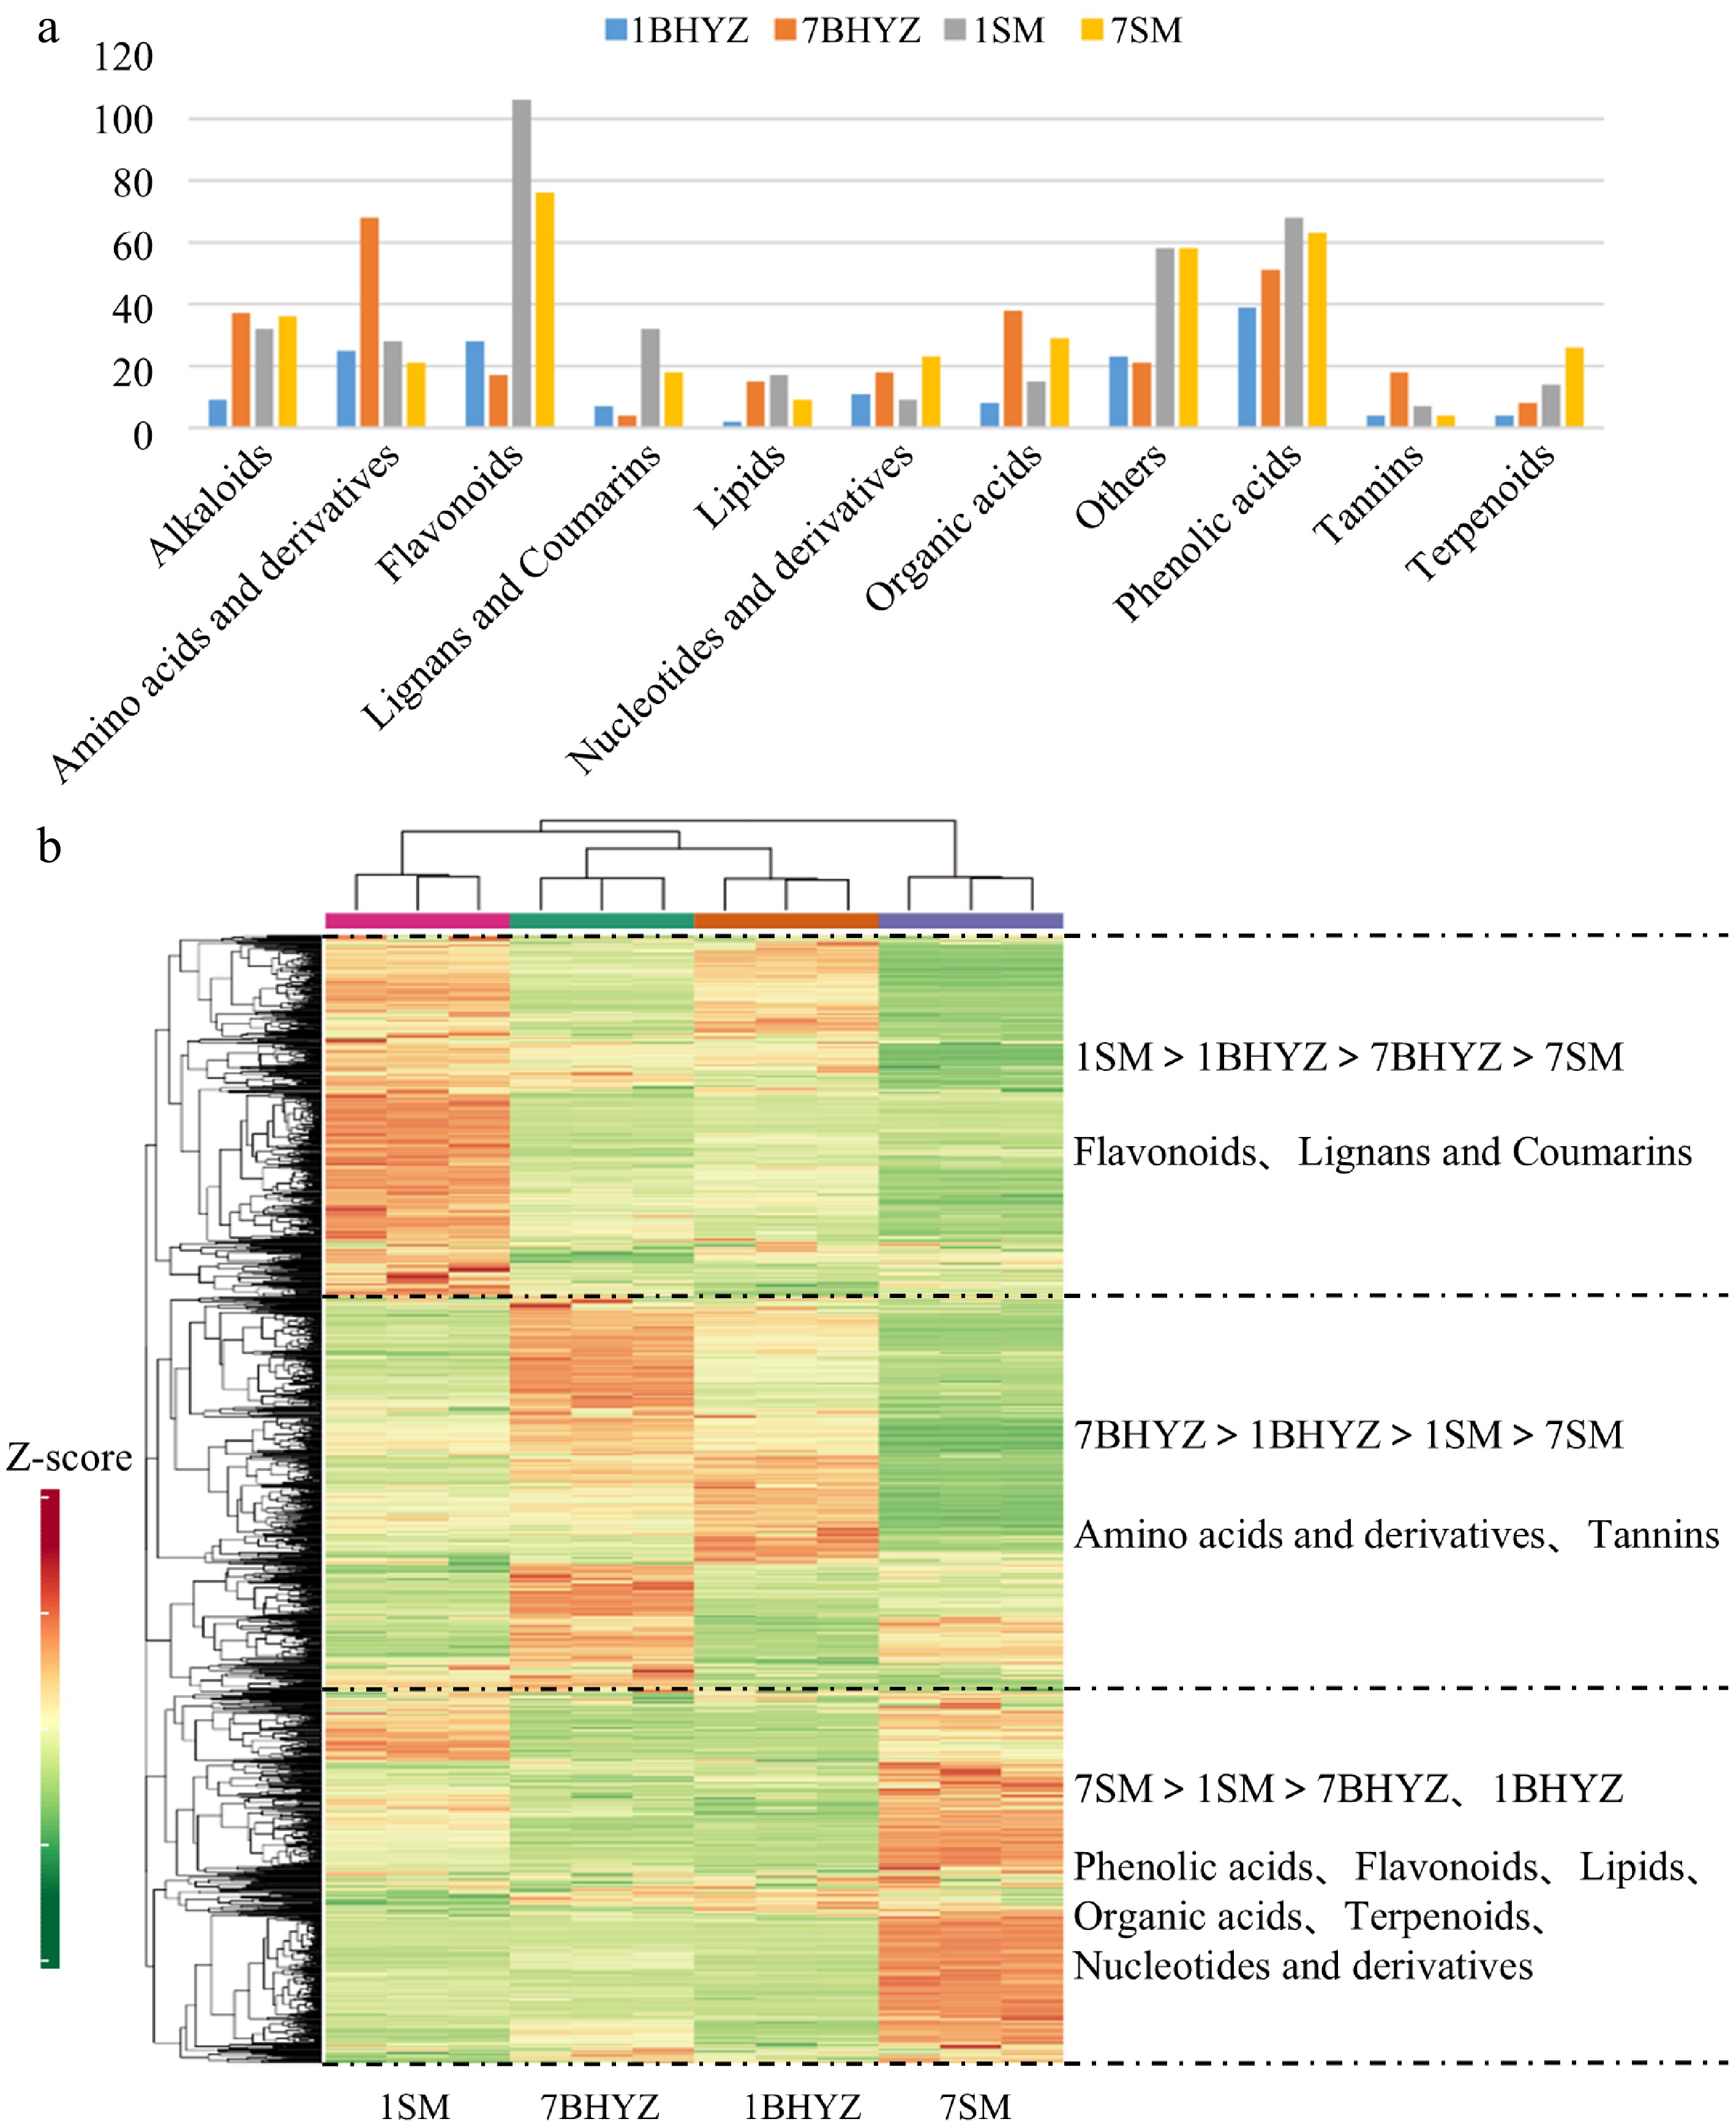
Figure 2.
Differential component analysis of new and aged white tea based on widely targeted metabolomics. (a) Bar chart of different bioactive components. (b) Heatmap of component contents in new and aged white tea.
-
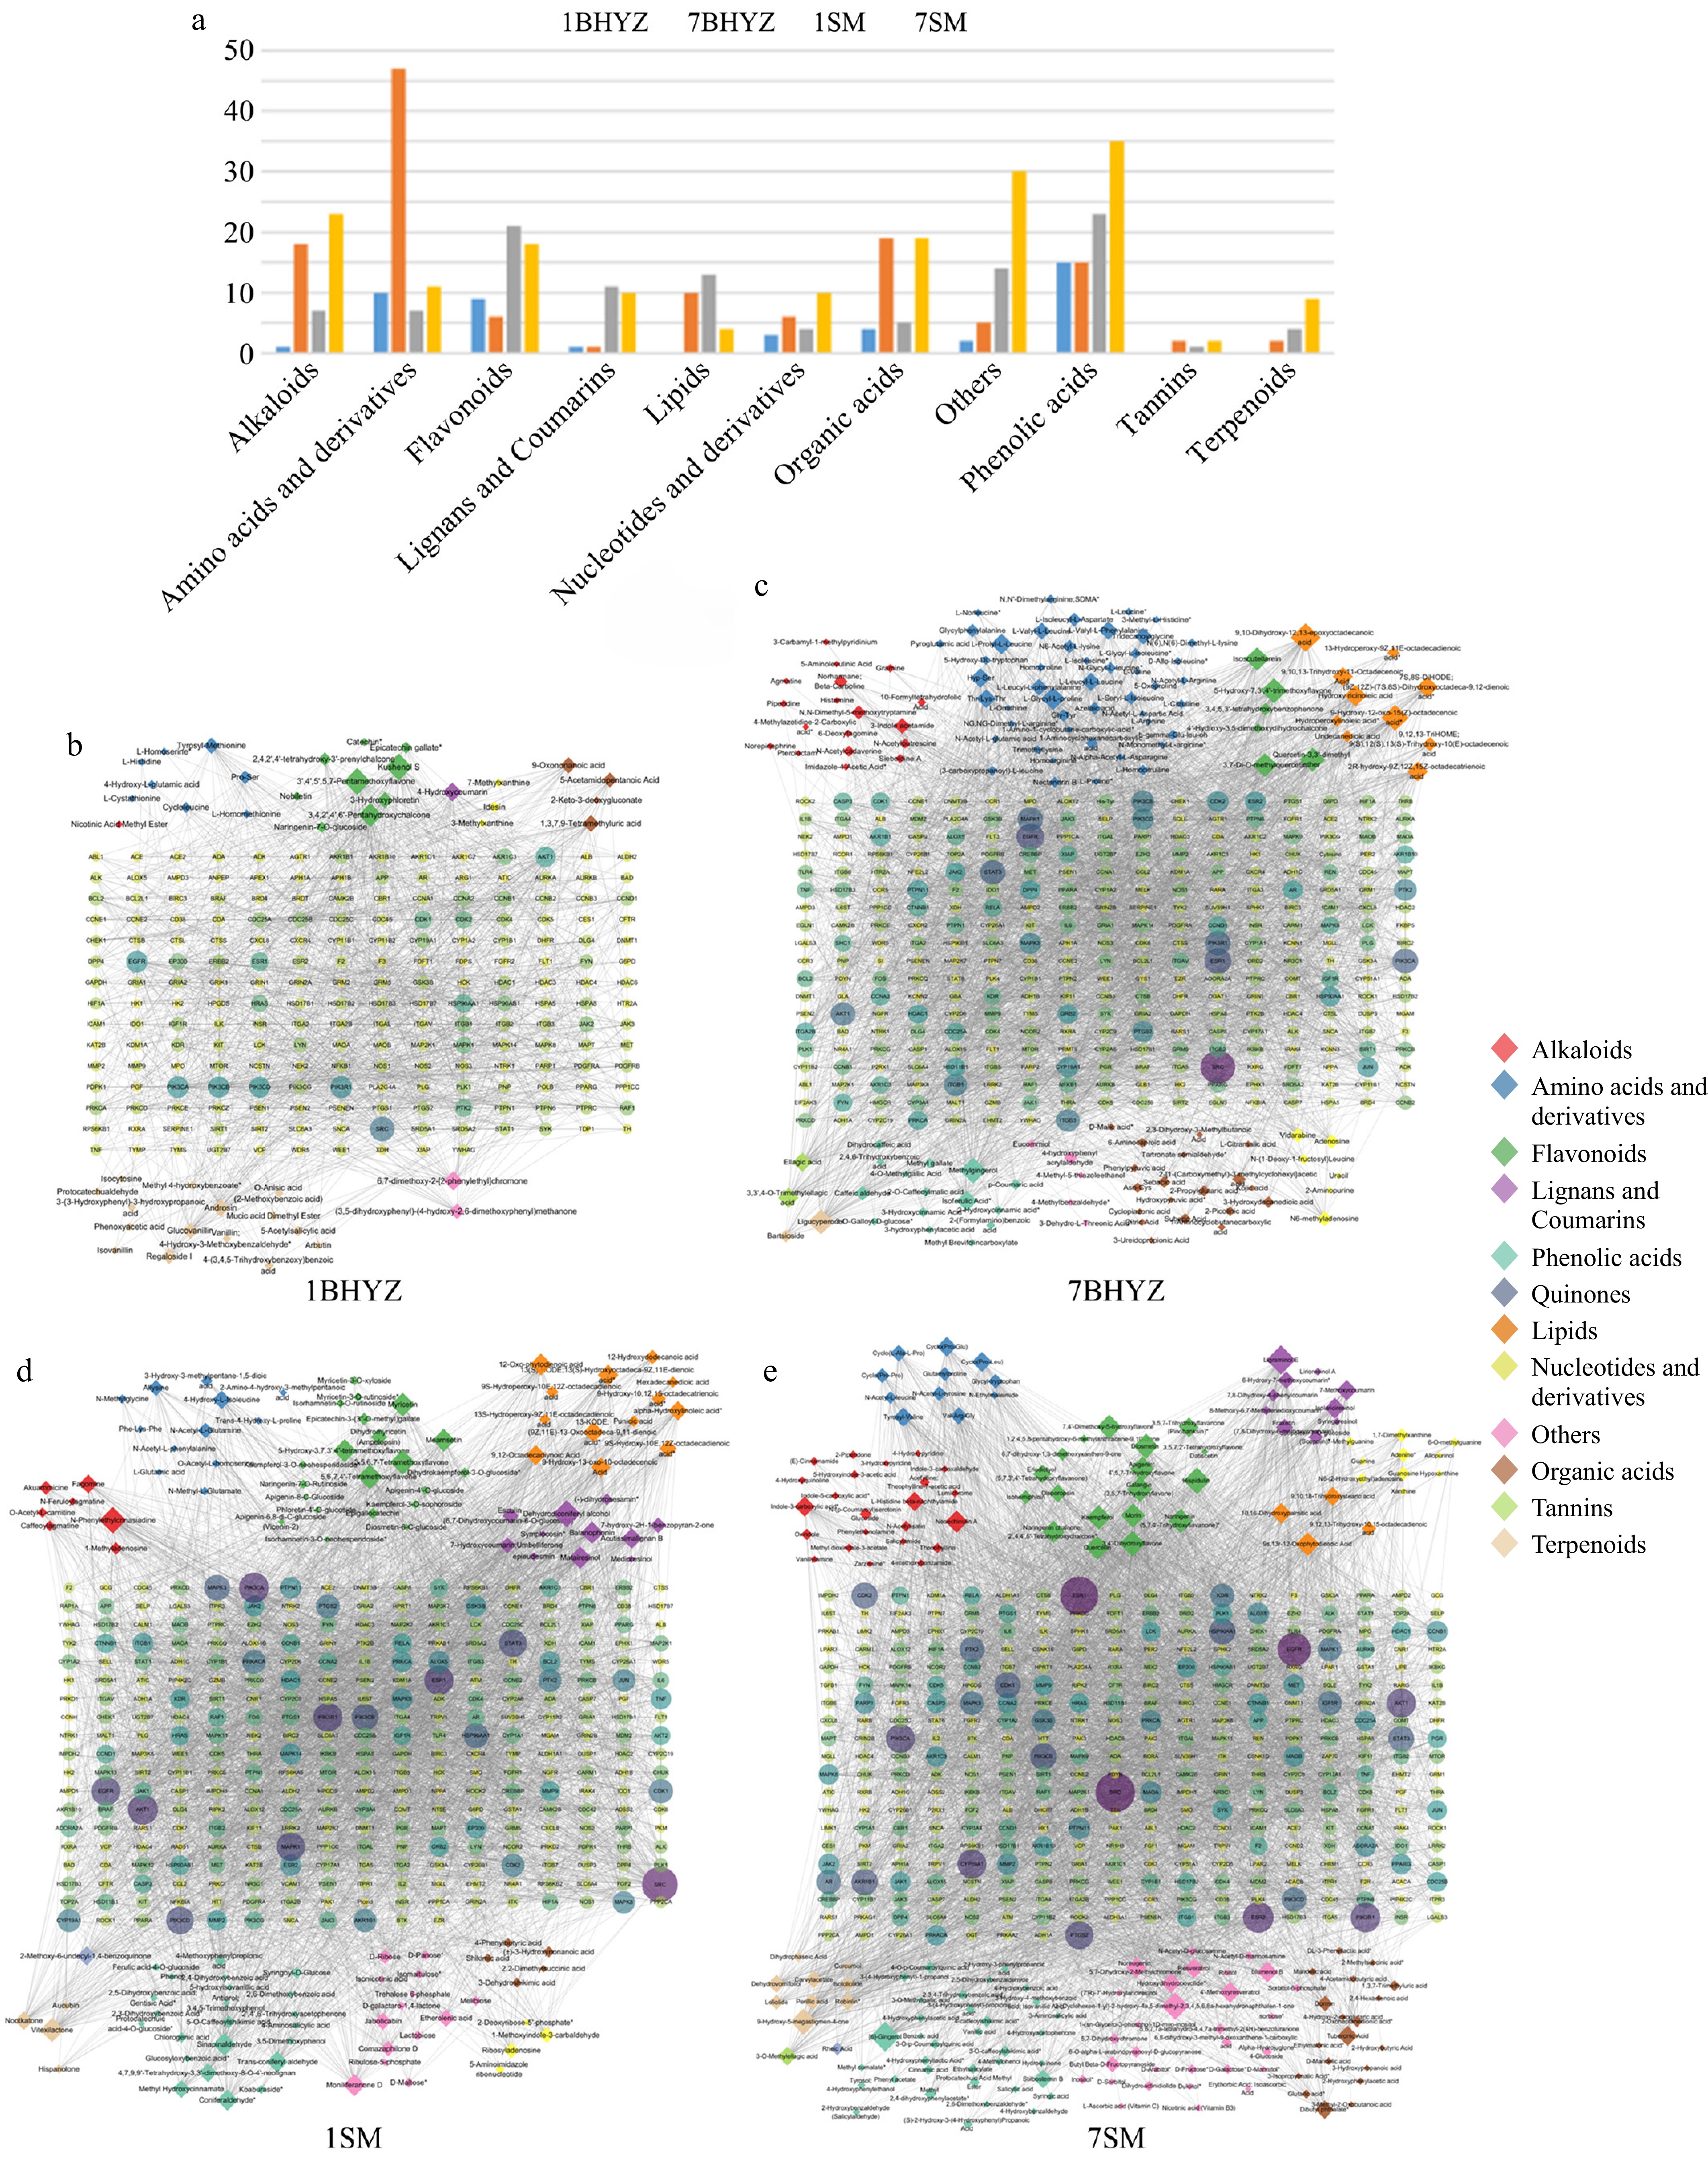
Figure 3.
Network pharmacology analysis of differential bioactive components and biological network in new and aged white tea samples. (a) Distribution and quantitative differences of various bioactive components in new and aged white tea. (b)–(e) Network diagram of 'Differential Bioactive Components-Targets' in new and aged white tea. Note: (b) are 1BHYZ, (c) are 7BHYZ, (d) are 1SM, and (e) are 7SM.
-
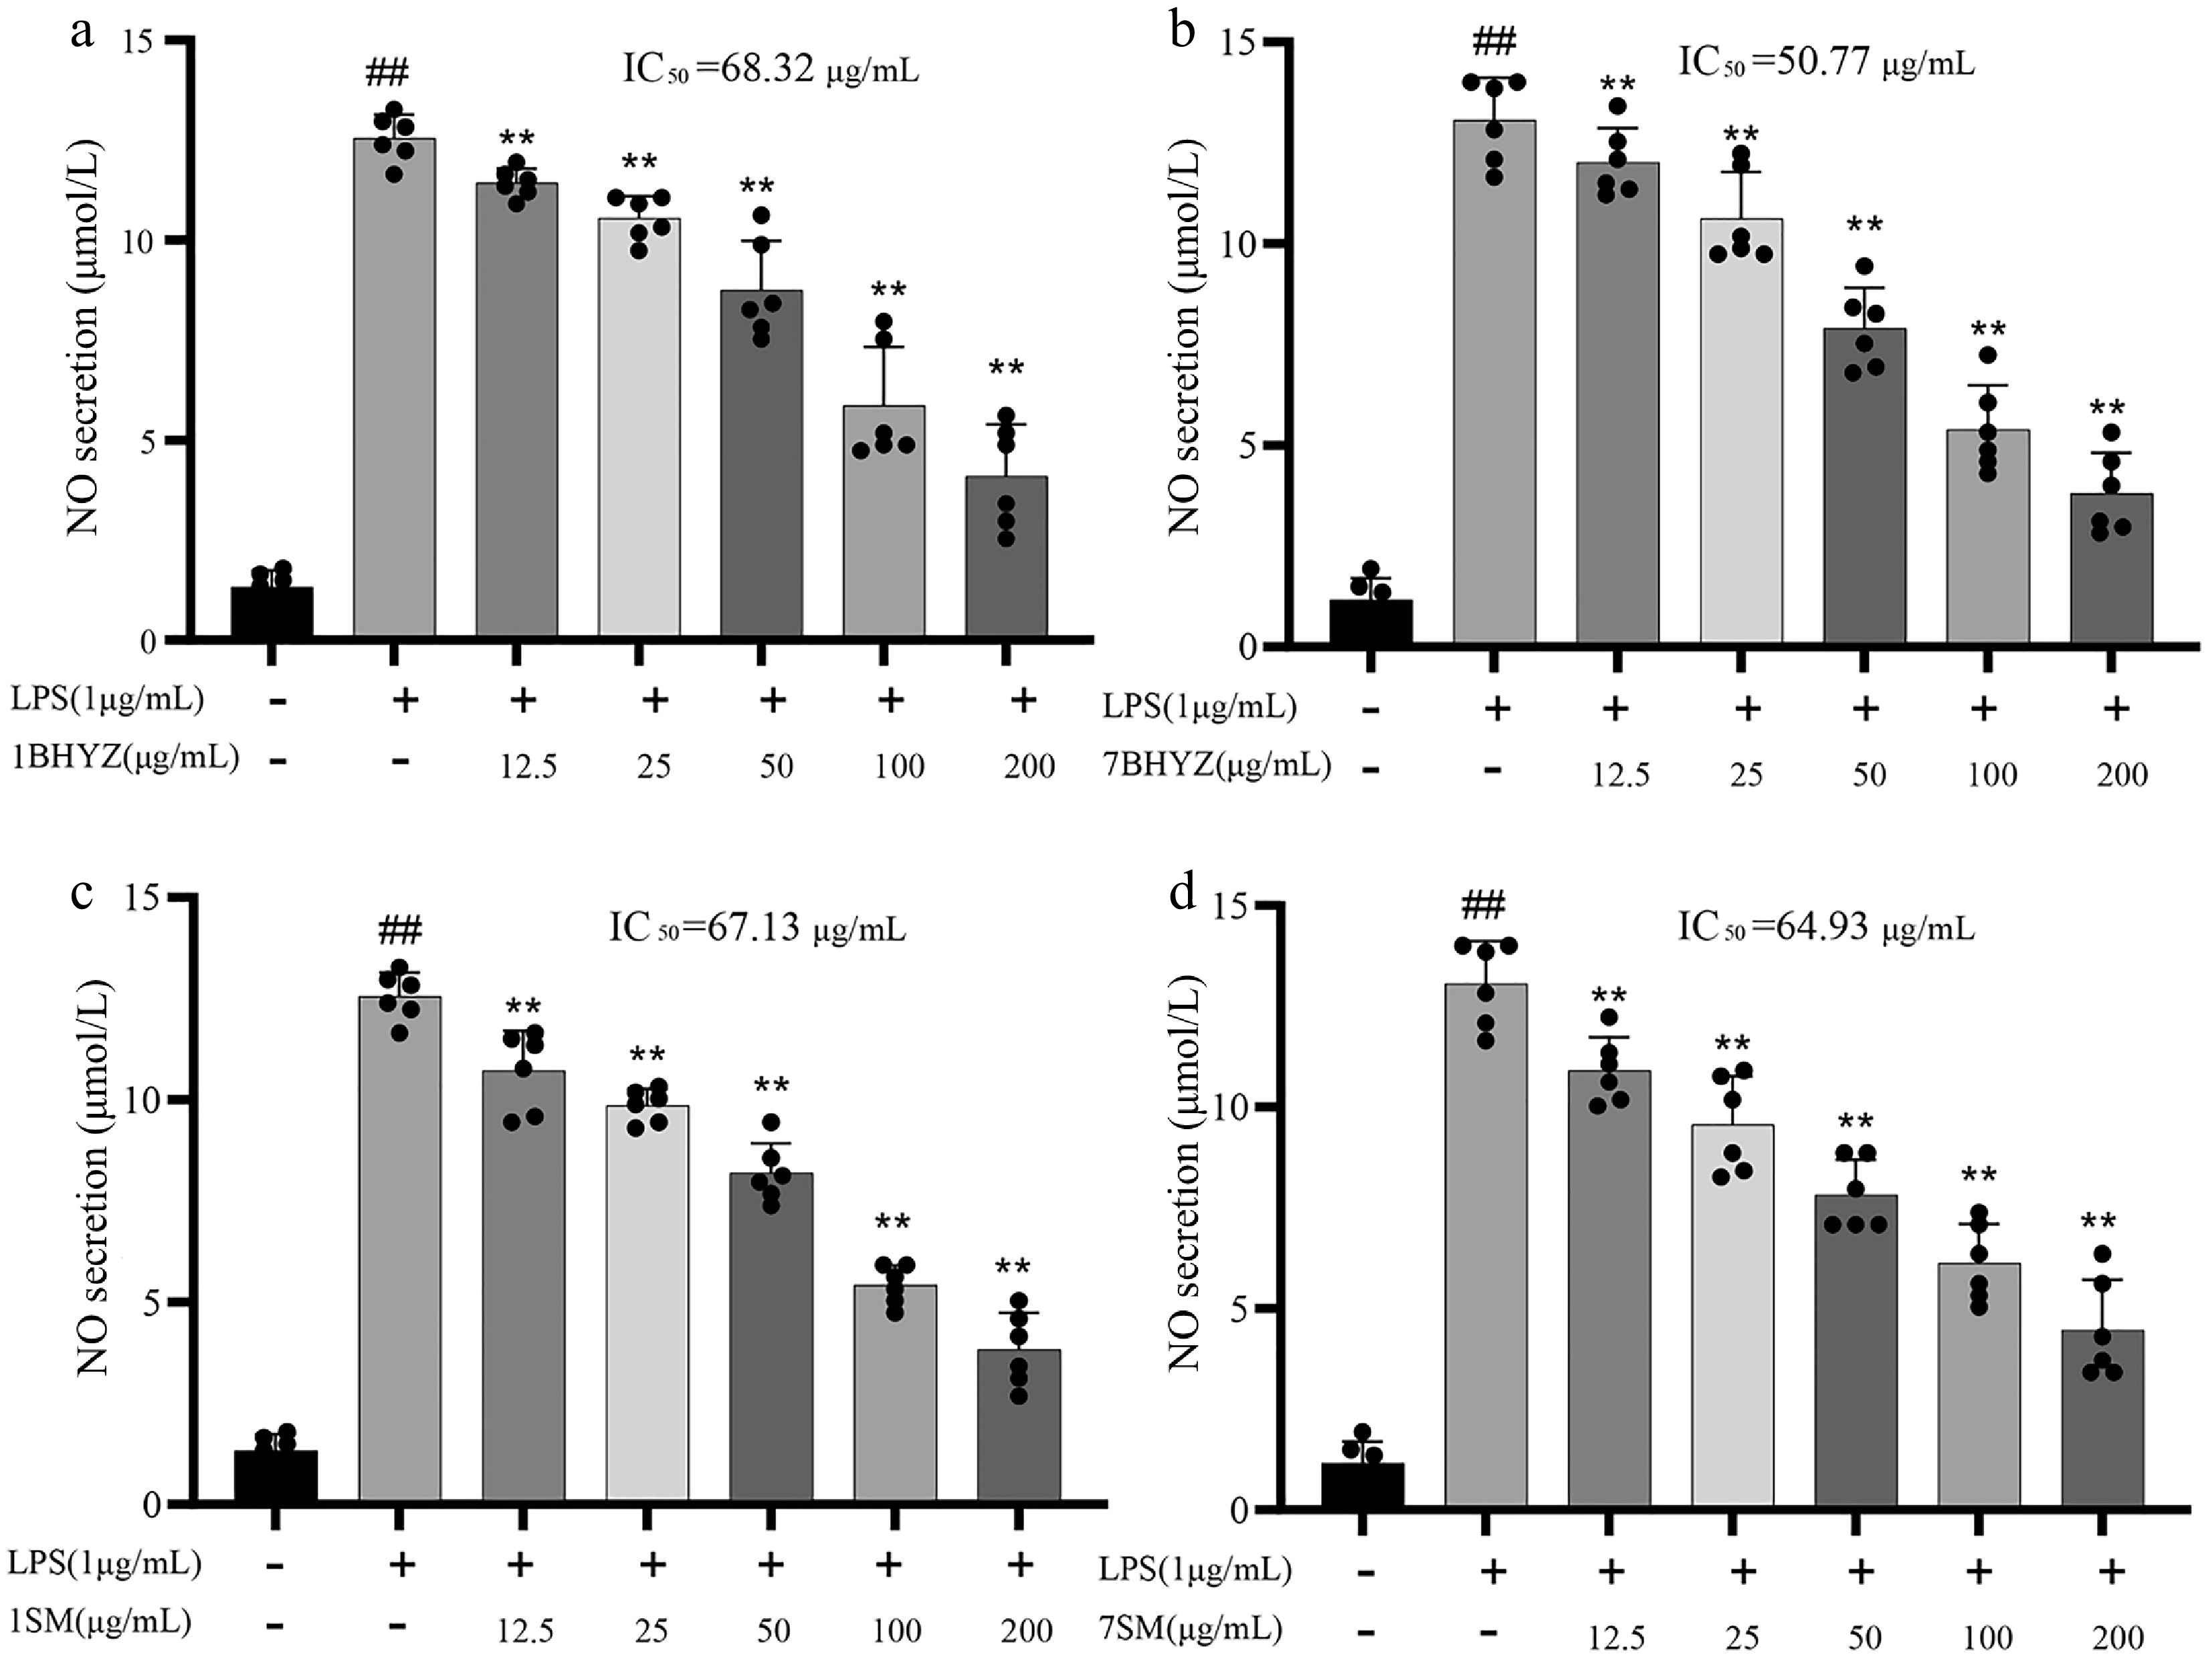
Figure 4.
Effects of different white tea aqueous extracts on NO secretion in RAW264.7 cells. (a) 1BHYZ. (b) 7BHYZ. (c) 1SM. (d) 7SM. Note: Compared with the control group, # p < 0.05, ## p < 0.01; compared with the model group, *p < 0.05, ** p < 0.01; n = 6.
-
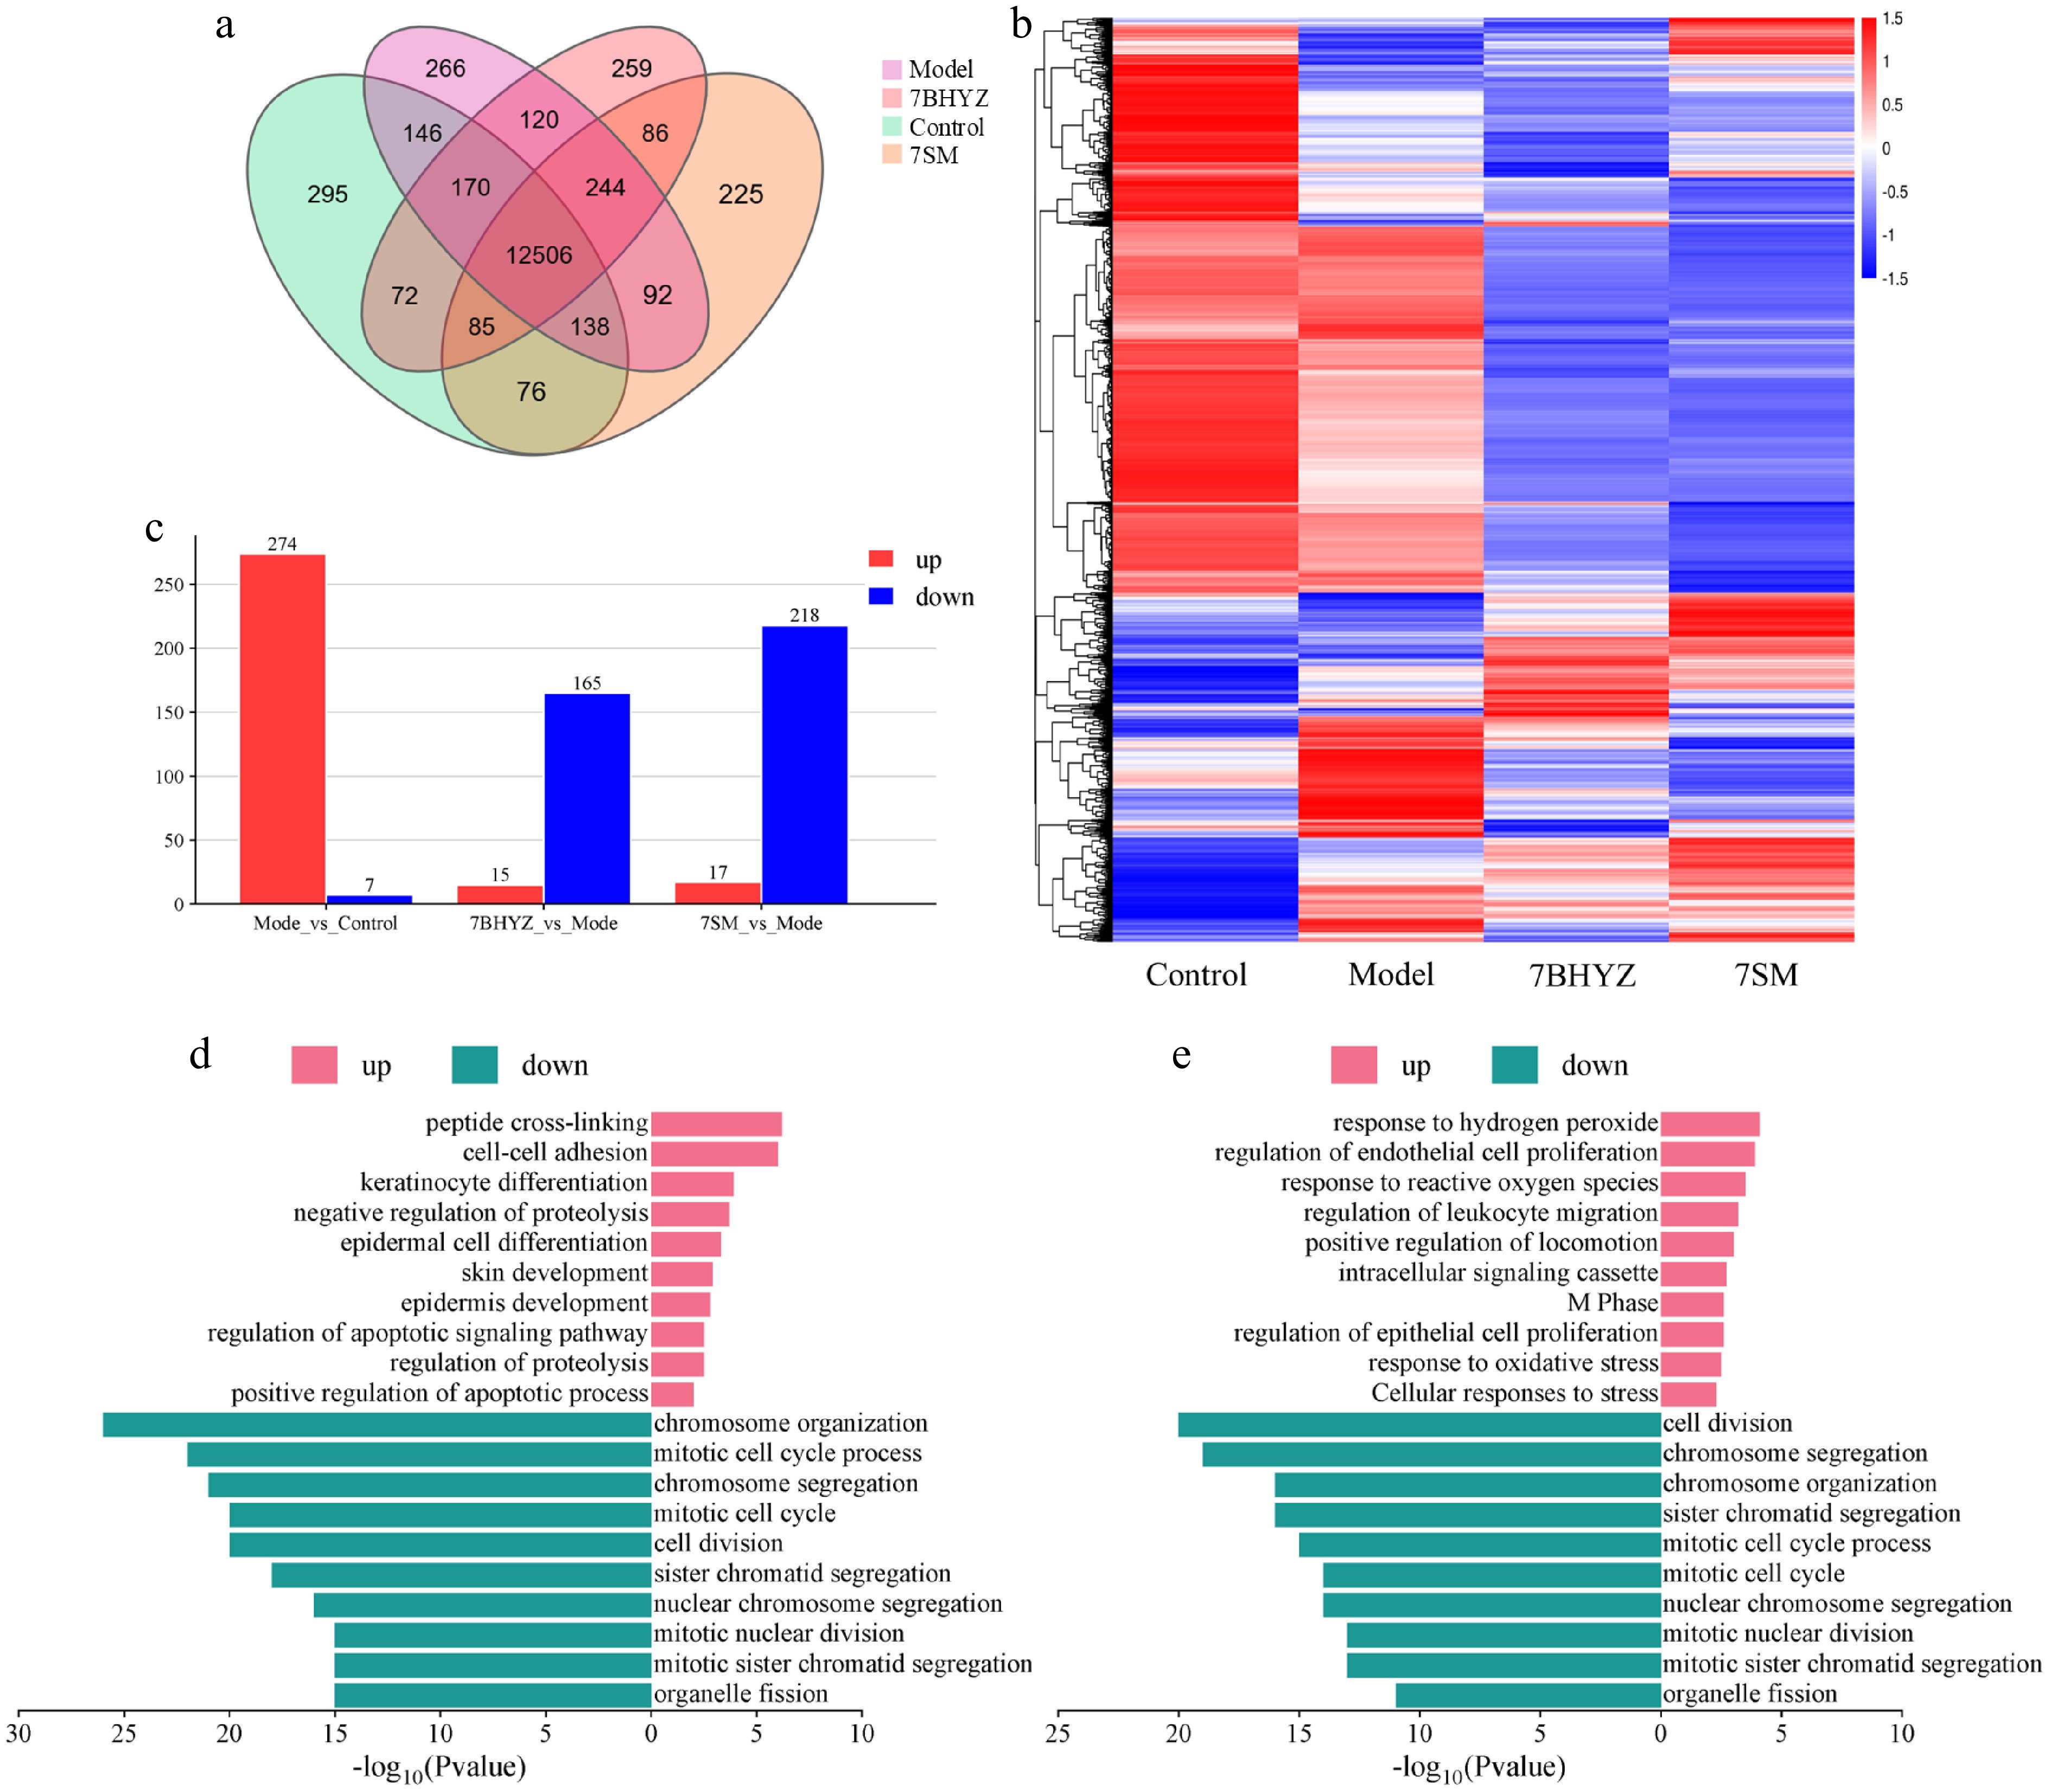
Figure 5.
Transcriptomic analysis of 7BHYZ and 7SM. (a) Venn diagram of gene groups. (b) Heatmap of co-expressed genes. (c) Bar chart of differentially expressed genes. (d) GO functional enrichment analysis of differentially expressed genes in 7BHYZ. (e) GO functional enrichment analysis of differentially expressed genes in 7SM. Note: A vs B indicates the comparison between groups A and B, with 'up-regulated' meaning that the expression level in group A is higher than that in group B.
-
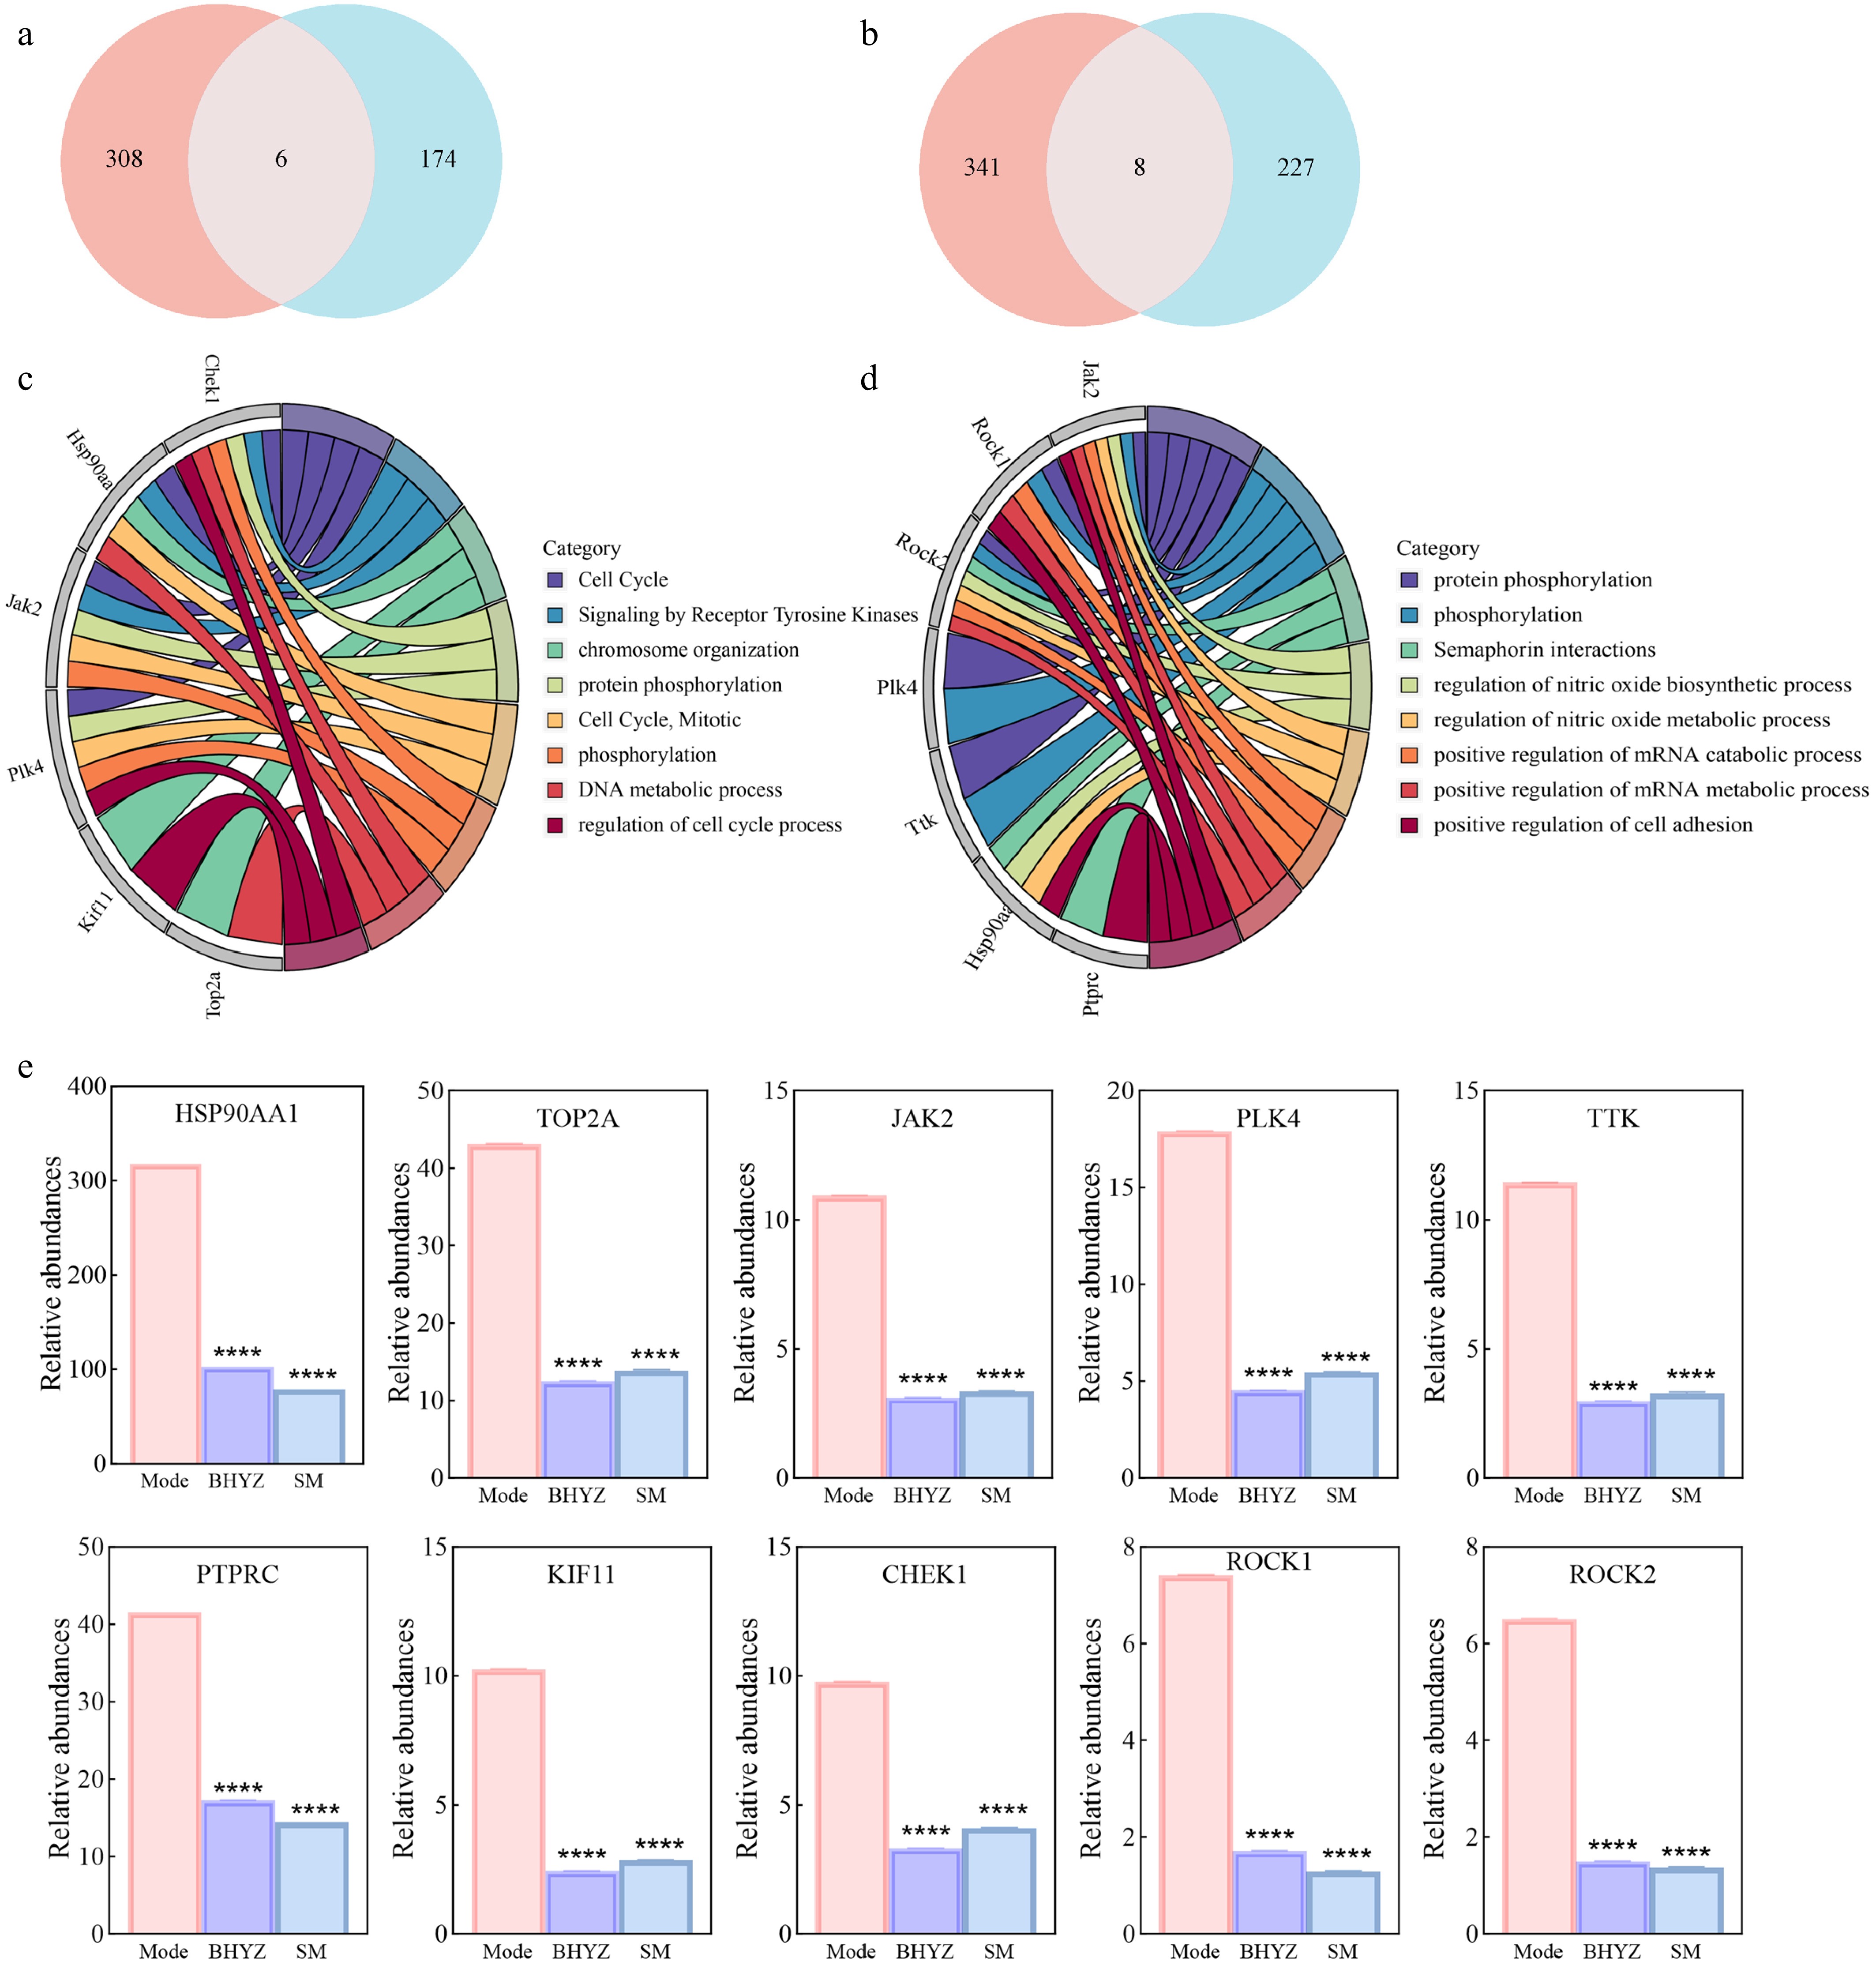
Figure 6.
Integrated analysis of network pharmacology and transcriptomics. (a) Venn diagram of overlapping targets between network pharmacology and transcriptomics of 7BHYZ. (b) Venn diagram of overlapping targets between network pharmacology and transcriptomics of 7SM. (c) Chordal graph of GO enrichment analysis of intersection targets of 7BHYZ. (d) Chordal graph of GO enrichment analysis of intersection targets of 7SM. (e) Relative expression levels of intersection targets in Mod, 7BHYZ, and 7SM. Note: Compared with the model group, **** p < 0.01; n = 3.
-
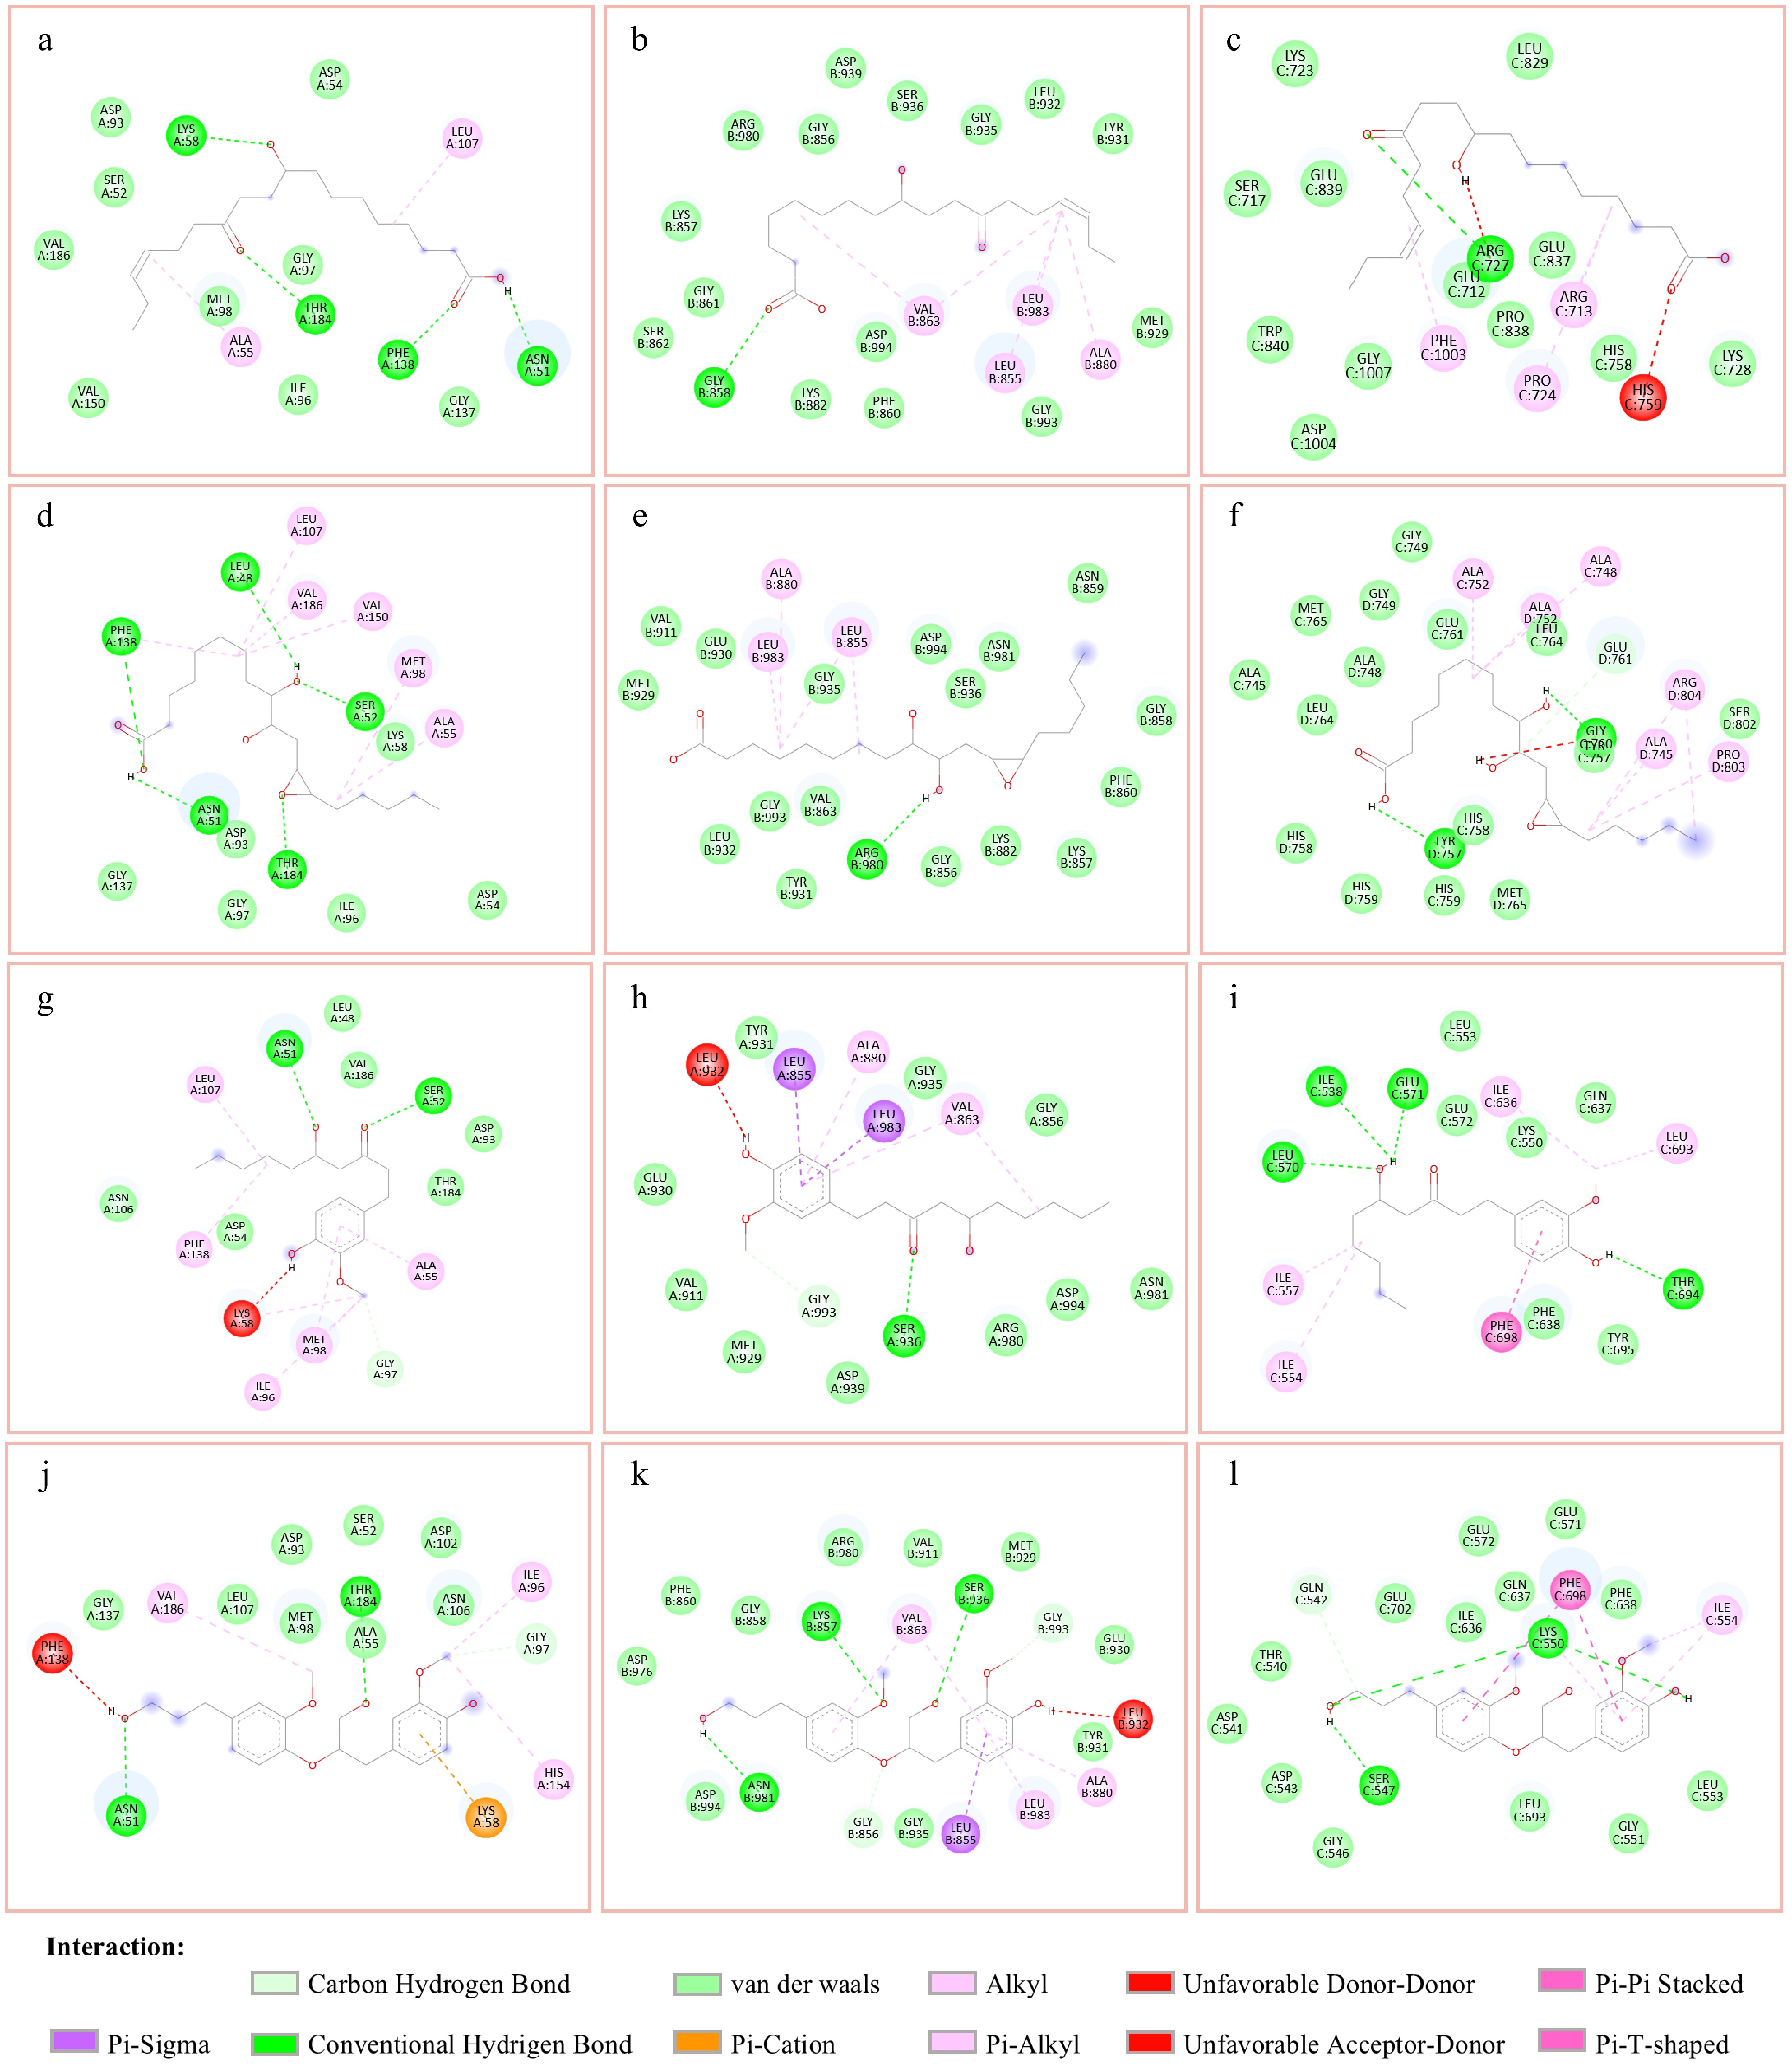
Figure 7.
Molecular docking validation. Note: (a)–(c) are the molecular docking validation diagrams of 9-Hydroxy-12-oxo-15(Z)-octadecenoic acid with HSP90AA1, TOP2A, and JAK2, respectively. (d)–(f) are the molecular docking validation diagrams of 9,10-Dihydroxy-12,13-epoxyoctadecanoic acid with HSP90AA1, TOP2A, and JAK2, respectively. (g)–(i) are the molecular docking validation diagrams of [6]-Gingerol with HSP90AA1, TOP2A, and JAK2, respectively. (j)–(l) are the molecular docking validation diagrams of Ligraminol E with HSP90AA1, TOP2A, and JAK2, respectively.
-
7BHYZ 7SM Compounds Class Degree Compounds Class Degree 3-Indole acetamide Alkaloids 26 Neoechinulin A Alkaloids 43 L-Glycyl-L-proline Amino acids and derivatives 46 Indole-3-carboxylic acid* Alkaloids 37 L-Prolyl-L-Leucine Amino acids and derivatives 40 Cyclo(Pro-Leu) Alkaloids 35 Hyp-Ser Amino acids and derivatives 37 Cyclo(Pro-Glu) Amino acids and derivatives 38 Thr-Lys-Thr Amino acids and derivatives 35 Hispidulin* Amino acids and derivatives 36 L-Valyl-L-Phenylalanine Amino acids and derivatives 34 3,4'-Dihydroxyflavone Flavonoids 54 L-Leucyl-L-Leucine Amino acids and derivatives 33 Galangin (3,5,7-Trihydroxyflavone) Flavonoids 53 L-Valyl-L-Leucine Amino acids and derivatives 30 Diosmetin* Flavonoids 51 L-Leucyl-L-phenylalanine Amino acids and derivatives 29 Apigenin; 4',5,7-Trihydroxyflavone Flavonoids 50 Tridecanoylglycine Amino acids and derivatives 29 7,4'-Dimethoxy-5-hydroxyflavone Flavonoids 49 His-Tyr Amino acids and derivatives 23 Kaempferol Flavonoids 48 5-Hydroxy-7,3',4'-trimethoxyflavone Flavonoids 52 Morin Flavonoids 48 Quercetin-3,3'-dimethyl ether Flavonoids 50 Naringenin (5,7,4'-Trihydroxyflavanone)* Flavonoids 48 3,7-Di-O-methylquercetin Flavonoids 49 Quercetin Flavonoids 48 Isoscutellarein Flavonoids 48 Naringenin chalcone; 2',4,4',6'-Tetrahydroxychalcone* Flavonoids 48 9,10-Dihydroxy-12,13-epoxyoctadecanoic acid Lipids 62 3,5,7-Trihydroxyflavanone (Pinobanksin)* Flavonoids 43 9-Hydroxy-12-oxo-15(Z)-octadecenoic acid* Lipids 55 3,5,7-Trihydroxyflavanone (Pinobanksin)* Flavonoids 36 Hydroxy ricinoleic acid Lipids 42 Ligraminol E Lignans and coumarins 62 (9Z,12Z)-(7S,8S)-Dihydro
xyoctadeca-9,12-dienoic acid*Lipids 40 Isolariciresinol Lignans and coumarins 39 2R-hydroxy-9Z,12Z,15Z-octadecatrienoic acid Lipids 38 7-Methoxycoumarin Lignans and coumarins 38 9,10,13-Trihydroxy-11-Octadecenoic Acid Lipids 36 9s,13r-12-Oxophytodienoic Acid Lipids 47 N6-methyladenosine Nucleotides and derivatives 24 10,16-Dihydroxypalmitic acid Lipids 38 Adenosine Nucleotides and derivatives 23 Tuberonic Acid Organic acids 37 Vidarabine Nucleotides and derivatives 23 3-(Cyclohexen-1-yl)-2-hydroxy-4a,5-dimethyl-2,3,4,5,6,8a-hexahydronaphthalen-1-one Others 56 Methylgingerol Phenolic acids 56 4'-Methoxyresveratrol Others 39 Isoferulic Acid* Phenolic acids 39 blumenol B Others 38 Caffeic aldehyde Phenolic acids 24 Noreugenin; 5,7-Dihydroxy-2-Methylchromone Others 38 3,3',4-O-Trimethylellagic acid Tannins 39 Resveratrol Others 36 Ellagic acid Tannins 36 [6]-Gingerol Phenolic acids 63 Ligucyperonol Terpenoids 52 9-Hydroxy-5-megastigmen-4-one Terpenoids 54 Note: * indicates the presence of isomers of the substance. Table 1.
Top 30 compounds with the highest degree in 7BHYZ and 7SM.
-
Key active components Central targets (kcal/mol) HSP90AA1 TOP2A JAK2 7BHYZ 9-Hydroxy-12-oxo-15(Z)-octadecenoic acid −6.5 −6.4 −6.2 9,10-Dihydroxy-12,13-epoxyoctadecanoic acid −5.8 −6.4 −5.9 7SM [6]-Gingerol −6.6 −7.3 −8.1 Ligraminol E −6.4 −6.1 −7.6 Table 2.
Minimum binding energy information between key active ingredients and central targets of 7BHYZ and 7SM.
Figures
(7)
Tables
(2)