-
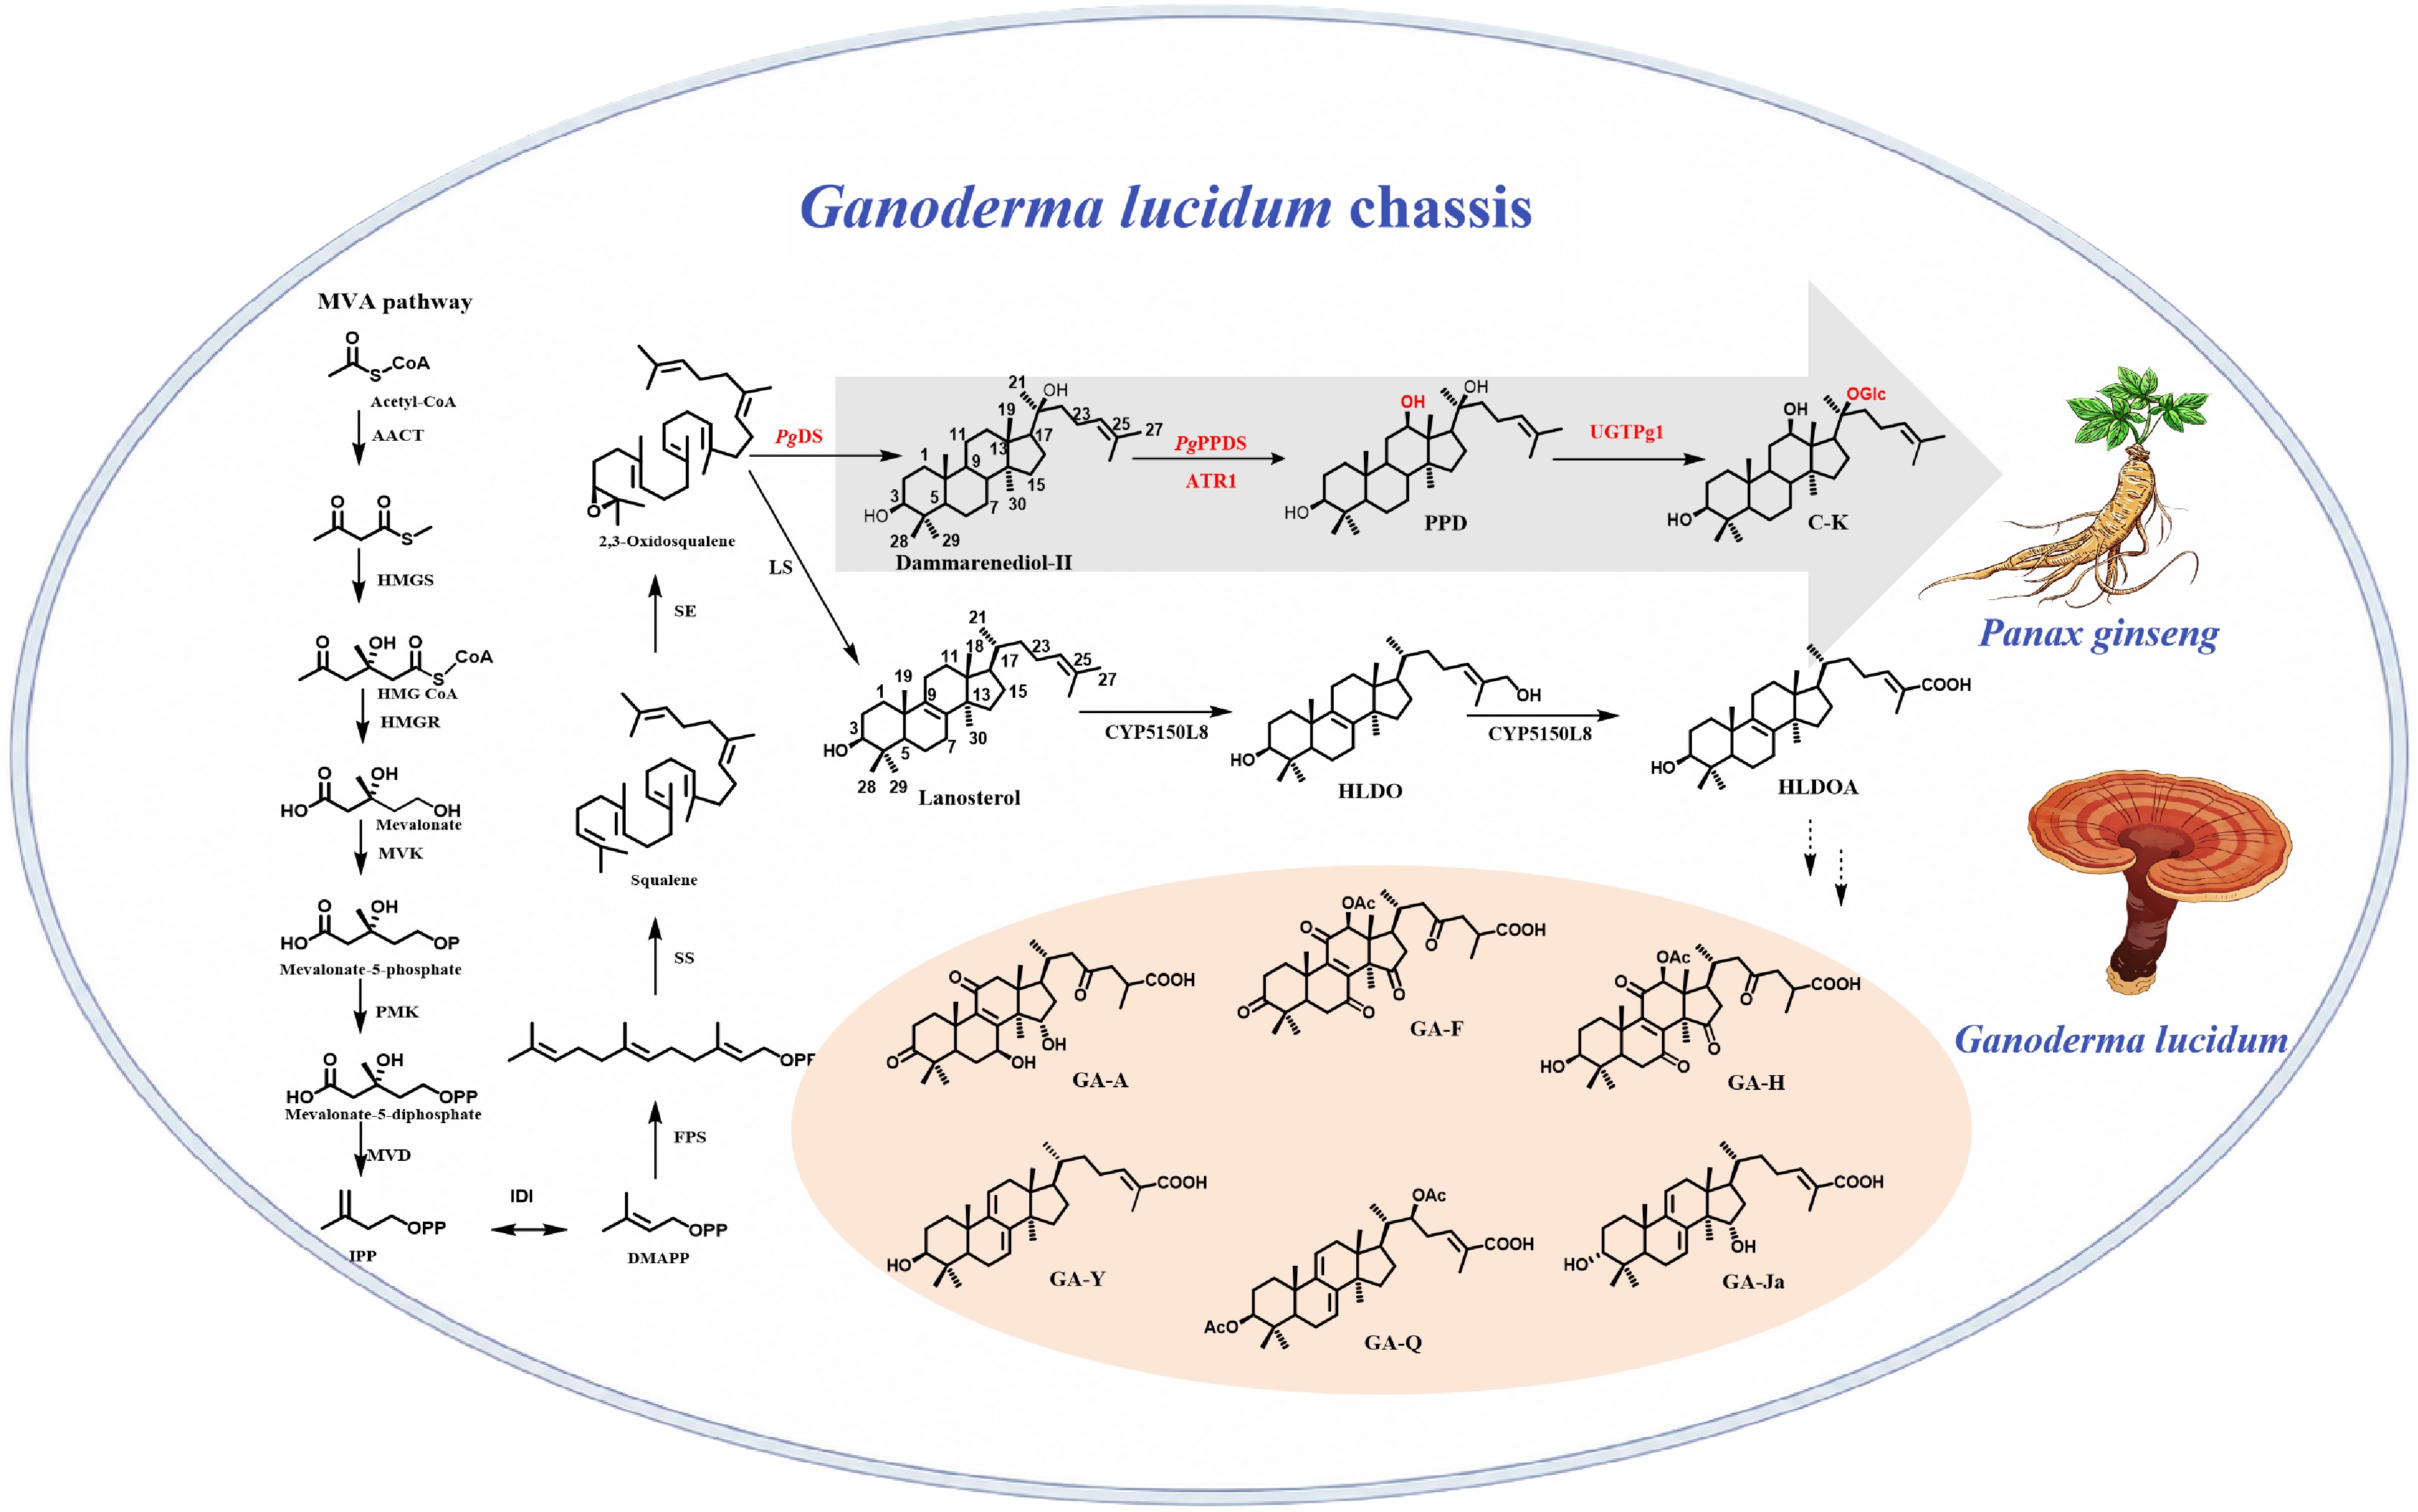
Figure 1.
Biosynthetic pathways of ganoderic acids and the ginsenoside CK. AATC, acetoacetyl-Coenzyme A (CoA) thiolase; HMGS, HMG-CoA synthase; HMGR, HMG-CoA reductase; MVK, mevalonate kinase; PMK, phosphomevalonate kinase; MVD, mevalonate diphosphate decarboxylase; IPP, Isopentenyl pyrophosphate; DMAPP, Dimethylallyl pyrophosphate; FPS, farnesyl diphosphate synthase; SS, squalene synthase; SE, squalene epoxidase; LS, lanosterol synthase; PgDS, dammarenediol II synthase from P. ginseng; PgPPDS, protopanaxadiol synthase from P. ginseng; ATR1, cytochrome P450 reductase; UGTPg1, UDP-glycosyltransferase 1 from P. ginseng; HLDO, 3-hydroxy-lanosta-8,24-dien-26-ol; HLDOA, 3-hydroxy-lanosta-8,24-dien-26-oic acid; GA, ganoderic acid).
-
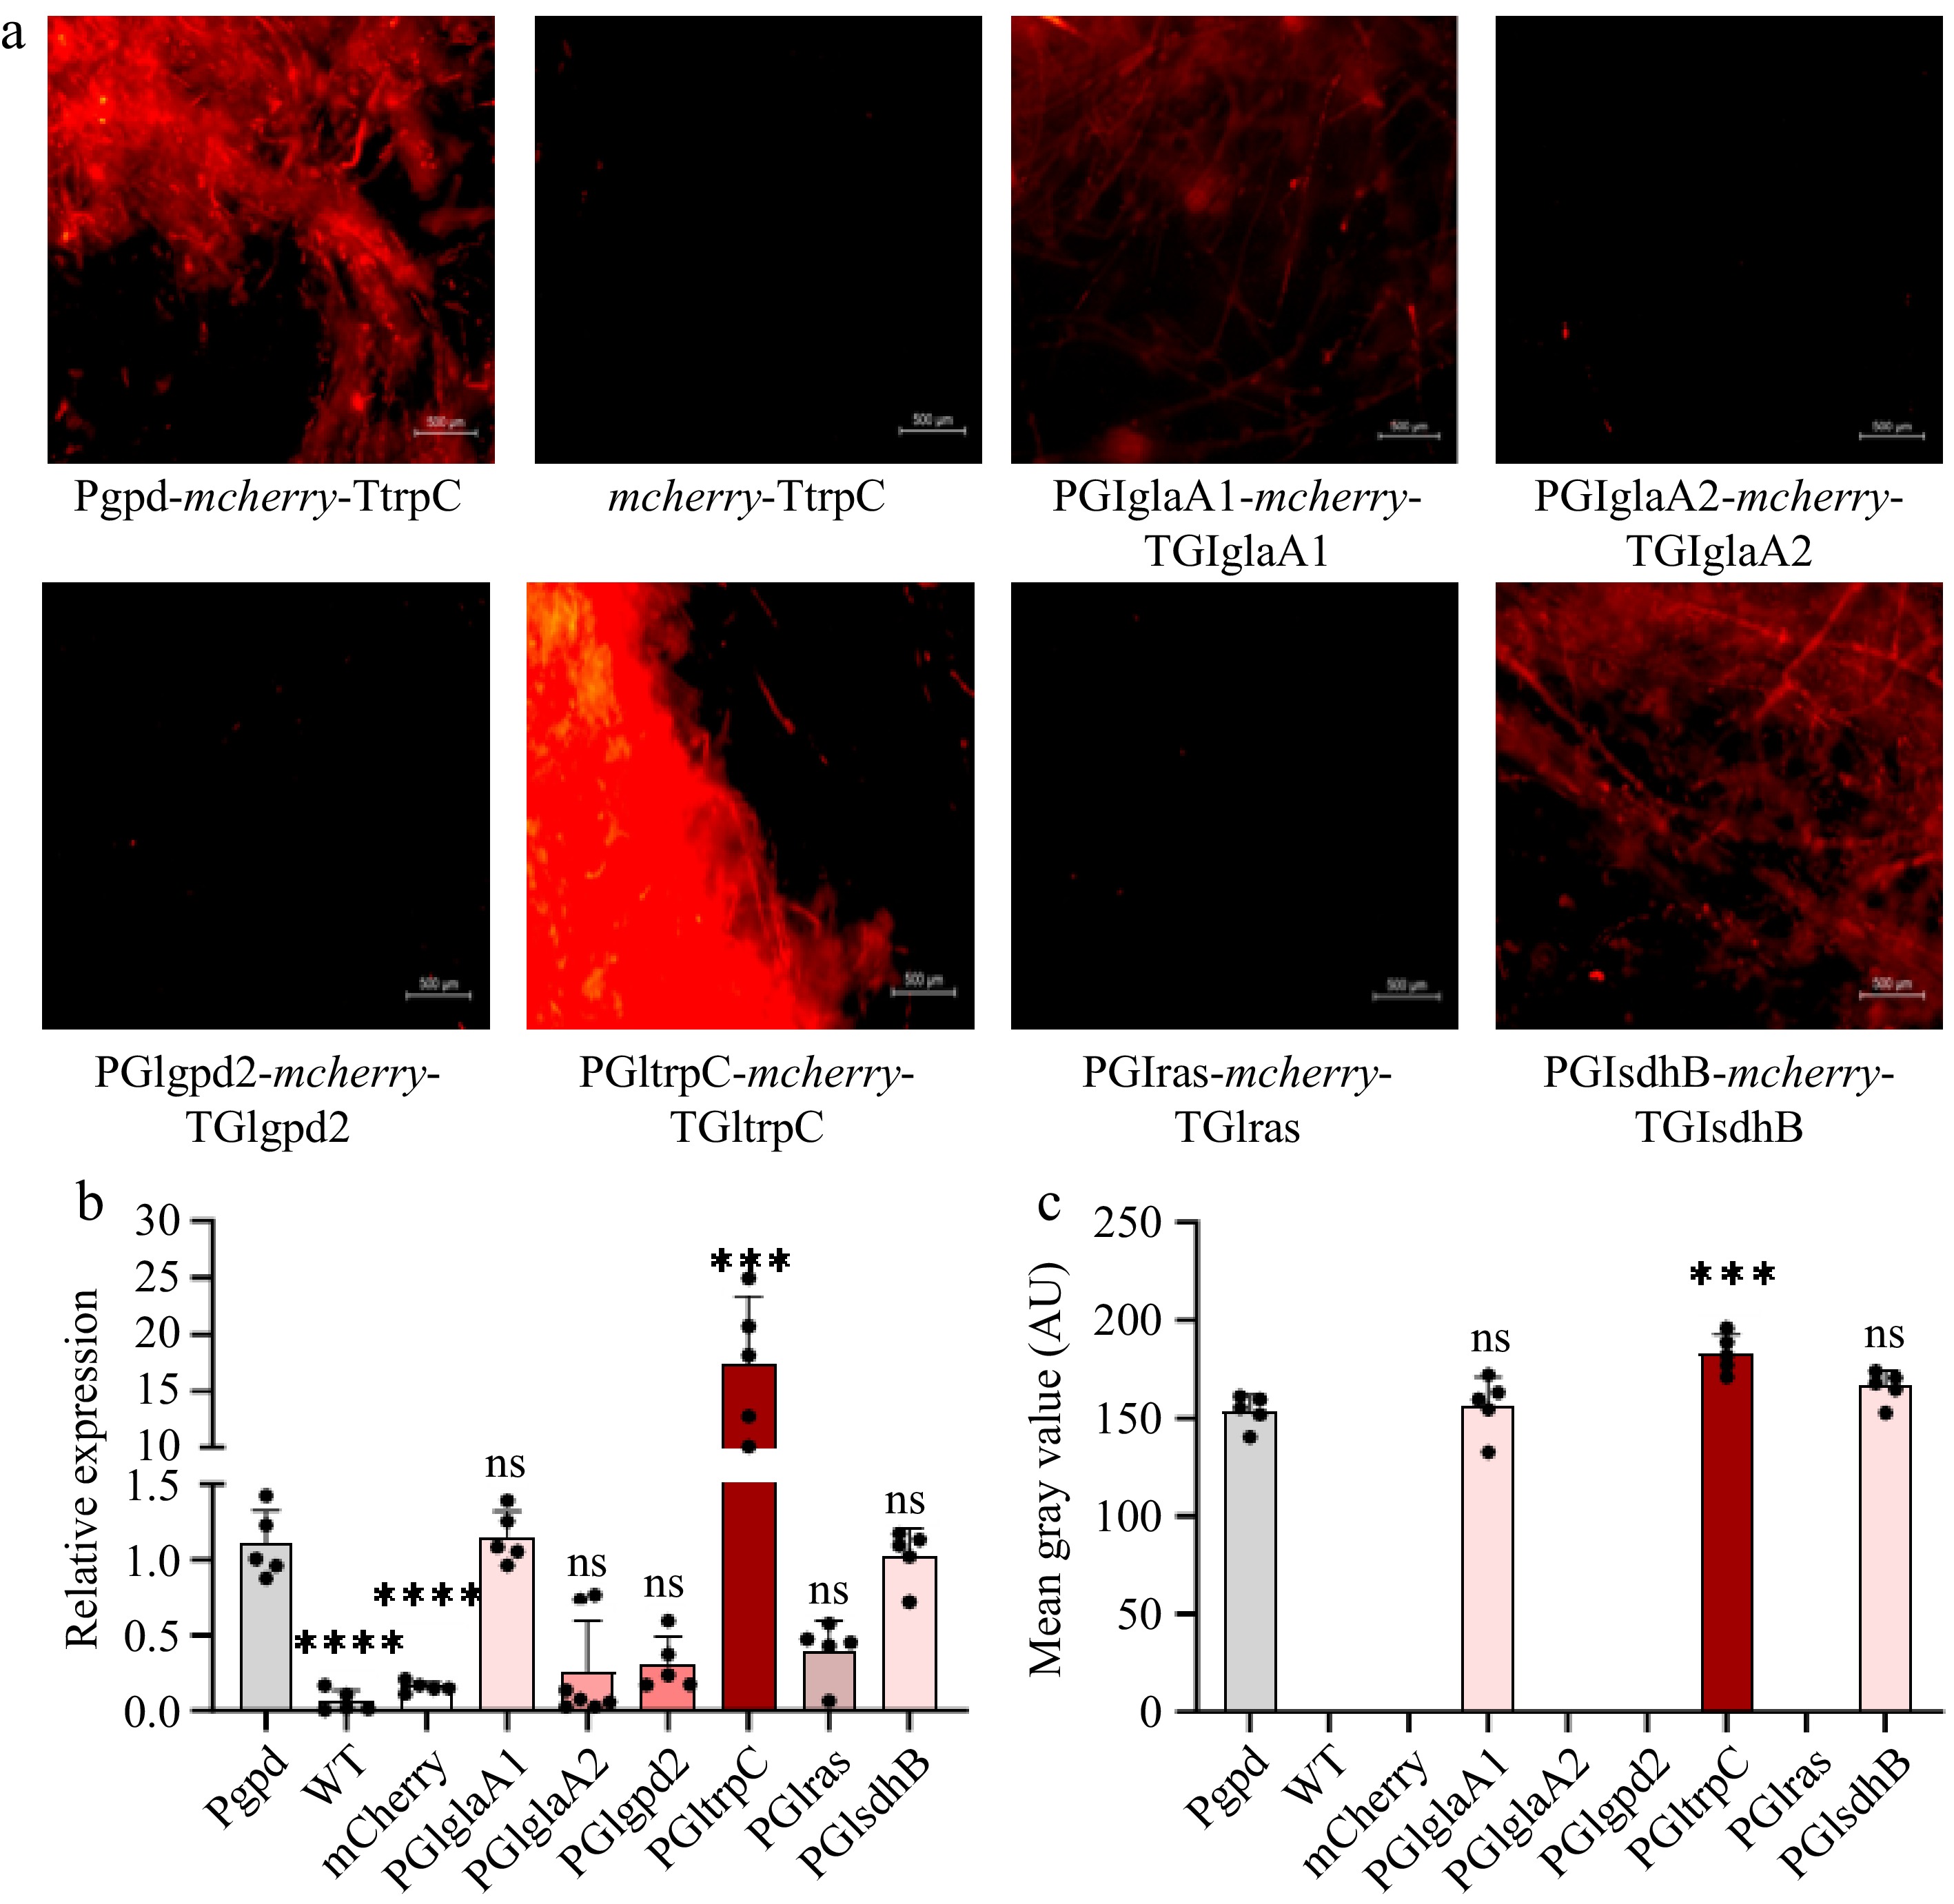
Figure 2.
Verification of candidate gene promoter and terminator activities via Agrobacterium-mediated transformation of G. lucidum protoplasts. (a) mCherry transformants observed by fluorescence microscopy. (b) Relative expression level of mCherry in transformants. (c) Fluorescence intensity of transformants analyzed by ImageJ. Data are shown as the mean ± SD (n = 5 independent biological replicates); error bars represent the SD. Statistical significance was determined by Student's t-test against the Pgpd control (ns, not significant; *** p < 0.001, **** p < 0.0001).
-
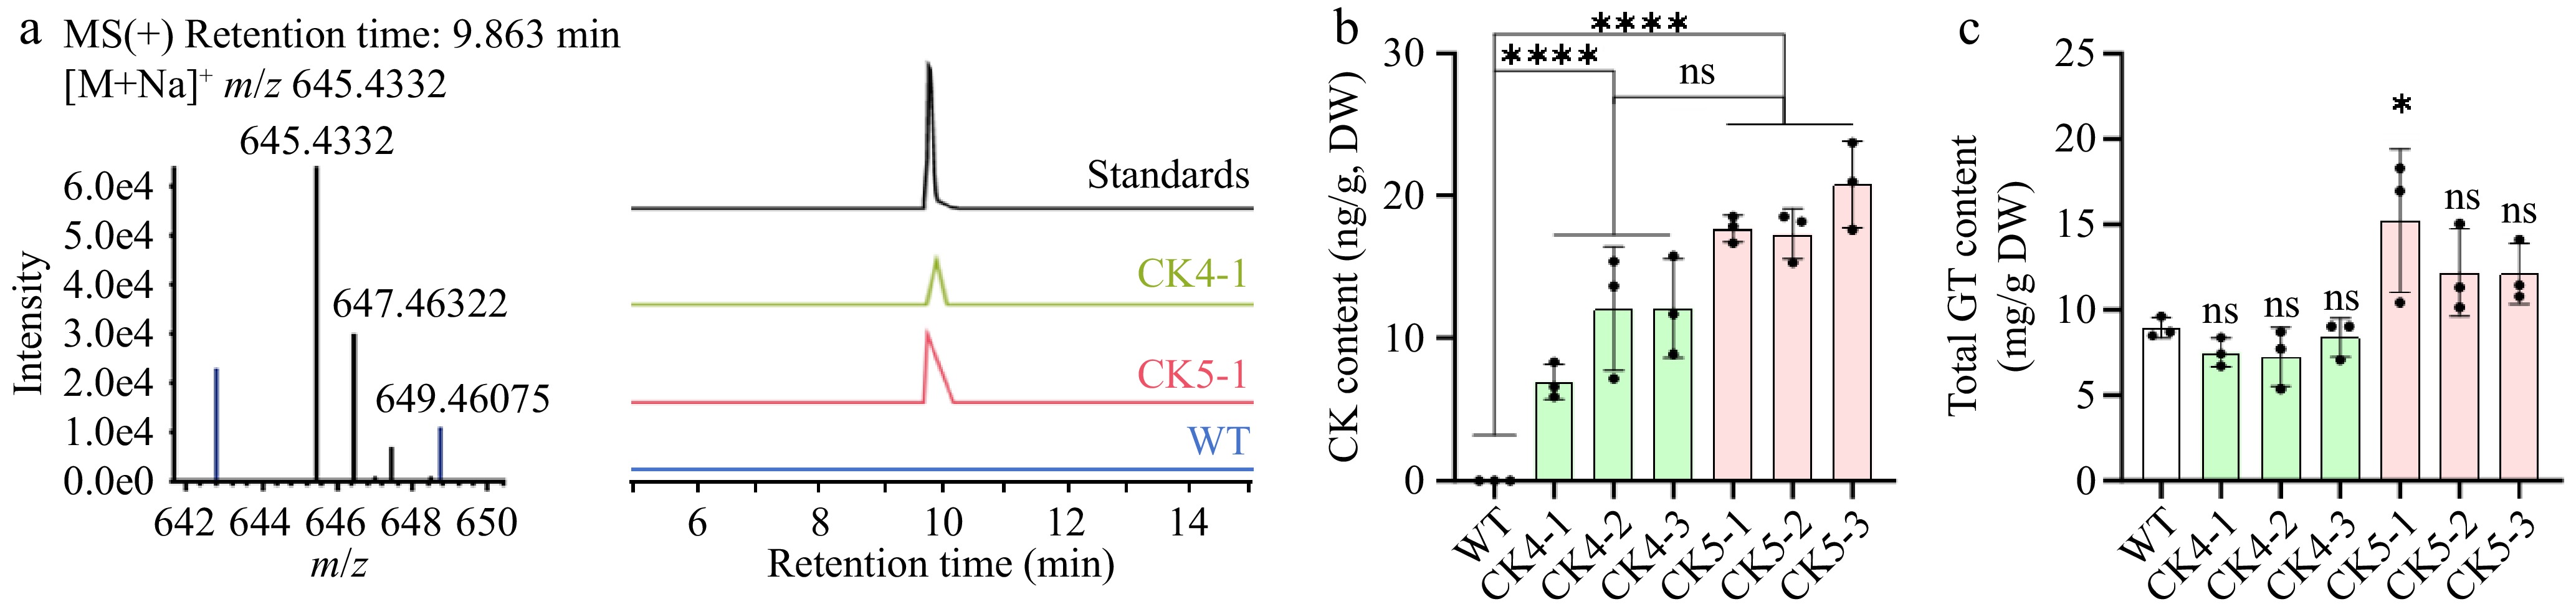
Figure 3.
Detection of strains transformed with genes in the CK biosynthesis pathway. (a) Determination of ginsenoside CK in CK4- and CK5-transformed strains by liquid chromatography–mass spectroscopy (LC-MS). (b) Determination of the content of the ginsenoside CK in CK4- and CK5-transformed strains. (c) Total ganoderma triterpenoid content in CK4- and CK5- transformed strains. Data are shown as the mean ± SD (n = 3 biological replicates); error bars represent the SD. Statistical significance was determined by one-way analysis of variance followed by Dunnett's post hoc test against the wild-type control (ns, not significant; * p < 0.01, **** p < 0.0001).
Figures
(3)
Tables
(0)