-
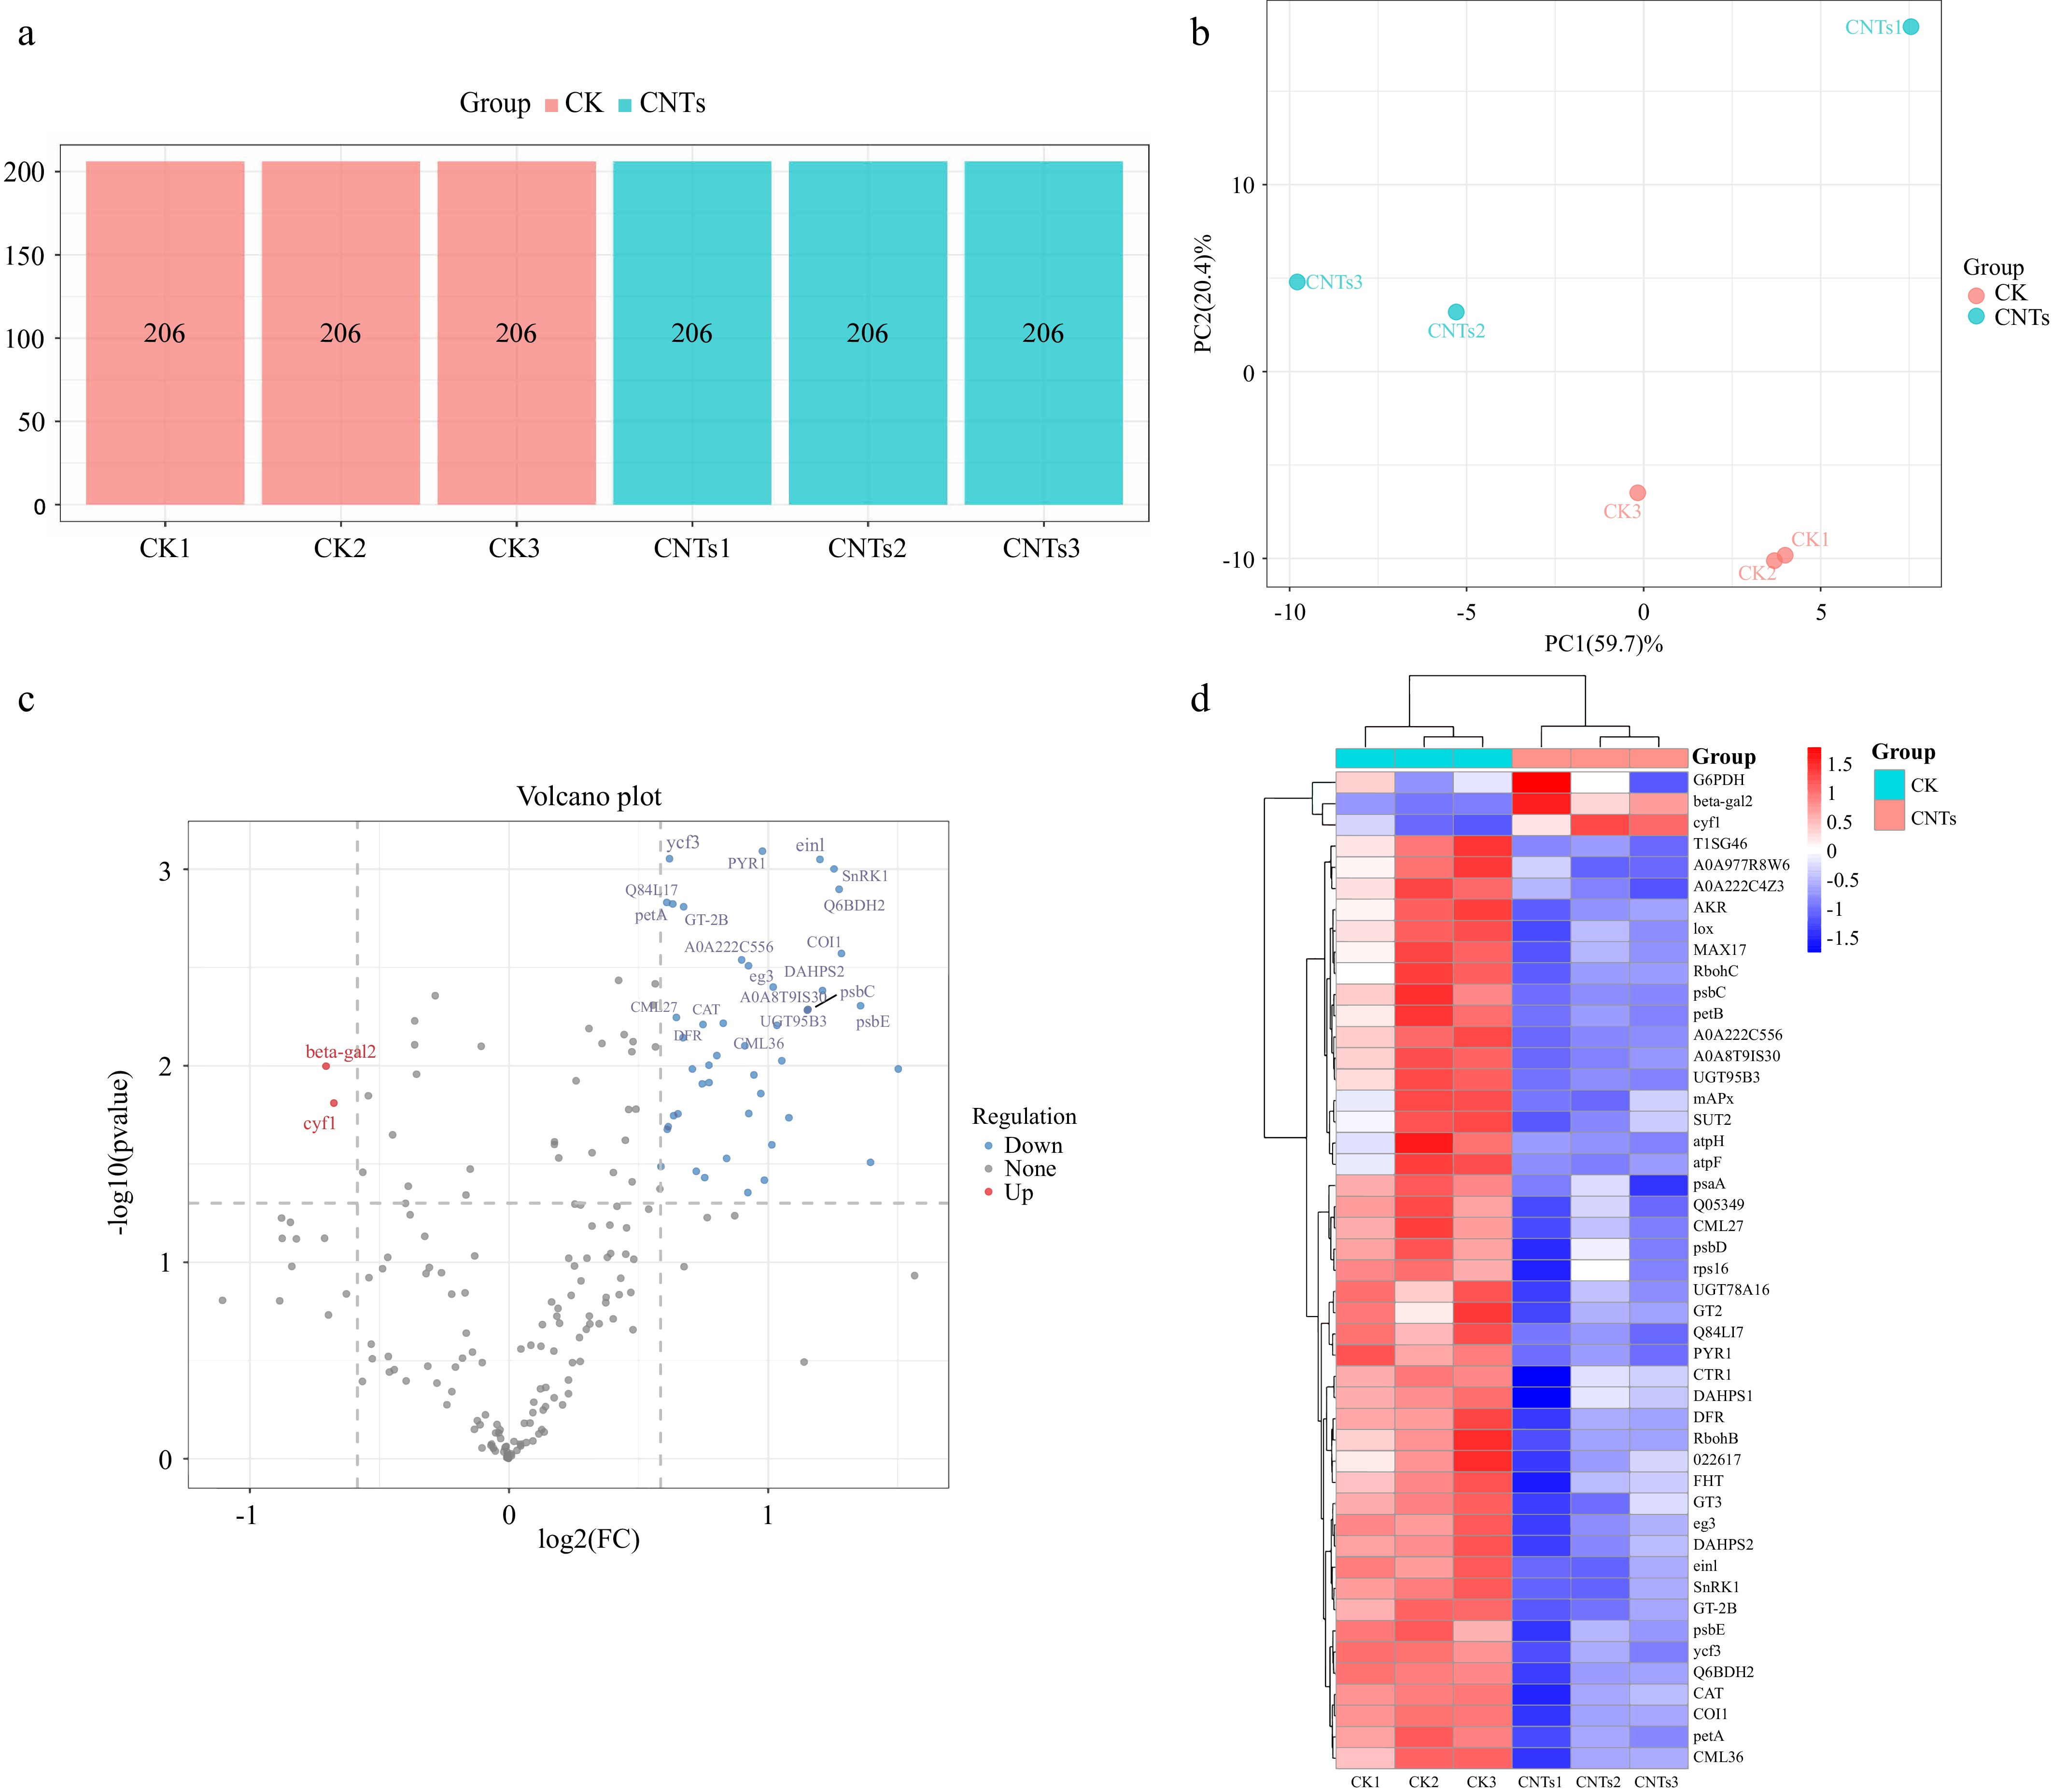
Figure 1.
Protein quantitative analysis of strawberry adventitious roots treated with FCNTs. (a) Number of identified proteins in each sample in the CK and CNTs groups; (b) PCA score plot showing the distribution of global proteomic profiles between CK and FCNT-treated groups; (c) Volcano plot of DAPs. The x-axis represents the log2 fold change of protein abundance, while the y-axis represents statistical significance (−log10 p-value). Red dots indicate significantly downregulated proteins, and blue dots indicate significantly upregulated proteins (p < 0.05, t-test); and (d) Heatmap showing the expression patterns of all DAPs between the CK and CNTs groups. Proteomic analyses were performed using three biological replicates per group (n = 3).
-
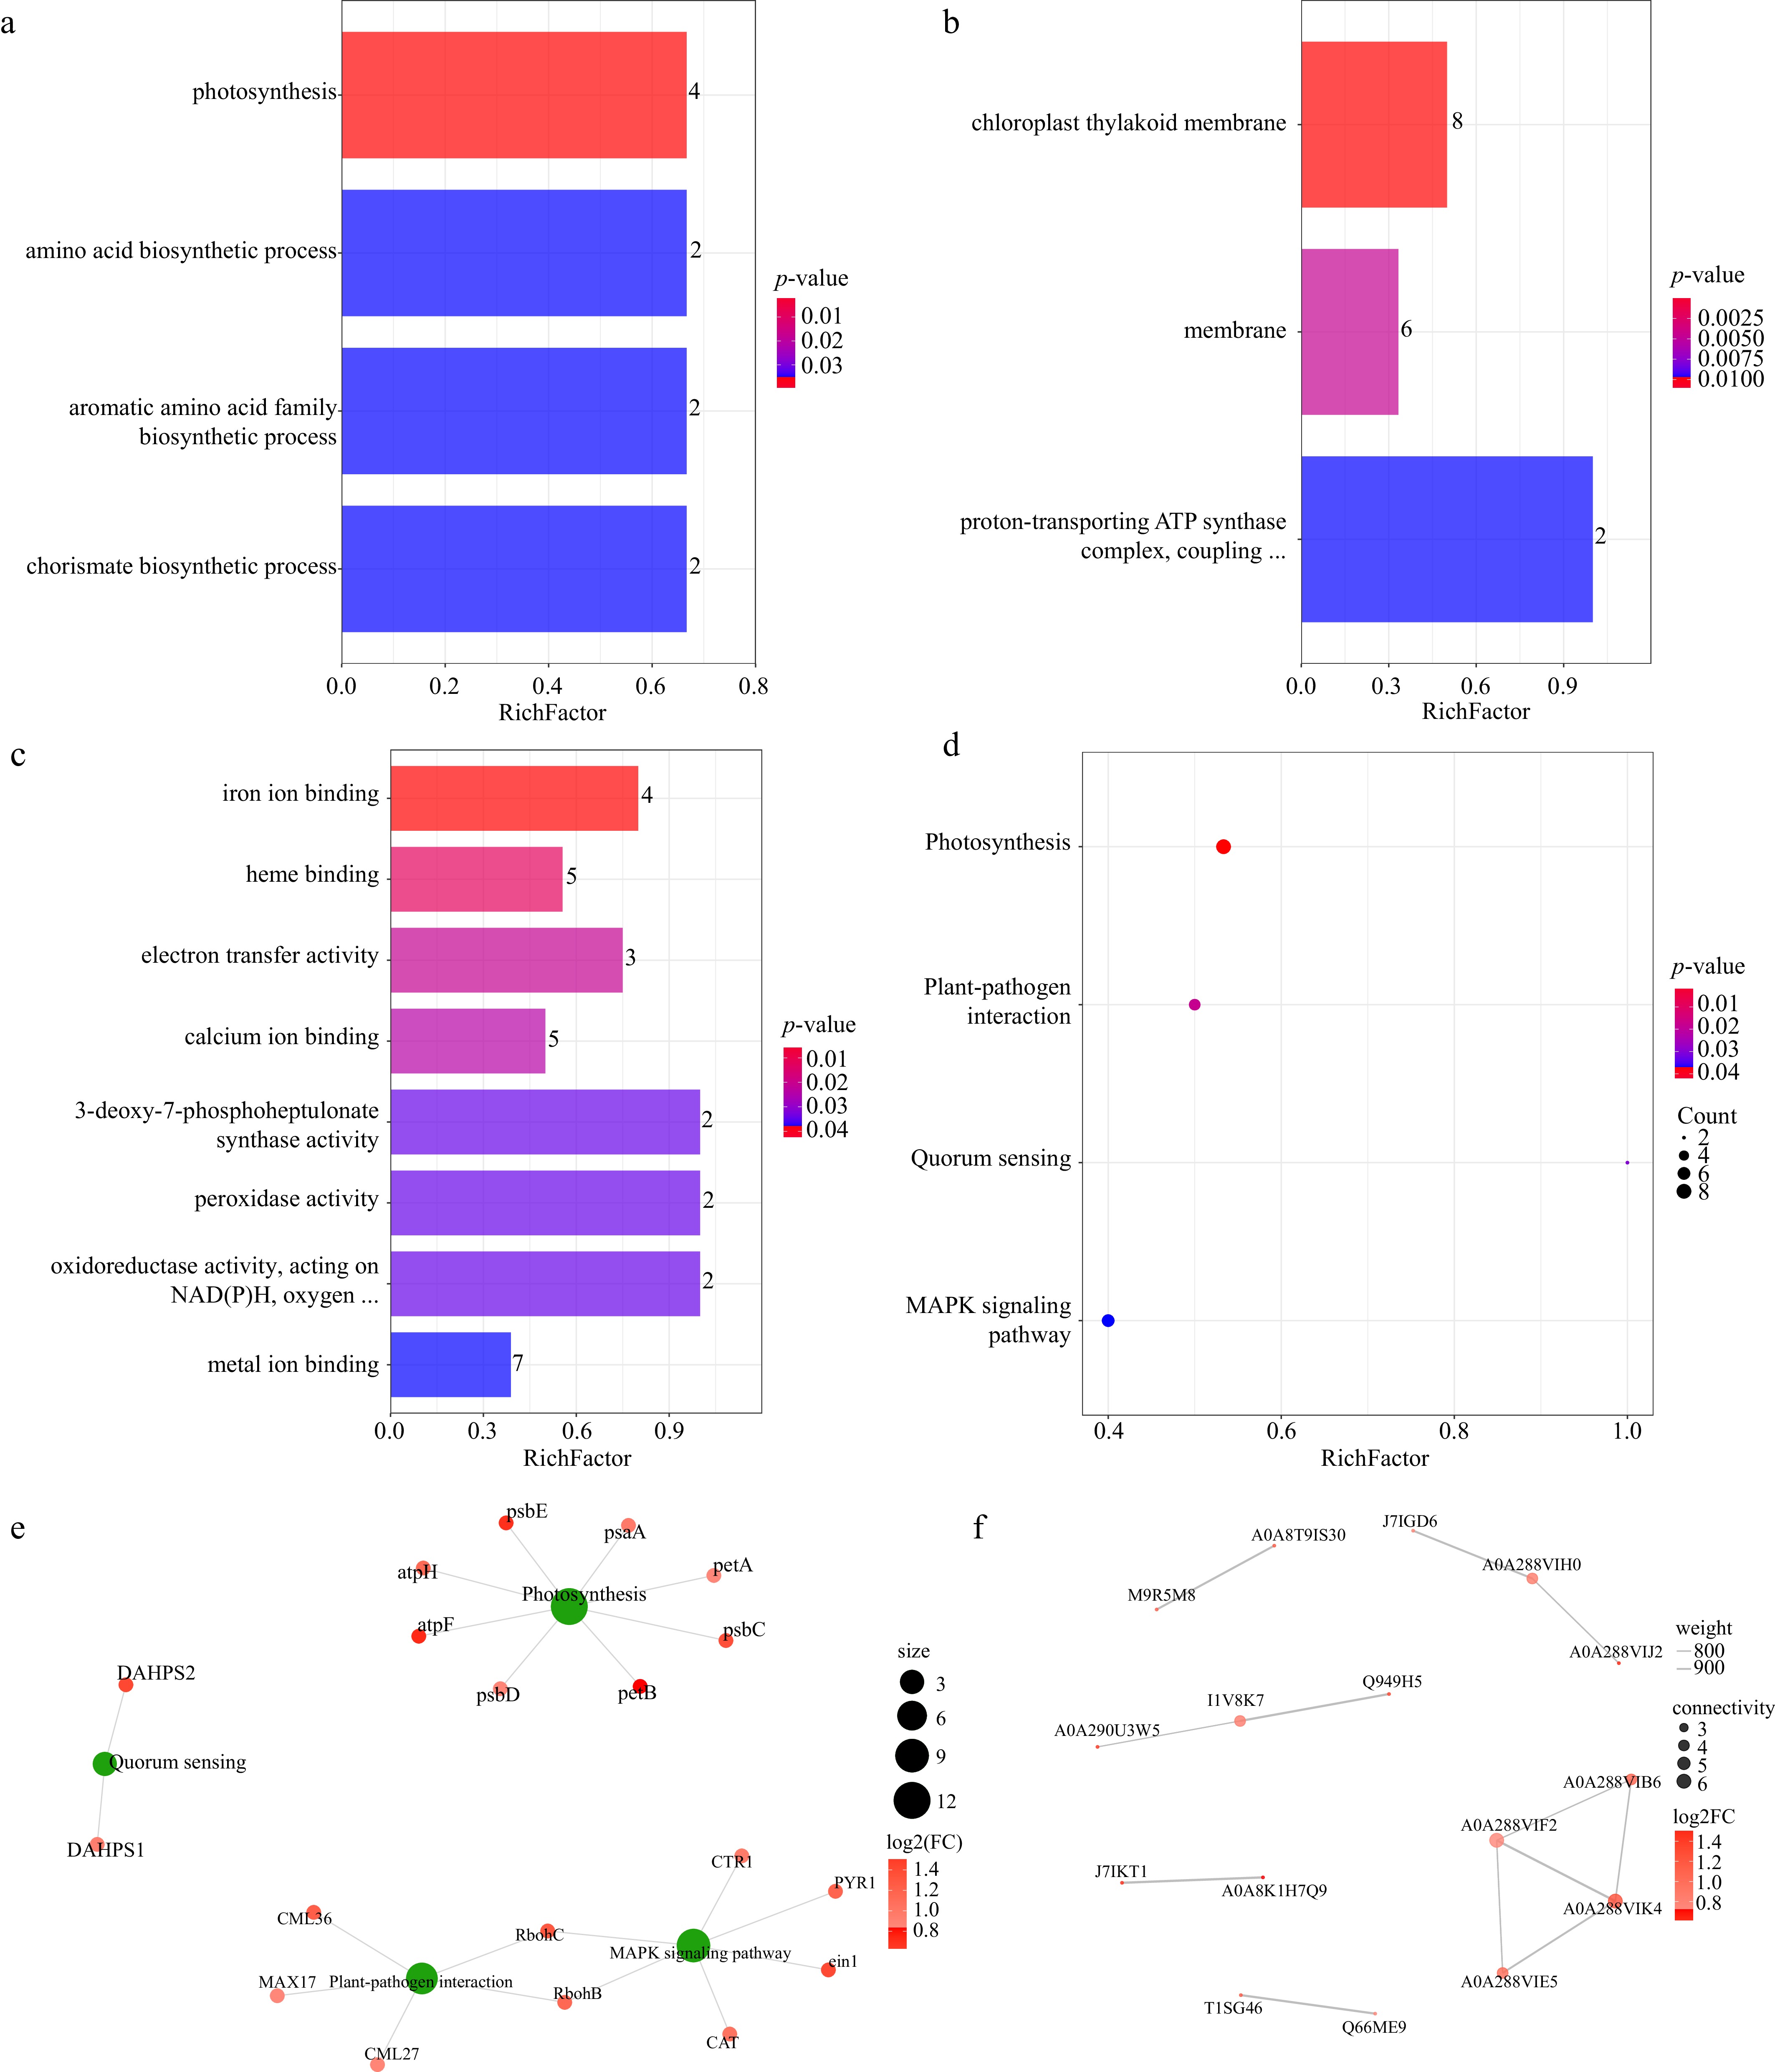
Figure 2.
Functional enrichment and interaction network analysis of DAPs in strawberry adventitious roots following FCNT treatment. (a) Bar chart for GO enrichment analysis of biological processes enrichment; (b) GO enrichment analysis of cellular component categories; (c) GO enrichment analysis of molecular function categories; (d) bubble chart for KEGG pathway enrichment. The x-axis represents the enrichment factor, and the y-axis shows the enriched KEGG pathways. Color intensity reflects the level of statistical significance, while bubble size corresponds to the number of DAPs associated with each pathway; (e) KEGG pathway enrichment and the DAPs network plot. Red nodes represent DAPs, whereas green nodes denote significantly enriched KEGG pathways; and (f) protein–protein interaction network of DAPs. Each node represents a protein, and red-colored nodes indicate DAPs. The intensity of the red color corresponds to the magnitude of the log2FC in protein abundance. Proteomic analyses were performed using three biological replicates per group (n = 3).
-
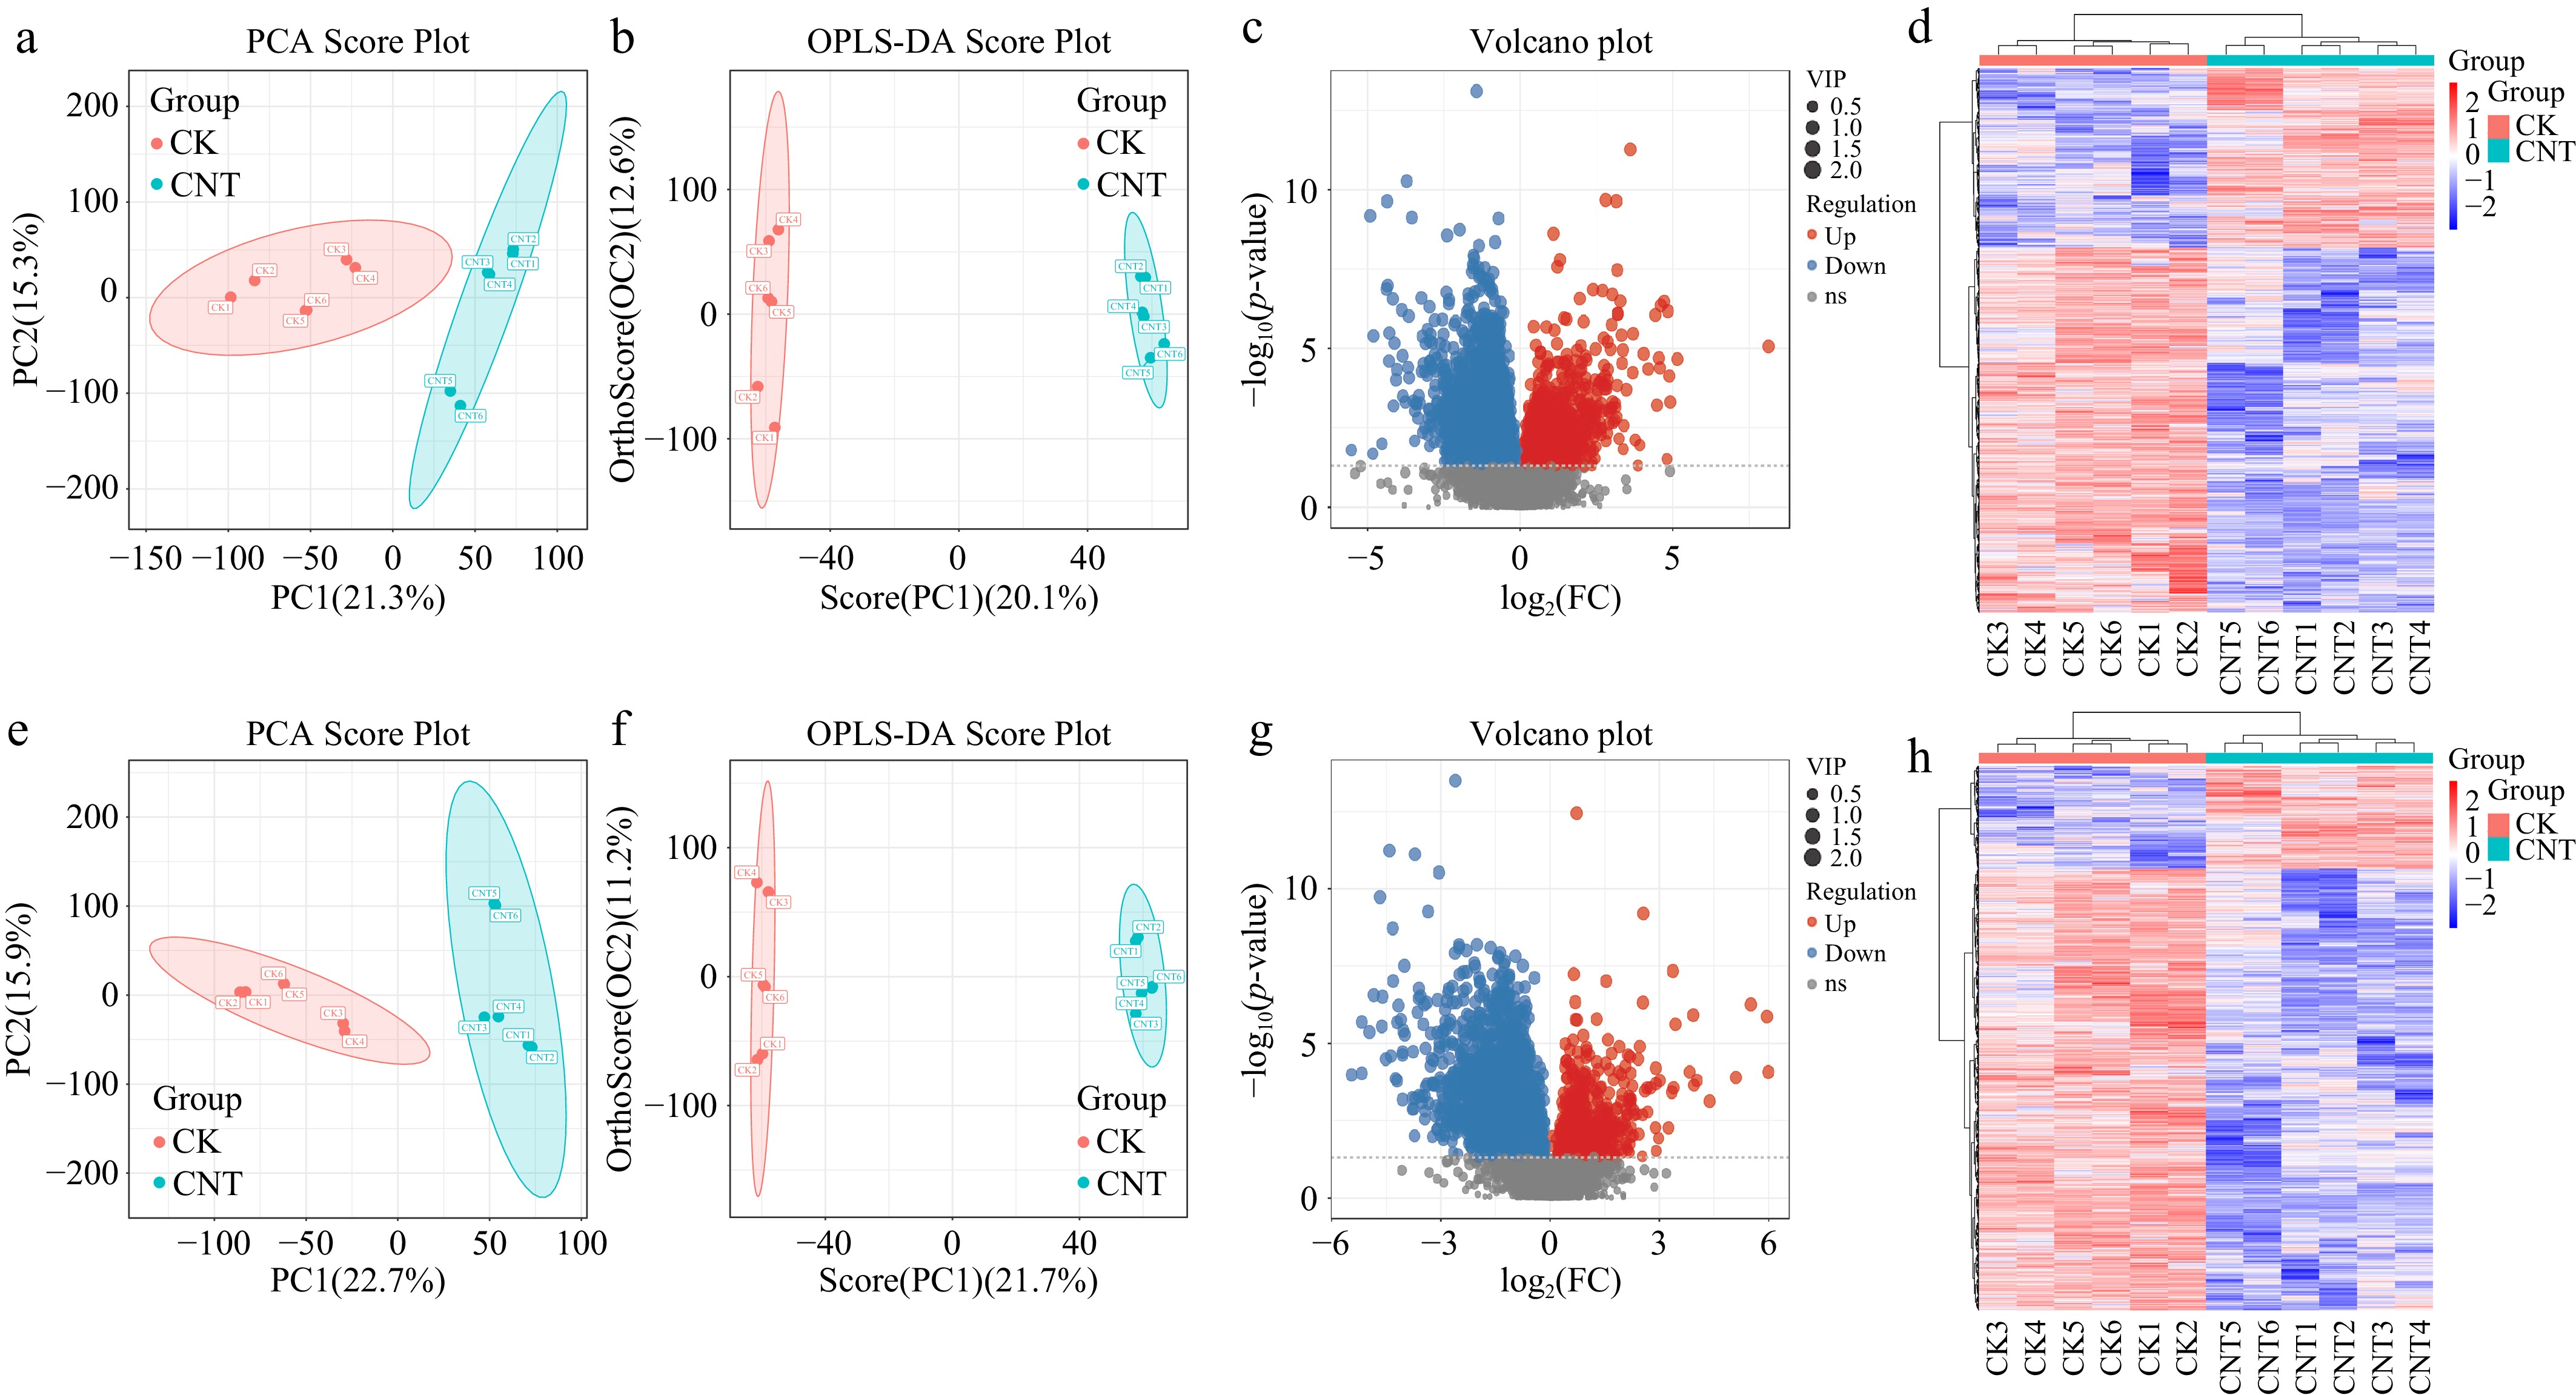
Figure 3.
Metabolomic profiling and differential metabolite analysis of strawberry adventitious roots following FCNT treatment. PCA score plots generated from metabolomic data acquired in (a) positive and (e) negative ionization modes. Each point represents an individual sample; ellipses indicate the 95% confidence intervals, and colors distinguish the experimental groups. OPLS-DA score plots in (b) positive and (f) negative ionization modes. The horizontal axis represents intergroup variation, whereas the vertical axis reflects intragroup variation. Greater clustering of samples within groups and clearer separation between groups indicate stronger model discrimination. Volcano plots of differential metabolite features identified in (c) positive and (g) negative ionization modes. Red dots represent significantly upregulated metabolite features, while blue dots represent significantly downregulated metabolite features (VIP > 1.0, p < 0.05, t-test). Heatmaps illustrating the abundance patterns of all differential metabolite features detected in (d) positive and (h) negative ionization modes. Note: Metabolomic analyses were performed using six biological replicates per group (n = 6).
-
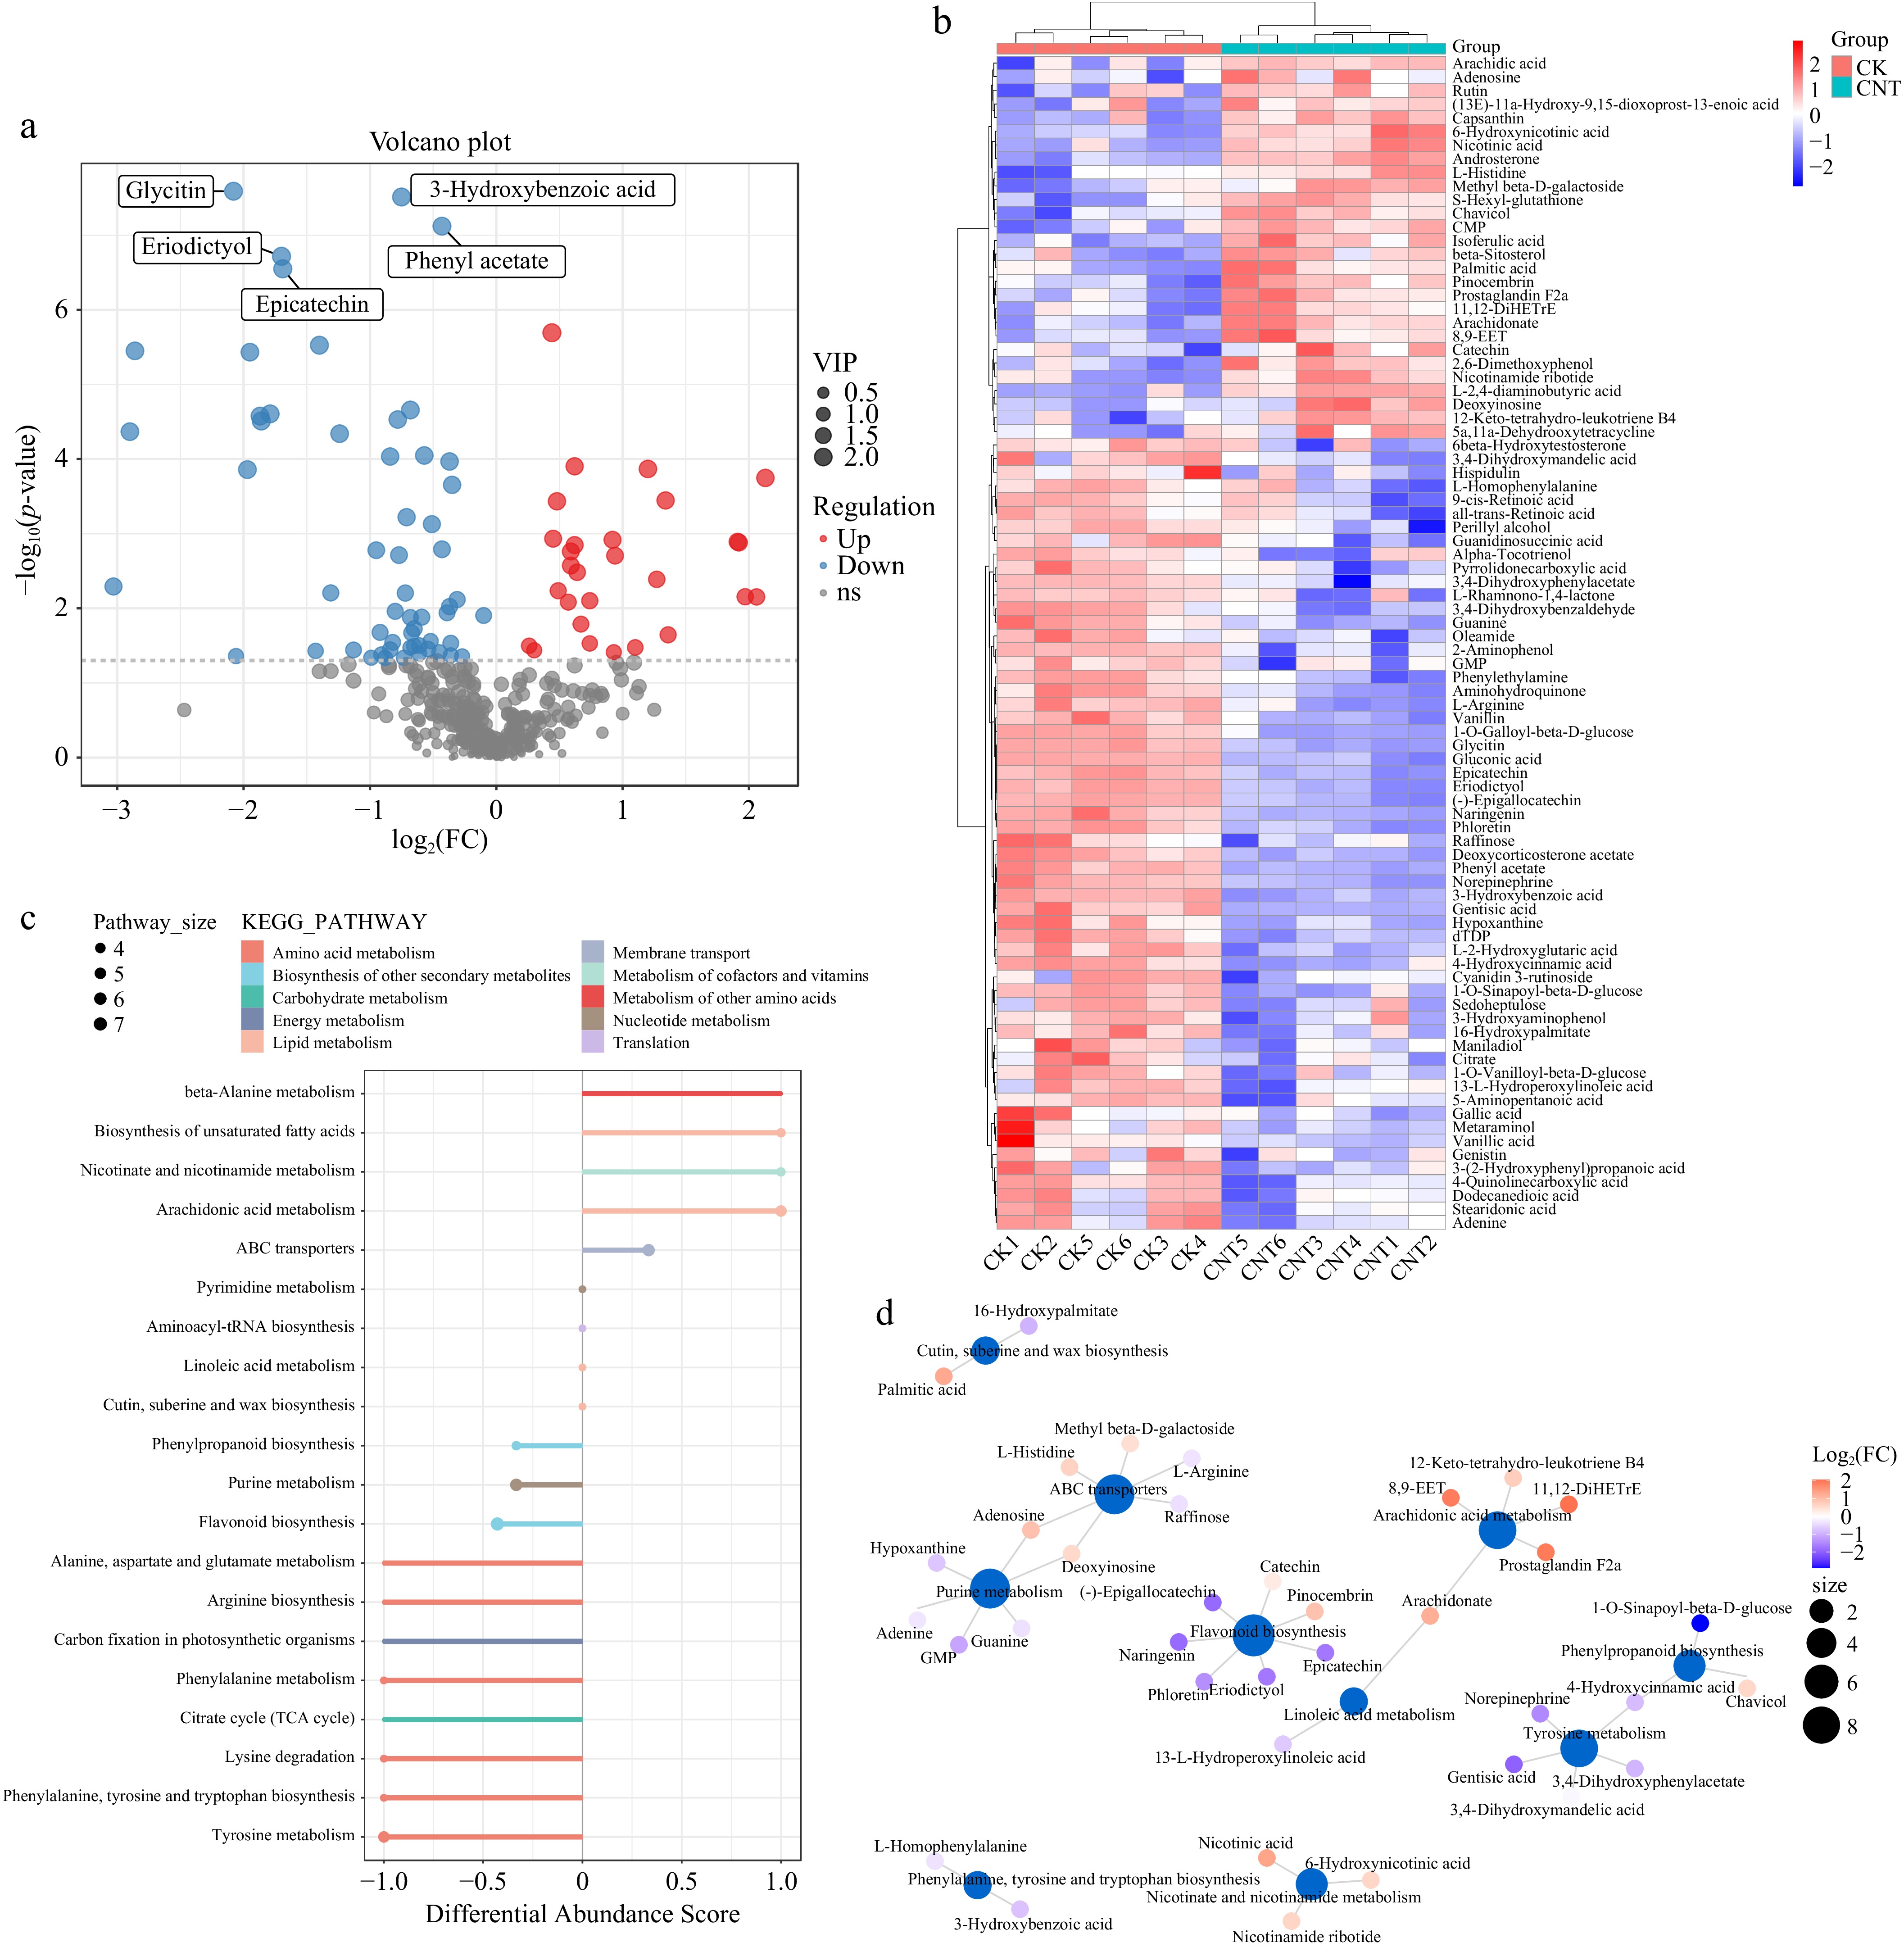
Figure 4.
Functional annotation and pathway analysis of DAMs in strawberry adventitious roots treated with FCNTs. (a) Volcano plot of identified DAMs. Red dots indicate significantly upregulated metabolites, while blue dots indicate significantly downregulated metabolites; (b) Heatmap of the 86 identified DAMs. Columns represent samples and rows represent metabolites. The dendrogram on the left illustrates hierarchical clustering of metabolites, while the top dendrogram represents clustering of samples; (c) Differential enrichment score map of KEGG pathway. The x-axis represents DA-score values, calculated as (number of upregulated metabolites − number of downregulated metabolites) divided by the total number of different metabolites within a pathway. The y-axis represents the corresponding metabolic pathways. The size of the points indicates the number of DAMs enriched in each pathway; and (d) Network diagram of the KEGG pathway. Blue nodes represent KEGG pathways, whereas other nodes correspond to metabolites. The size of pathway nodes reflects the number of connected metabolites, with larger nodes indicating higher metabolite connectivity. Metabolite node color represents the magnitude of log2 fold change (log2FC), where red indicates upregulation and blue indicates downregulation, with increasing color intensity corresponding to greater magnitude of change. Metabolites associated with multiple group comparisons do not contain log2FC information. (Metabolomic analyses were performed using six biological replicates per group).
-
Protein_ID Protein_name CK_average CNTs_average log2(FC) A0A8K1H7Q9 Cytochrome b6 305.03 107.70 1.50 A0A288VIJ2 ATP synthase subunit b, chloroplastic (ATP synthase F[0] sector subunit b) (ATPase subunit I) 589.53 224.20 1.39 J7IKT1 Cytochrome b559 subunit alpha (PSII reaction center subunit V) 2,246.03 877.27 1.36 A0A290U3W5 Coronatine insensitive 1 protein 1,656.00 680.67 1.28 Q6BDH2 Aldo-keto reductase 1,125.93 465.67 1.27 A0A7S7YNU4 Non-specific serine/threonine protein kinase (EC 2.7.11.1) 340.90 142.93 1.25 A0A1J0CL90 Phospho-2-dehydro-3-deoxyheptonate aldolase (EC 2.5.1.54) 4,669.27 2,019.10 1.21 Q949H5 Ethylene receptor 503.33 219.13 1.20 A0A288VIK4 Photosystem II CP43 reaction center protein (PSII 43 kDa protein) (Protein CP-43) 14,642.80 6,581.93 1.15 A0A387IZT7 UDP-glucose glucosyltransferase 363.33 163.60 1.15 A0A1L4A1Q8 Respiratory burst oxidase-like protein C 1,659.03 784.77 1.08 T1SG46 Flavonoid 3'-hydroxylase 1,029.57 496.43 1.05 A0A6B9IJV4 Putative calcium-binding protein 1,202.87 591.10 1.03 A0A8T9IS30 L-galactose-1,4-lactone dehydrogenase 1,716.90 847.00 1.02 A0A288VIB6 30S ribosomal protein S16, chloroplastic 559.57 277.07 1.01 M9R5M8 L-ascorbate peroxidase (EC 1.11.1.11) 1,061.97 536.43 0.99 F2YHU9 Abscisic acid receptor PYR1 1129.13 573.33 0.98 Q5Y381 Aldo/keto reductase 457.13 233.13 0.97 A0A1L4A1N8 Respiratory burst oxidase-like protein B 404.30 210.03 0.94 Table 1.
Top 20 most significantly downregulated DAPs in strawberry adventitious roots following CNT treatment.
-
ID Name CK_average CNTs_average CNTs / CK M119T70 L-2,4-diaminobutyric acid 1,007,703.00 4,401,371.01 4.37 M321T592 11,12-DiHETrE 7,664,427.76 32,035,611.99 4.18 M397T679_1 beta-Sitosterol 10,801,962.03 42,345,514.14 3.92 M337T499 Prostaglandin F2a 1,261,350.64 4,769,852.20 3.78 M321T496 8,9-EET 1,069,183.37 4,029,598.42 3.77 M312T607 Arachidic acid 13,417,653.53 34,554,717.71 2.58 M124T638 Nicotinic acid 519,275,804.12 1,315,273,210.08 2.53 M255T652 Palmitic acid 309,187,712.76 746,766,562.00 2.42 M101T667 N-Nitroso-pyrrolidine 3,144,017.89 7,461,655.43 2.37 M305T576 Arachidonate 9,696,915.33 4,208,295.92 2.30 M273T317 Naringenin 16,287,012.19 4,493,655.45 0.28 M287T247 (-)-Epigallocatechin 12,874,873.03 3,523,501.98 0.27 M371T539_1 Deoxycorticosterone acetate 16,631,141.99 4,303,953.59 0.26 M153T240 Gentisic acid 18,999,244.36 4,846,269.29 0.26 M425T545 Alpha-Tocotrienol 14,465,691.80 3,473,684.87 0.24 M445T342 Glycitin 2,293,867.67 543,753.59 0.24 M150T72_1 L-Methionine 40501046.53 7304786.26 0.18 M331T55 1-O-Galloyl-beta-D-glucose 22159229.12 3042351.85 0.14 M369T258 1-O-Sinapoyl-beta-D-glucose 18050656.08 2413092.93 0.13 M110T31 2-Aminophenol 88731260.23 10892561.07 0.12 Note: The dataset includes both upregulated and downregulated DAMs identified under FCNT treatment compared with the CK, with 10 metabolites showing increased and 10 showing decreased abundance. Table 2.
Top 20 identified DAMs in strawberry adventitious roots after CNTs treatment.
Figures
(4)
Tables
(2)