-
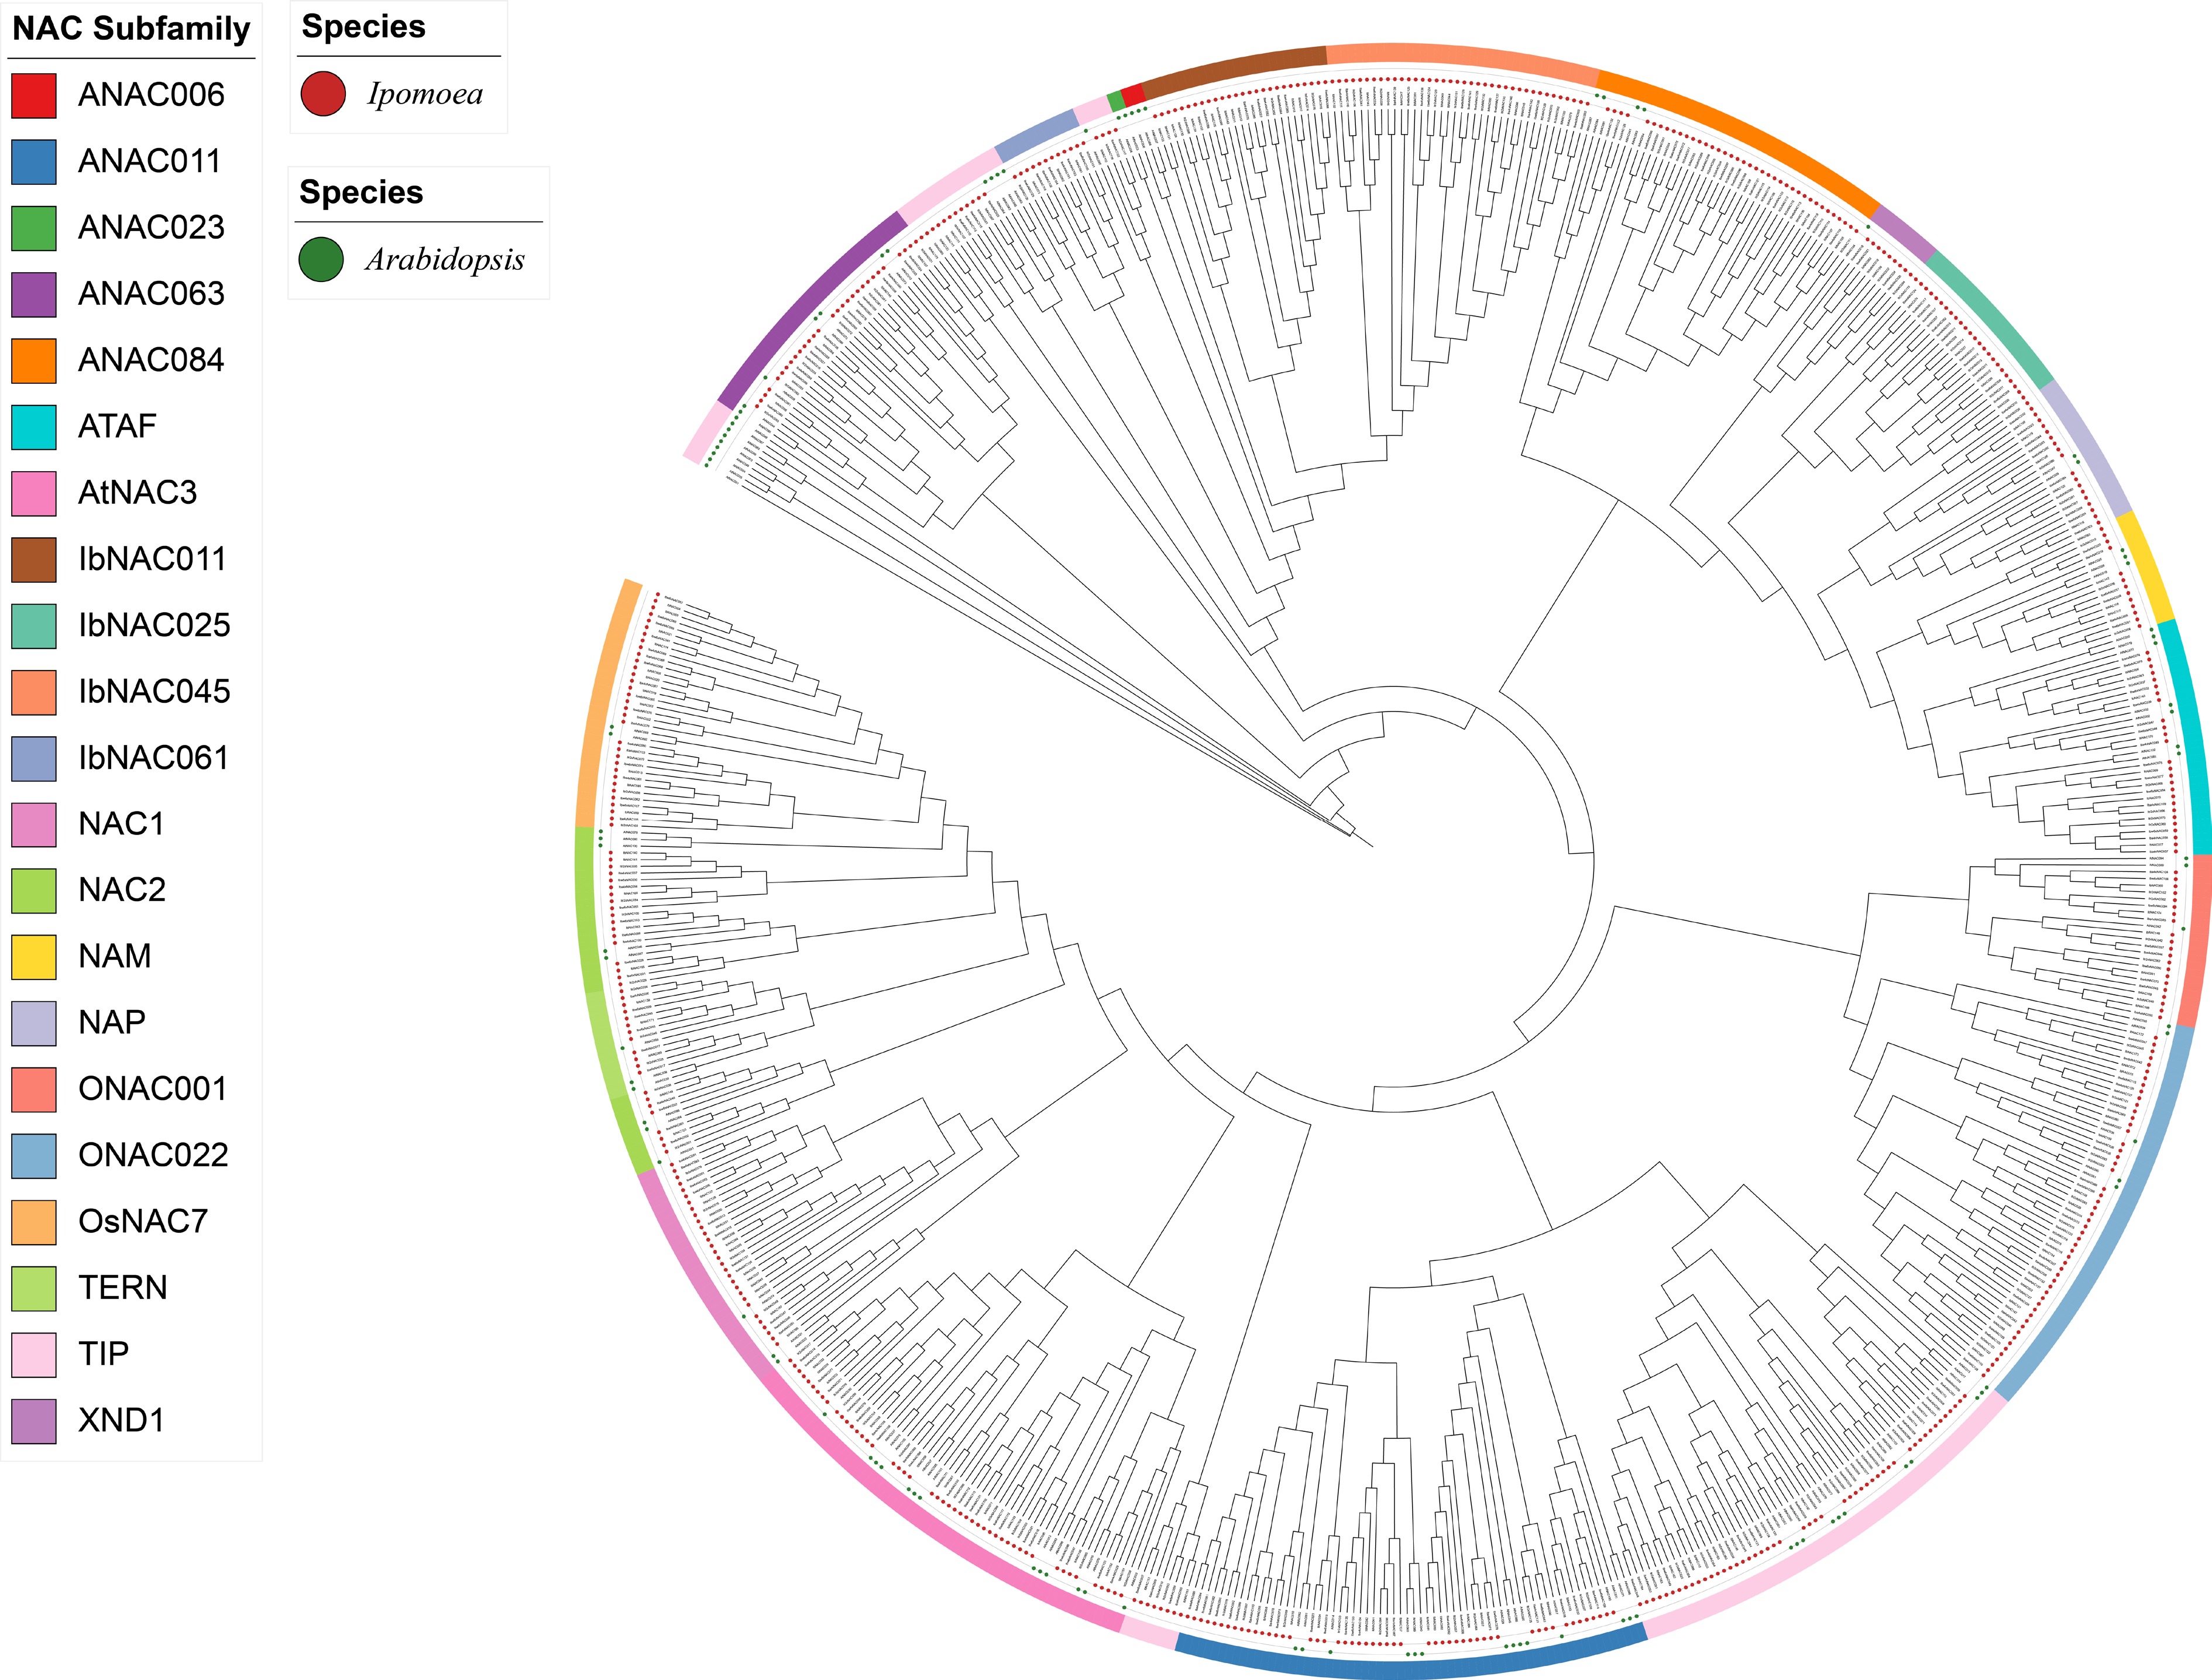
Figure 1.
Phylogenetic tree of the NAC gene family. Phylogenetic trees illustrate the evolutionary relationships between NAC family members in four 'sweetpotatoes', A. thaliana, and the published sweetpotato IbNAC proteins. All NAC sequences were categorized into 21 distinct subgroups, with each color-coded region representing a single subgroup. In the diagram, 'At' denotes A. thaliana, 'Itr2x' refers to Y22, 'Iba4x' represents Y428B, 'Ibw6x' indicates Y601, 'Iba6x' corresponds to NH, and 'IbNAC' represents the published sweetpotato. The names of the respective subfamilies are displayed in the lower-left corner of the figure.
-
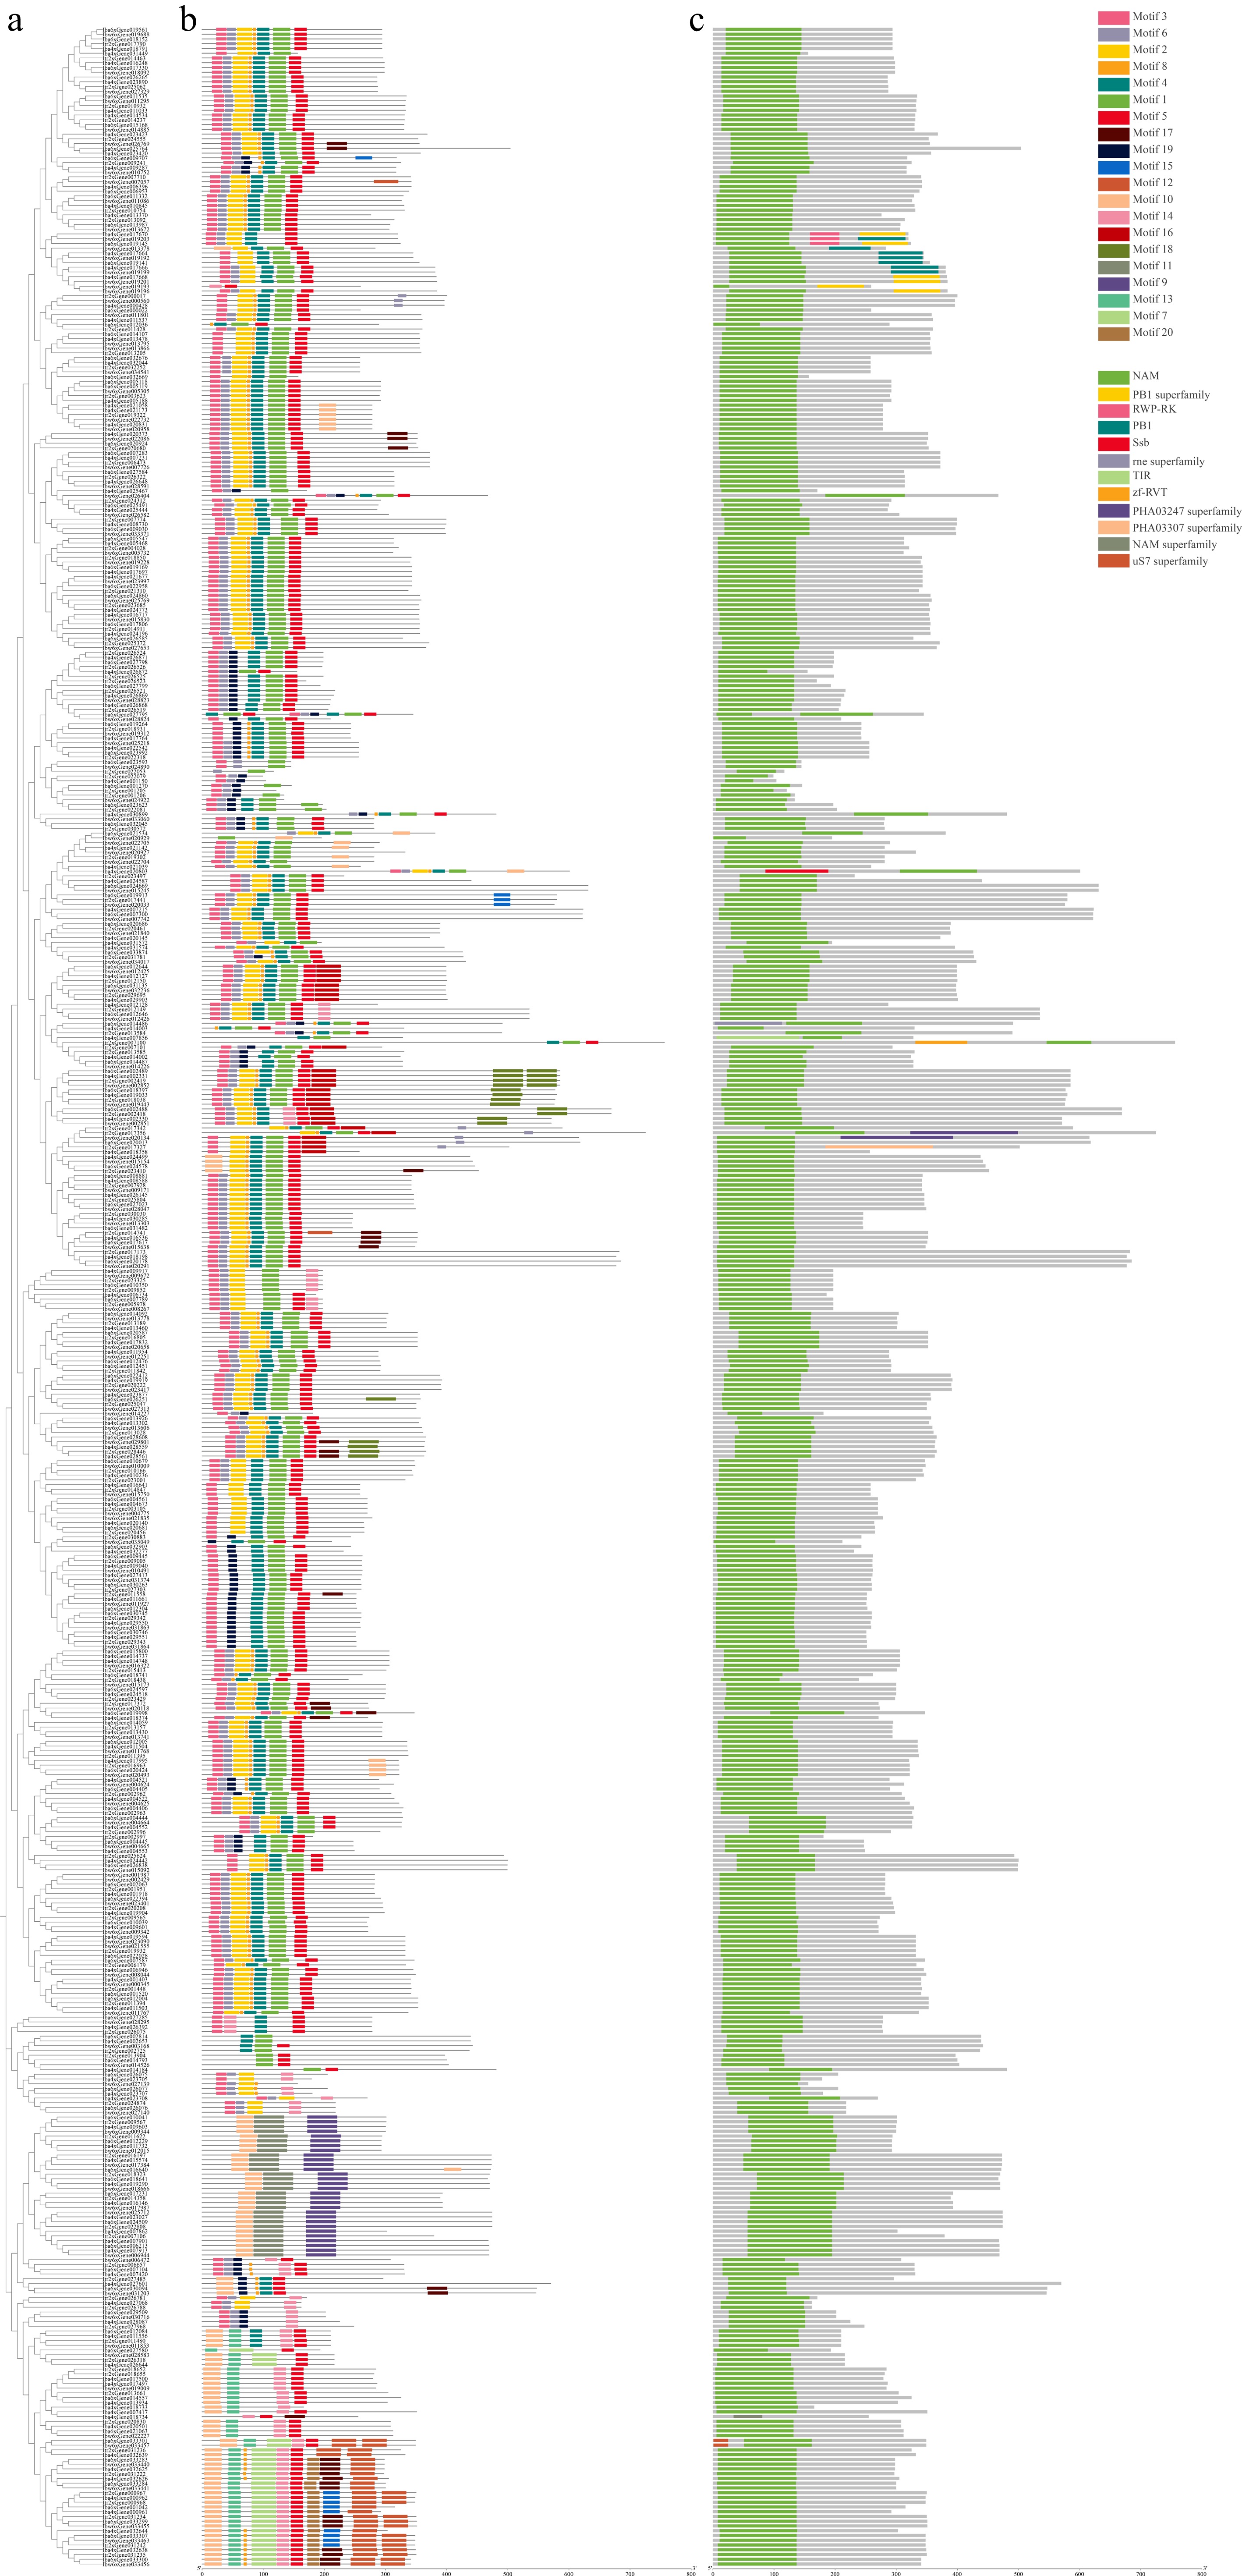
Figure 2.
Protein domain and motif analysis of NAC members: (a) Phylogenetic classification of NAC members in four 'sweetpotato' species; (b) distribution patterns of 20 conserved motifs in NAC proteins, represented by distinct color-coded boxes; (c) schematic diagram of the domain architecture of the target proteins. In the diagram, solid rectangles in different colors represent distinct conserved protein domains or superfamilies.
-
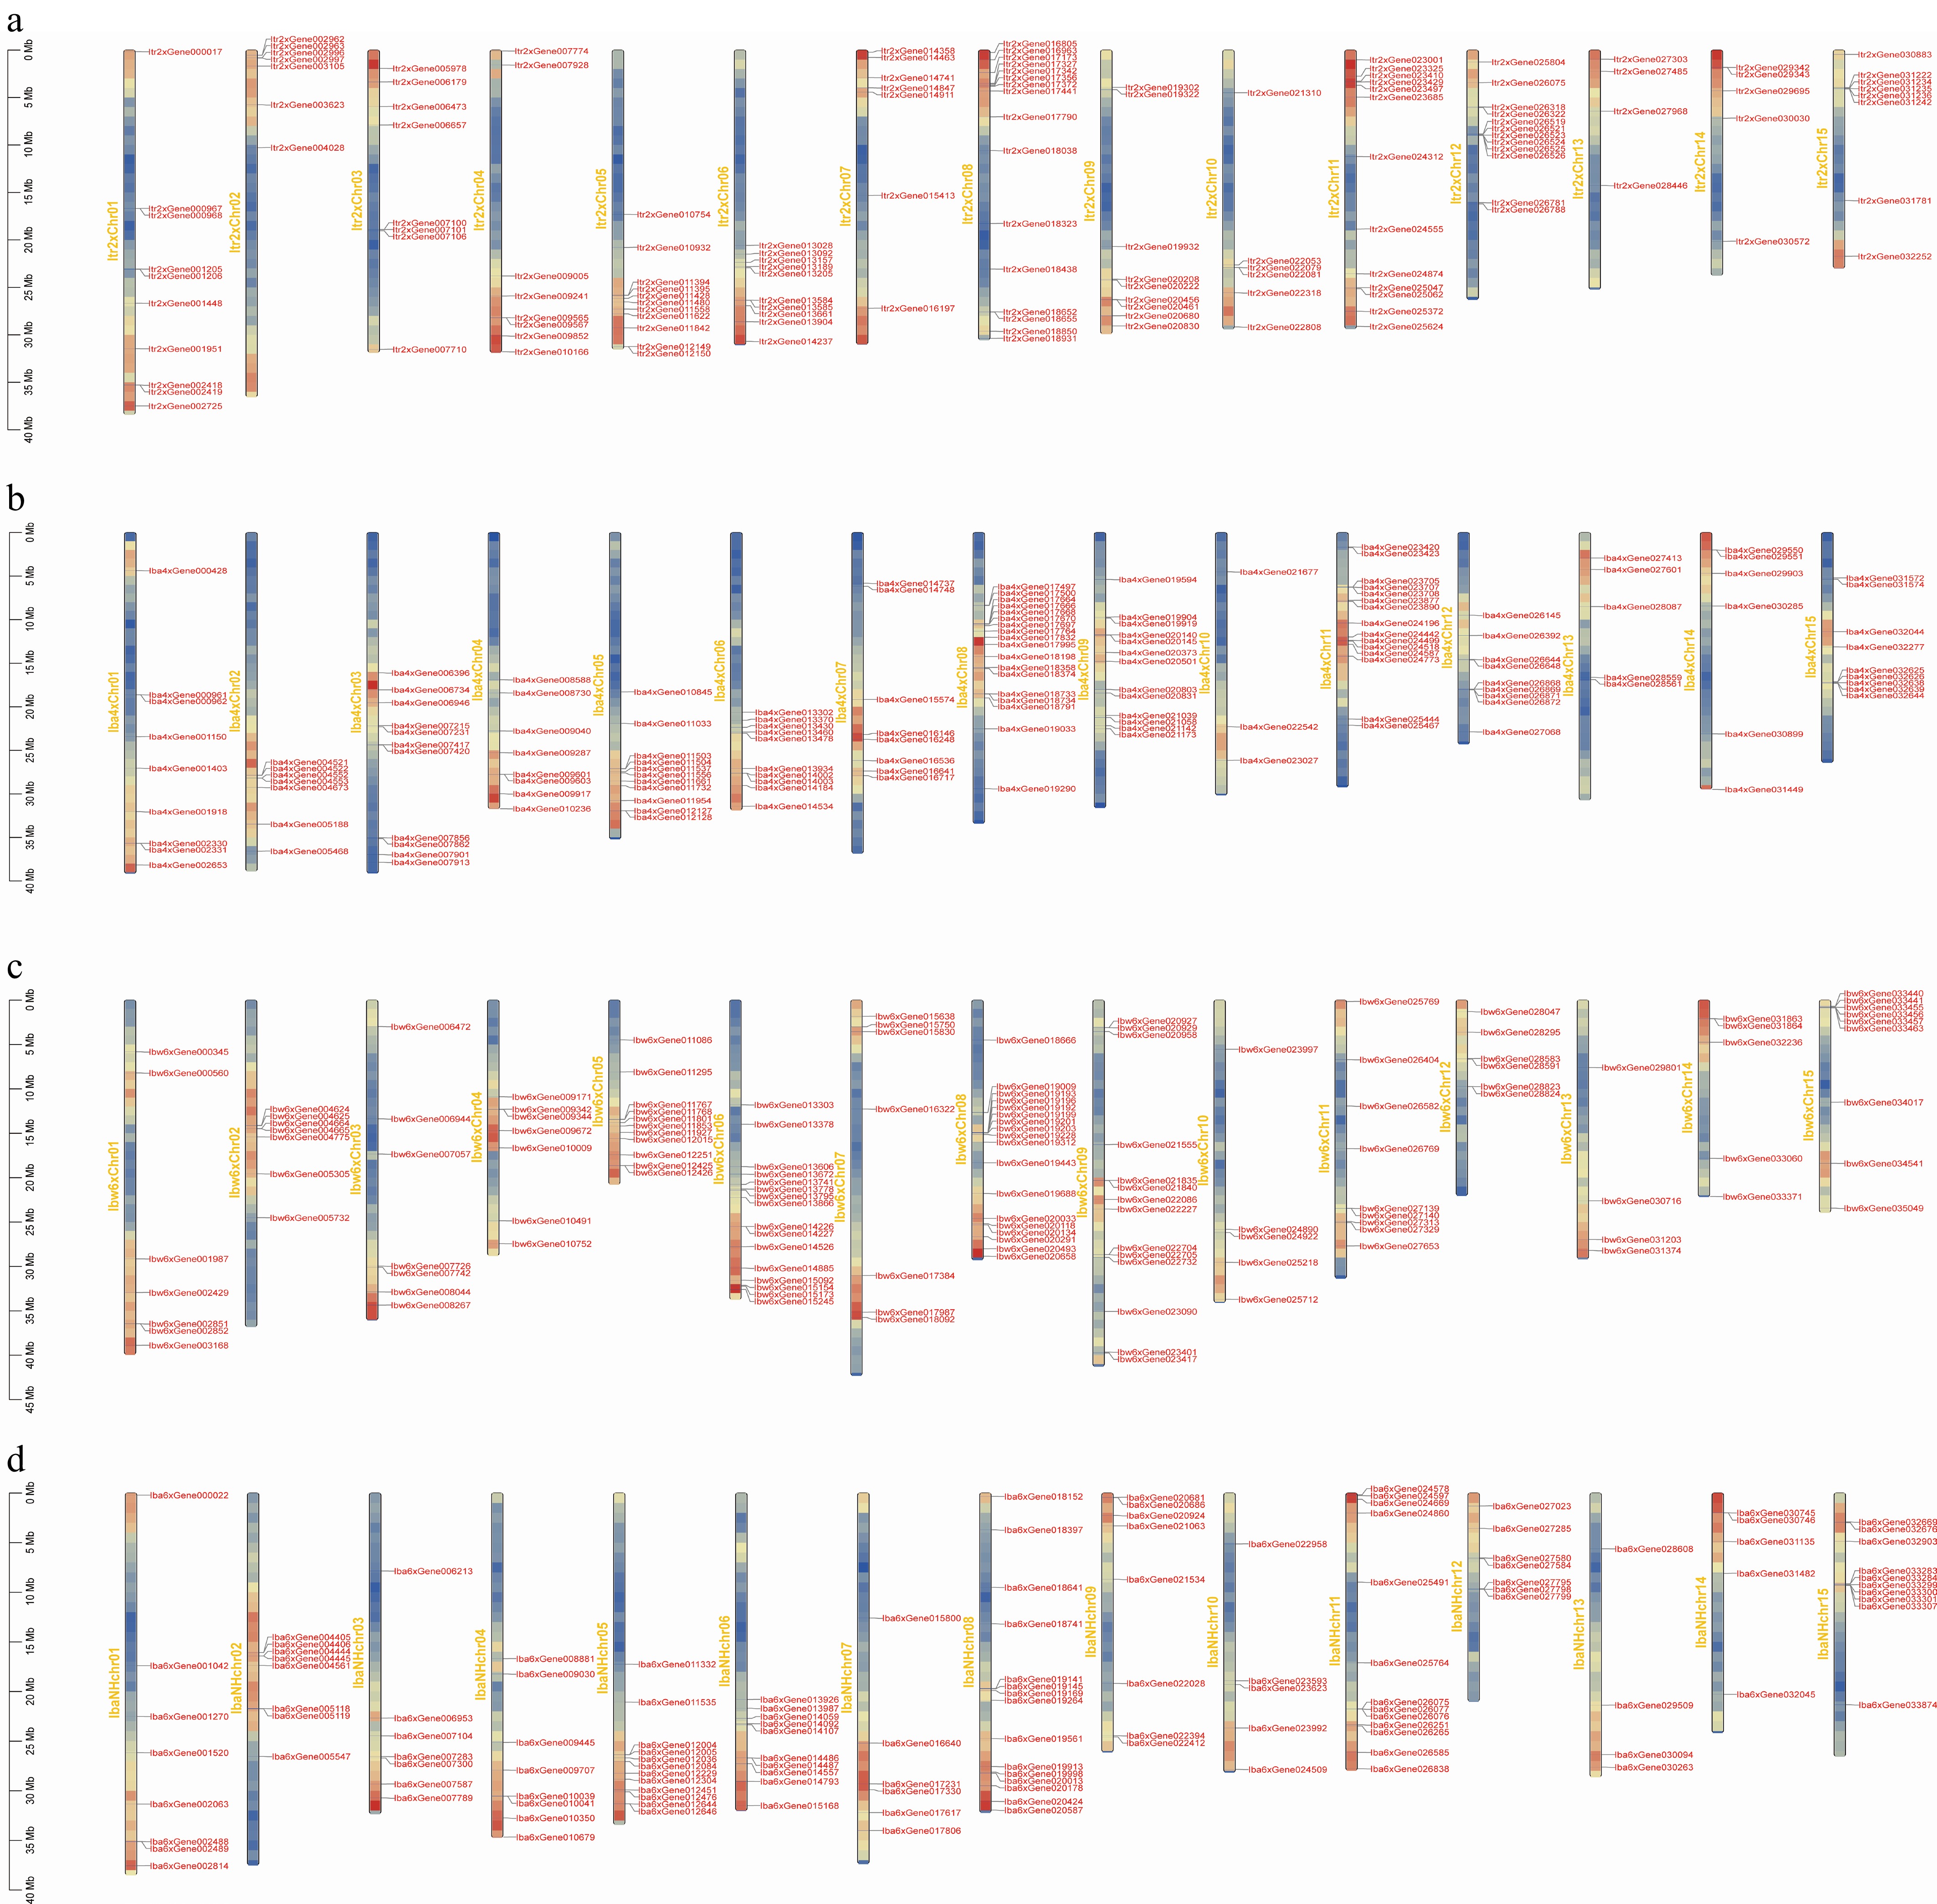
Figure 3.
Chromosomal localization of NAC genes in the (a) Y22, (b) Y428B, (c) Y601, and (d) NH. The correspondence between gene IDs and gene names is listed in Supplementary Table S1.
-
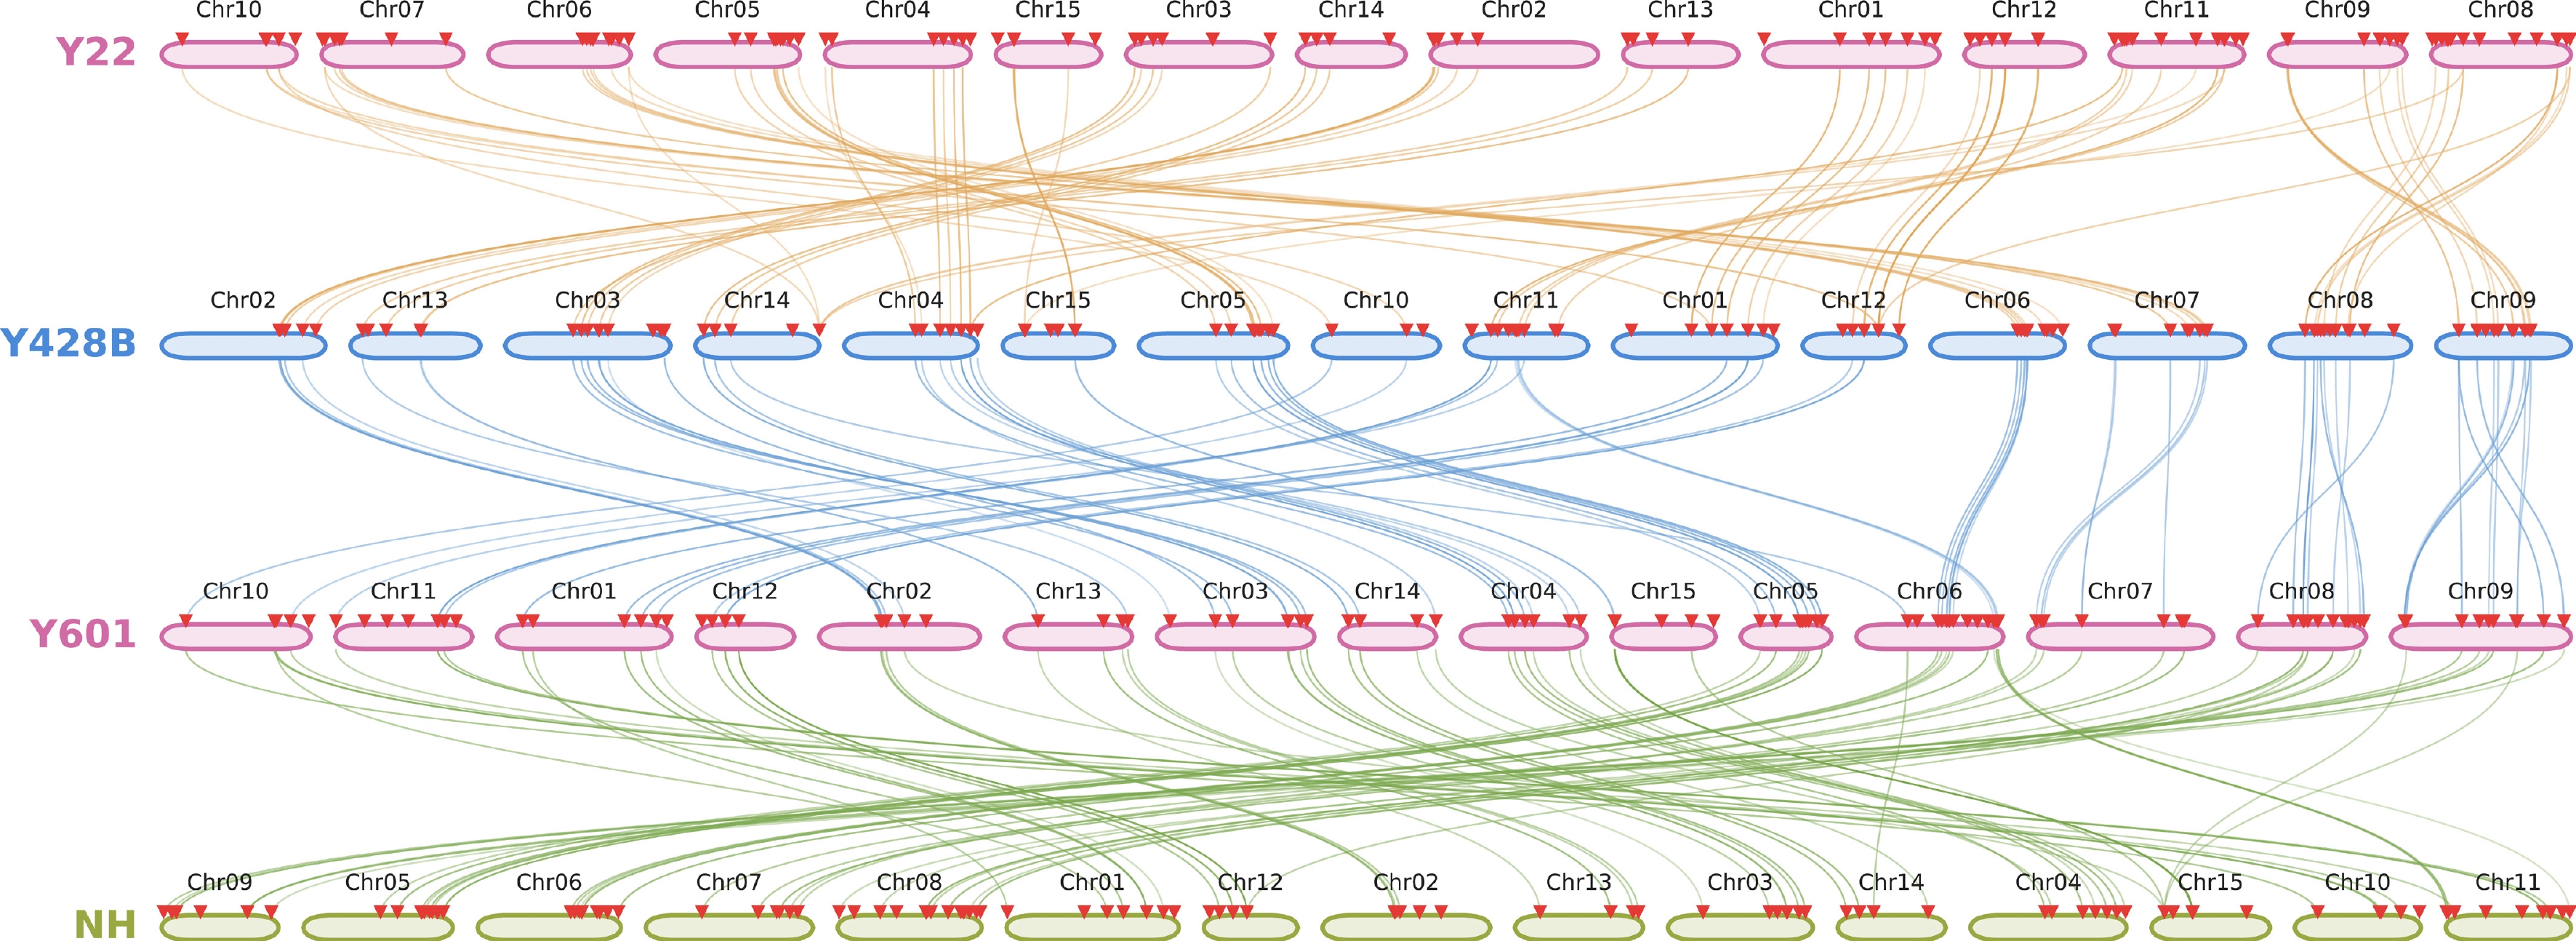
Figure 4.
Interspecies collinearity analysis of NAC gene families. The syntenic relationships of NAC family genes across four 'sweetpotato' species. The connecting lines in different colors represent homologous gene pairs exhibiting synteny between distinct species.
-
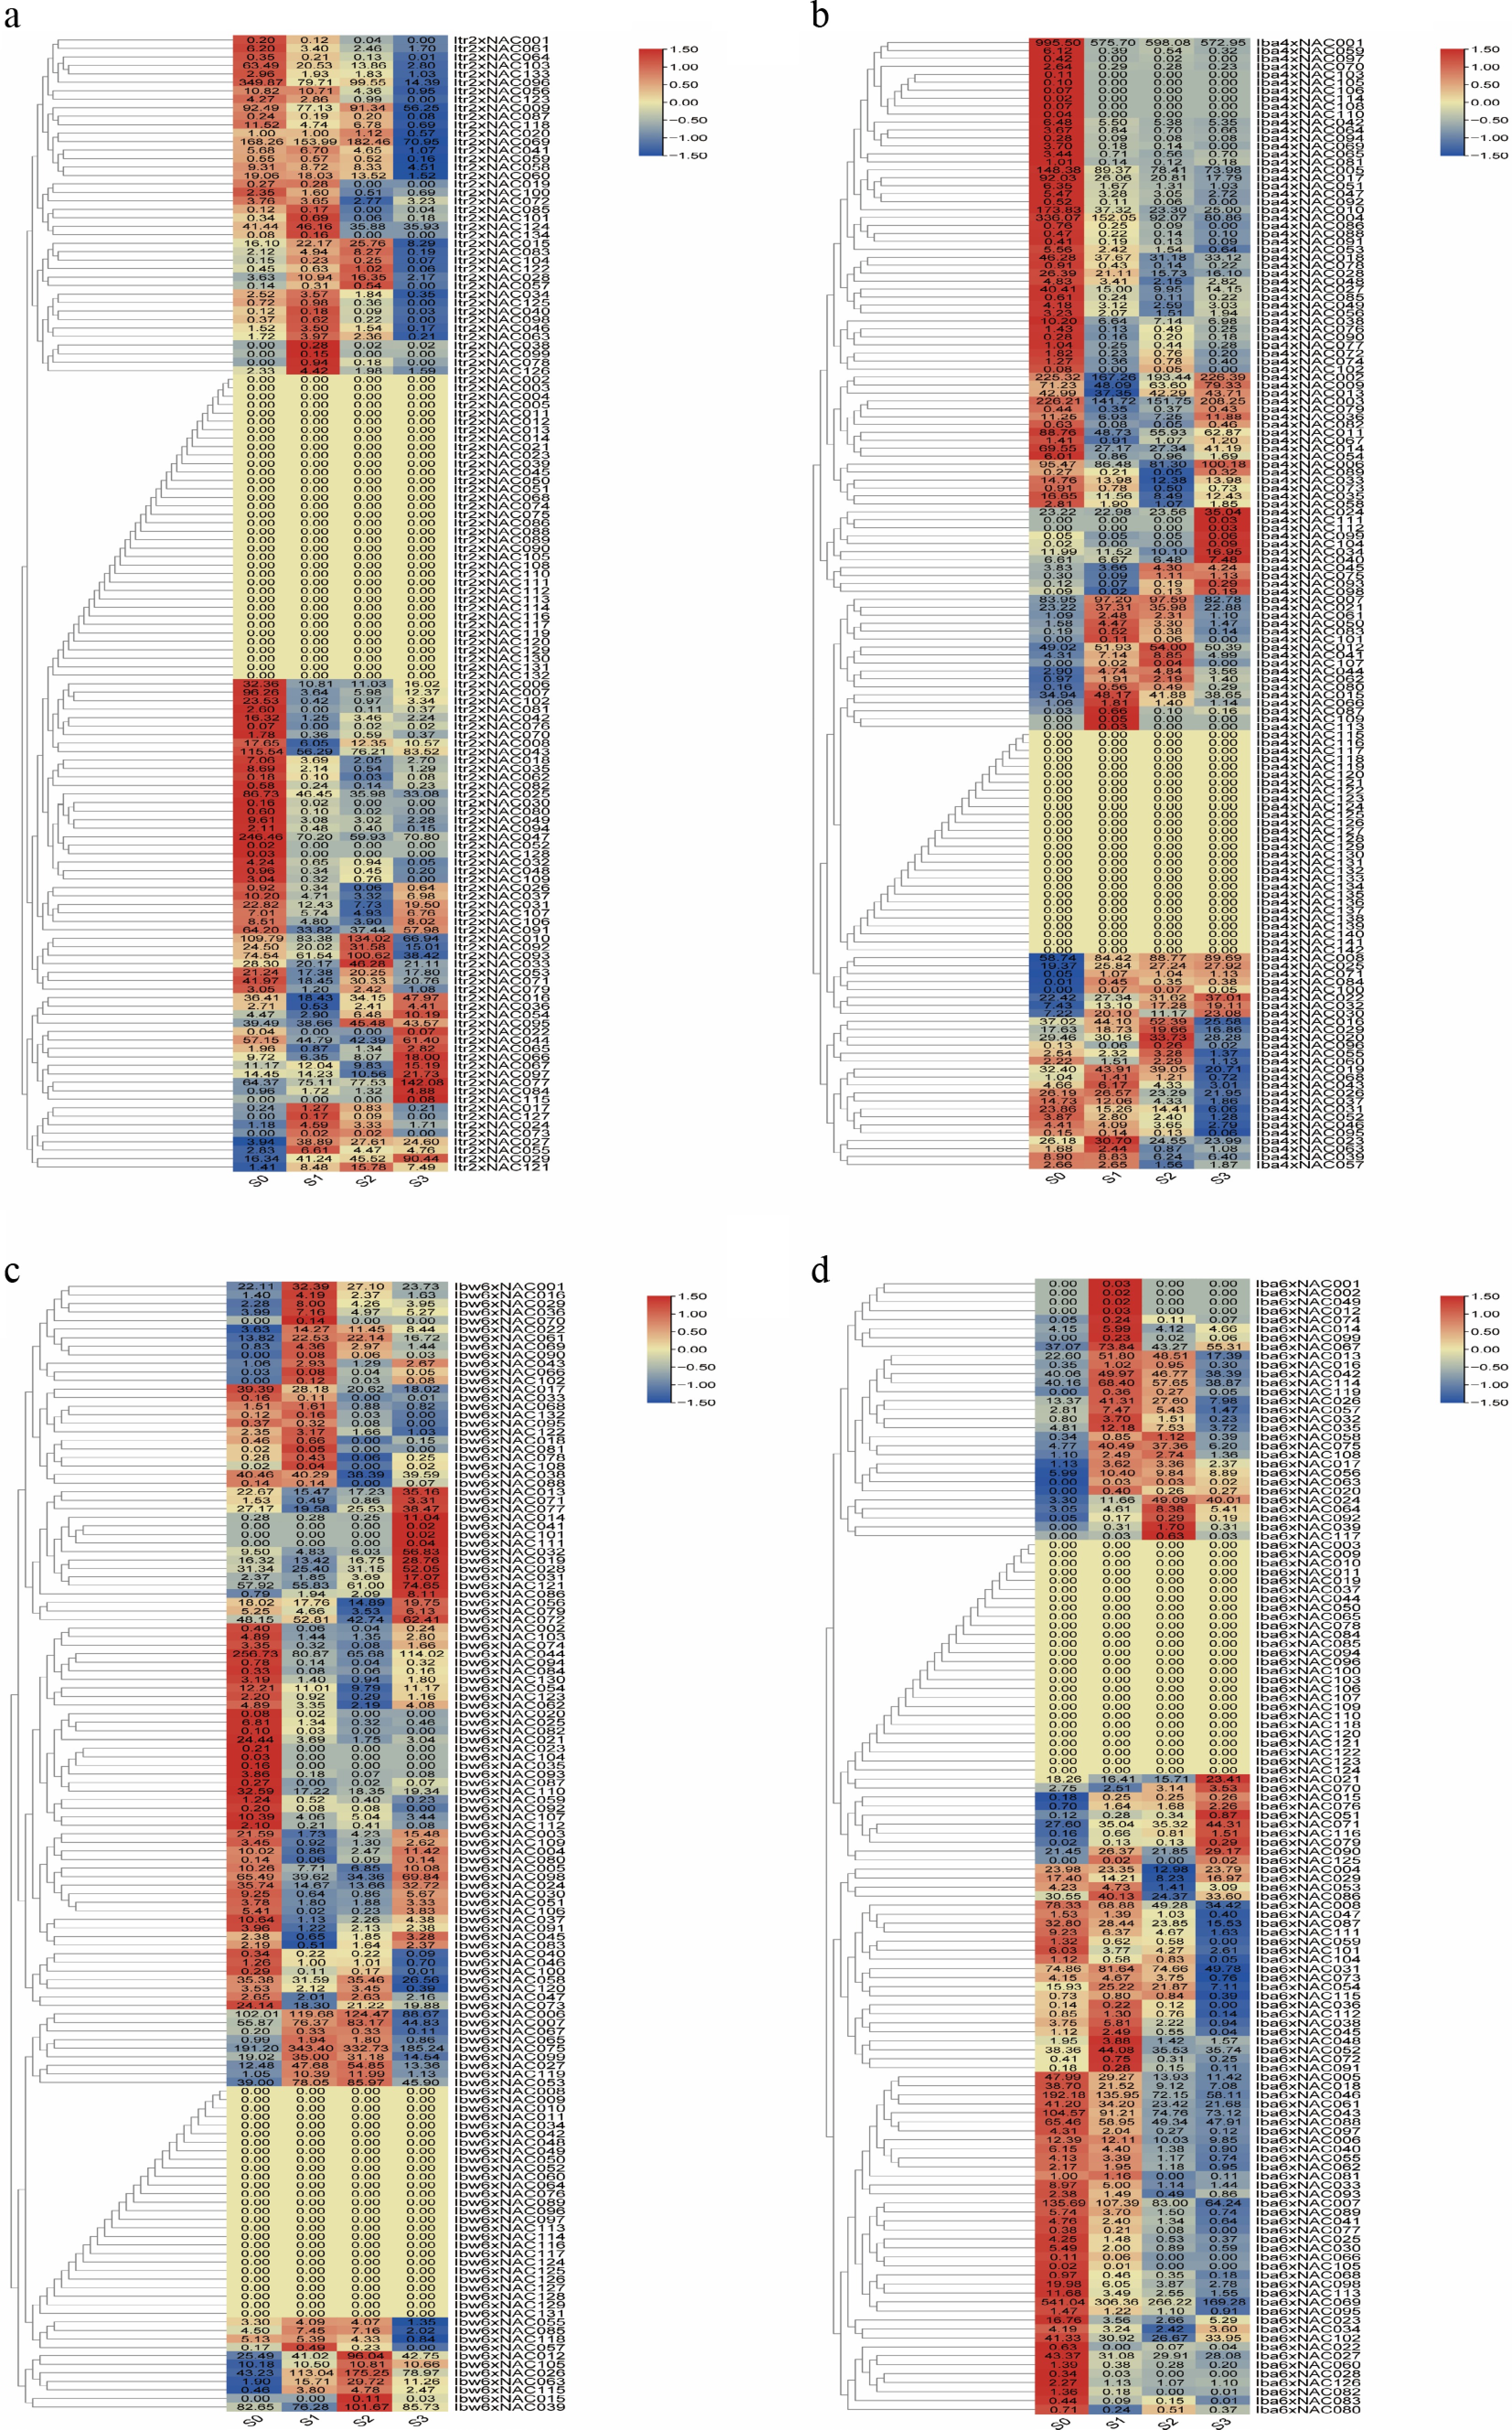
Figure 5.
Heatmap of NAC gene expression during SR development. The four panels correspond to different species: (a) Y22, (b) Y428B, (c) Y601, and (d) NH. As illustrated in the right panel, genes originating from identical subgroups are categorized together. The heatmap was generated using TBtools-II. The expression matrix was normalized by Z-score per row, and only rows were clustered while columns were not clustered.
-
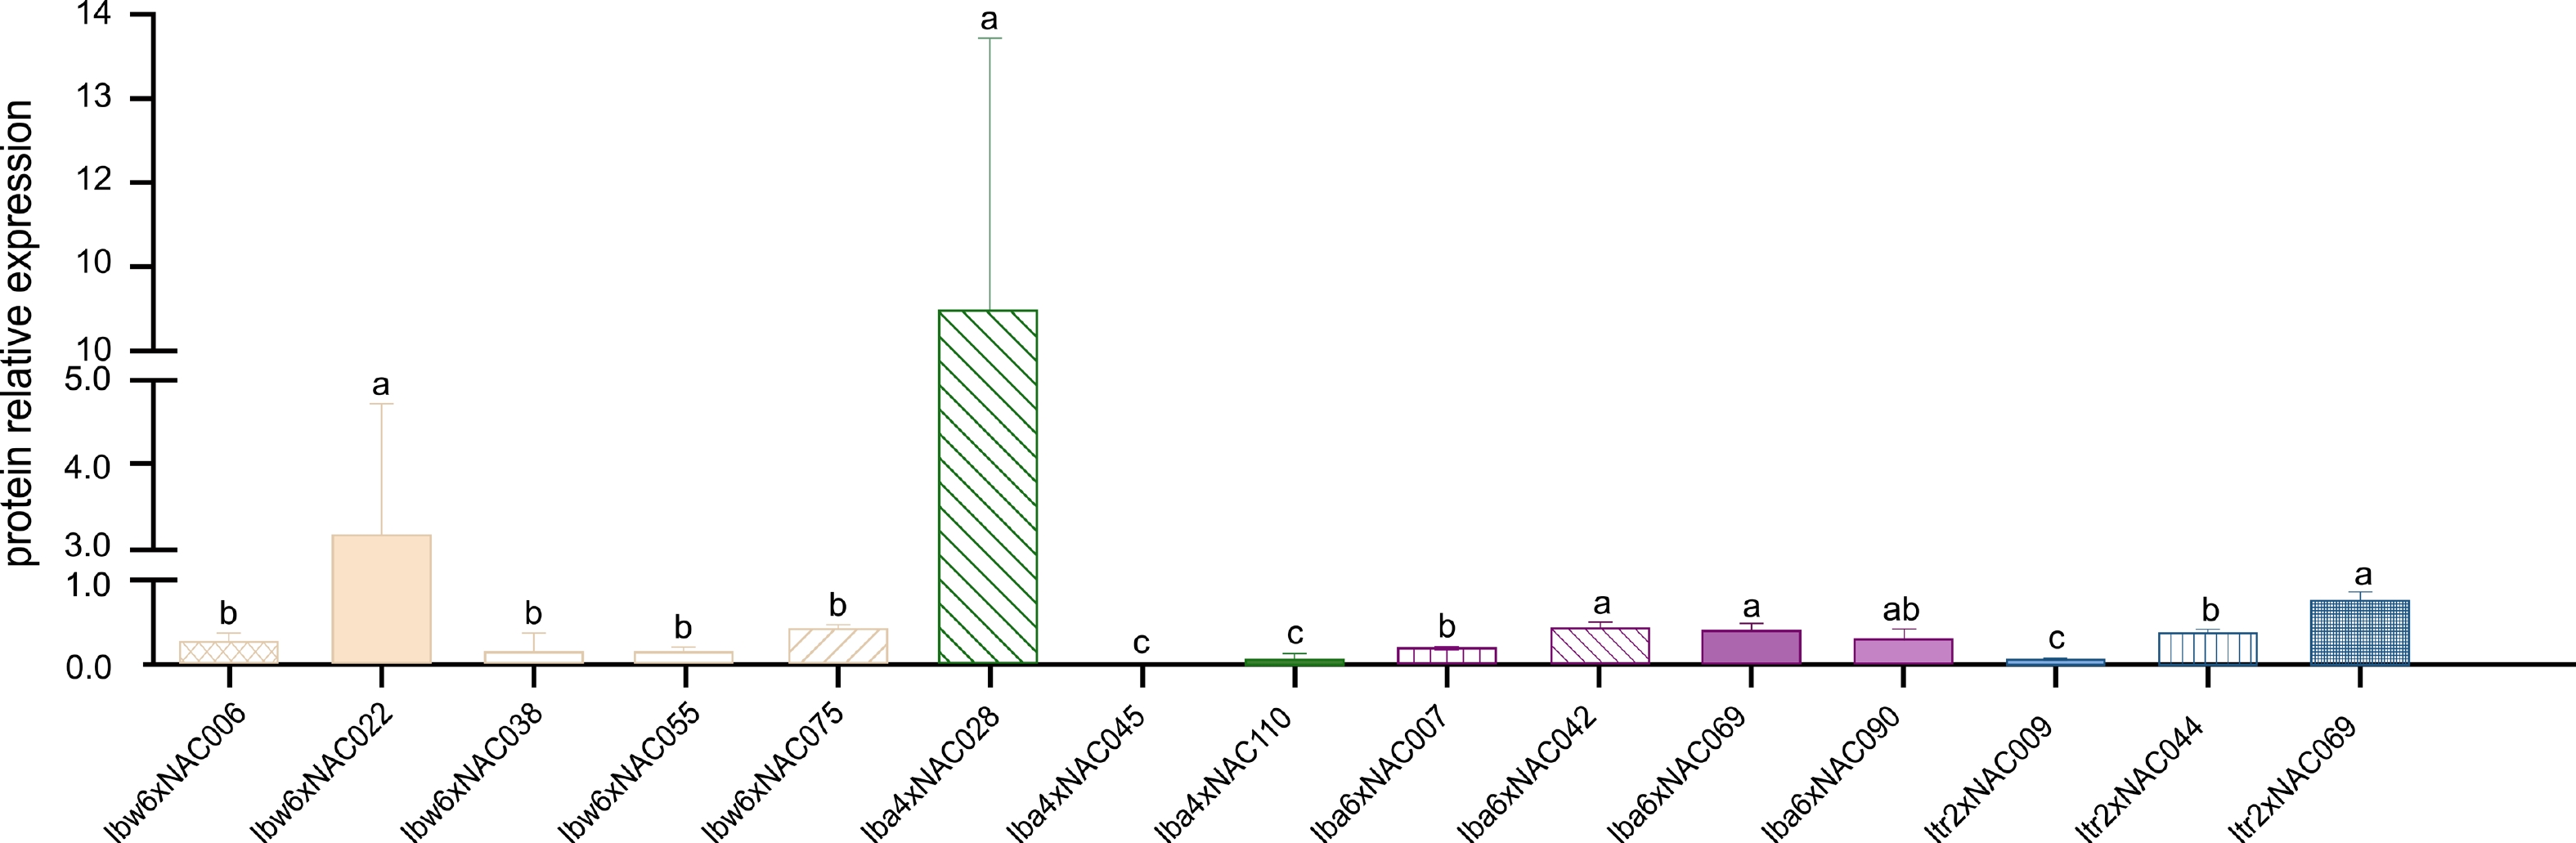
Figure 6.
NAC protein expression at the MSR stage. The bar chart illustrates the NAC protein expression levels of genes in Y601, Y428B, NH, and Y22. The vertical axis represents relative protein expression values, while the horizontal axis indicates the corresponding NAC protein names. Columns of different colors denote different materials. The lowercase letters above the bar chart indicate the LSD significance test for differences.
-
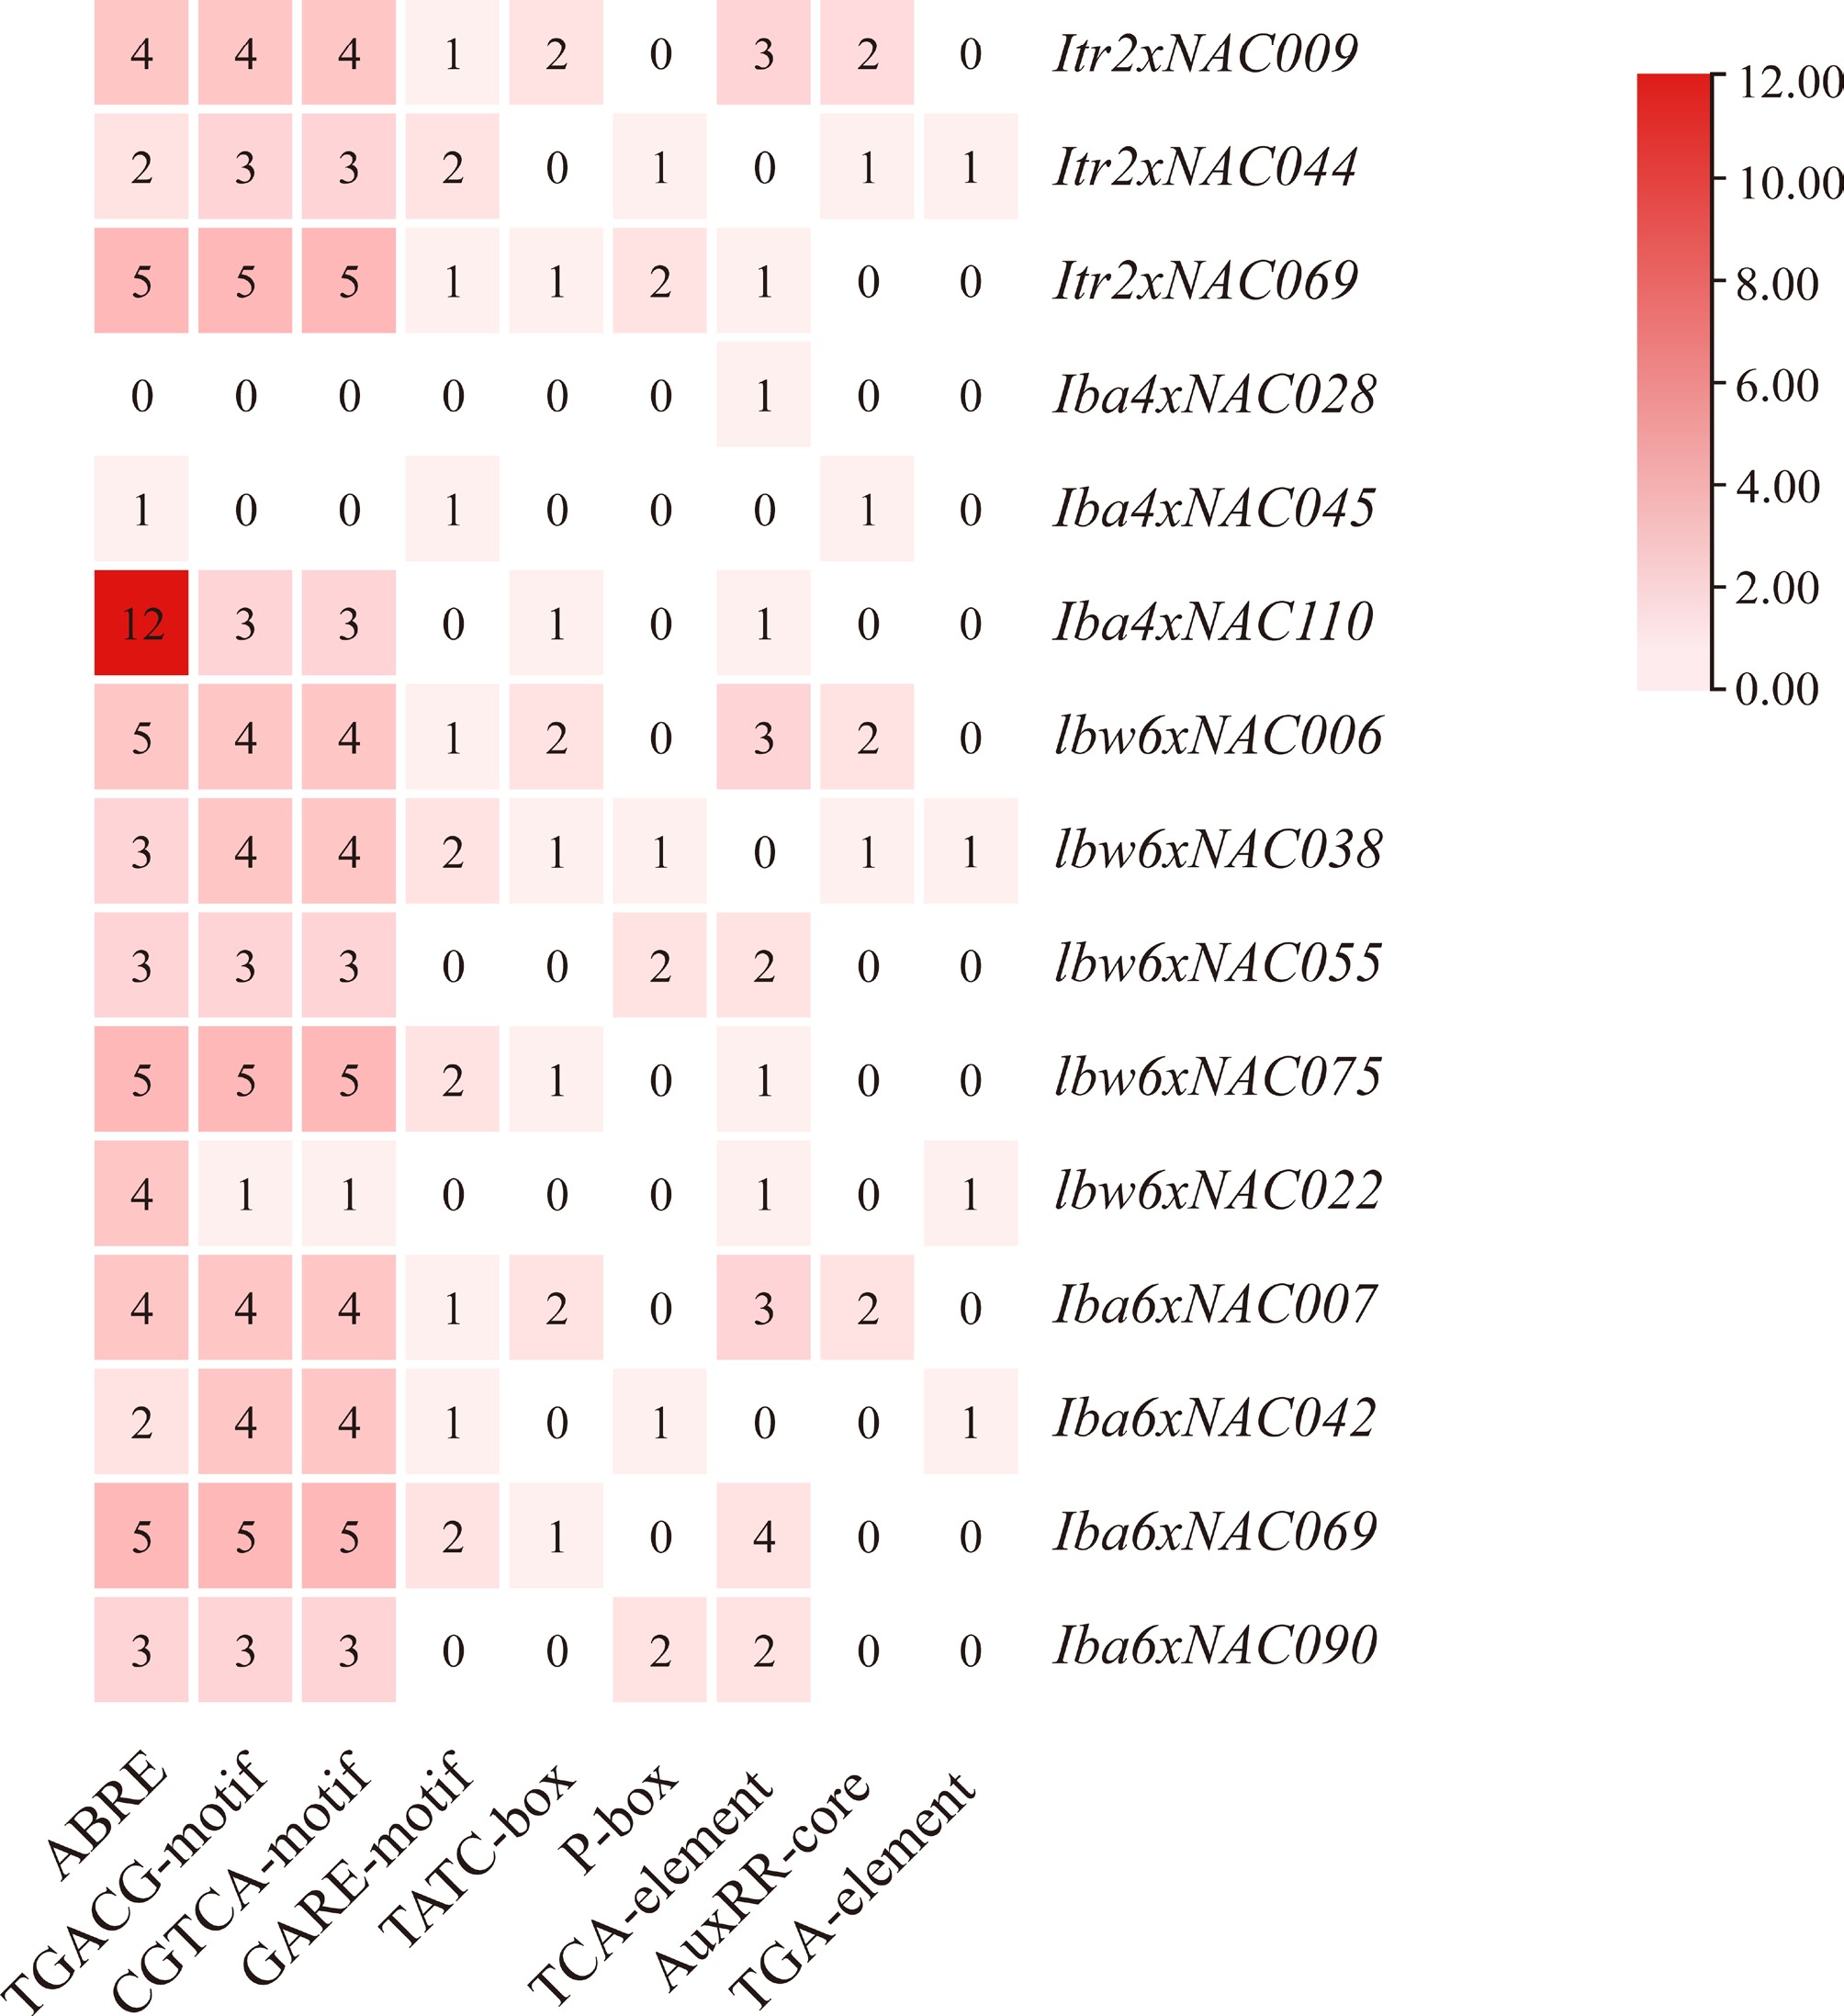
Figure 7.
Heatmap of the hormone response elements in the promoter regions of 15 genes. ABRE, abscisic acid response element; TGACG-motif/CGTCA-motif, jasmonic acid methyl ester response element; GARE-motif/TATC-box/P-box, gibberellin response element; TCA element, salicylic acid response element; AuxRR-core/TGA-element, auxin response element. The numbers indicate the copy number of the element in the promoter region.
Figures
(7)
Tables
(0)