-
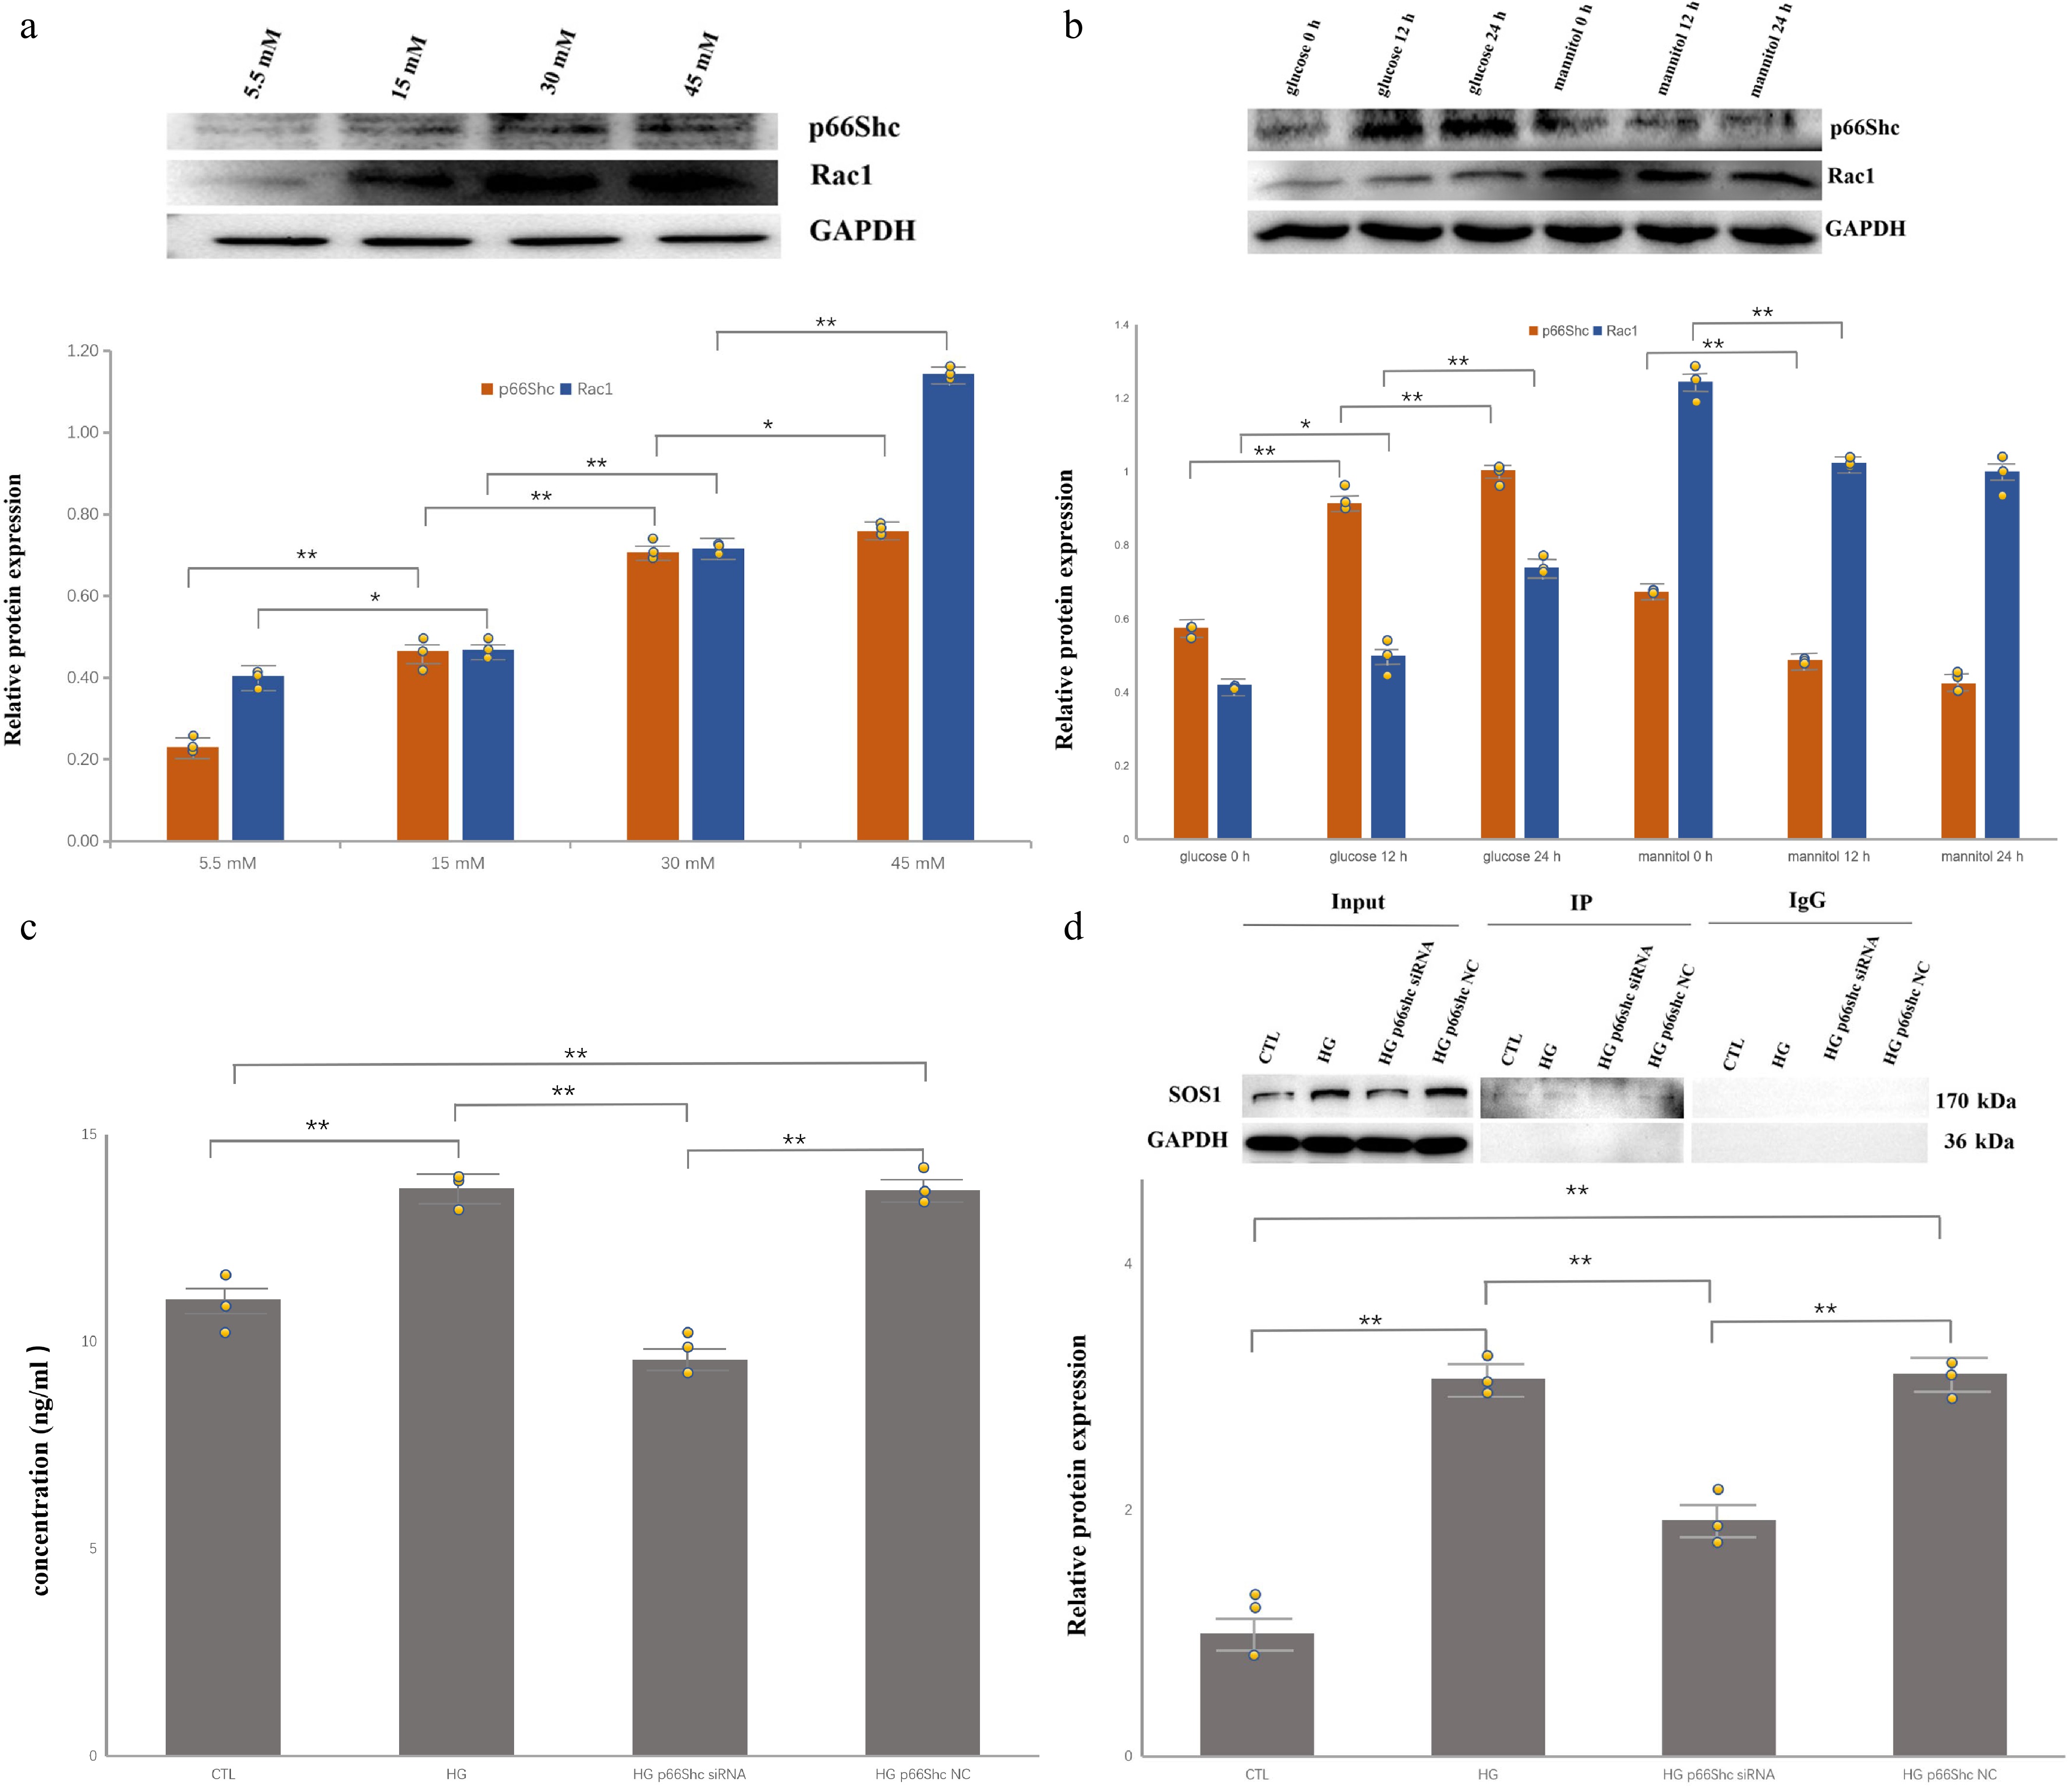
Figure 1.
High glucose upregulates p66Shc/Rac1 and promotes Sos1–Rac1 complex formation in HRPECs. Individual data points from independent biological replicates are overlaid on the bar graphs. (* p < 0.05, ** p < 0.01). (a) Representative Western blots and densitometric quantification showing concentration-dependent increases in p66Shc and Rac1 after 24 h of exposure to 5.5, 15, 30, and 45 mM glucose (n = 3). (b) Time-dependent induction of p66Shc and Rac1 at 0, 12, and 24 h in 30 mM glucose, with osmotic control (5.5 mM glucose + 24 mM mannitol, osmolarity-matched) showing no comparable increase (n = 3). (c) Rac1 quantification (ELISA) in control, HG, HG + p66Shc siRNA, and HG + negative control groups (n = 3). (d) Co-immunoprecipitation demonstrating increased association of Sos1 with Rac1 in HG-treated cells and attenuation after p66Shc knockdown.
-
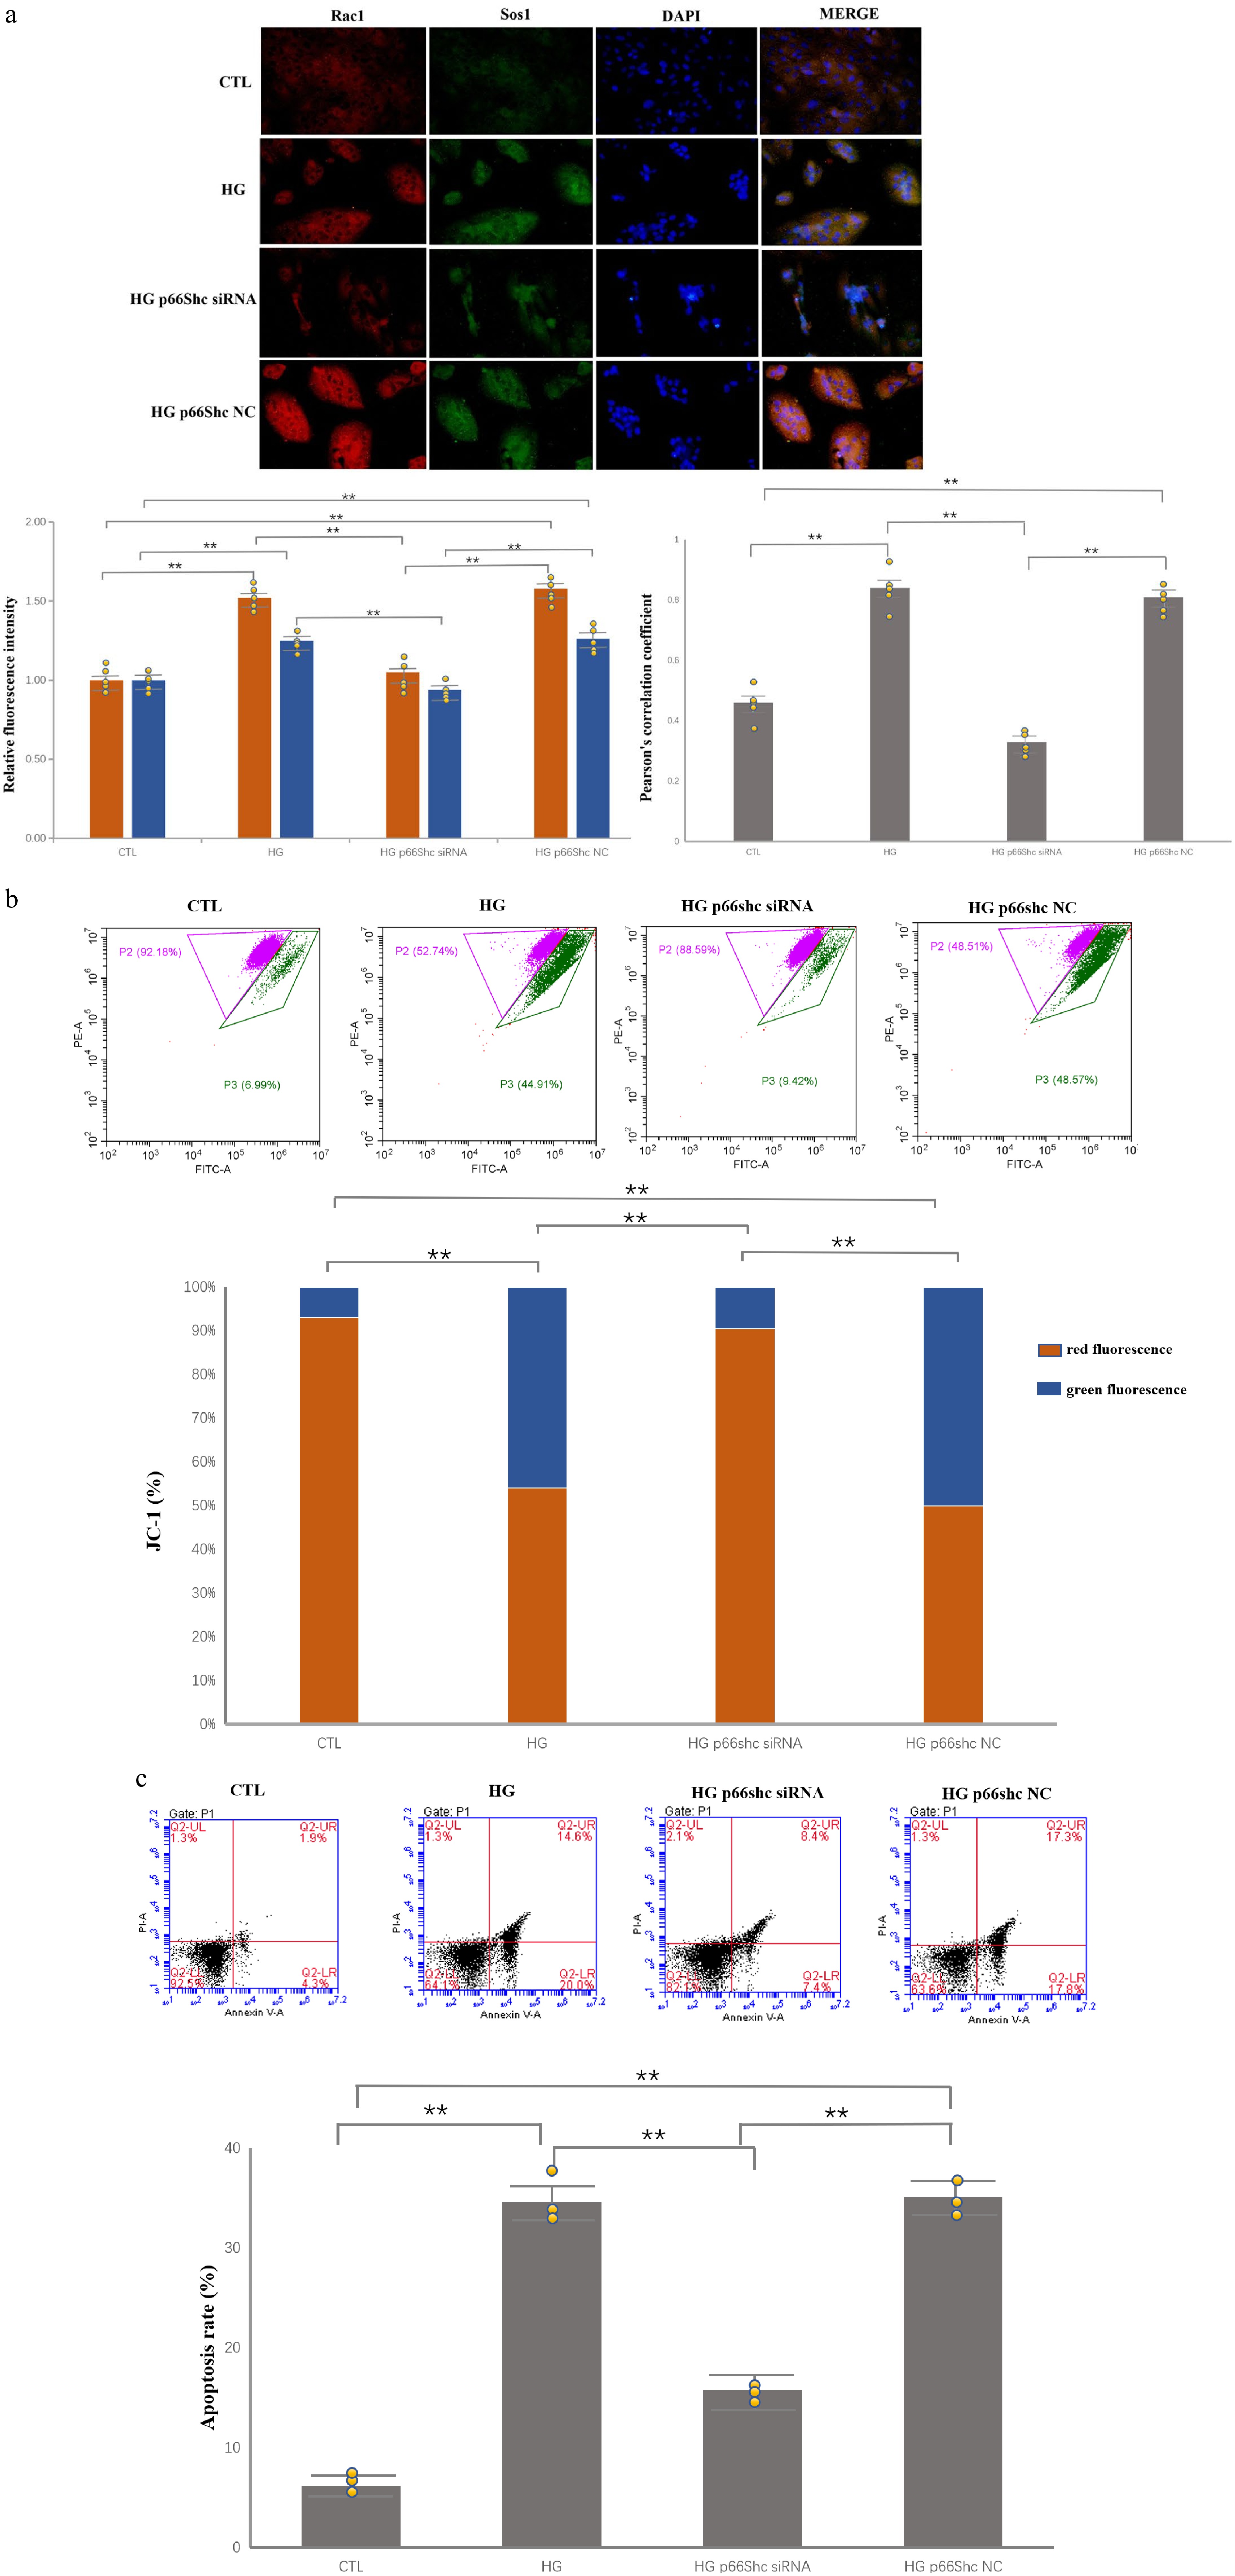
Figure 2.
p66Shc knockdown attenuates HG-induced mitochondrial depolarization and apoptosis. Individual data points from independent biological replicates are overlaid on the bar graphs. (* p < 0.05, ** p < 0.01). (a) Immunofluorescence images and quantification of Rac1 (red) and Sos1 (green) in HRPECs; merged yellow signal indicates co-localization. HG increases signal intensity and co-localization, whereas p66Shc siRNA reduces both. Pearson’s correlation coefficient was calculated using the ImageJ JACoP plugin from at least five randomly selected fields per group in three independent experiments. (b) JC-1 assay showing decreased mitochondrial membrane potential (lower red/green signal) in HG-treated cells and partial recovery after p66Shc knockdown (n = 3). (c) Annexin V/PI flow cytometry showing increased apoptosis in the HG and HG + NC groups, with a significant reduction in the HG + p66Shc siRNA group (n = 3).
Figures
(2)
Tables
(0)