














-
Diabetic retinopathy (DR) is one of the most important microvascular complications of diabetes mellitus and remains a leading cause of vision loss and blindness in working-age adults[1−3]. The pathogenesis of DR is complex, involving multiple factors such as hyperglycemia, chronic inflammation, vascular dysfunction, and neurodegeneration[4−9]. Specifically, sustained hyperglycemia is considered to be the direct driver of increased oxidative stress and mitochondrial dysfunction in retinal cells[10−12].
The cellular adaptor protein p66Shc is an isoform of the ShcA family encoded by the SHC1 gene, with a molecular weight of approximately 66 kDa[13]. Unlike p46Shc and p52Shc, which mainly participate in growth factor signaling, p66Shc plays a key role in cellular stress responses and lifespan regulation[14]. p66Shc is recognized as an important sensor and a major generator of intracellular reactive oxygen species (ROS)[15]. Under stress conditions, p66Shc is activated and translocates to the mitochondrial intermembrane space. Through its unique collagen homology-2 (CH2) domain, it exerts oxidoreductase activity, transferring electrons from cytochrome C to oxygen. This process directly generates large amounts of ROS, leading to mitochondrial dysfunction and apoptosis[16].
Years of research have confirmed the role of this classic pathway in various diabetic complications, including retinopathy[17,18]. Recent studies have further clarified more complex molecular mechanisms regulating p66Shc. For example, in a high-glucose (HG) environment, transcription of p66Shc is regulated by the transcription factor p53 and the acetylation of histone H3 lysine 9 (H3K9Ac) at its promoter site[19]. In addition, p66Shc acts as a bridge between cytosolic and mitochondrial dysfunction. It increases the guanine exchange factor activity of Son of Sevenless 1 (Sos1) toward the small G-protein Rac1, thereby enhancing the Rac1-nicotinamide adenine dinucleotide phosphate (NADPH) oxidase (Nox2) signaling pathway. This collaboration further exacerbates ROS production, leading to the apoptosis of retinal capillary cells and other retinal cell types[18,20].
Retinal pigment epithelial (RPE) cells are key components of the outer blood–retinal barrier, and their dysfunction and apoptosis are critical steps in the development of DR[21].
This study aimed to investigate the effect of high glucose concentrations on p66Shc's expression in human RPE cells (HRPECs) and to further clarify the role of p66Shc in HG-induced cellular injury associated with mitochondrial dysfunction and apoptosis. The findings may provide preliminary evidence supporting p66Shc as a candidate target for protecting RPE cells in DR.
-
Human RPE cells (HRPECs) were obtained from the Cell Resources Center, Shanghai Academy of Life Sciences (Shanghai, China). Cells were maintained in glucose-free Dulbecco's modified Eagle medium (DMEM; Gibco, Thermo Fisher Scientific, USA) supplemented with 10% fetal bovine serum (FBS; Gibco), penicillin (1 × 10⁵ units [U]/L), and streptomycin (100 mg/L), at 37 °C in a humidified incubator containing 5% CO2.
When cell confluence reached 80%, cells were serum-starved in FBS-free DMEM for 24 h before treatment. For the dose–response experiments, cells were exposed to D-glucose at 5.5, 15, 30, or 45 mM for 24 h. For the osmotic control experiments, cells were treated with either 30 mM D-glucose (HG) or 5.5 mM D-glucose plus 24 mM D-mannitol (osmolarity matched control) for 0, 12, and 24 h.
This study was conducted in accordance with the Declaration of Helsinki and approved by the Ethics Committee of Shanghai Municipal Hospital of Traditional Chinese Medicine (No. 2024SHL-KY-85-01, June 3, 2024).
Experimental grouping and siRNA transfection
-
Cells were assigned to four groups: (1) Control (CTL) (5.5 mM glucose), (2) HG (30 mM glucose), (3) HG + p66Shc siRNA, and (4) HG + the negative control (NC).
The p66Shc siRNA and NC plasmid were purchased from Biofort Biotechnology Co., Ltd. (Shanghai, China). The sense sequence of p66Shc siRNA was 5′-GCAGCUUCAUACGCUUGAUTT-3′. The antisense sequence was 5′-AUCAAGCGUAUGAAGCUGCTT-3′. The negative control siRNA had no homology with any human gene. The final transfection concentration was 50 nM. Transfection was performed using Lipofectamine 2000 (Invitrogen, Carlsbad, CA, USA) according to the manufacturer's protocol. After 6 h, the transfection medium was replaced with complete medium, and the cells were further cultured for downstream assays.
Western blot analysis
-
Total protein was extracted using a radioimmunoprecipitation assay (RIPA) lysis buffer containing protease inhibitors. Protein samples were denatured at 100 °C for 10 min, separated by 12% sodium dodecyl sulfate–polyacrylamide gel electrophoresis (SDS-PAGE), and transferred to polyvinylidene fluoride (PVDF) membranes. The membranes were incubated overnight at 4 °C with primary antibodies. These included anti-p66Shc (1:1,000, Bioss, bsm-50258M), anti-Rac1 (1:1,000, Proteintech, 24072-1-AP), and anti-GAPDH (1:5,000, Proteintech, 10494-1-AP).
After washing, membranes were incubated with horseradish peroxide (HRP)-conjugated goat anti-rabbit secondary antibodies (1:5,000, Bioss, bs-0295G-HRP) for 1 h at room temperature. Bands were visualized using Enhanced chemiluminescence (ECL) reagents (Goodbio, Wuhan, China), captured using a Tanon 5500 imaging system (Tanon, Shanghai, China), and quantified with AlphaEaseFC software (Alpha Innotech, USA). Target protein signals were normalized to Glyceraldehyde-3-phosphate dehydrogenase (GAPDH).
Rac1 quantification by enzyme-linked immunosorbent assay (ELISA)
-
Cell lysates were assayed using a human Rac1 enzyme-linked immunosorbent assay (ELISA) kit (RX106154H, Reagent Genie, Shanghai, China) strictly following the manufacturer's instructions. Optical density was measured at 450 nm (BioTek microplate reader, USA), and the concentrations were calculated from standard curves.
Co-immunoprecipitation
-
Protein interactions were assessed using a co-immunoprecipitation (Co-IP) kit (Beaver Biotechnology Co., Ltd., Suzhou, China). Briefly, precleared lysates were incubated with anti-Rac1 antibodies (the IP group) or isotype IgG (the negative IP control) at 4 °C overnight, followed by incubation with protein A/G agarose beads for 2 h. After washing, immunocomplexes were eluted, separated by SDS-PAGE, and analyzed by Western blotting for Sos1 association.
Immunofluorescence double staining
-
Cells grown on coverslips were fixed, permeabilized with 0.3% Triton X-100, and blocked with 5% bovine serum albumin. The primary antibodies were anti-Sos1 (1:100) and anti-Rac1 (1:100), incubated overnight at 4 °C. After washing, the cells were incubated with fluorescent secondary antibodies (Cy3-conjugated goat anti-mouse and fluorescein isothiocyanate (FITC)-conjugated goat anti-rabbit, 1:200) for 2 h at 37 °C in the dark. Nuclei were counterstained with 4′,6-Diamidino-2-phenylindole (DAPI).
Images were captured under identical acquisition settings across groups to allow a quantitative comparison of fluorescence intensity and co-localization.
Co-localization between Sos1 and Rac1 was quantified using ImageJ with the JACoP plugin. Pearson's correlation coefficients were calculated. At least five randomly selected fields were analyzed per group. Each field contained more than 10 cells. All images were acquired under identical exposure and gain settings.
Mitochondrial membrane potential assay
-
Mitochondrial membrane potential (ΔΨm) was evaluated using a 5,5′,6,6′-Tetrachloro-1,1′,3,3′-tetraethylbenzimidazolylcarbocyanine iodide (JC-1) kit (Solarbio, Beijing, China). After treatment, cells were harvested, incubated with a JC-1 working solution at 37 °C for 20 min, washed with a JC-1 buffer, and immediately analyzed. ΔΨm was expressed as the red (J-aggregates)/green (monomers) fluorescence ratio.
Apoptosis assay by flow cytometry
-
Apoptosis was quantified using an Annexin V–fluorescein isothiocyanate/propidium iodide (Annexin V-FITC/PI) kit (Dojindo, Shanghai, China). After 48 h of treatment, the cells were collected, washed, stained with Annexin V-FITC (5 μL) and PI (5 μL) for 15 min in the dark at room temperature, and analyzed by flow cytometry (BD Biosciences, Franklin Lakes, NJ, USA). Early and late apoptotic fractions were combined to determine total apoptosis.
Statistical analysis
-
Statistical analyses were performed using SPSS 28.0 (IBM, Armonk, NY, USA). Data are presented as the mean ± standard deviation (SD). Each experiment was independently repeated at least three times (biological replicates), with technical replicates as appropriate for each assay.
Normality was assessed using the Shapiro–Wilk test. For two group comparisons, unpaired two-tailed Student's t-tests were used for normally distributed data; for multiple group comparisons, one-way analysis of variance (ANOVA) followed by Tukey's post hoc test was applied. A two-sided p < 0.05 was considered to be statistically significant.
Each panel of bar graphs in Fig. 1 and Fig. 2 was overlaid with individual data points to display data dispersion. Sample sizes for each assay are indicated in the corresponding figure legend.
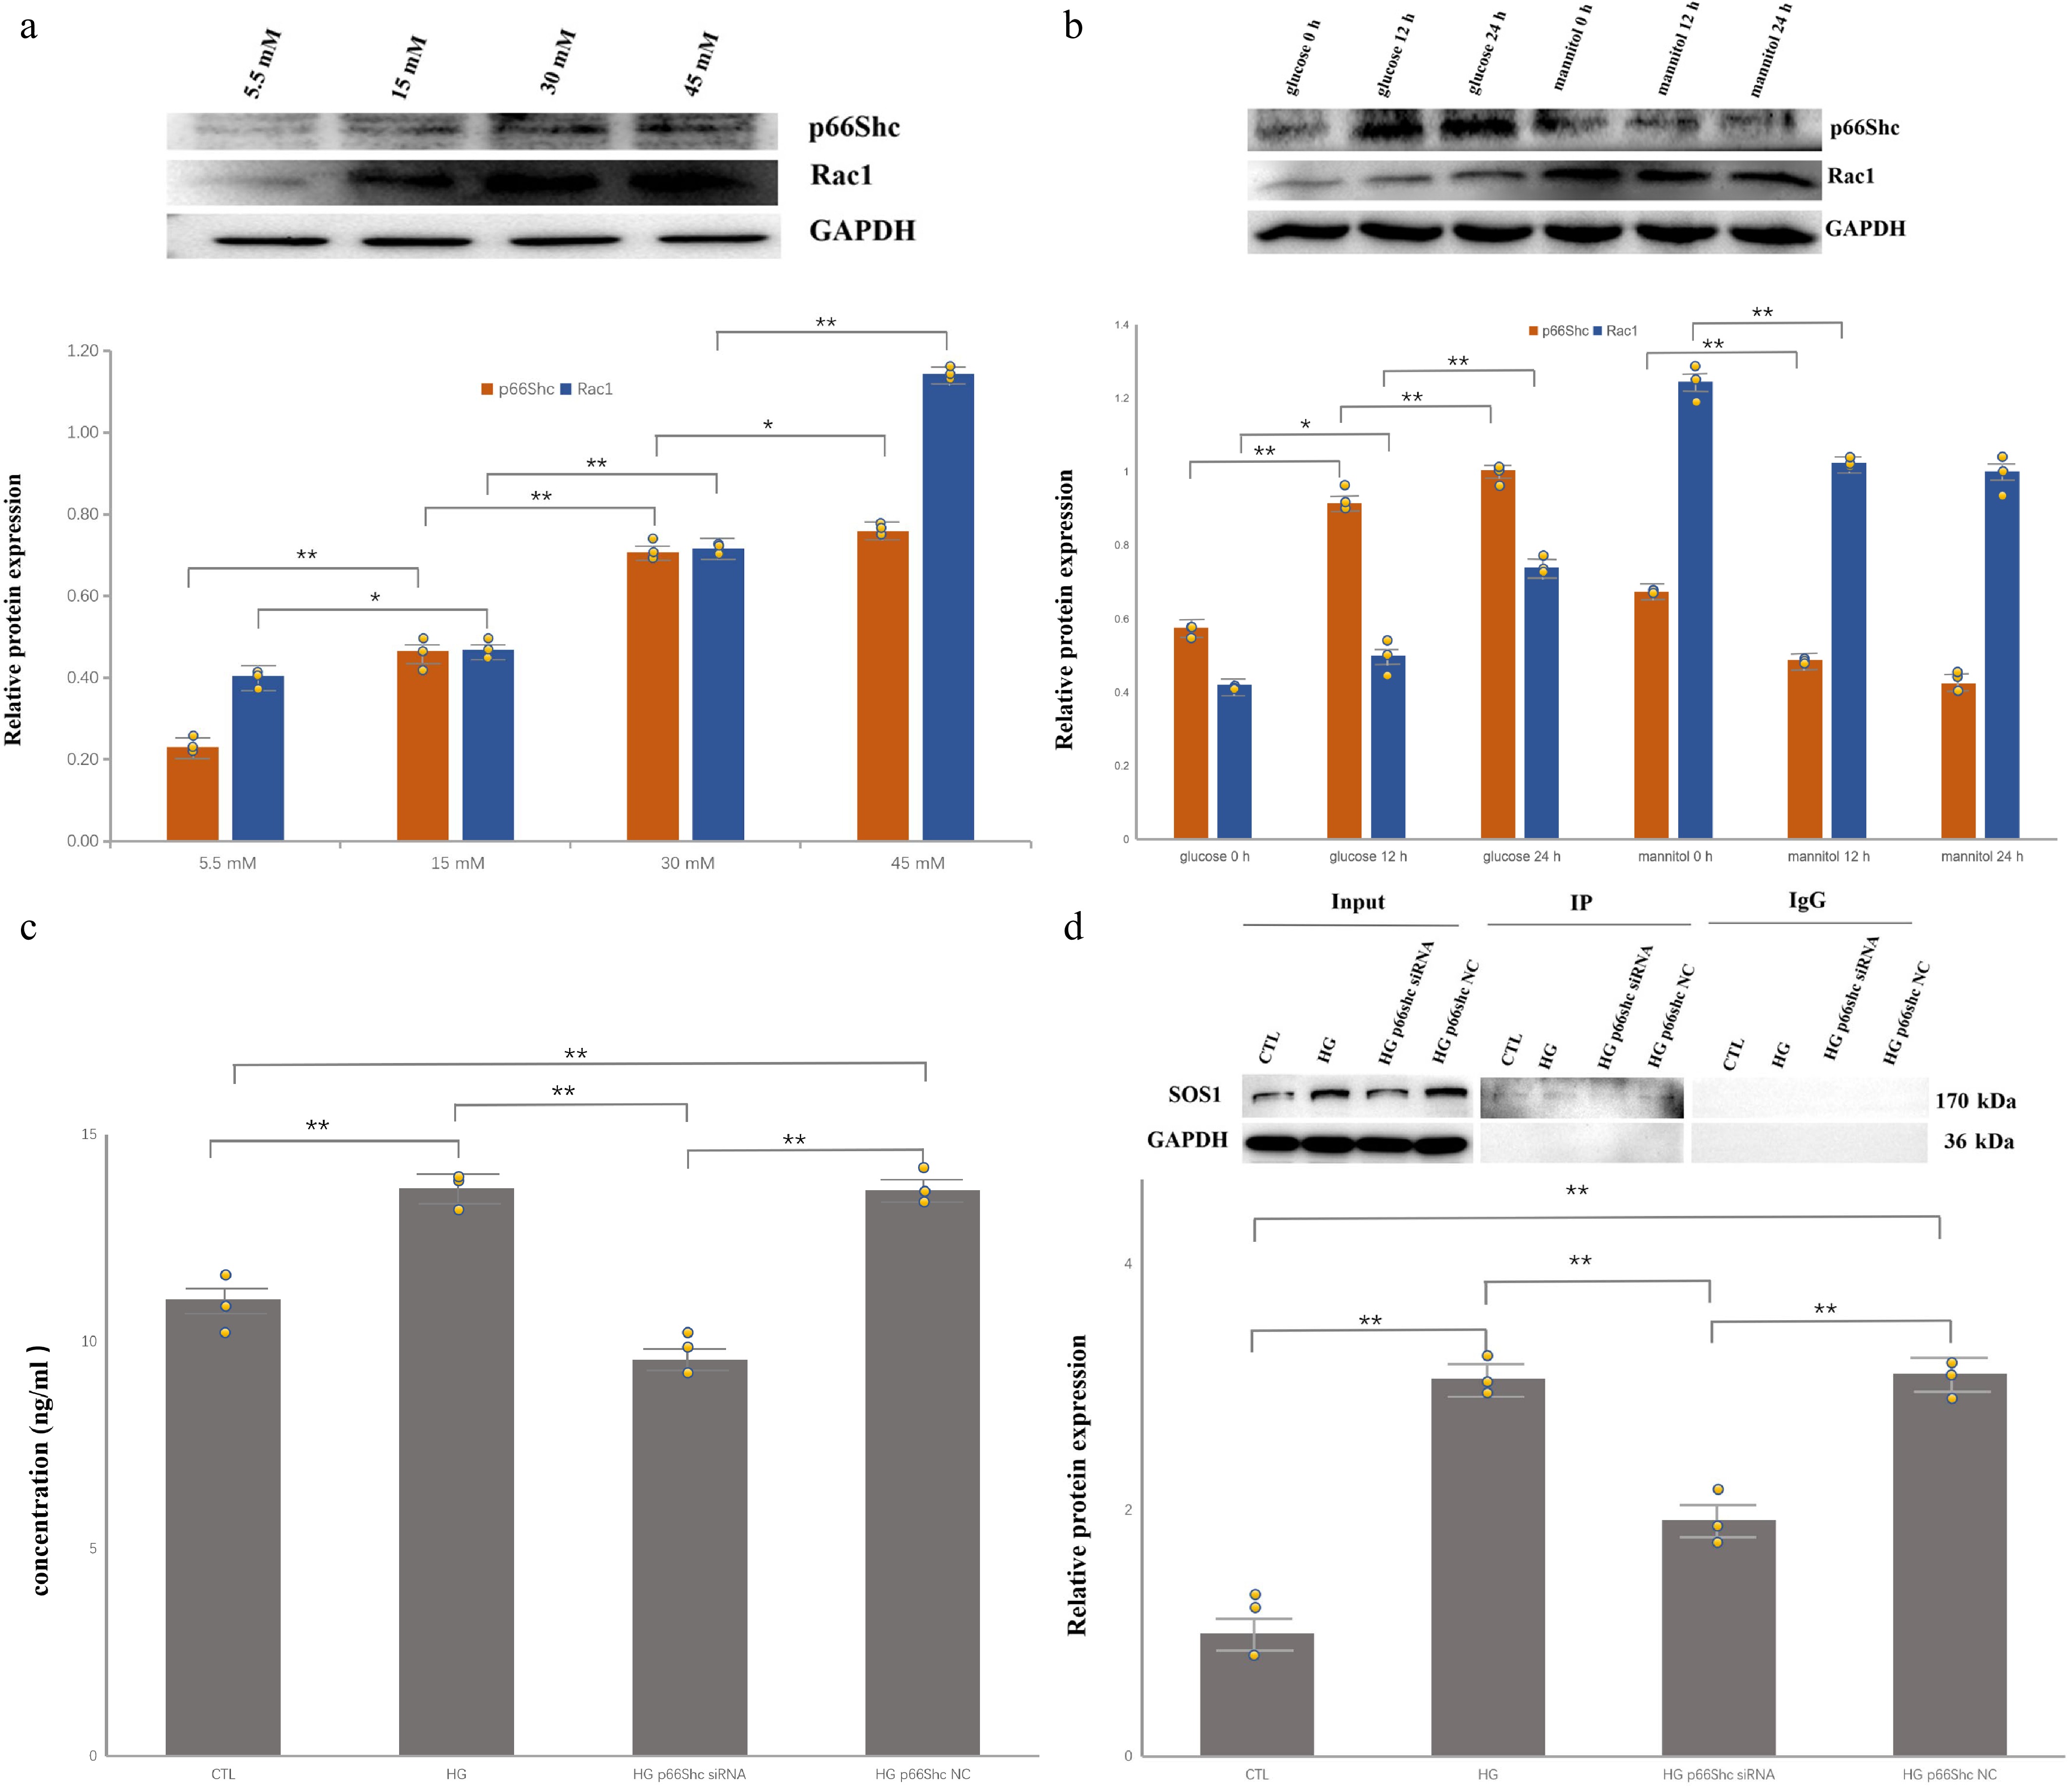
Figure 1.
High glucose upregulates p66Shc/Rac1 and promotes Sos1–Rac1 complex formation in HRPECs. Individual data points from independent biological replicates are overlaid on the bar graphs. (* p < 0.05, ** p < 0.01). (a) Representative Western blots and densitometric quantification showing concentration-dependent increases in p66Shc and Rac1 after 24 h of exposure to 5.5, 15, 30, and 45 mM glucose (n = 3). (b) Time-dependent induction of p66Shc and Rac1 at 0, 12, and 24 h in 30 mM glucose, with osmotic control (5.5 mM glucose + 24 mM mannitol, osmolarity-matched) showing no comparable increase (n = 3). (c) Rac1 quantification (ELISA) in control, HG, HG + p66Shc siRNA, and HG + negative control groups (n = 3). (d) Co-immunoprecipitation demonstrating increased association of Sos1 with Rac1 in HG-treated cells and attenuation after p66Shc knockdown.
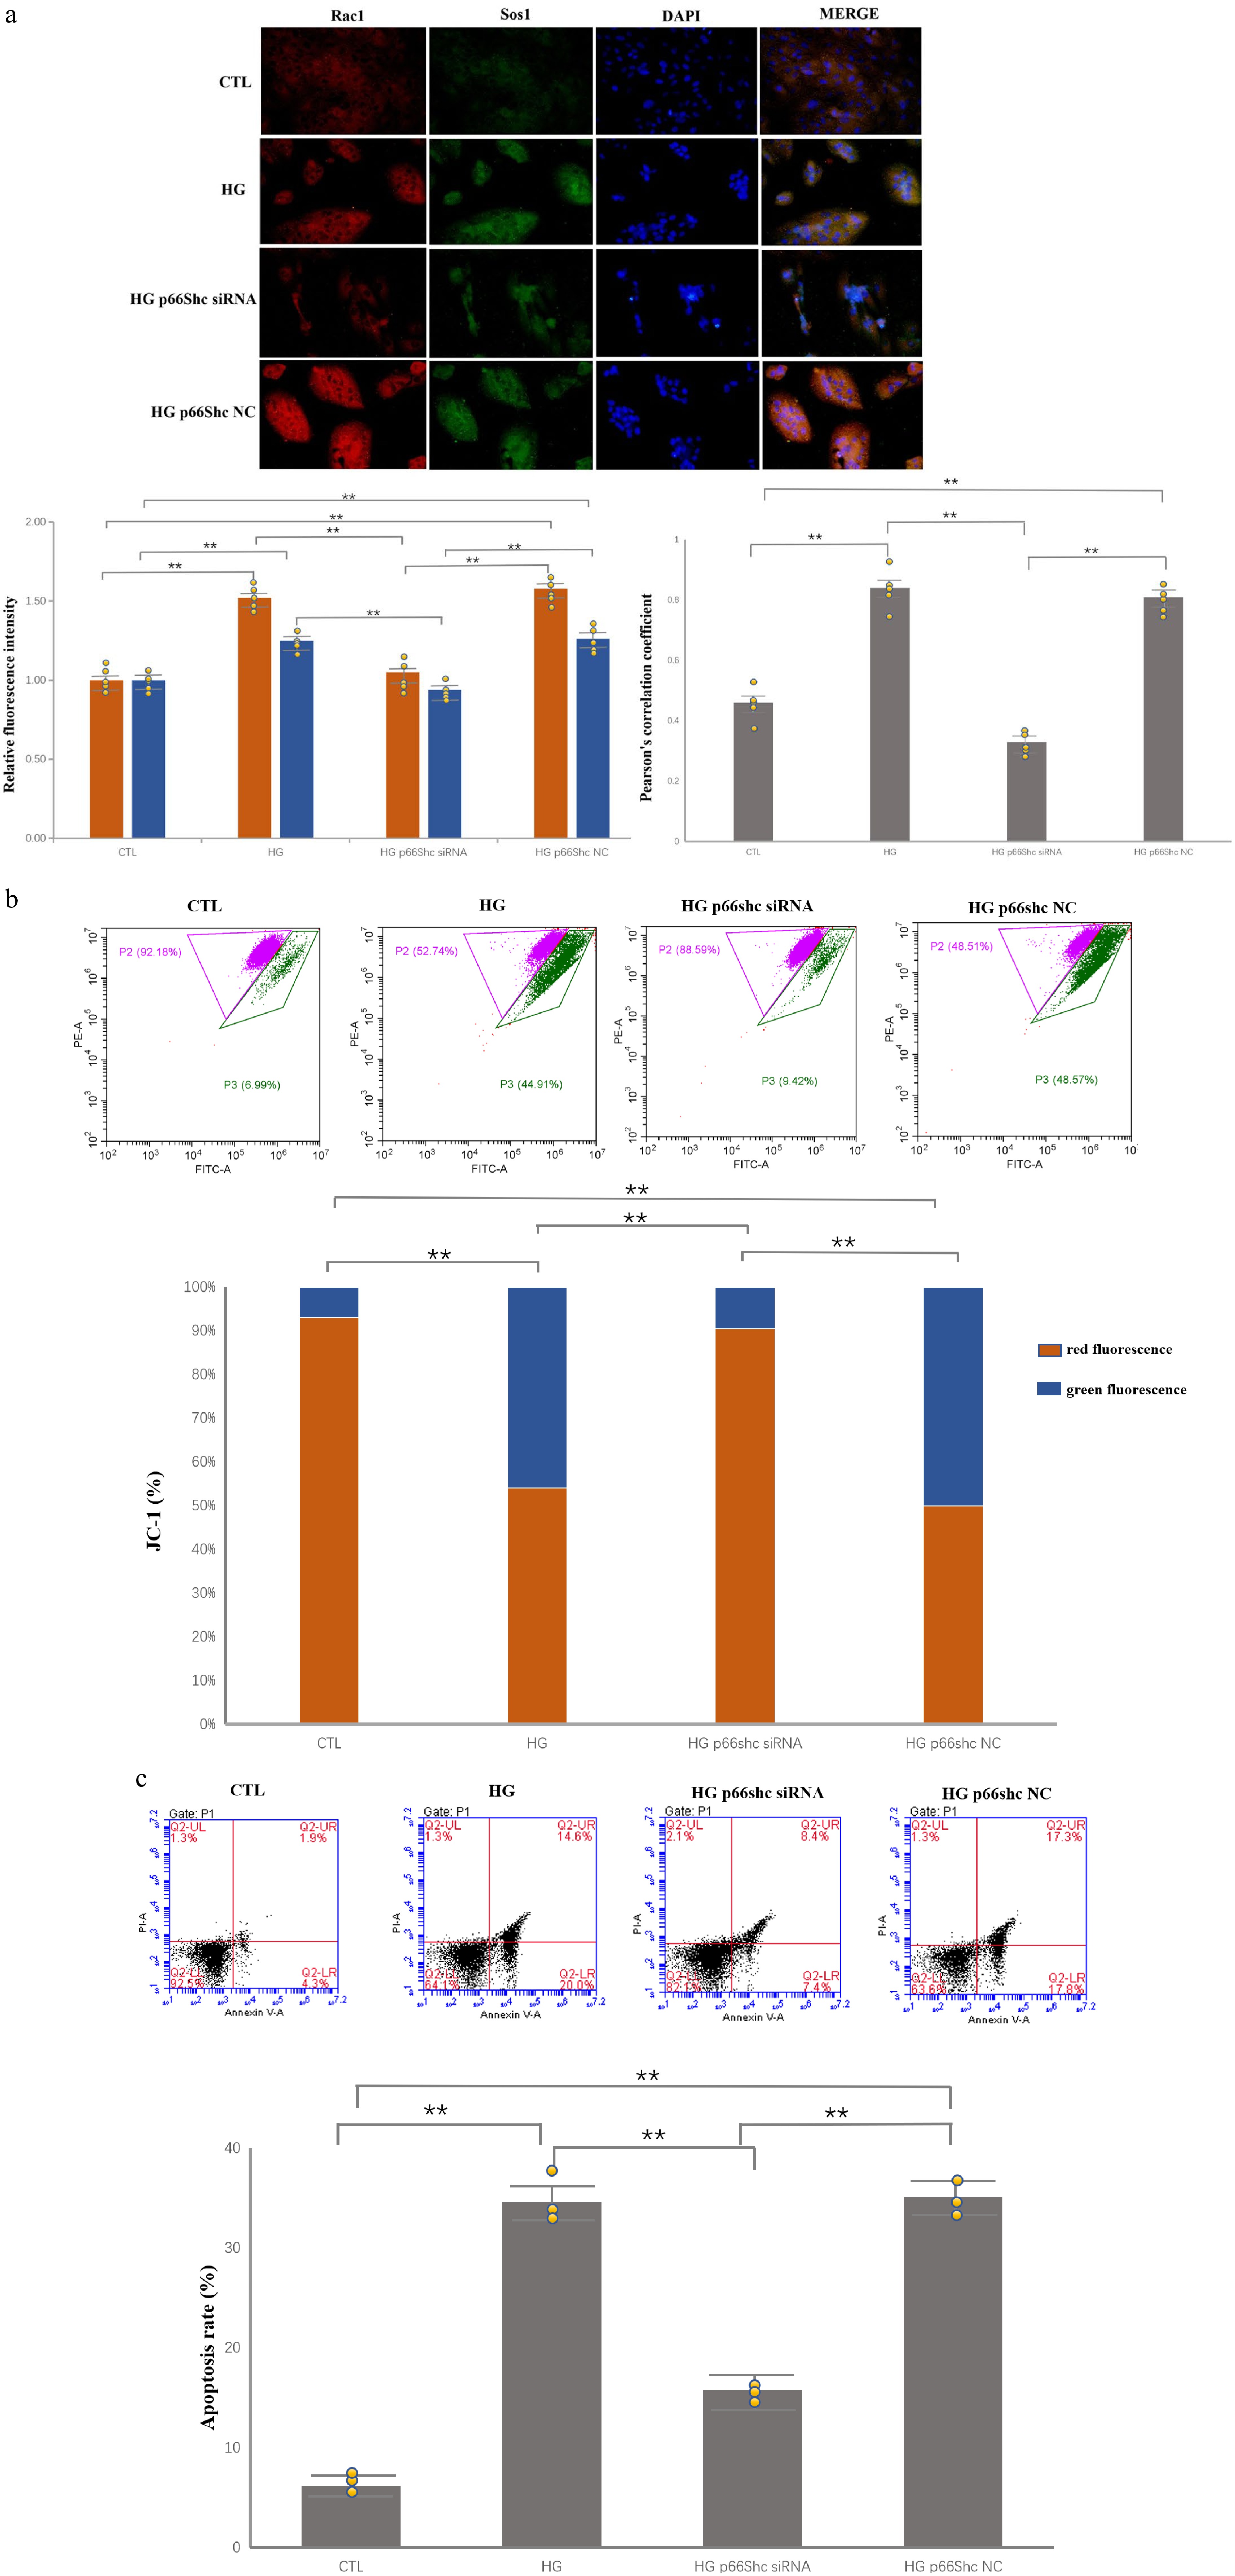
Figure 2.
p66Shc knockdown attenuates HG-induced mitochondrial depolarization and apoptosis. Individual data points from independent biological replicates are overlaid on the bar graphs. (* p < 0.05, ** p < 0.01). (a) Immunofluorescence images and quantification of Rac1 (red) and Sos1 (green) in HRPECs; merged yellow signal indicates co-localization. HG increases signal intensity and co-localization, whereas p66Shc siRNA reduces both. Pearson’s correlation coefficient was calculated using the ImageJ JACoP plugin from at least five randomly selected fields per group in three independent experiments. (b) JC-1 assay showing decreased mitochondrial membrane potential (lower red/green signal) in HG-treated cells and partial recovery after p66Shc knockdown (n = 3). (c) Annexin V/PI flow cytometry showing increased apoptosis in the HG and HG + NC groups, with a significant reduction in the HG + p66Shc siRNA group (n = 3).
-
HRPECs were cultured with different concentrations of D-glucose (5.5, 15, 30, and 45 mM). Western blotting was used to detect the expression of p66Shc and Rac1 proteins in HRPECs after 24 h of glucose stimulation.
Normal HRPECs expressed baseline levels of p66Shc and Rac1. As the glucose concentration increased, the expression of both p66Shc and Rac1 proteins gradually increased. The highest expression was observed in the 45-mM glucose treatment group. There were significant differences in protein expression among the groups (p < 0.05) (Fig. 1a).
Then HRPECs were stimulated with 30 mM D-glucose or 5.5 mM D-glucose plus 24 mM D-mannitol. Western blotting was used to detect the expression of p66Shc and Rac1 proteins at 0, 12, and 24 h after stimulation.
In the HG group, the intracellular levels of p66Shc and Rac1 proteins gradually increased over time (both p < 0.05). In contrast, in the isotonic control group (5.5 mM D-glucose plus 24 mM D-mannitol), the expression of p66Shc and Rac1 proteins did not increase with prolonged mannitol exposure, supporting a glucose-specific rather than an osmotic effect (Fig. 1b).
p66Shc is required for HG-enhanced Sos1–Rac1 signaling
-
After 48 h of transfection, p66Shc levels were assessed in HRPECs cultured under HG. Western blotting showed that in the p66Shc siRNA group, p66Shc protein was reduced by more than 62% compared with the CTL group and the NC group. These results confirmed effective knockdown (Supplementary Fig. S1).
To further confirm Rac1 protein levels, an ELISA assay was performed in addition to Western blotting. After 48 h of the HG intervention, ELISA was used to detect the expression of Rac1. The results showed that the expression of Rac1 in the HG group and the HG p66Shc NC group was significantly higher than that in the CTL group (p = 0.006). However, compared with the HG group, the expression of Rac1 in the HG p66Shc siRNA group significantly decreased (p = 0.004) (Fig. 1c).
To investigate the effect of high glucose on the interaction between Rac1 and Sos1, a co-IP assay was performed using a specific anti-Rac1 antibody for knockdown. Western blot analysis of the immunoprecipitates showed that the HG treatment (HG group) significantly enhanced the binding of Sos1 to Rac1 compared with the CTL group (p = 0.007).
To assess the role of p66Shc in this process, p66Shc siRNA was used. The results showed that compared with the HG group, knockdown of p66Shc (the HG p66Shc siRNA group) significantly attenuated the HG-induced enhancement of Sos1–Rac1 binding (p = 0.005). In contrast, there was no significant difference in Sos1–Rac1 binding between the HG p66Shc NC group and the HG group (p = 0.371). These data indicate that HG enhanced the Sos1–Rac1 interaction in a p66Shc-dependent manner under our experimental conditions (Fig. 1d).
Immunofluorescence double staining was used to assess the subcellular co-localization of the Sos1–Rac1 complex. Rac1 was labeled with red fluorescence, and Sos1 was labeled with green fluorescence. Cell nuclei were stained with blue fluorescence (DAPI).
After 96 h of glucose stimulation, compared with the CTL group, the total fluorescence intensity of both red (Rac1) and green (Sos1) signals was significantly increased in the HG group (p = 0.006 and p = 0.004, respectively) and the HG p66Shc NC group (p = 0.005 and p = 0.004, respectively). Compared with the HG group, the expression of both fluorescent signals was decreased in the HG p66Shc siRNA group (p = 0.007 and p = 0.005, respectively).
Visual inspection of the merged images showed enhanced co-localization (indicated by increased yellow signals) in the HG and HG p66Shc NC groups compared with the CTL group. This supports enhanced physical proximity or an interaction between the two proteins under HG conditions. In contrast, the yellow co-localization signal was significantly reduced in the HG p66Shc siRNA group, indicating that p66Shc knockdown effectively reduced the co-localization and potential interaction between Sos1 and Rac1. Overall, these co-localization data strongly support the enhanced interaction observed by co-IP (Fig. 2a).
Quantitative analysis using ImageJ JACoP further supported these observations. The Pearson's correlation coefficient between Sos1 and Rac1 was significantly higher in the HG group than in the CTL group (p = 0.004). The HG p66Shc NC group showed a similar increase (p = 0.005). After p66Shc knockdown, the Pearson's coefficient was significantly reduced (p = 0.004). These results provide objective support for the enhanced co-localization observed visually.
p66Shc knockdown preserves mitochondrial function and reduces apoptosis
-
The JC-1 fluorescent probe combined with flow cytometry was used to quantitatively assess changes in mitochondrial membrane potential. A decrease in mitochondrial membrane potential is reflected by a decrease in the ratio of red aggregate fluorescence to green monomer fluorescence.
Compared with the CTL group, the percentage of red fluorescence expression was significantly decreased in the HG group and HG p66Shc NC group (p = 0.005 and p = 0.008, respectively), indicating significant mitochondrial depolarization. Under HG conditions, after p66Shc knockdown (the HG p66Shc siRNA group), the percentage of red fluorescence expression was significantly restored, and the difference was statistically significant compared with the HG group (p = 0.004). These results indicate that p66Shc is a key factor mediating the HG-induced decrease in mitochondrial membrane potential (Fig. 2b).
After 48 h of the glucose intervention, flow cytometry was used to detect apoptosis. Compared with the CTL group, the apoptosis rate was significantly higher in the HG group and HG p66Shc NC group (p = 0.003 and p = 0.002, respectively). However, compared with the HG group, the apoptosis rate in the HG p66Shc siRNA group significantly decreased (p = 0.004). These results suggest that HG-induced apoptosis of HRPECs is regulated by p66Shc (Fig. 2c).
-
DR is a severe microvascular complication of both Type 1 and Type 2 diabetes mellitus and remains a major cause of visual impairment worldwide[1−4]. Its onset and progression are influenced by multiple systemic factors, including hypertension and other metabolic comorbidities[22]. A central mechanism in DR is hyperglycemia-driven oxidative stress, which promotes mitochondrial injury and apoptosis[23].
p66Shc is a redox-sensitive adaptor protein with oxidoreductase-related activity that can directly promote mitochondrial ROS generation and oxidative damage[16,18,24,25]. In diabetic disease models outside the retina, p66Shc has also been linked to glucose-related tissue injury. For example, AL Tamimi et al. showed that modulation of the PKCβ/p66Shc axis was associated with an improvement in diabetic nephropathy phenotypes[26]. Conversely, suppression of p66Shc-related signaling has been reported to enhance resistance to oxidative stress and improve vascular dysfunction in diabetes and aging-related contexts[27,28].
Most previous retinal studies have focused on inner retinal vascular cells, especially retinal endothelial cells and pericytes[18]. In contrast, our study emphasizes the RPE, a core component of the outer blood–retinal barrier[21]. Our findings indicate that HG triggers a sequential injury program in HRPECs, which progresses from stress-associated protein upregulation to mitochondrial dysfunction and apoptosis, and that this process is largely p66Shc-dependent. Given that p66Shc-mediated injury has already been demonstrated in inner retinal microvascular cells[18], our data extend this pathogenic framework to the outer barrier cells, supporting a broader role of p66Shc in DR progression.
We observed that increasing the glucose concentration induced dose-dependent upregulation of both p66Shc and Rac1 in HRPECs. Importantly, this pattern was not reproduced by mannitol, indicating that the response was glucose-specific rather than purely osmotic. This is consistent with reports that p66Shc functions as a metabolic redox sensor under diabetic stress[25,29]. Mechanistically, prior work suggests that HG can drive p66Shc's expression through transcriptional/epigenetic regulation, including p53 recruitment and increased H3K9 acetylation at the p66Shc promoter[18,19], which may also explain the induction pattern observed in our RPE model.
Co-IP and immunofluorescence analyses further showed that HG increased the association of p66Shc with Sos1 and promoted formation of the Sos1–Rac1 complex. These findings support a model in which p66Shc acts upstream of Rac1's activation and amplifies cytosolic oxidative signaling. Because activated Rac1 is a key regulator of NADPH oxidase-dependent ROS generation, this pathway provides a plausible mechanism linking hyperglycemia to cytosolic ROS amplification[18,30,31]. We did not directly measure intracellular or mitochondrial ROS in the present study. The ROS amplification step is therefore inferred from prior literature and not from our own data.
In parallel, we found marked mitochondrial membrane depolarization under HG, together with increased apoptosis. p66Shc silencing significantly alleviated both phenotypes. These results are in agreement with studies showing that p66Shc can translocate to the mitochondria under oxidative stress and enhance ROS production through cytochrome C-related redox reactions[16,32,33]. Excessive ROS then drives feed-forward mitochondrial damage and loss of membrane potential[34,35]. Together, our data support a cytosol–mitochondria amplification axis in which p66Shc couples Rac1-related oxidative signaling to mitochondrial failure.
Functionally, p66Shc upregulation significantly promoted apoptosis of the RPE, whereas inhibition of p66Shc reversed this effect. Since degeneration of the RPE compromises the outer blood–retinal barrier's integrity, this mechanism may contribute to fluid dysregulation and progressive retinal injury. This interpretation is consistent with previous RPE data showing that modulation of p66Shc can protect cells from HG injury[29]. In addition, inhibition of p66Shc has shown neuroprotective effects in retinal ischemia–reperfusion models through activation of the Akt pathway[36], suggesting that p66Shc-targeted strategies may provide combined barrier and neuroretinal protection in DR.
This study has several limitations. First, it is based on an in vitro HRPEC model and cannot fully capture the multicellular interactions and hemodynamic characteristics of the diabetic retina. Second, although p66Shc-associated signaling and functional injury endpoints were clearly altered, upstream transcriptional regulation and broader downstream network effects were not comprehensively dissected in RPE cells. Future work should validate these findings in diabetic animal models, test specific p66Shc-targeting interventions, and further define pathways' crosstalk, including Akt- and p53-related signaling[18,36]. Third, p66Shc's biology is context-dependent. In oncology and other disease settings, p66Shc may show bidirectional or pleiotropic effects[37−40]. Therefore, translational development should prioritize retina-specific delivery and/or retinal downstream effectors to maximize therapeutic benefit in DR while minimizing systemic risk. Fourth, several mechanistic assays were not performed in this study. We did not directly measure ROS by 2′,7′-Dichlorodihydrofluorescein diacetate (DCFH-DA) or mitochondrial ROS by MitoSOX. Oxidative damage indices such as 8-Hydroxy-2′-deoxyguanosine (8-OHdG), 4-Hydroxy-2-nonenal (4-HNE), malondialdehyde, sodium dismutase, and Glutathione peroxidase (GSH-Px) were also not assessed. Mitochondrial function was only evaluated by membrane potential. Production of adenosine triphosphate and the oxygen consumption rate were not measured. Gene expression validation by quantitative polymerase chain reaction (qPCR) was not included. Alternative signaling pathways such as Akt and p53 were not functionally tested. These pathways have been reported to interact with p66Shc in other tissues. Future studies will incorporate these assays. They will help link p66Shc activity to oxidative damage, energy metabolism, transcriptional regulation, and pathway crosstalk in HRPECs. Finally, we did not perform p66Shc gain-of-function experiments. We also did not use Rac1 or Nox2 inhibitors to block the downstream pathway. Therefore, our data support a contributory role of p66Shc rather than a strictly defined master regulatory role. Future work will include p66Shc overexpression under normal or low glucose conditions. We will also apply selective Rac1 and Nox2 inhibitors to confirm the proposed cytosol–mitochondria axis.
-
In conclusion, our results show that p66Shc upregulation is an important event in HG-induced cellular injury in RPE cells. This event is associated with mitochondrial dysfunction and apoptosis. The p66Shc-related signaling axis is a candidate therapeutic target for DR. Future studies should include direct ROS measurement, broader mitochondrial function assays, qPCR-based gene level confirmation, and functional analysis of related pathways such as Akt and p53.
-
The study was conducted in accordance with the Declaration of Helsinki, and the protocol was approved by the Ethics Committee of Shanghai Municipal Hospital of Traditional Chinese Medicine, Shanghai University of Traditional Chinese Medicine (2024SHL-KY-85-01; Approval Date: June 3, 2024). This study involved the use of established human cell lines. The HRPEC line used in this research was obtained from the Cell Resources Center, Shanghai Academy of Life Sciences (Shanghai, China), and was used in accordance with institutional and national ethical standards. No new human tissues were collected or used in this study.
-
The authors confirm their contributions to the paper as follows: study conception and design: Zhao M, Song Y; data collection and implementation of the study: Liu J, Li J; analysis and interpretation of the results: Zhao M, Liu R; draft manuscript preparation: Zhao M, Li J. All authors reviewed the results and approved the final version of the manuscript.
-
The datasets generated during and/or analyzed during the current study are available from the corresponding author on reasonable request.
-
The authors declare that they have no conflict of interest.
-
accompanies this paper online at: https://doi.org/10.48130/vns-0026-0041.
-
# Authors contributed equally: Minghui Zhao, Juan Li
- Supplementary Fig. S1 Validation of p66Shc knockdown by Western blot in HRPECs.
- Copyright: © 2026 by the author(s). Published by Maximum Academic Press, Fayetteville, GA. This article is an open access article distributed under Creative Commons Attribution License (CC BY 4.0), visit https://creativecommons.org/licenses/by/4.0/.
-
About this article
Cite this article
Zhao M, Li J, Liu J, Liu R, Song Y. 2026. p66Shc contributes to high glucose-induced injury in human retinal pigment epithelial cells via the Sos1–Rac1 axis. Visual Neuroscience 43: e045 doi: 10.48130/vns-0026-0041 

p66Shc contributes to high glucose-induced injury in human retinal pigment epithelial cells via the Sos1–Rac1 axis
- Received: 22 March 2026
- Revised: 27 July 2026
- Accepted: 31 July 2026
- Published online: 29 September 2026
Abstract: Retinal pigment epithelial (RPE) dysfunction contributes to diabetic retinopathy (DR), but the upstream molecular mediators linking hyperglycemia to mitochondrial injury in RPE cells remain incompletely defined. This study investigated whether p66Shc regulates high glucose (HG)-induced injury in human RPE cells (HRPECs), with a focus on Son of Sevenless 1 (Sos1)–Rac1 signaling. HRPECs were exposed to increasing glucose concentrations or an osmotic control. p66Shc was silenced using siRNA. Protein expression and protein–protein interactions were assessed by Western blotting and co-immunoprecipitation, and subcellular co-localization was evaluated by immunofluorescence. Mitochondrial membrane potential (ΔΨm) and apoptosis were quantified using 5,5′,6,6′-Tetrachloro-1,1′,3,3′-tetraethylbenzimidazolylcarbocyanine iodide (JC-1) and flow cytometry, respectively. HG exposure increased p66Shc and Rac1 expression in a concentration-and time-dependent manner, whereas osmotic control did not induce comparable changes. HG enhanced Sos1–Rac1 complex formation and increased the co-localization of Sos1 with Rac1. p66Shc knockdown significantly reduced Rac1's abundance, attenuated Sos1–Rac1 interactions, restored ΔΨm, and decreased apoptosis under HG conditions. These findings indicate that p66Shc contributes to HG-induced cellular stress. It promotes Sos1-dependent Rac1 signaling. This process is associated with mitochondrial depolarization and apoptosis in HRPECs. Targeting the p66Shc/Sos1–Rac1 axis may help protect the outer blood–retinal barrier in DR.
-
Key words:
- Diabetic retinopathy /
- p66Shc /
- Retinal pigment epithelium /
- Mitochondrial dysfunction /
- Apoptosis