-
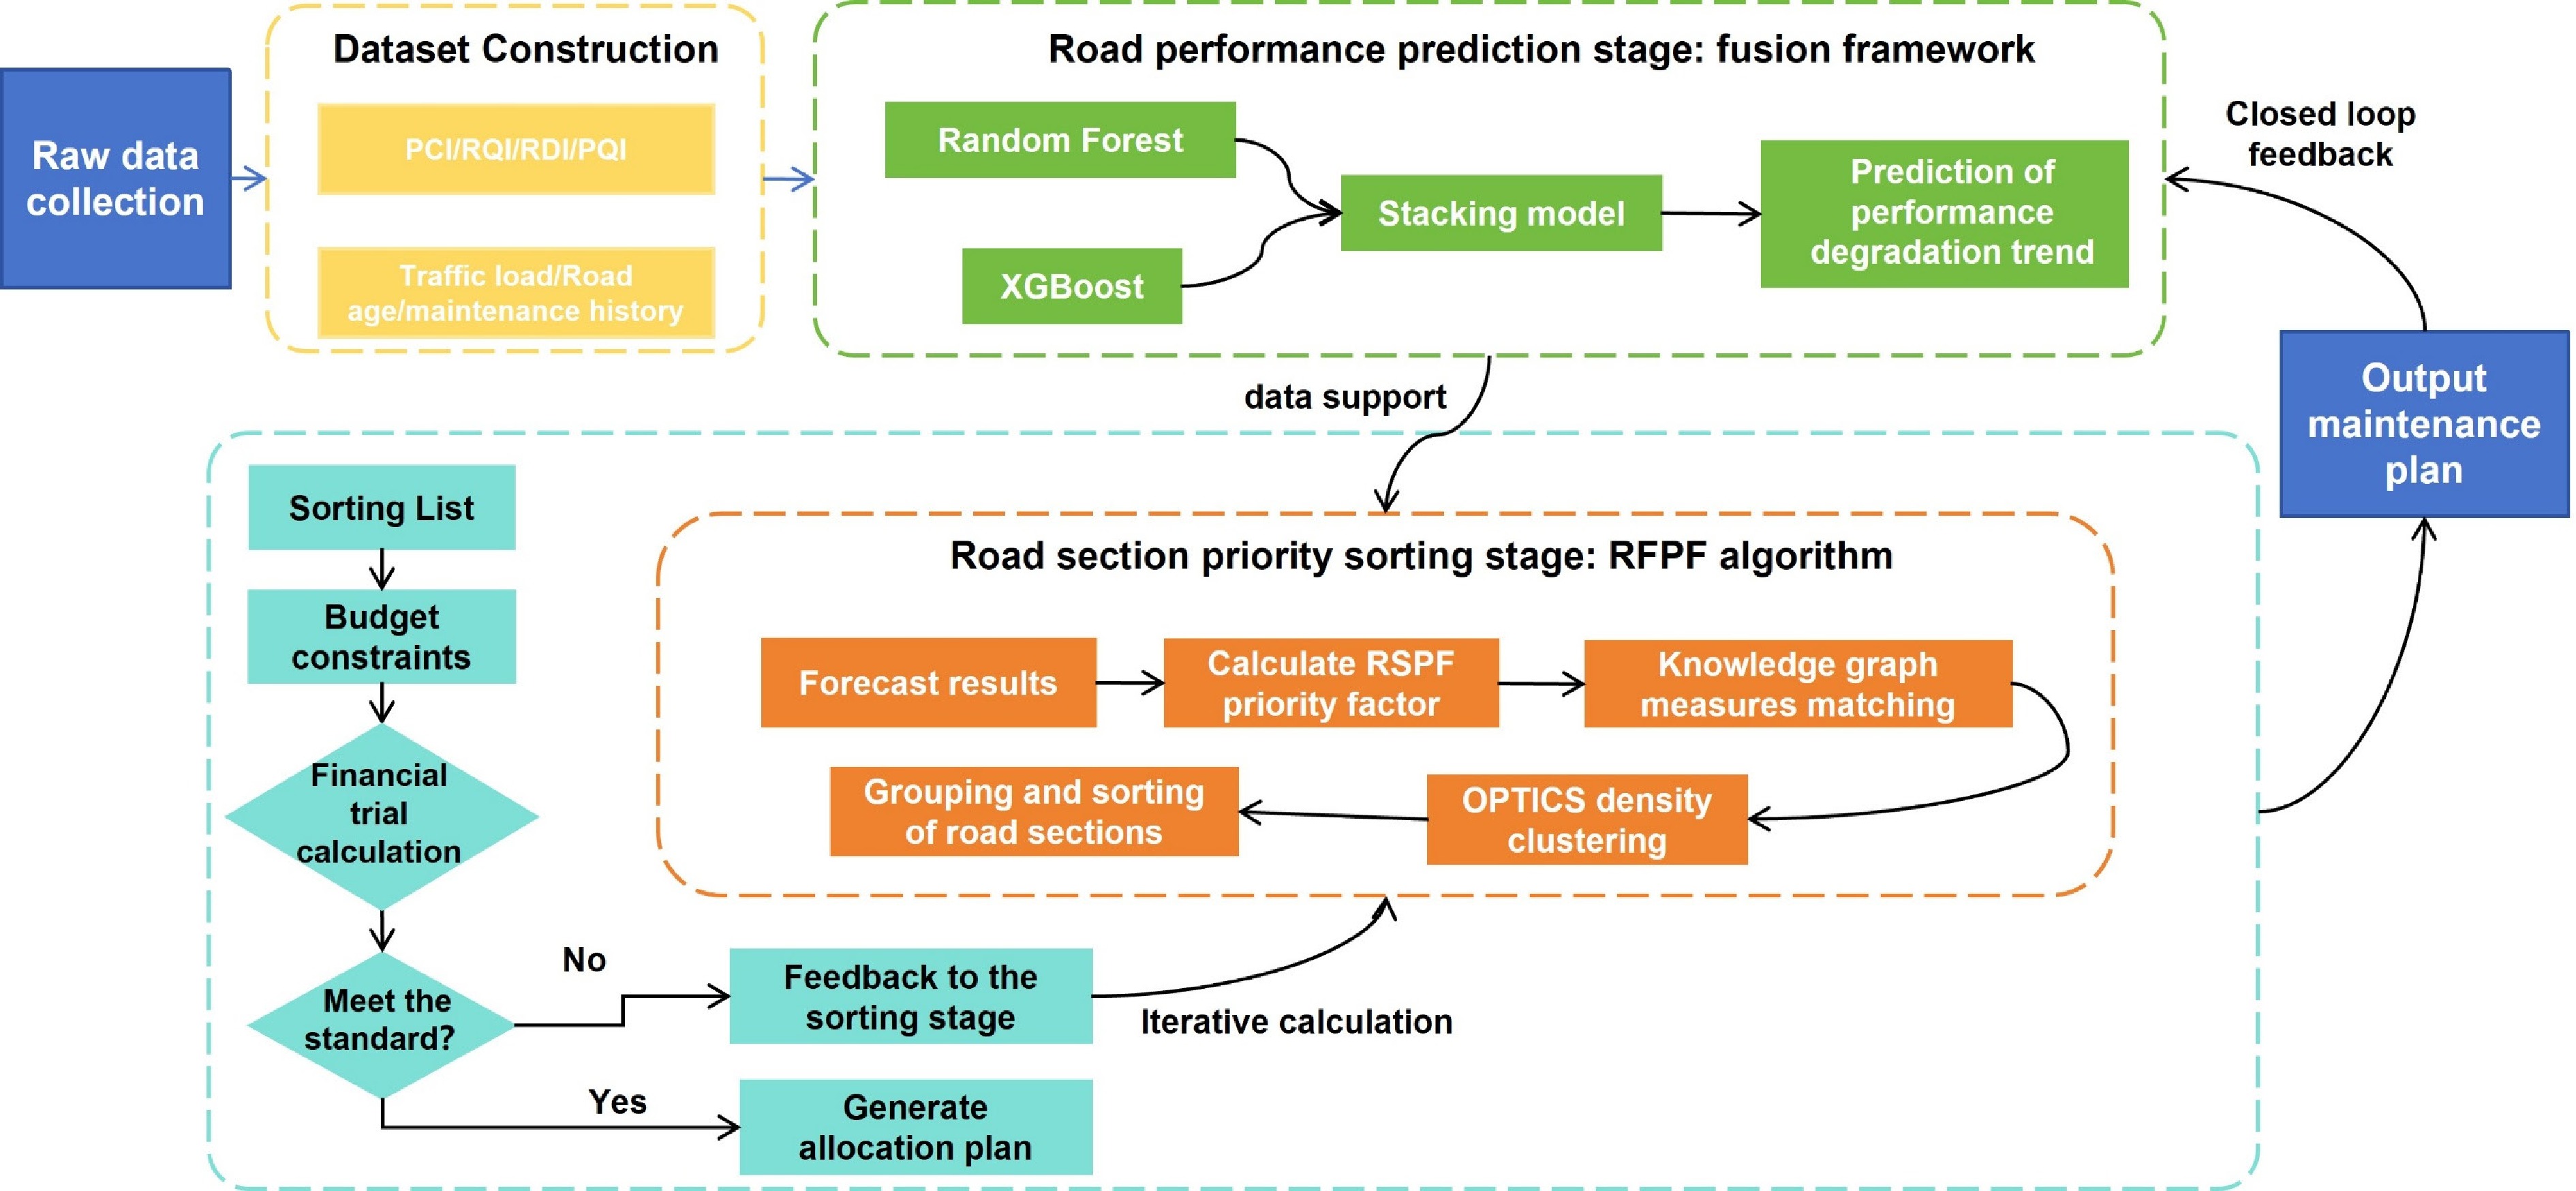
Figure 1.
Technical route.
-
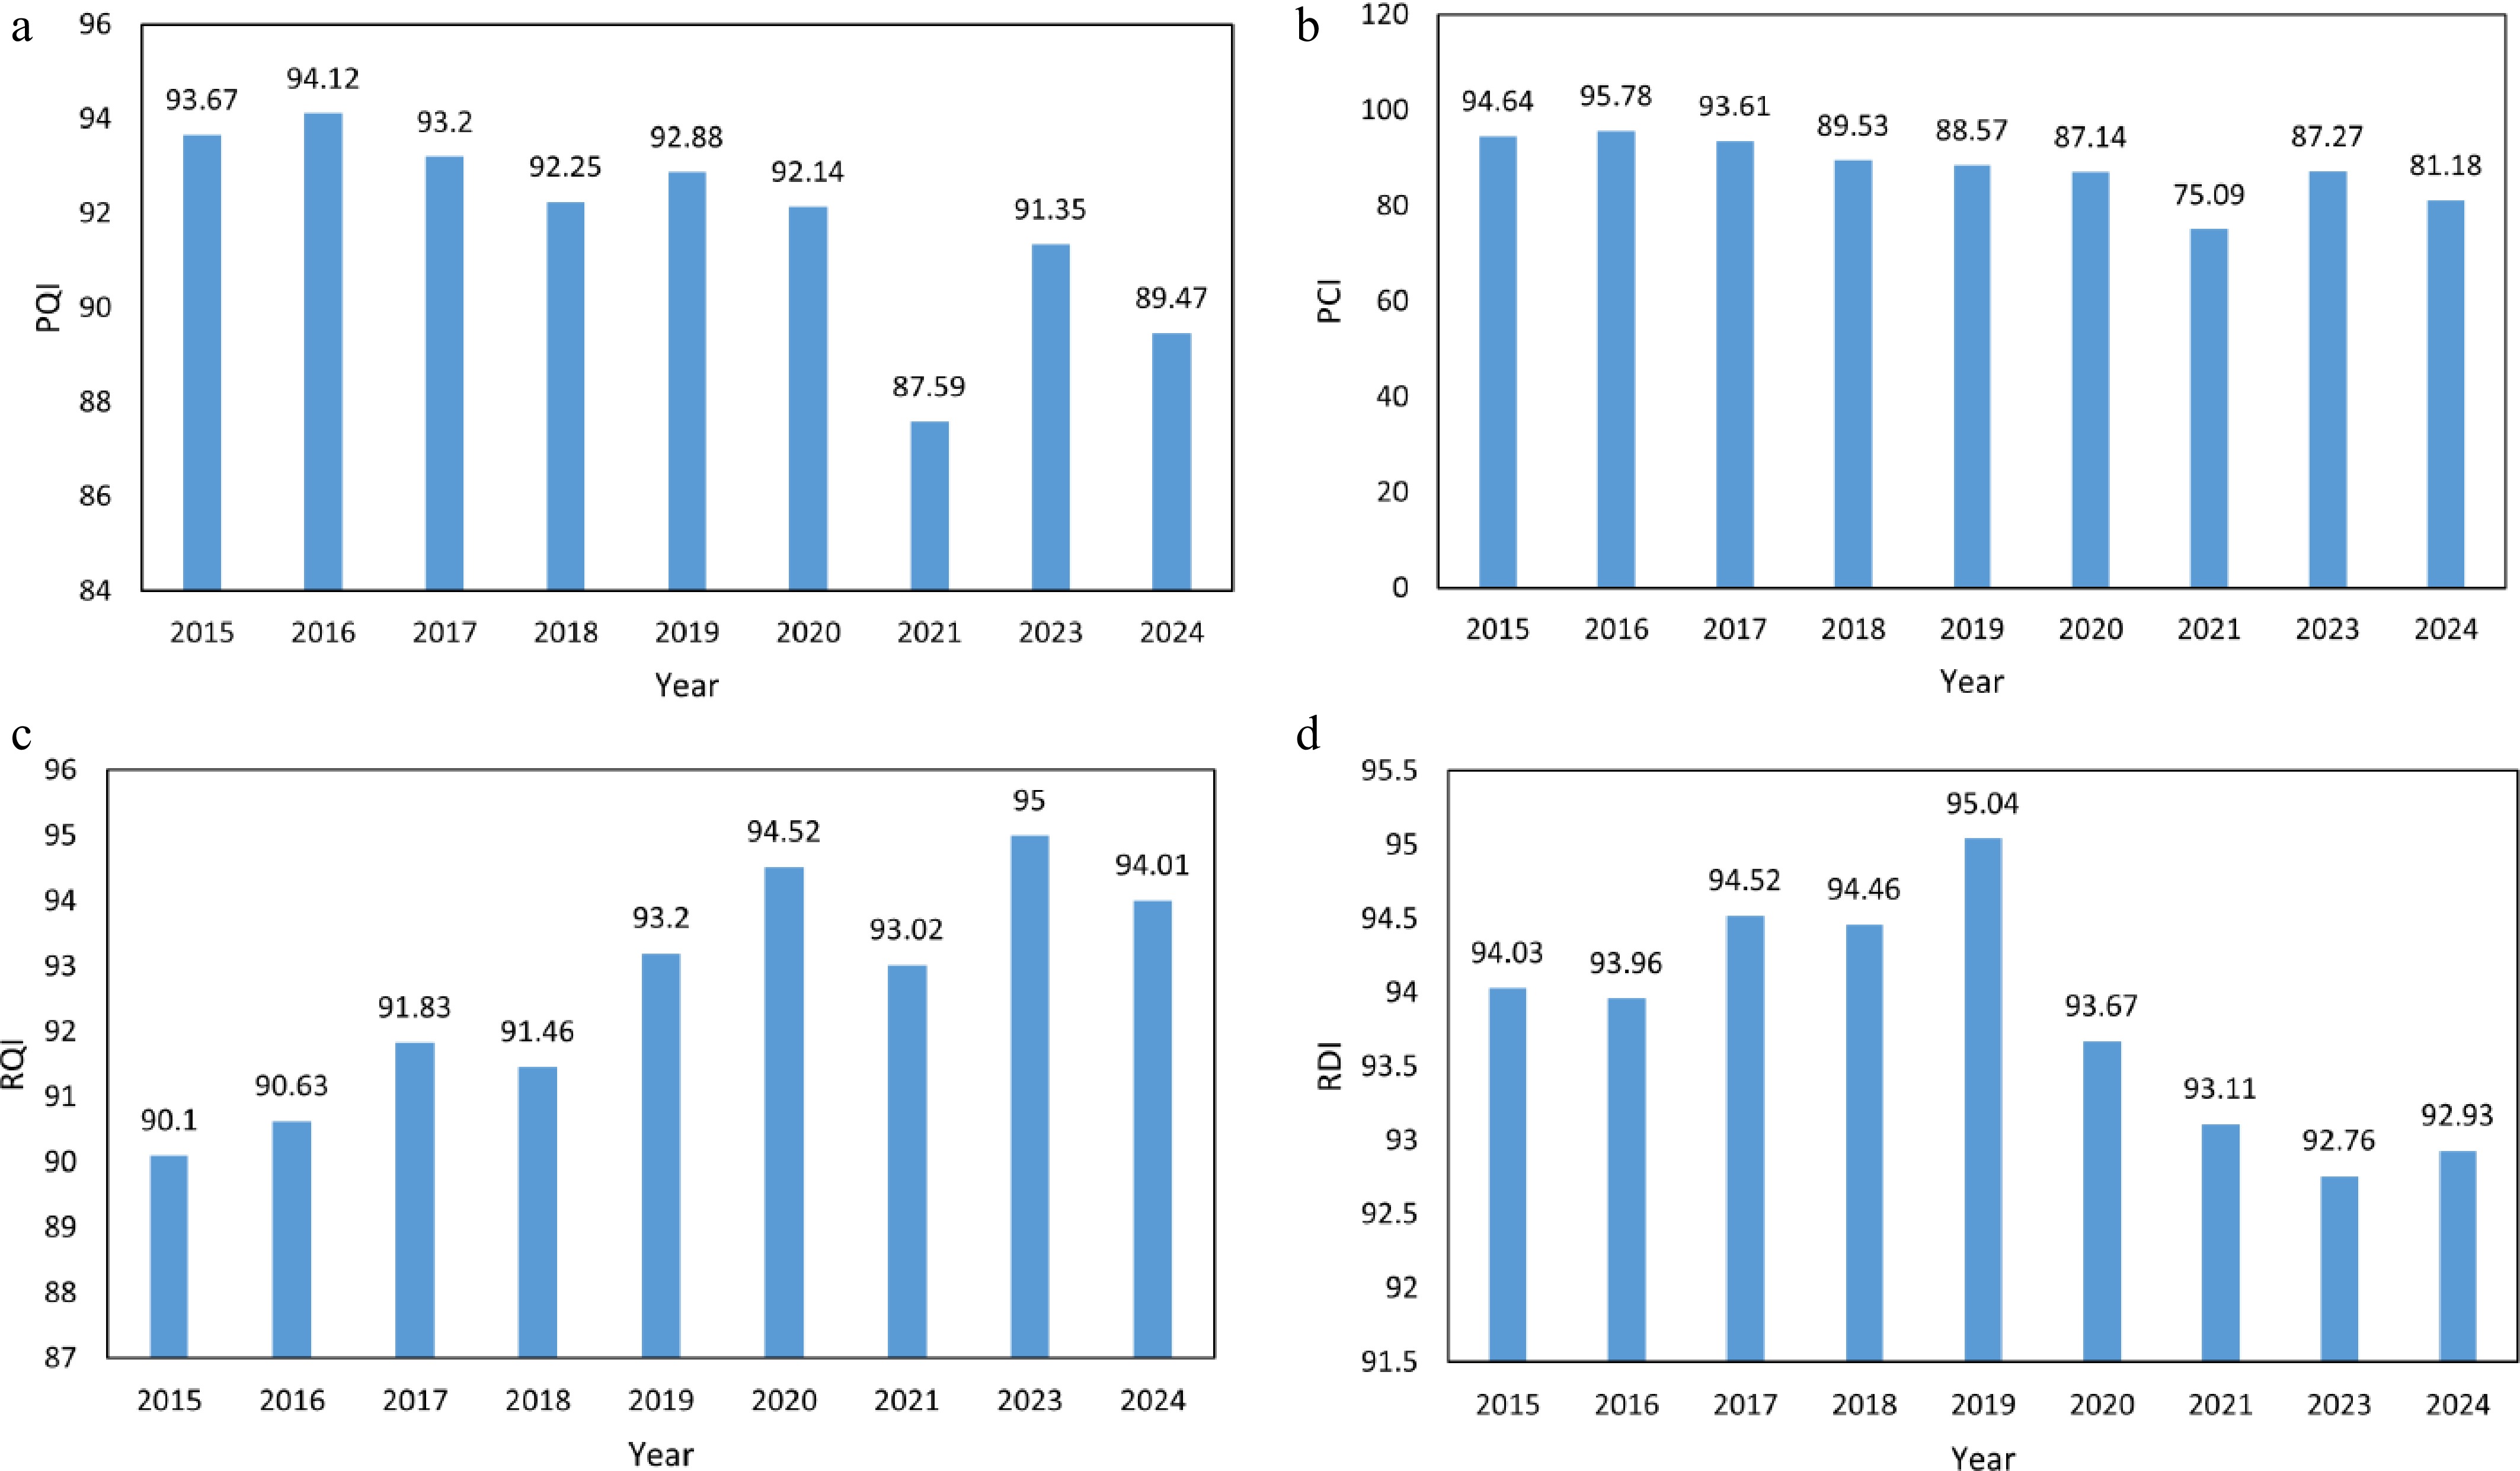
Figure 2.
Trends in the average values of the four core pavement performance indicators from 2015 to 2024. (a) PQI; (b) PCI; (c) RQI; (d) RDI.
-
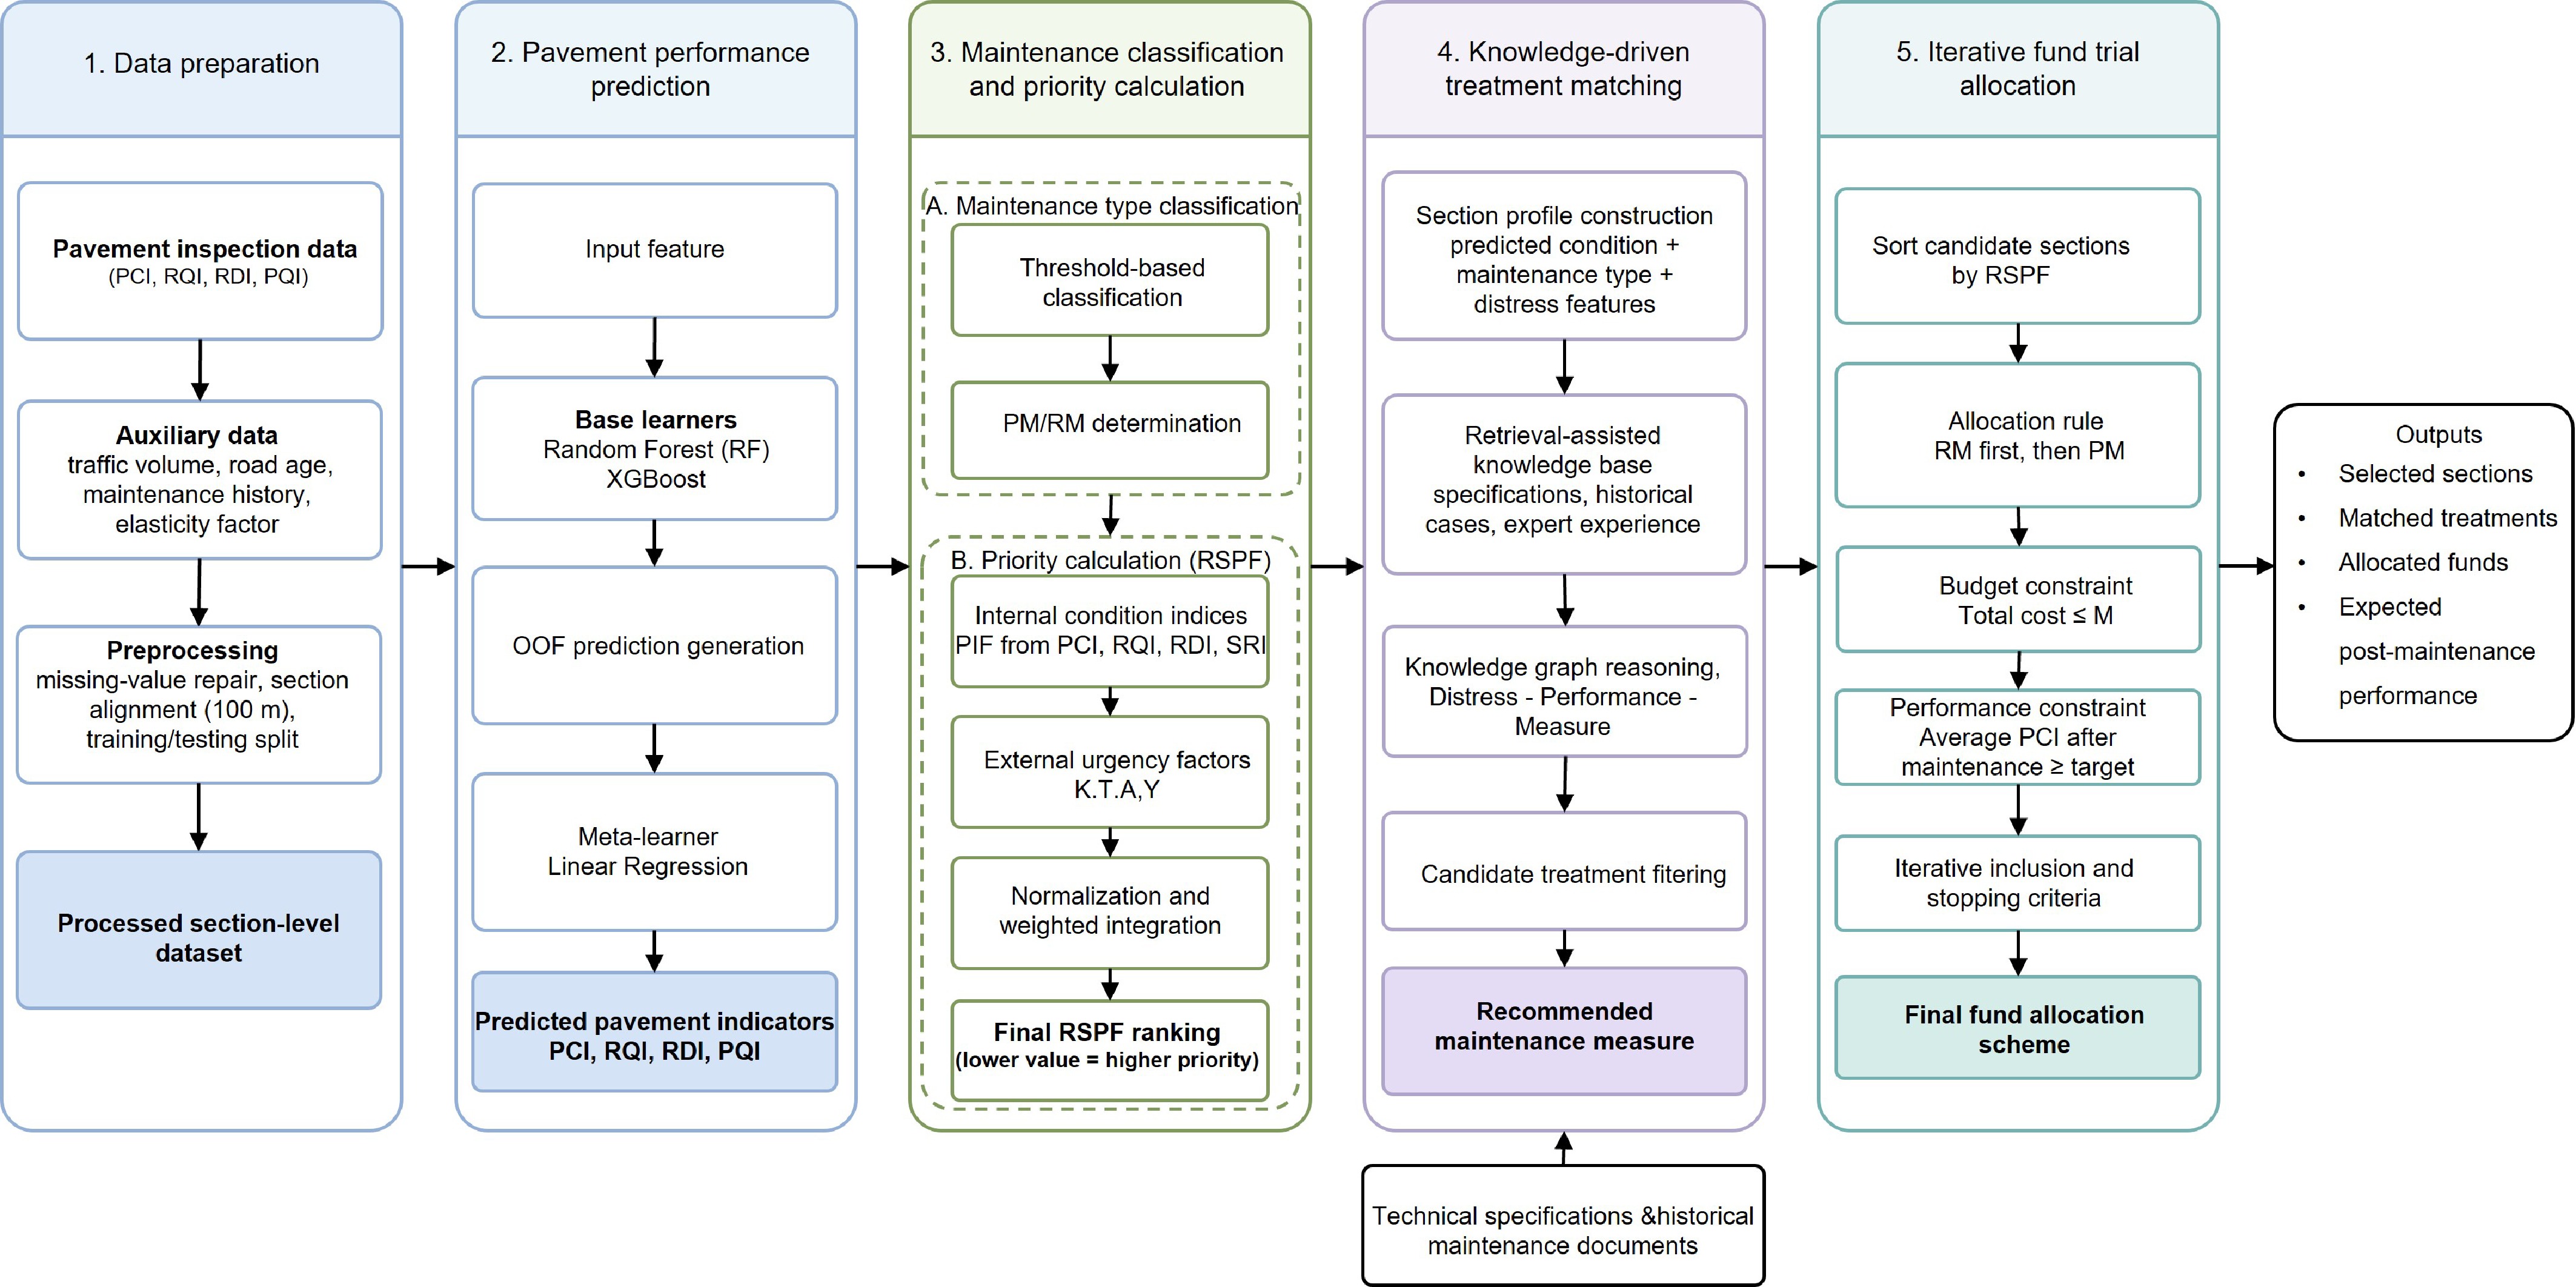
Figure 3.
Detailed methodological workflow of the proposed framework.
-
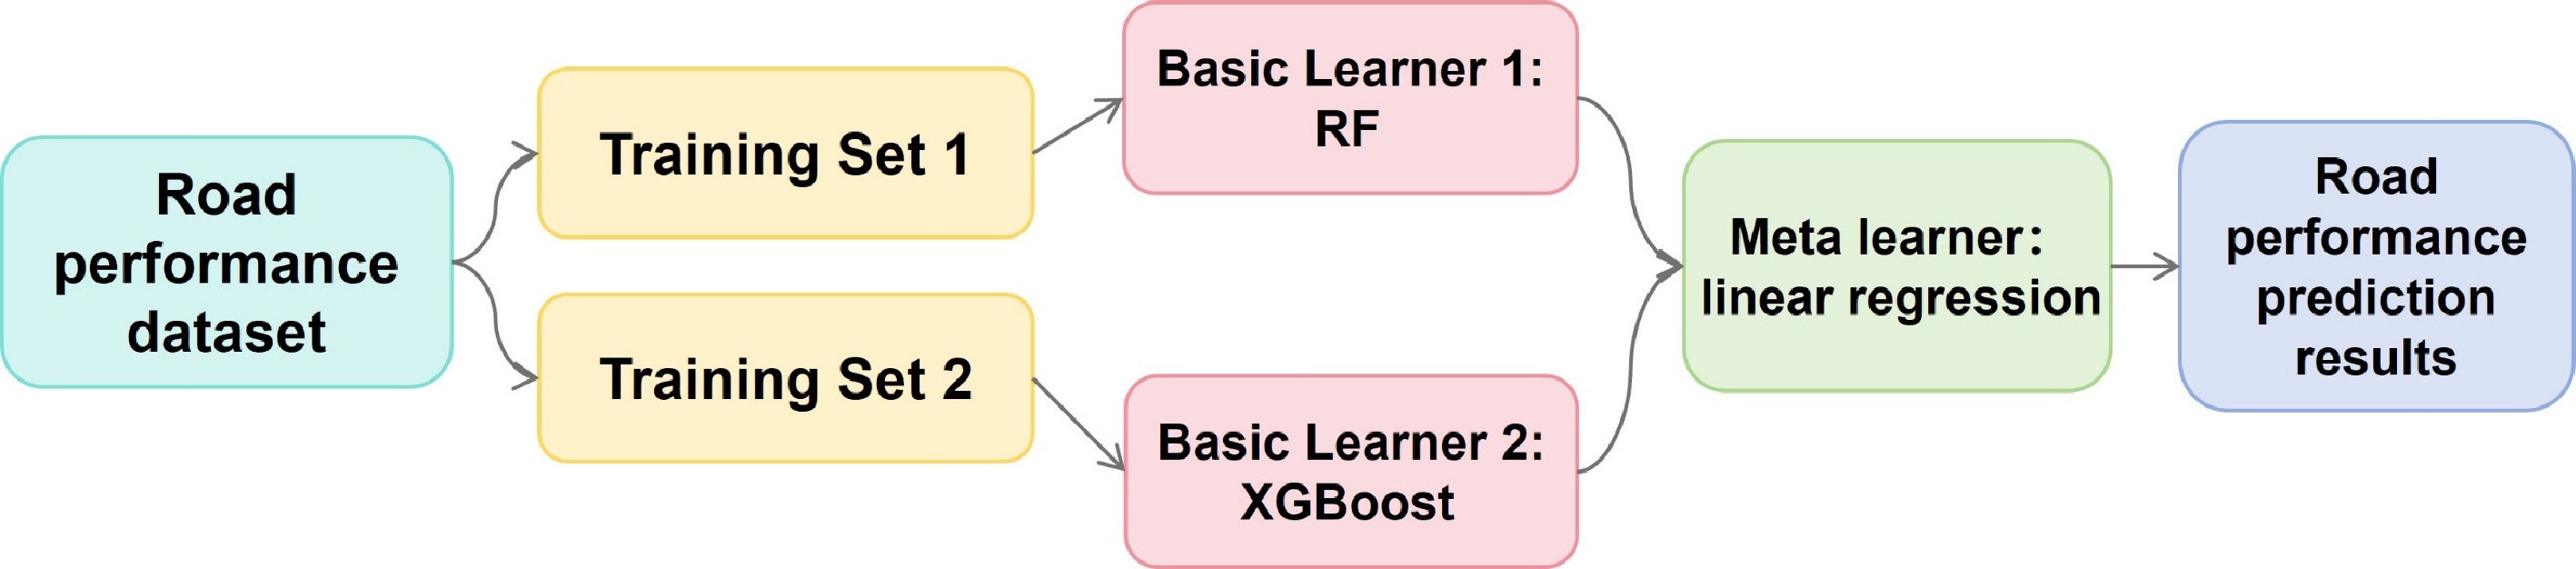
Figure 4.
Pavement performance prediction model based on stacking fusion.
-
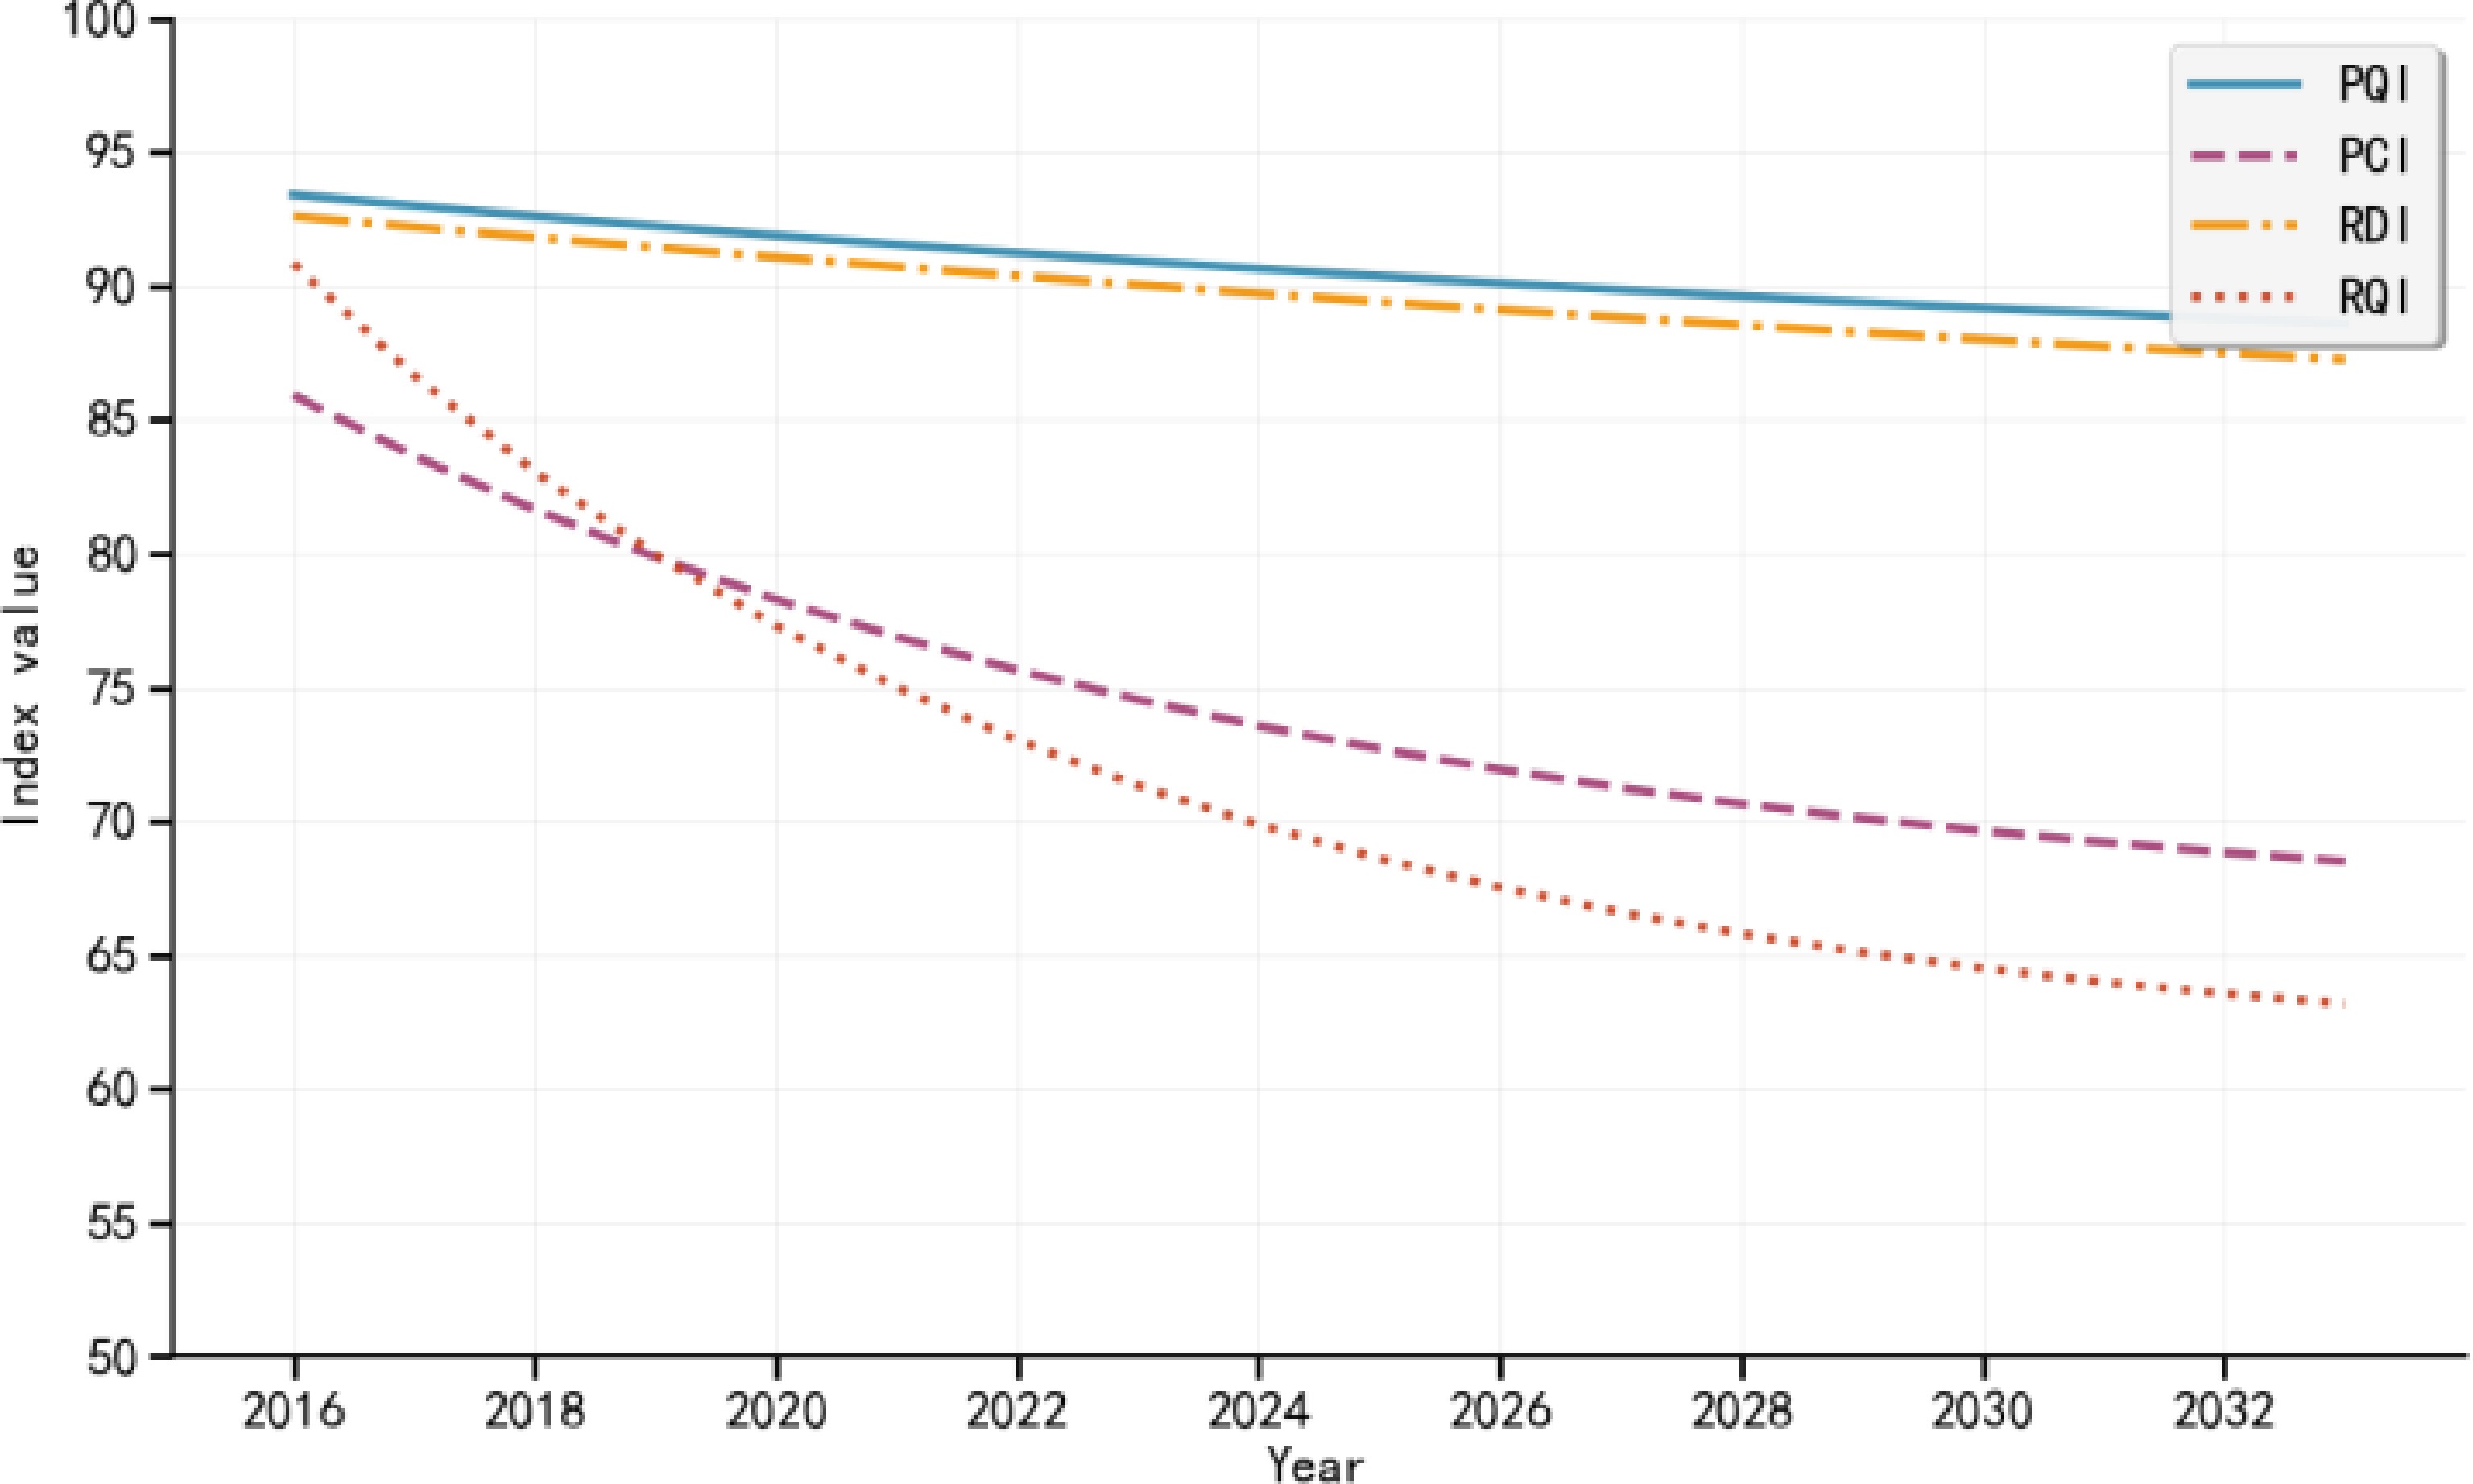
Figure 5.
Evolution trends of pavement performance indices (2016–2033).
-
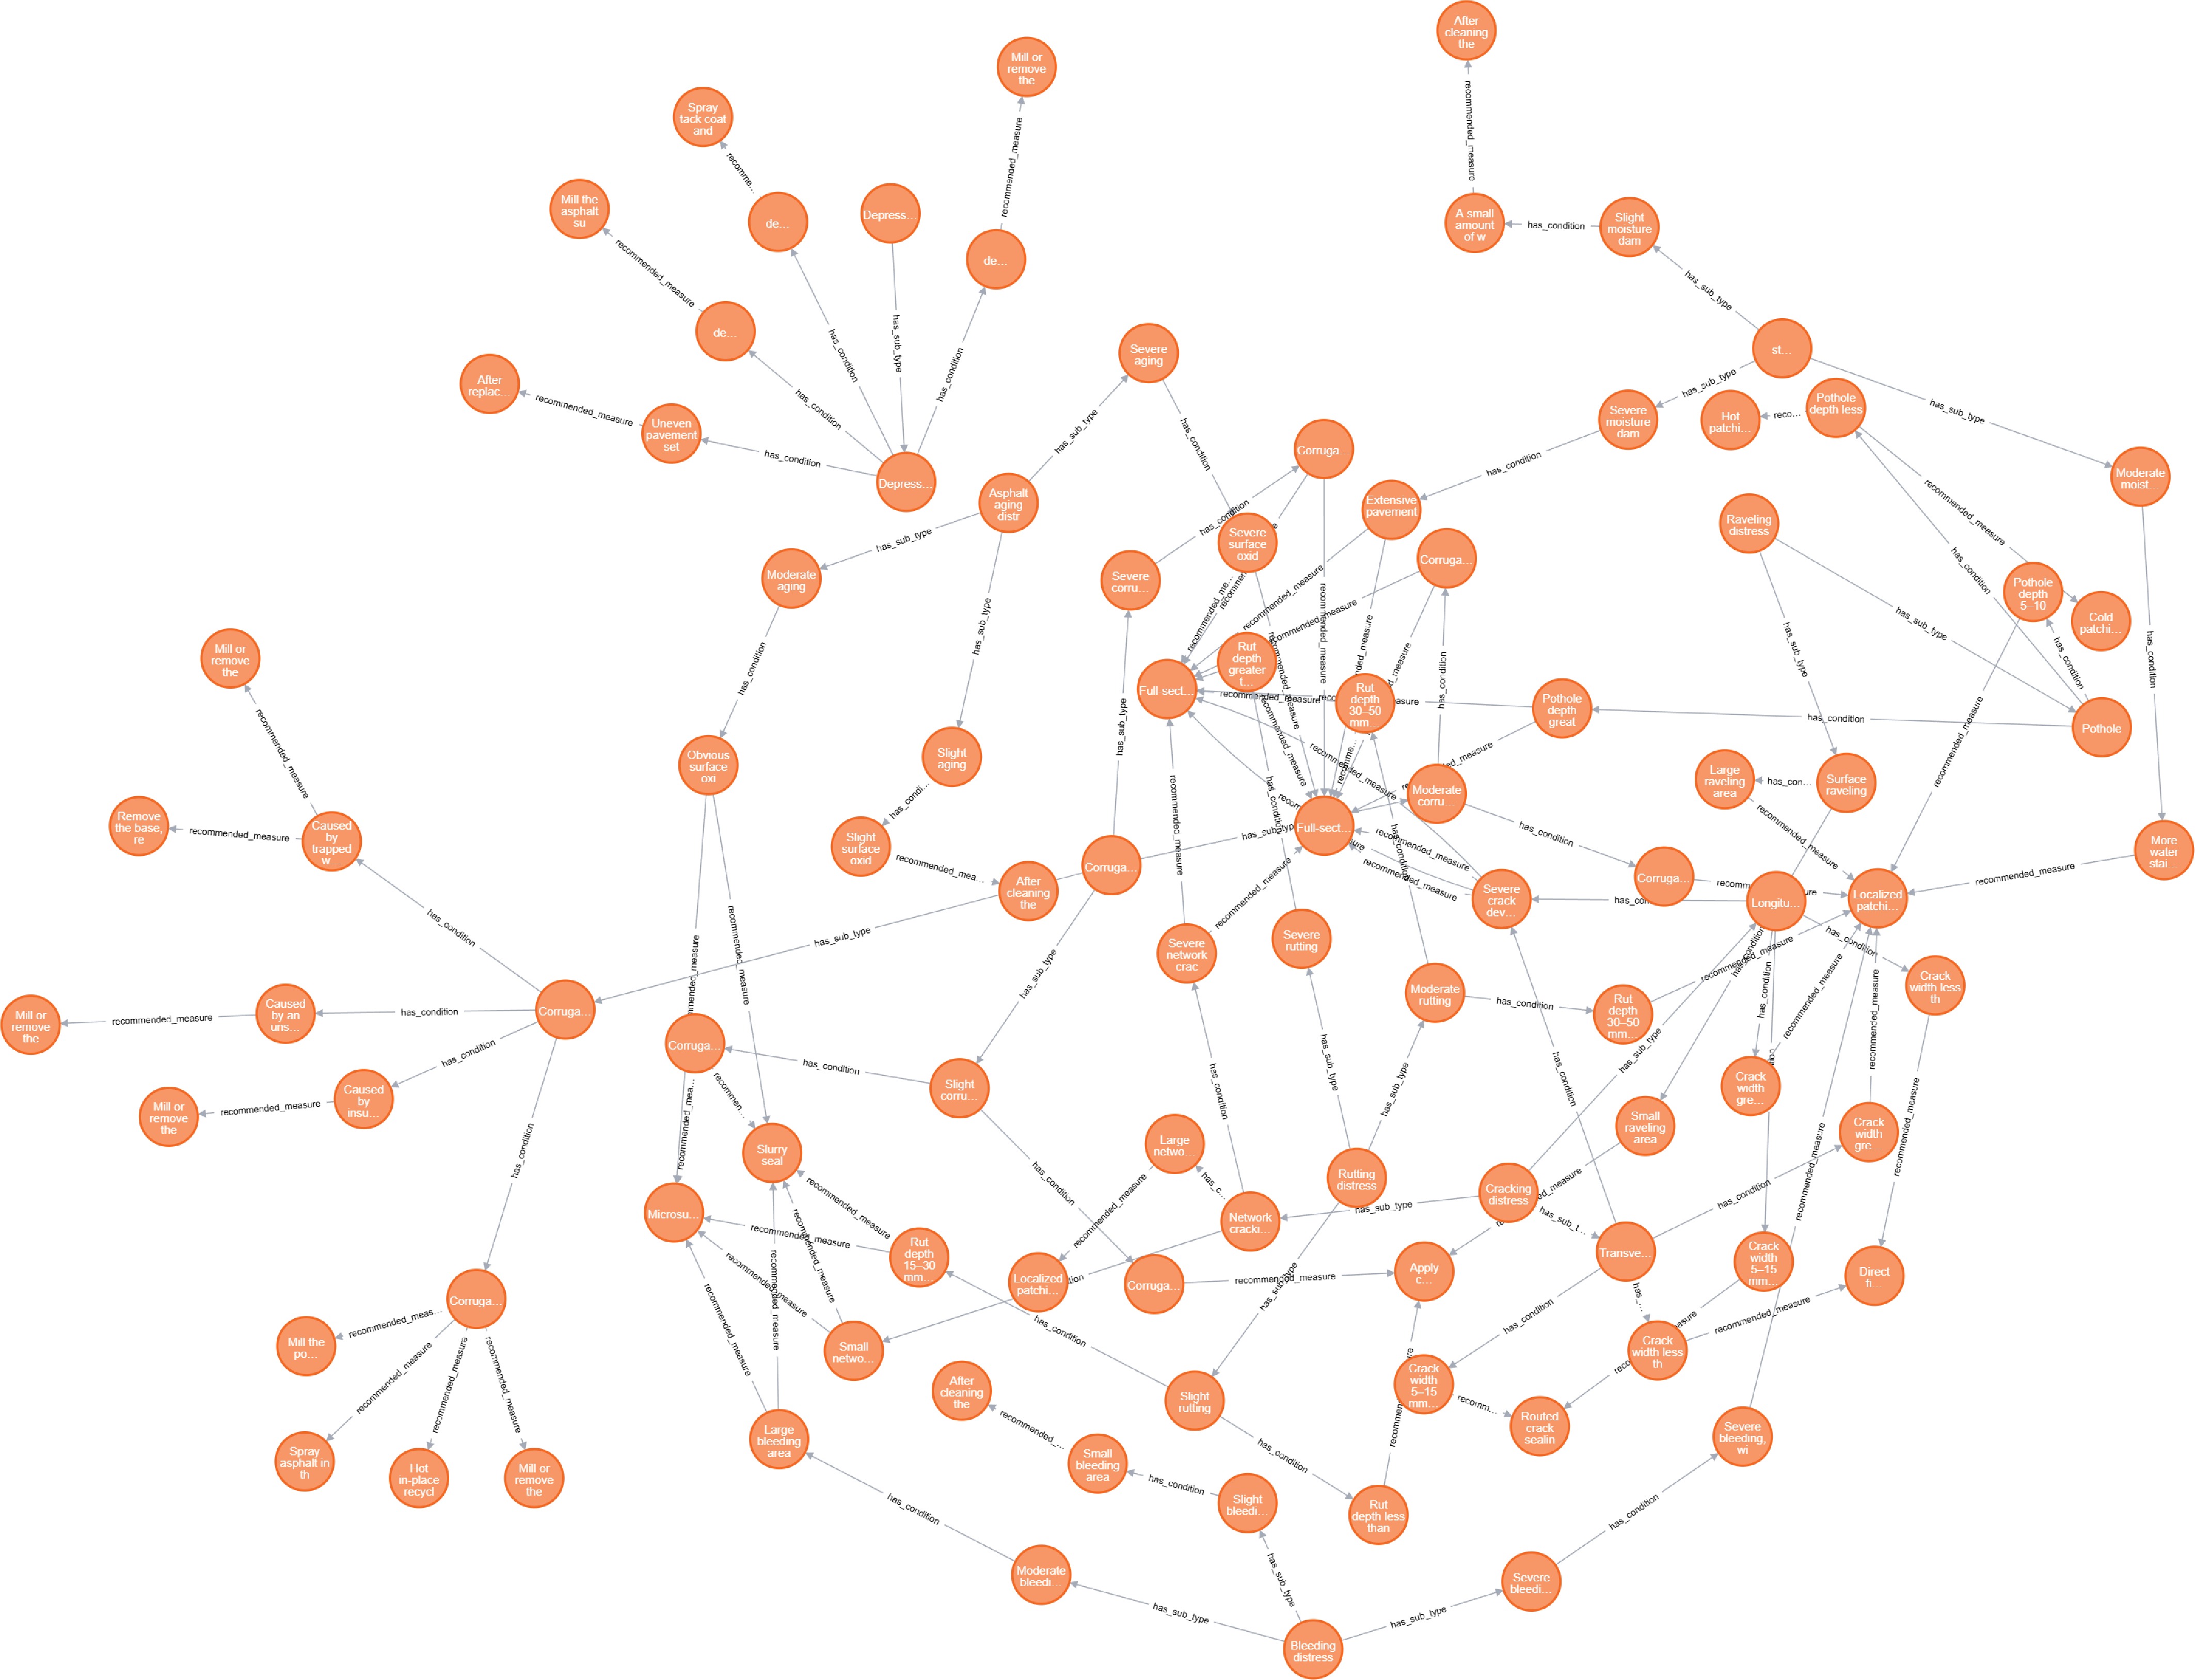
Figure 6.
Asphalt pavement distress maintenance measures based on knowledge graphs.
-
Inspection year Direction Start stake End stake Road age PCI RQI RDI PQI Passenger-to-freight ratio Maintenance history code 2020 Upbound K747 + 671 K748 + 671 17 80.76 95.59 94.65 90.56 1.68 0 2021 Upbound K747 + 671 K748 + 671 18 83.60 93.48 92.44 90.59 1.68 3 2023 Upbound K747 + 671 K748 + 671 20 92.78 94.45 95.89 93.78 1.68 3 2024 Upbound K747 + 671 K748 + 671 21 88.19 93.97 94.17 92.19 1.68 3 2020 Downbound K735 + 671 K736 + 671 17 91.08 93.49 92.89 93.28 1.68 0 2021 Downbound K735 + 671 K736 + 671 18 82.59 92.24 92.83 89.92 1.68 3 2023 Downbound K735 + 671 K736 + 671 20 91.04 93.79 95.93 92.89 1.68 3 2024 Downbound K735 + 671 K736 + 671 21 86.82 93.02 94.38 91.41 1.68 3 The passenger-to-freight ratio is reported as the annual traffic composition of the LH section. Maintenance history was encoded from 0 to 4 according to intervention type and intensity, where 0 denotes no maintenance, 1 denotes routine minor maintenance, 2 denotes milling-related treatment, 3 denotes repaving or overlay treatment, and 4 denotes major or structural rehabilitation. Table 1.
Example of processed section-level records used in the case study.
-
Index value range Maintenance type PCI RQI RDI SRI ≥ 90 ≥ 90 ≥ 80 < 75 PM < 80 − RM 85−90 − PM < 85 − RM 85−90 ≥ 85 − PM < 85 − RM < 85 − RM Table 2.
Grading standard of pavement performance indicators for maintenance type classification.
-
Influence factor Assignment rules Performance index PCI The value is assigned according to the predicted value of each road segment index, and the smaller value is ranked first RQI RDI SRI Elasticity factor K The value is assigned according to the nature of the road section, and the higher value is ranked first Traffic volume
(103 vehicles/d)T The value is assigned according to the daily traffic volume, and the higher value is ranked first Road age (year) A The value is assigned according to the length of traffic time, and the highest value is ranked first Interval years (years) Y The value is assigned according to the interval between the current maintenance year and the last major and medium-sized maintenance, and the higher value is ranked first Table 3.
Priority ranking principle of pavement maintenance.
-
Weight a b c d Value range 0.35−0.45 0.25−0.35 0.15−0.25 0.10−0.20 Table 4.
Index weight range.
-
Model Indicator PQI RQI PCI RDI Average XGBoost R2 0.8991 0.8113 0.9677 0.5465 0.8062 RMSE 1.1309 0.7380 1.8493 0.9413 1.1649 MAE 0.8694 0.5040 1.4265 0.6614 0.8653 RF R2 0.8105 0.6940 0.8111 0.7781 0.7734 RMSE 1.5421 0.9349 4.4494 0.6551 1.8954 MAE 1.1930 0.5385 3.5367 0.4679 1.4340 Ours R2 0.9101 0.9112 0.9314 0.8908 0.9109 RMSE 1.0715 0.5033 2.7075 0.4596 1.1855 MAE 0.8220 0.3602 2.1038 0.3457 0.9079 Table 5.
Comparison of experimental results.
-
Cluster No. Core features Key indicators (average) Maintenance type ratio Distress distribution 1 High-performance low-distress group PCI 93.60, RQI 92.85,
RDI 95.45RM 1.3%, PM 98.7% 63.6% of sections have no distress; main distress is transverse crack (21.3%) 2 Medium-performance low-distress group PCI 87.40, RQI 87.37,
RDI 90.57RM 59.0%, PM 41.0% 39.2% of sections have no distress; main distress is longitudinal crack (39.9%) 3 Medium-performance medium-distress group PCI 84.65, RQI 93.53,
RDI 93.96RM 43.8%, PM 56.2% Main distresses are longitudinal cracks (43.8%) and transverse cracks (56.2%); complex distress combinations accounts for 78.8% Table 6.
Core characteristics of OPTICS clustering results.
-
Road ID PCI RQI RDI SRI RSPF Maintenance
typePriority
rankingG5-213.1 85.35 90.25 73.77 94.17 64.38 PM 1 G5-204.1 86.30 85.46 93.49 94.17 67.22 PM 2 G5-228.3 85.31 86.44 94.83 94.17 67.43 PM 3 G5-775.4 87.93 85.58 92.22 94.17 67.57 PM 4 G5-771.6 86.40 85.13 96.13 94.17 67.68 PM 5 G5-745.8 86.33 89.48 91.15 94.17 67.97 PM 6 G5-195.3 87.02 86.62 94.26 94.17 67.97 PM 7 G5-755 85.93 90.18 91.02 94.17 68.01 PM 8 G5-756.5 85.10 89.59 94.21 94.17 68.18 PM 9 G5-275.7 86.63 87.44 95.02 94.17 68.23 PM 10 G5-229.4 82.40 46.64 93.81 94.17 54.27 RM 1 G5-756.7 83.71 54.94 85.62 94.17 55.58 RM 2 G5-256.8 49.13 91.96 96.71 94.17 56.80 RM 3 G5-203.1 48.68 95.89 98.04 94.17 58.09 RM 4 G5-267.3 68.77 85.15 79.32 94.17 58.16 RM 5 G5-215.9 55.92 89.71 95.43 94.17 58.25 RM 6 G5-752.1 65.52 83.68 91.04 94.17 58.92 RM 7 G5-203 50.89 96.18 98.02 94.17 58.95 RM 8 G5-268.6 56.57 92.62 94.36 94.17 59.14 RM 9 G5-5.8 53.25 95.34 97.15 94.17 59.35 RM 10 Table 7.
Top 10 priority sections for PM and RM categories.
-
Scenario Total budget
(10,000 CN¥)Covered
sections
(PM + RM)Average
PCI after
maintenanceFund utilization
rateScenario 1 25 13 91.06 99.6% Scenario 2 35 16 97.30 99.2% Scenario 3 45 20 100.00 84.4% Traditional method 35 12 94.53 98.1% Table 8.
Comparison of fund allocation results under different scenarios.
Figures
(6)
Tables
(8)