












-
With the continuous expansion of highway networks and the increasing service requirements for transportation infrastructure, highway maintenance management departments are facing growing pressure to allocate limited funds in a more scientific, transparent, and efficient manner[1,2]. Highway maintenance fund allocation is a comprehensive engineering decision problem involving pavement condition changes, deterioration risk identification, treatment selection, and budget implementation[3]. In practice, the contradiction between limited funds and increasing maintenance needs may cause key road sections to miss the optimal treatment period, which in turn accelerates pavement damage, increases whole-life cycle costs, and reduces the overall service level of the highway network[4,5]. Meanwhile, highway maintenance decision-making is becoming increasingly refined and data-driven. Modern maintenance management requires not only identifying priority sections for treatment, but also predicting future pavement conditions, quantifying maintenance urgency under multiple influencing factors, and selecting technically appropriate treatments within realistic budget limits[6]. Therefore, there is an urgent practical need to develop an intelligent decision-support framework that integrates pavement performance prediction, maintenance priority evaluation, treatment selection, and fund allocation.
While existing studies have made progress in pavement performance prediction and maintenance fund allocation, several limitations persist. First, current prediction methods still lack sufficient capability in coordinated multi-indicator prediction, especially when pavement condition, riding quality, rutting, and other related factors need to be considered simultaneously[7]. Second, many existing allocation methods rely on simplified ranking rules or empirical assumptions, making it difficult to comprehensively quantify maintenance priority under the combined effects of technical condition, traffic demand, road age, and maintenance interval[8]. Third, the connection between section-level distress characteristics and maintenance treatments remains relatively weak, and the integration of inspection data, technical specifications, and historical maintenance knowledge is still inadequate[9].
To address these limitations, this study develops an intelligent highway maintenance fund allocation framework that integrates pavement performance prediction, road section priority evaluation, knowledge-driven treatment matching, and iterative fund trial allocation into a unified decision-support process. The framework aims to enhance the consistency between deterioration status, maintenance urgency, treatment selection, and budget implementation. The research framework is illustrated in Fig. 1.
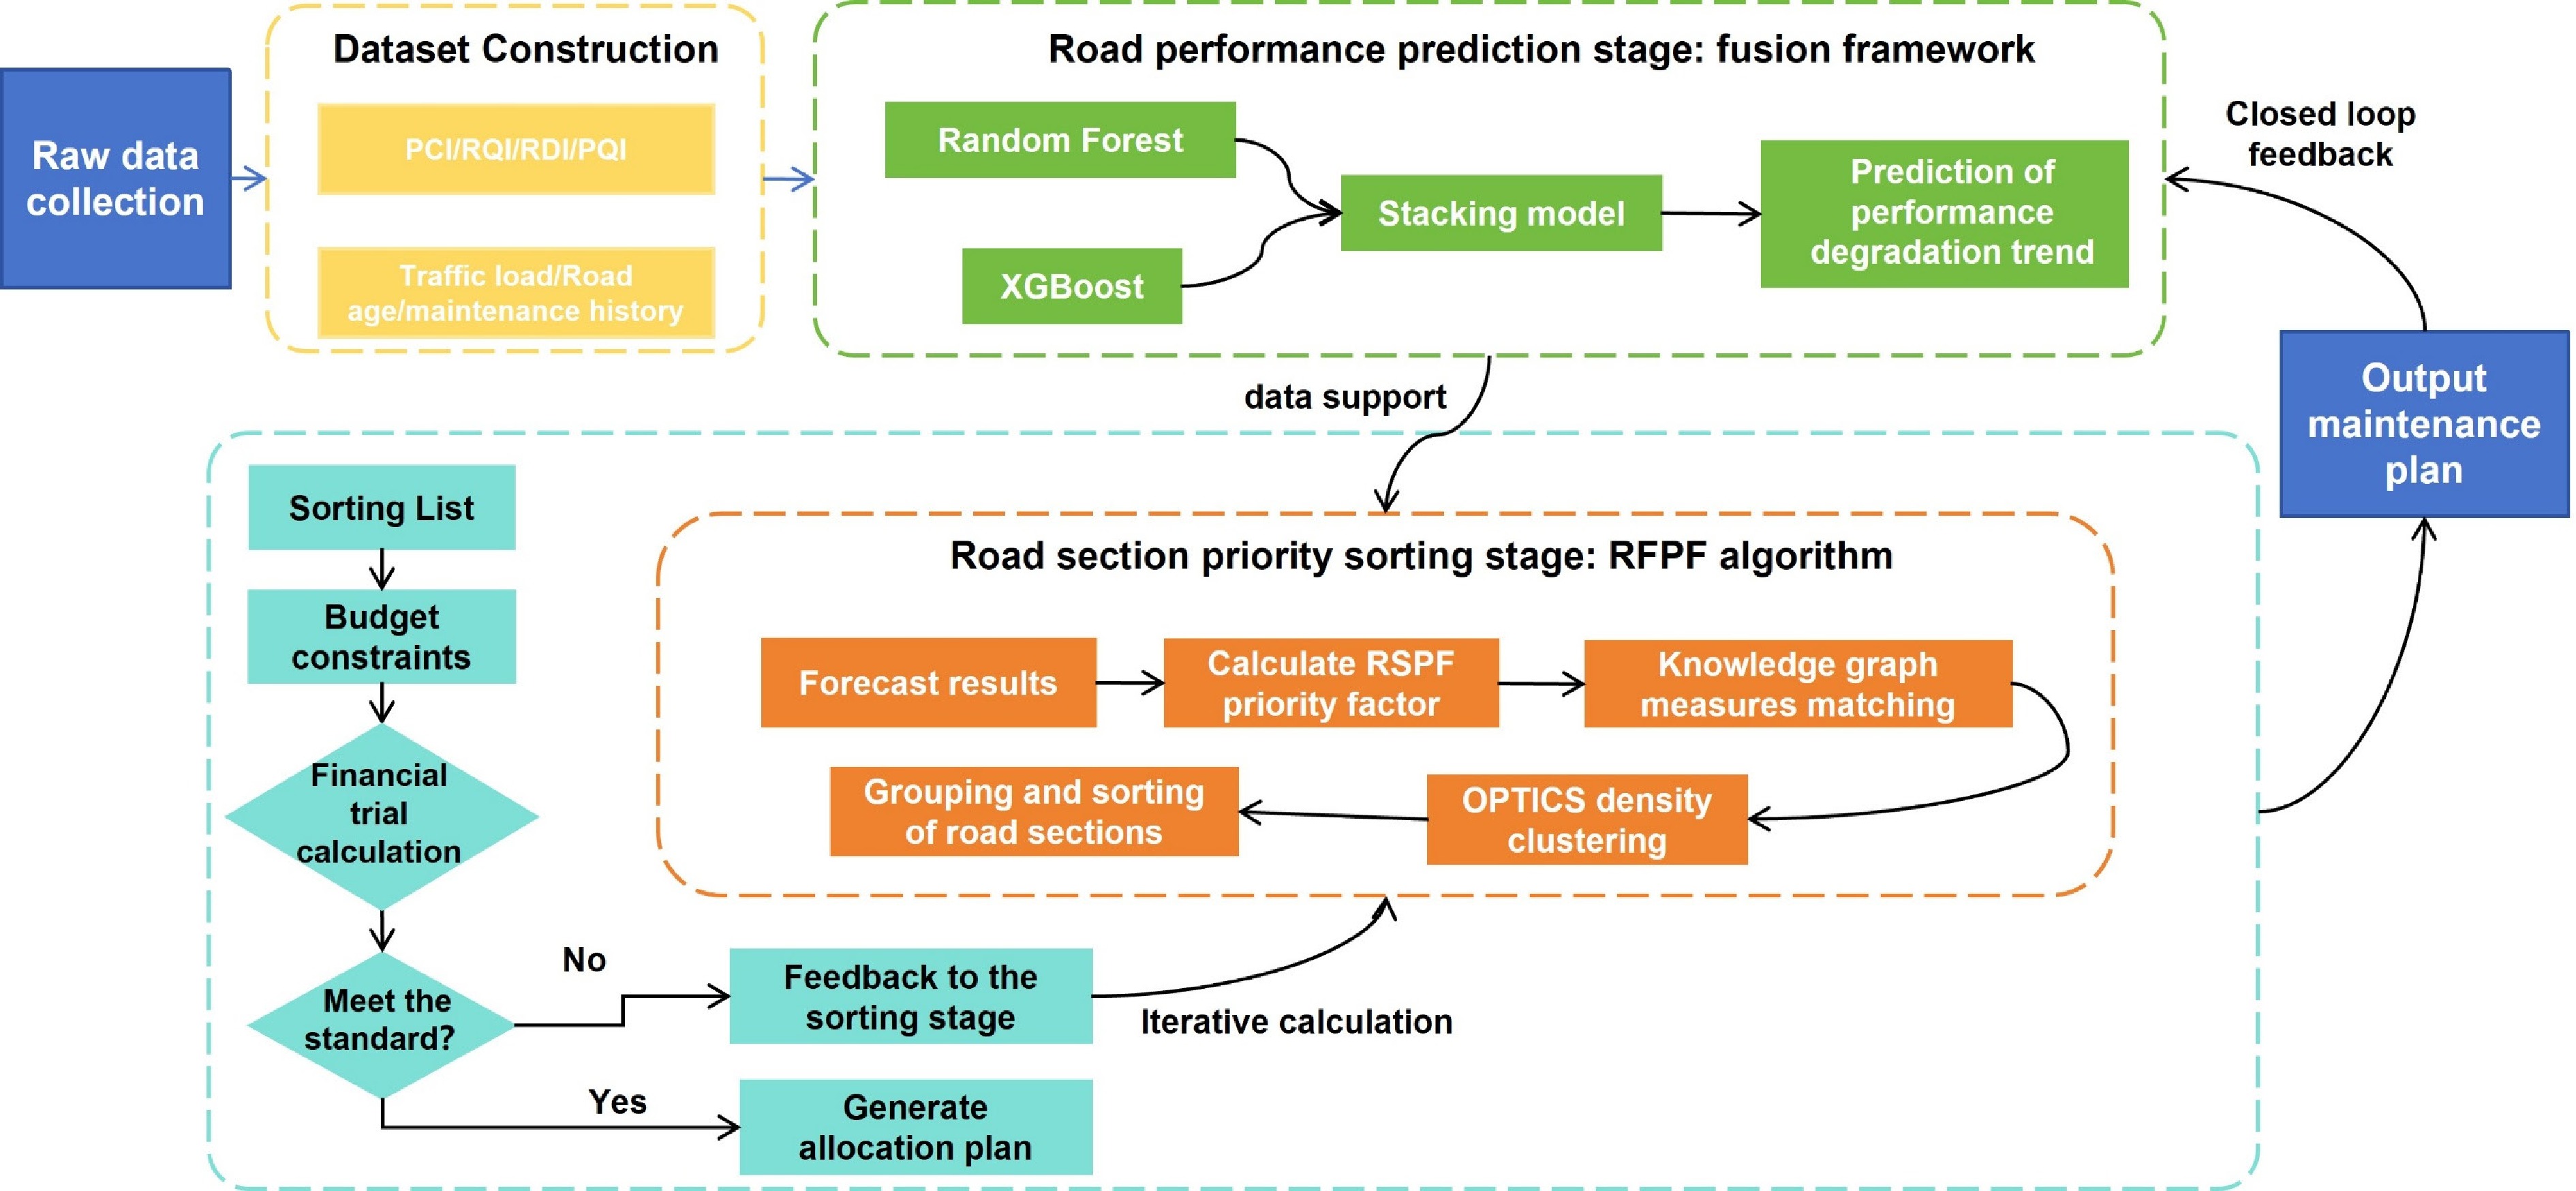
Figure 1.
Technical route.
The main contributions of this study are summarized as follows:
(1) A stacking-based pavement performance prediction model is constructed to improve the accuracy and robustness of short-term prediction for multiple key indicators at the 100 m section level. (2) A Road Section Priority Factor (RSPF) is proposed, which integrates pavement performance indicators with dynamic external factors such as traffic volume, road age, maintenance interval, and section importance, thereby enabling more comprehensive quantification of maintenance priority. (3) A knowledge-driven maintenance decision-support mechanism is established by combining Retrieval-Augmented Generation (RAG) with a maintenance knowledge graph, ensuring that prioritized sections are matched with more appropriate and standardized maintenance treatments. (4) An iterative fund trial-allocation process is designed under budget and performance constraints, forming an integrated decision-support process of prediction, prioritization, treatment matching, and allocation.
-
Pavement performance prediction is a key basis for highway maintenance decision-making, as the rationality of fund allocation largely hinges on the accuracy of deterioration assessment and short-term condition forecasting. Early studies primarily adopted traditional statistical or empirical methods, including grey models[10,11] and Markov chains[12]. These approaches provided an initial analytical basis for pavement deterioration modeling and were relatively easy to implement. However, they have limited capacity to characterize nonlinear deterioration processes and dynamic interactions among multiple factors, which restricts their applicability in refined maintenance management.
With the development of data-driven methods, machine learning models have been increasingly used for pavement performance prediction. Representative approaches include Random Forest, XGBoost, LightGBM, and other hybrid machine learning frameworks[13−16]. Compared with traditional methods, these models generally provide stronger nonlinear fitting ability and higher prediction accuracy. Recent studies have also shown that boosting-based models can achieve better predictive performance for pavement condition indicators than conventional methods[17,18]. However, many existing studies still focus on a single indicator, such as PCI or PQI, whereas practical maintenance decision-making usually requires the coordinated evaluation of multiple performance indicators. In addition, the stability of a single model may be affected by data heterogeneity, variable interactions, and case-specific characteristics[19].
To further improve predictive robustness, fusion and ensemble strategies have gained growing attention. Current fusion methods mainly include weighted fusion, blending, and stacking[20]. Weighted fusion is relatively easy to implement, but weight determination often relies on subjective experience. Blending can reduce overfitting risk to some extent, yet it is often sensitive to sample size and data partitioning. In contrast, stacking can integrate the complementary strengths of multiple base learners through a meta-learning layer, making it more suitable for complex prediction tasks involving heterogeneous features and multi-indicator coordination[21,22]. Recent studies have confirmed that stacking-based frameworks can enhance generalization performance in pavement-related prediction problems[23,24]. However, existing stacking applications in this field still focus primarily on individual performance indicators, and their integration with downstream maintenance prioritization and fund allocation remains insufficient.
Although fusion and ensemble models have improved pavement performance prediction, their role in maintenance decision support remains insufficiently developed. Existing studies often focus on improving prediction accuracy for single indicators, while less attention has been paid to coordinated multi-indicator prediction and the use of prediction results in maintenance prioritization. Moreover, prediction outputs are rarely connected with section-level fund allocation under realistic budget constraints. These limitations highlight the need for a prediction framework that is not only accurate, but also better aligned with the practical requirements of maintenance decision support.
Highway maintenance fund allocation optimization
-
Highway maintenance fund allocation has long been a crucial topic in infrastructure asset management, especially under limited annual budgets. Existing studies have primarily focused on resource optimization through cost-benefit analysis, mathematical programming, heuristic algorithms, and fuzzy evaluation methods.
Cost-benefit analysis evaluates maintenance schemes by comparing treatment costs with expected performance improvement or service benefits[4,5]. These approaches are valuable for assessing the economic rationality of candidate schemes and supporting long-term maintenance planning. However, they may simplify the technical differences among road sections and may not fully reflect maintenance urgency caused by different deterioration conditions.
Mathematical programming and heuristic optimization methods, such as dynamic programming, genetic algorithms, and other budget-constrained search strategies, have also been widely used in maintenance resource allocation[25−27]. These methods are effective when the allocation problem can be clearly described by objective functions and constraints. However, practical maintenance decision-making also involves treatment type identification, section-specific engineering judgment, and maintenance measure selection. Therefore, purely optimization-oriented methods may have difficulty integrating distress characteristics, engineering rules, and historical maintenance knowledge into the allocation process.
Fuzzy evaluation and expert-system-based methods offer another important approach to maintenance decision support[28]. Their main advantage is their ability to incorporate engineering experience and qualitative knowledge into the decision-making process, which is particularly useful when data are incomplete or uncertainty is high. Nevertheless, such methods often rely heavily on expert-defined rules, which can reduce transparency, reproducibility, and consistency across different cases.
In recent years, some studies have moved beyond condition-only ranking by combining pavement condition indicators with traffic demand, maintenance timing, or network-level objectives. These studies have improved the practicality of maintenance planning to some extent. However, several limitations remain. First, many methods still rely on simplified thresholds or one-dimensional ranking principles, making it difficult to quantify section-level maintenance urgency comprehensively[29]. Second, the link between predicted pavement condition and fund allocation is often indirect, so allocation results may not fully reflect future maintenance needs[30]. Third, maintenance measure selection still depends largely on empirical rules, with insufficient consideration of distress characteristics and technical specifications[31]. Therefore, further improvement is still needed in refined prioritization, knowledge-driven treatment matching, and practical fund allocation under budget constraints.
Goal of this study
-
Based on the above review, existing studies have provided important support for highway maintenance fund allocation decision-making, but several research gaps remain. First, current methods still lack sufficient capability for coordinated prediction of multiple pavement performance indicators, which limits their ability to support comprehensive maintenance evaluation. Second, section-level maintenance priority is often quantified using simplified rules or limited factors, making it difficult to fully capture the joint influence of technical condition, traffic demand, road age, and maintenance interval. Third, the connection between priority evaluation and maintenance treatment selection remains weak, and the integration of inspection data, technical standards, and historical maintenance knowledge is still inadequate. As a result, the entire decision chain from condition prediction to measure selection and fund allocation is not yet fully closed. Therefore, this study aims to establish an intelligent decision-support framework for multi-indicator pavement performance prediction and budget-constrained maintenance fund allocation.
-
The data for this study were obtained from pavement monitoring records of the LH section of the JK Highway in Shanxi Province, China. This section spans 120 km, and the average daily traffic volume ranges from 15,000 to 30,000 vehicles, with heavy-duty vehicles accounting for approximately 30% of the total. The data include four core pavement performance indicators: PCI, RQI, RDI, and PQI. Auxiliary data such as traffic volume, road age, and maintenance history were also gathered. Additionally, an elasticity factor reflecting the importance of the road section was established based on segment characteristics, with values ranging from 1 to 3.
To illustrate the annual variation in pavement performance, the average values of the four core indicators for 1,200 100-m sections were used to plot the trends from 2015 to 2024 (Fig. 2). PQI and PCI generally showed an initial increase followed by a decline, with noticeable fluctuations. This pattern may be related to maintenance interventions, local repairs, and subsequent performance deterioration during service. In contrast, RDI and RQI changed only slightly over the study period and generally remained above 90, indicating that rutting condition and riding quality were maintained at a relatively good level.
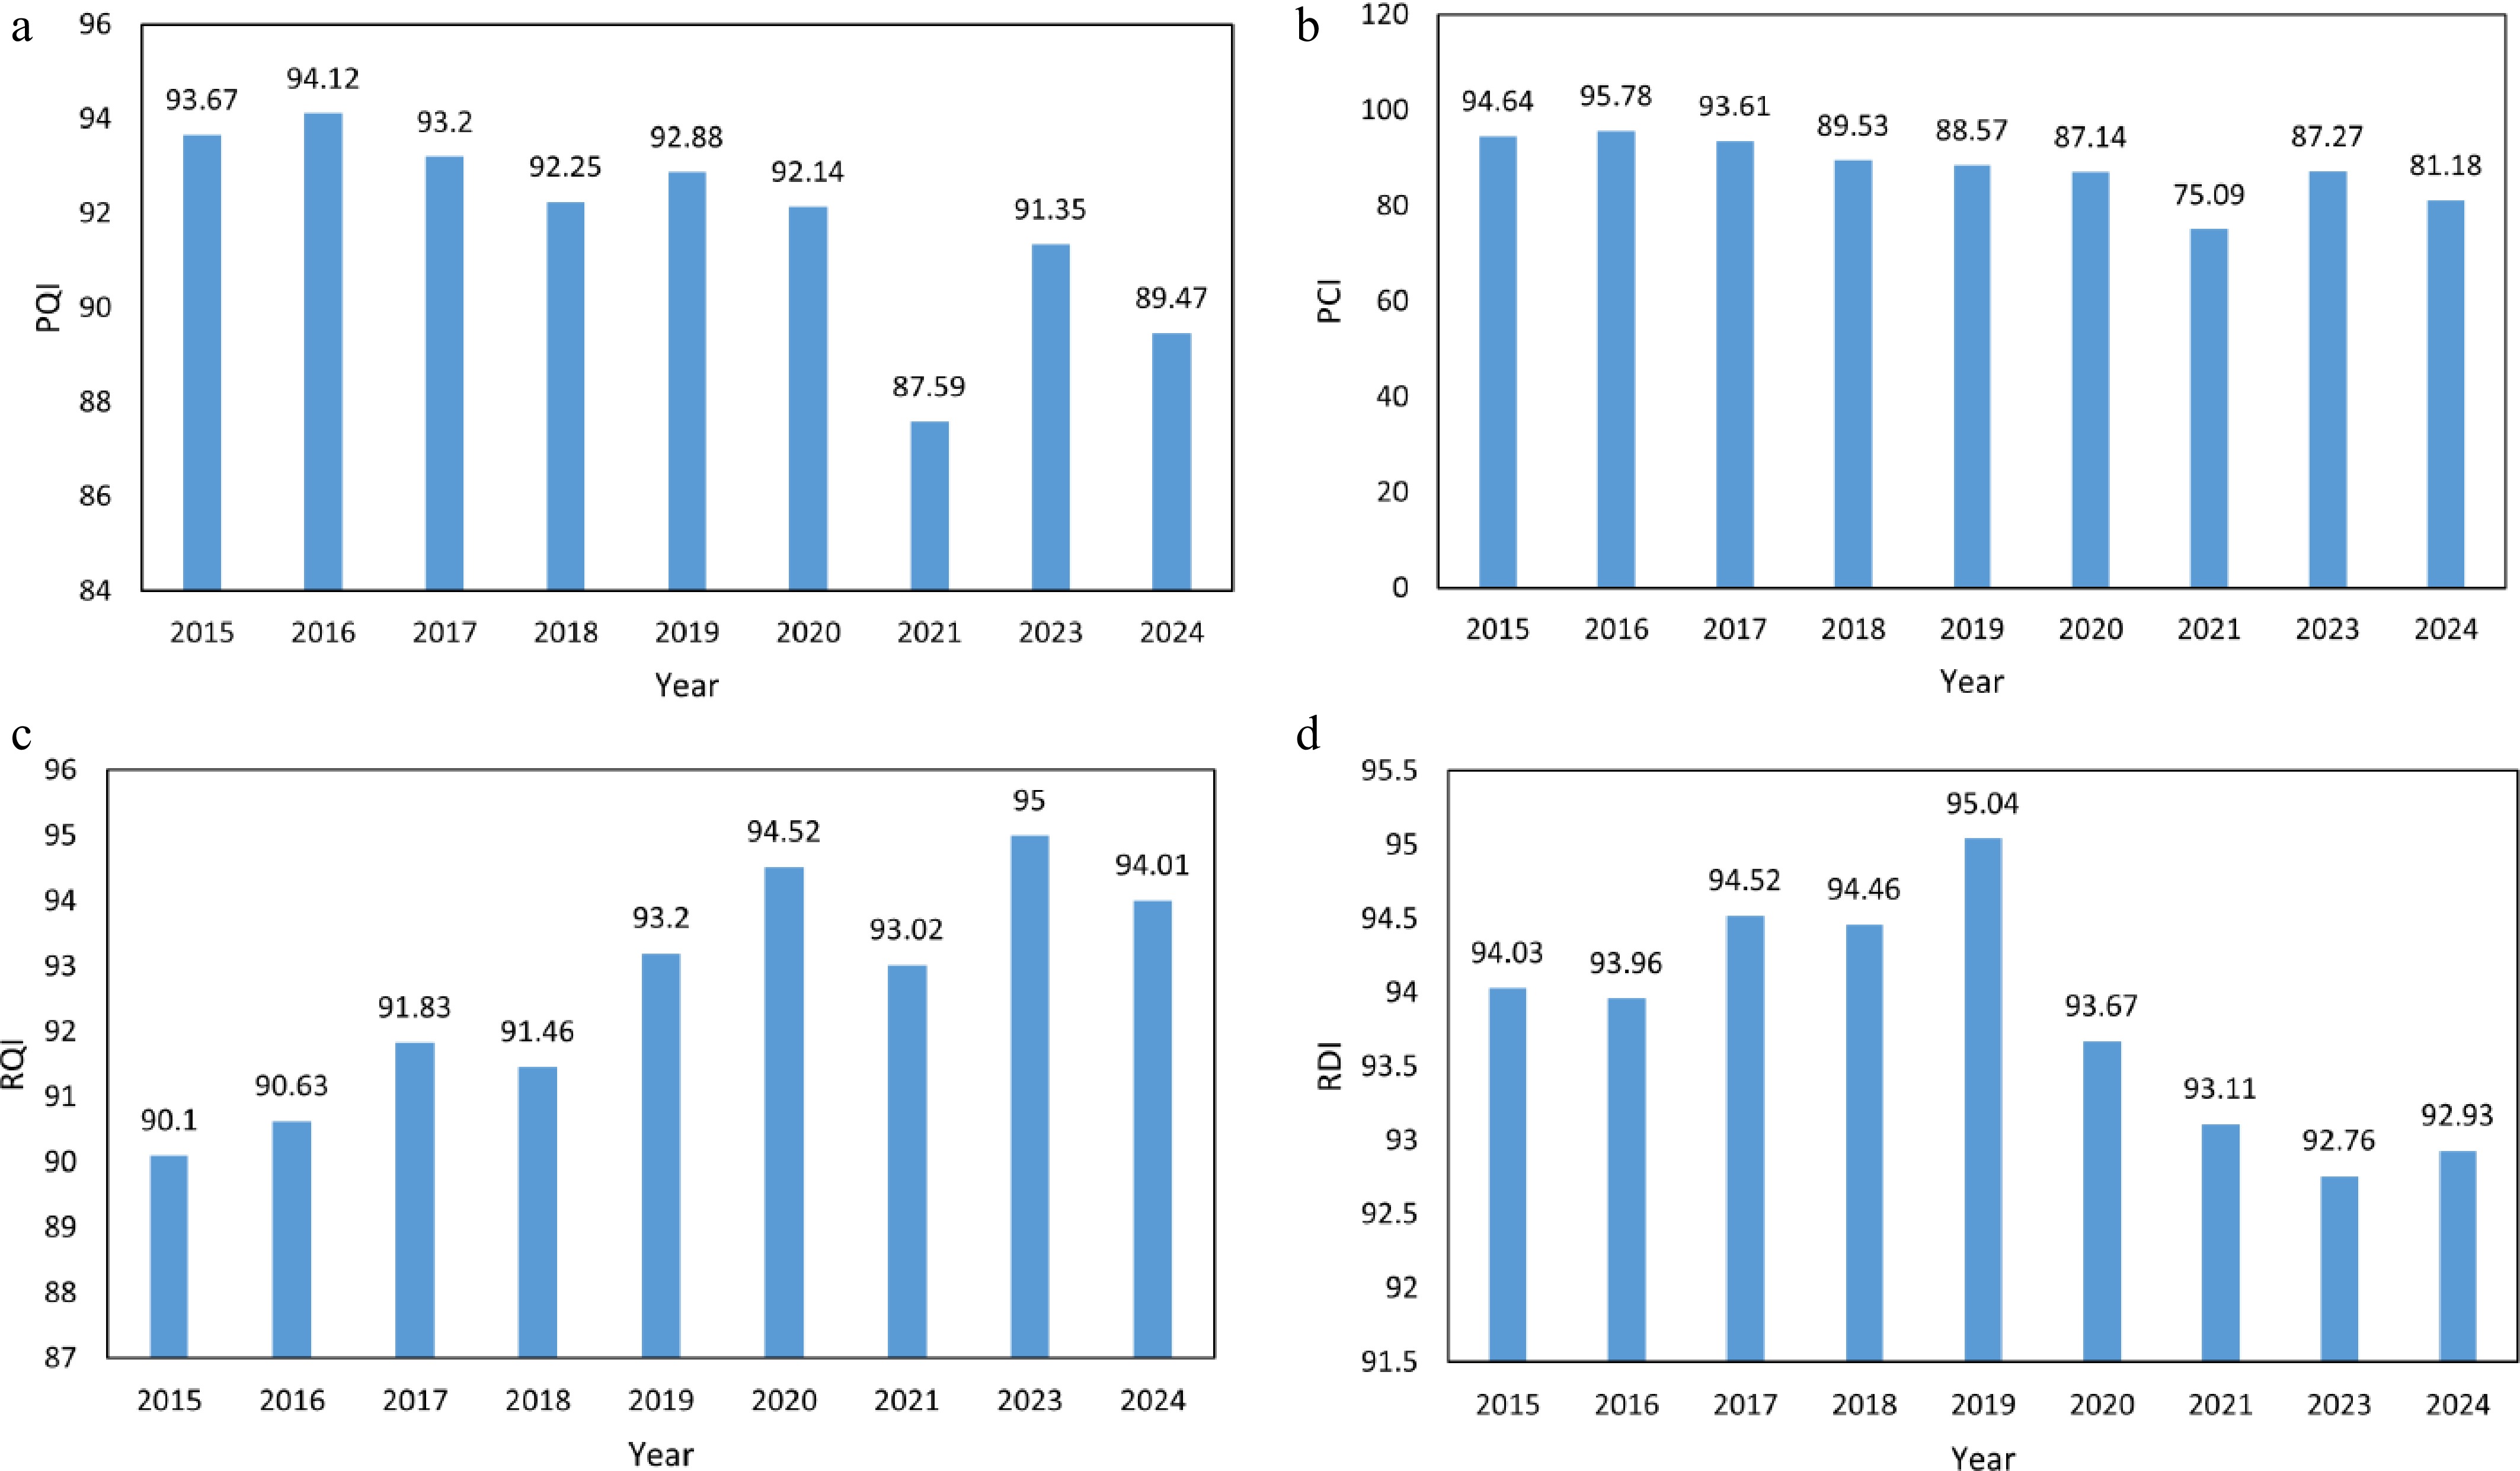
Figure 2.
Trends in the average values of the four core pavement performance indicators from 2015 to 2024. (a) PQI; (b) PCI; (c) RQI; (d) RDI.
Data preprocessing
-
The raw data contained a certain number of outliers and missing values. For missing values, an interpolation method integrating spatiotemporal correlation characteristics was adopted. Specifically, for non-boundary stakes, the mean of adjacent years was used whenever available; otherwise, the mean of adjacent 100-m stakes was adopted. For boundary stakes, interpolation was performed using the mean of the single spatial neighbor and the adjacent-year data on the available side. When both neighboring and adjacent-year information were unavailable, missing values were repaired by referring to other known normal performance indicators of the same stake together with the existing pavement performance evaluation standards. After data cleaning, pavement performance indicators and auxiliary attributes were aligned at the 100-m section level, and the processed dataset was divided into training and testing sets in a 7:3 ratio. To further illustrate the structure of the processed inputs, representative section-level records are presented in Table 1.
Table 1. Example of processed section-level records used in the case study.
Inspection year Direction Start stake End stake Road age PCI RQI RDI PQI Passenger-to-freight ratio Maintenance history code 2020 Upbound K747 + 671 K748 + 671 17 80.76 95.59 94.65 90.56 1.68 0 2021 Upbound K747 + 671 K748 + 671 18 83.60 93.48 92.44 90.59 1.68 3 2023 Upbound K747 + 671 K748 + 671 20 92.78 94.45 95.89 93.78 1.68 3 2024 Upbound K747 + 671 K748 + 671 21 88.19 93.97 94.17 92.19 1.68 3 2020 Downbound K735 + 671 K736 + 671 17 91.08 93.49 92.89 93.28 1.68 0 2021 Downbound K735 + 671 K736 + 671 18 82.59 92.24 92.83 89.92 1.68 3 2023 Downbound K735 + 671 K736 + 671 20 91.04 93.79 95.93 92.89 1.68 3 2024 Downbound K735 + 671 K736 + 671 21 86.82 93.02 94.38 91.41 1.68 3 The passenger-to-freight ratio is reported as the annual traffic composition of the LH section. Maintenance history was encoded from 0 to 4 according to intervention type and intensity, where 0 denotes no maintenance, 1 denotes routine minor maintenance, 2 denotes milling-related treatment, 3 denotes repaving or overlay treatment, and 4 denotes major or structural rehabilitation. -
To facilitate understanding of the interaction among the different modules, the detailed methodological workflow of the proposed framework is illustrated in Fig. 3. The framework consists of five main stages: data preparation, pavement performance prediction, maintenance classification and priority calculation, knowledge-driven treatment matching, and iterative fund trial allocation.
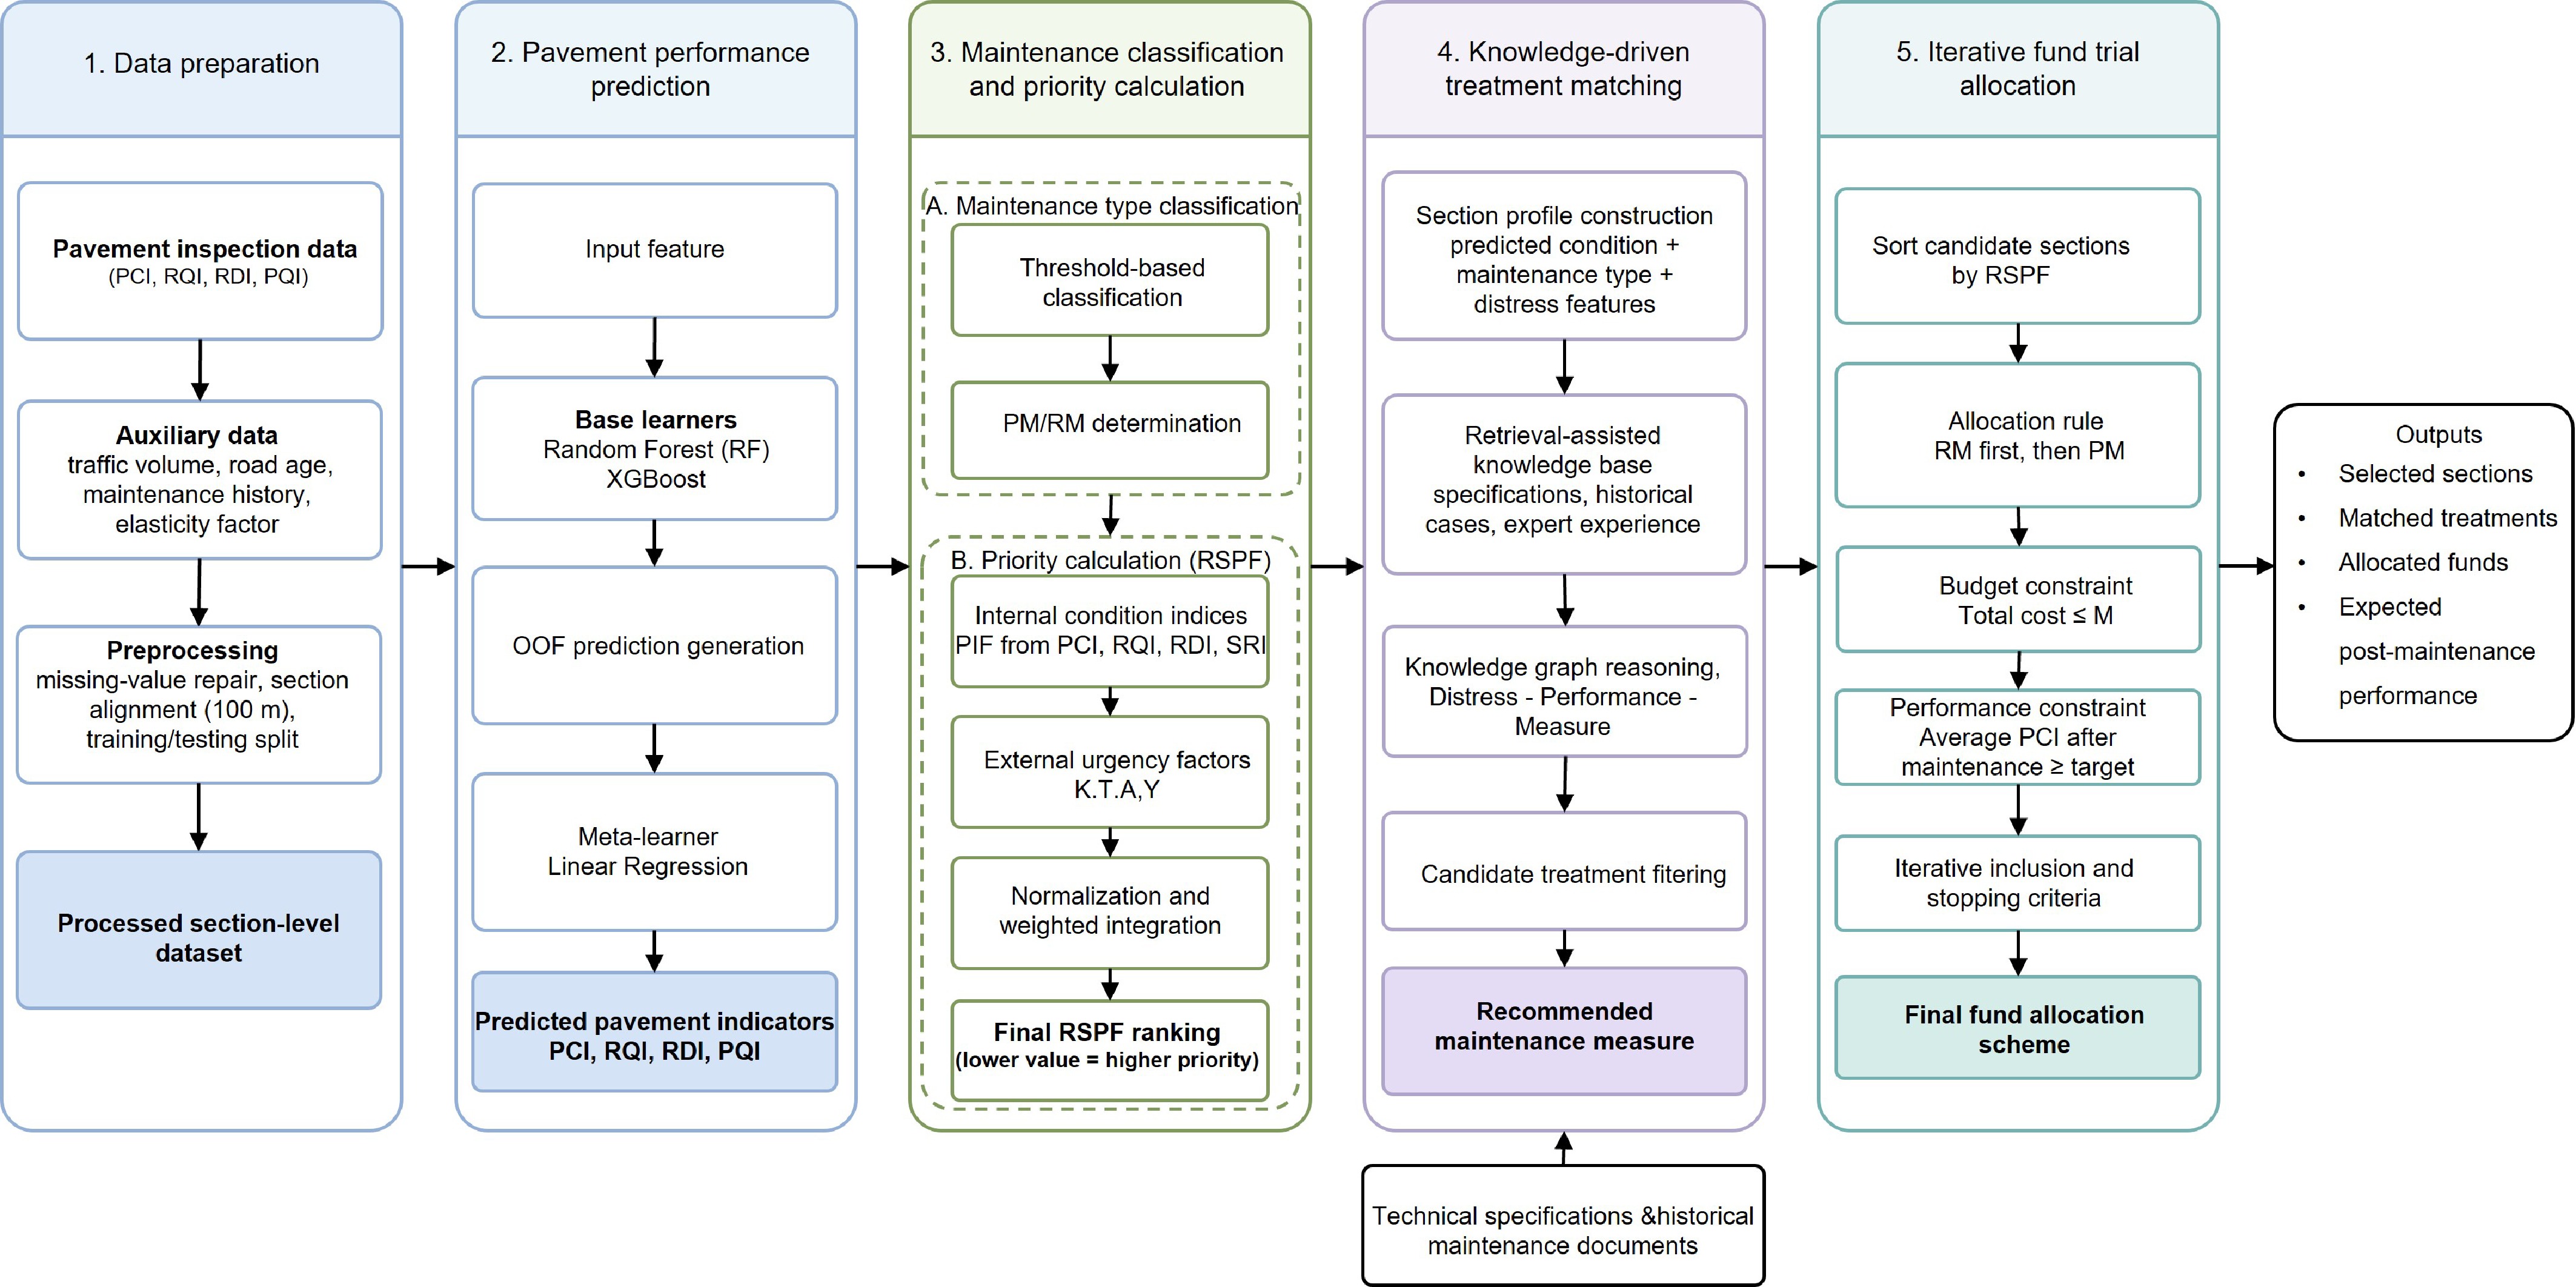
Figure 3.
Detailed methodological workflow of the proposed framework.
Pavement performance prediction based on stacking fusion
-
This study constructed a stacking architecture integrating base learners and a meta-learner (Fig 4). First, to generate reliable meta-features without label leakage, the 70% training set is further divided into non-overlapping folds. This two-stage partitioning ensures the test set remains isolated from all training processes, while the fold-based division enables standard out-of-fold (OOF) prediction for base learners.
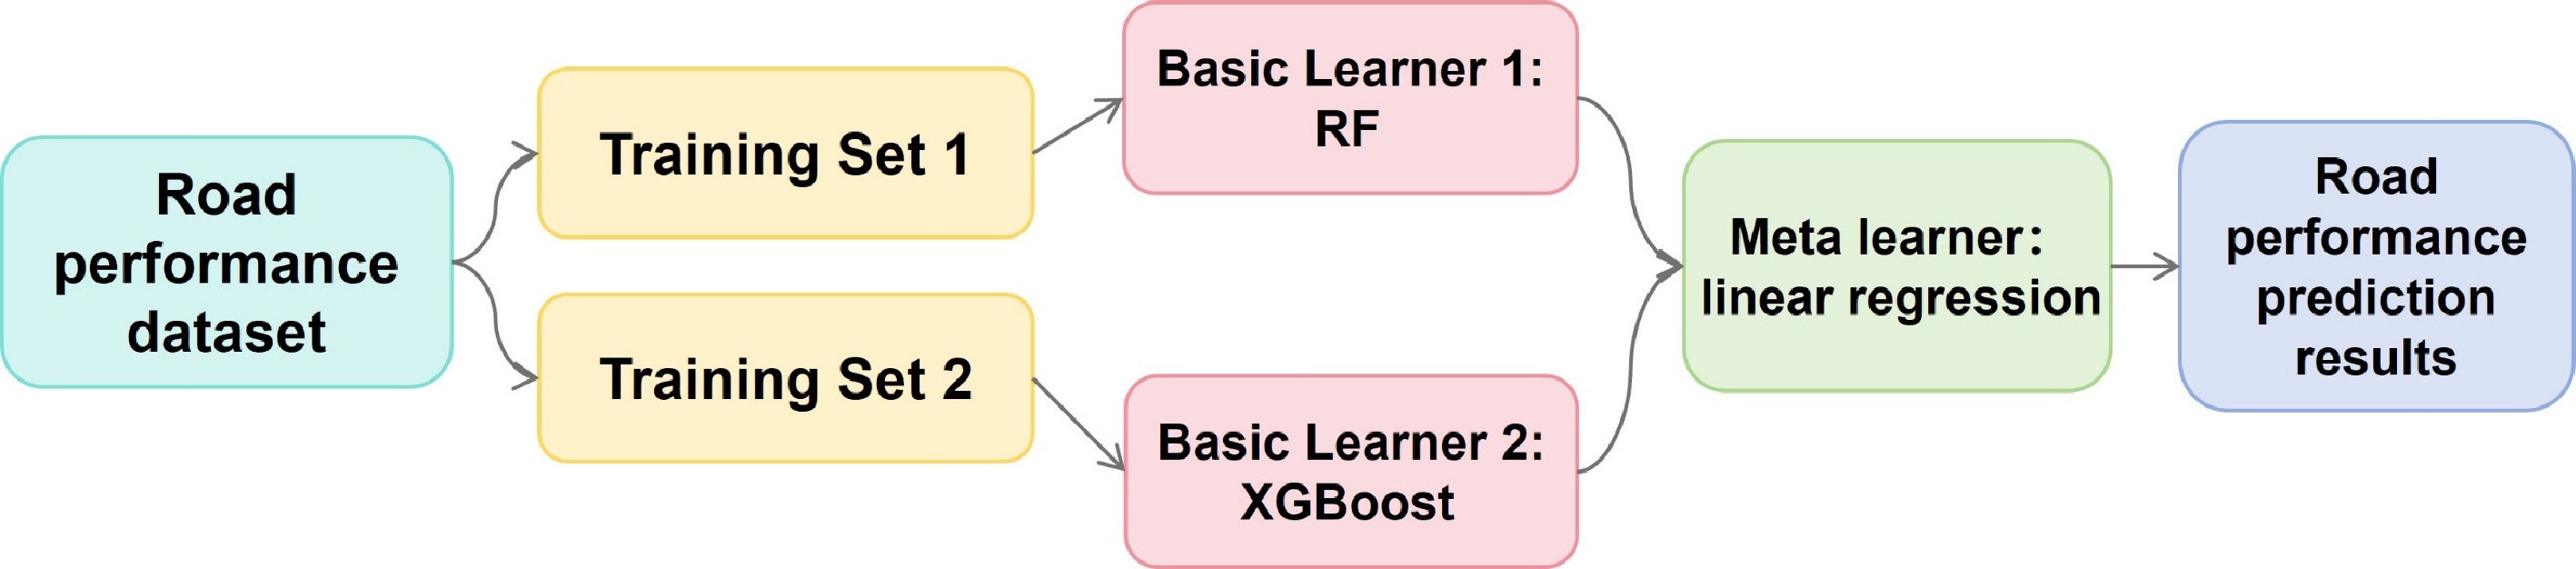
Figure 4.
Pavement performance prediction model based on stacking fusion.
First-layer base learners: RF and XGBoost
-
Two complementary machine learning algorithms, RF and XGBoost, were selected as base learners to capture the diverse nonlinear patterns in the pavement performance data. This selection was based on the characteristics of the tabular pavement dataset and the complementarity of the two models. RF is a bagging-based ensemble model with good robustness to noise and sample fluctuation, which is suitable for handling local variations in pavement inspection data. XGBoost is a boosting-based ensemble model with a strong ability to capture nonlinear feature interactions and residual degradation patterns. Therefore, combining RF and XGBoost can improve the diversity of base learners in the stacking framework and provide a more stable basis for multi-indicator pavement performance prediction.
In this study, the RF model was configured with n_estimators = 100, max_depth = 10, min_samples_split = 2, min_samples_leaf = 1, and max_features = sqrt. XGBoost was employed to further model complex feature interactions and local nonlinear degradation patterns. The XGBoost model was configured with n_estimators = 50, max_depth = 4, learning_rate = 0.1, subsample = 0.8, colsample_bytree = 0.8, and reg_lambda = 1.0.
During model training, the training set was divided into folds to generate OOF predictions for both base learners. In each round, the model was trained on the in-fold samples and then used to predict the held-out fold. After all folds were completed, the OOF predictions of RF and XGBoost were concatenated to form the meta-feature matrix for second-layer learning.
Second-layer meta-learner: Linear Regression
-
Since RF and XGBoost had already captured the main nonlinear relationships in the first layer, the role of the second-layer model was mainly to learn an appropriate fusion relationship between their prediction outputs. Therefore, linear regression was used as the meta-learner to fuse the outputs of RF and XGBoost. Since the second-layer input consisted only of the low-dimensional prediction results of the two base learners, a linear meta-learner was adopted to provide stable coefficient estimation and to reduce the risk of overfitting. After the meta-learner was trained on the OOF-based meta-features, the RF and XGBoost models were retrained on the full training set. Their prediction results on the isolated testing set were then used as the input to the trained meta-learner to obtain the final prediction.
Determination of maintenance type and measures
-
This study scientifically determines the maintenance types and measures through the two-level system from classification to clustering. First of all, according to the detailed classification standards shown in Table 2[32], the road sections are clearly divided into preventive maintenance (PM) and restorative maintenance (RM).
Table 2. Grading standard of pavement performance indicators for maintenance type classification.
Index value range Maintenance type PCI RQI RDI SRI ≥ 90 ≥ 90 ≥ 80 < 75 PM < 80 − RM 85−90 − PM < 85 − RM 85−90 ≥ 85 − PM < 85 − RM < 85 − RM According to the classification standards in Table 2, after determining the maintenance category, for different conditions of road sections, the OPTICS clustering algorithm[33] is used for further subdivision.
The distribution of pavement distress is often scattered and irregular. OPTICS is an advanced density-based clustering algorithm. It can break through the dependence of traditional clustering on 'spherical clusters' and accurately identify distress clusters with complex shapes. In addition, it can reduce subjective interference, without manually pre-setting the number of levels, which can be naturally classified according to the actual density difference of road damage data. The algorithm can identify clusters with complex shapes according to the density difference of road section data, and adapt to the complex distribution characteristics of pavement distress. The specific steps are as follows:
Data preprocessing: min-max standardization
$ \left({{x}}{'}=\dfrac{{x}-{{x}}_{\min }}{{{x}}_{\max }-{{x}}_{\min }}\right) $ Parameter tuning
-
Key parameters are optimized through grid search to improve clustering quality. The first parameter is min_samples, which refers to the minimum number of neighborhood samples required for a point to be identified as a core point. A reasonable value for this parameter ensures that isolated noise points are not mistakenly recognized as core points. The second parameter is xi, a density threshold for cluster extraction that helps distinguish dense core clusters from sparse noise regions. The Silhouette Score[34] is adopted as the evaluation index to quantify clustering effectiveness. It is calculated as:
$ \mathrm{s}\left({i}\right)=\dfrac{{b}\left({i}\right){-a}\left({i}\right)}{\max\{a\left({i}\right),b\left({i}\right)\}} $ (1) where,
$ {a}\left({i}\right) $ $ {i} $ $ {b}\left({i}\right) $ $ {i} $ $\in $ Build a reachability ranking graph
-
First, calculate the Euclidean distance and core distance of the road section. In the road maintenance scenario, each sample point
$ {p} $ $ {{X}}_{{p}}=\left[{{x}}_{{p}1},{{x}}_{{p}2},\cdots ,{{x}}_{\text{pn}}\right] $ $ {{x}}_{{p}1} $ $ {{x}}_{{p}2} $ $ {{x}}_{{p}3} $ Core distance: If the core distance of point p is the minimum
$ \varepsilon $ $ \varepsilon $ $ {p} $ $ {p} $ $ \mathrm{CoreDist}\left(\text{p}\right)=\mathrm{min}\{\varepsilon \mid \left| {\text{N}}_{\varepsilon}\left(\text{p}\right)\right| \geq \mathrm{MinPts}\} $ (2) where,
$ {\mathrm{N}}_{\varepsilon }\left(\mathrm{p}\right) $ $ \varepsilon $ $ {\mathrm{p}}_{\mathrm{i}} $ $ \varepsilon $ $ {\mathrm{p}}_{\mathrm{i}} $ Subsequently, a reachability distance matrix is constructed with core points as benchmarks. For a core point
$ \mathrm{p} $ $ \mathrm{q} $ $ \varepsilon $ $ \mathrm{q} $ $ \mathrm{p} $ $ \mathrm{p} $ $ \mathrm{p} $ $ \mathrm{q} $ $ \mathrm{p} $ $ \mathrm{ReachDist}\left(\text{q,p}\right)=\mathrm{max}\left\{\text{CoreDist}\left(\text{p}\right)\text{,d}\left(\text{p,q}\right)\right\} $ (3) where,
$ \mathrm{d}\left(\mathrm{p},\mathrm{q}\right) $ $ \mathrm{p} $ $ \mathrm{q} $ After calculating the core distance and reachability distance for all valid sample pairs, all road sections are sorted according to the reachability distance to form the sample sorting on the horizontal axis of the reachability ranking graph.
Cluster extraction and noise processing
-
From the reachability ranking graph, xi serves as the density threshold for cluster extraction and is used to identify 'valley intervals' as core clusters. Noise points refer to road sections with reachable distances approaching infinity. Such points are assigned to the most similar core clusters via the nearest neighbor algorithm to prevent abnormal data from interfering with the formulation of maintenance plans.
Clustering results
-
For each cluster, analyze its performance characteristics, distress characteristics, and maintenance requirements, and generate cluster feature descriptions.
Priority of road maintenance
-
To address the lack of clarity and reproducibility in the priority factor formulation, this section provides a fully specified mathematical framework for the road section priority factor (RSPF). The RSPF integrates internal pavement deterioration indicators (PCI, RQI, RDI, and SRI) with external influencing factors (traffic volume, road age, elasticity factor, and interval years) into a single comparable score. This enables a horizontally comparable ranking of maintenance urgency across sections with different maintenance types and clustering levels, thereby providing a clear priority basis for subsequent fund allocation. The quantitative criteria for each factor are summarized in Table 3.
Table 3. Priority ranking principle of pavement maintenance.
Influence factor Assignment rules Performance index PCI The value is assigned according to the predicted value of each road segment index, and the smaller value is ranked first RQI RDI SRI Elasticity factor K The value is assigned according to the nature of the road section, and the higher value is ranked first Traffic volume
(103 vehicles/d)T The value is assigned according to the daily traffic volume, and the higher value is ranked first Road age (year) A The value is assigned according to the length of traffic time, and the highest value is ranked first Interval years (years) Y The value is assigned according to the interval between the current maintenance year and the last major and medium-sized maintenance, and the higher value is ranked first To quantitatively determine the relative importance of the influencing factors, 10 authoritative experts in road maintenance management, design, and inspection were invited to perform pairwise comparisons using the Saaty 1–9 scale. A judgment matrix was constructed for each expert, and the priority weight vector was derived as the normalized eigenvector corresponding to the maximum eigenvalue. All consistency ratios (CR) were below 0.1, confirming acceptable consistency. Based on these expert-derived weights, the following three-step optimization procedure is established to compute the priority factors:
Preliminary priority factor (PIF) construction
-
The PIF focuses primarily on the physical and technical condition indices of the highway itself, serving as the fundamental driver of maintenance demand. It reflects the current technical condition of a road section through a weighted summation of key performance indicators, as shown in the following formula:
$ {\text{PIF}}_{\text{i}}=\mathrm{a}\times {\text{PCI}}_{\text{i}}+\mathrm{b}\times {\text{RQI}}_{\text{i}}+\mathrm{c}\times{\text{RDI}}_{\text{i}}+\mathrm{d}\times{\text{SRI}}_{\text{i}} $ (4) where,
$ {\text{PCI}}_{\mathrm{i}} $ $ {\text{RQI}}_{\mathrm{i}} $ ${\text{RDI}}_{\mathrm{i}} $ $ {\text{SRI}}_{\mathrm{i}} $ Table 4. Index weight range.
Weight a b c d Value range 0.35−0.45 0.25−0.35 0.15−0.25 0.10−0.20 The determination of the weight coefficients is accomplished by combining the statistical patterns of historical data and expert experience, and using the AHP. Ten experts in the fields of road maintenance management, design, and inspection are invited to compare and score the four indicators of PCI, RQI, RDI, and SRI pairs according to the degree of influence of each indicator on the technical condition of the pavement and maintenance decisions, and a judgment matrix is constructed. After scoring and sorting, consistency checking and calculation of the comprehensive judgment matrix, the preliminary weights are obtained through the eigenvectors corresponding to the maximum eigenvalues. Substitute the actual detection data of recent years for backtracking verification to ensure that the PIF calculation results are consistent with the actual decay and maintenance records of the road surface. Finally, by combining the AHP results with the data verification feedback, a reasonable weight value is determined (a = 0.35, b = 0.30, c = 0.20, d = 0.15) according to the requirement that the weight sum is 1.
Weighted priority factor (∆R) correction
-
According to the priority ranking principle in Table 3, the weighted priority factor correction
$ \text{Δ}R $ $ i $ $ \text{Δ}{R}_{i} $ $ \Delta {{R}}_{{i}}={{K}}_{{i}}+{{T}}_{{i}}+{{A}}_{{i}}+{{Y}}_{{i}} $ (5) where,
$ {{K}}_{{i}}$ ${{T}}_{{i}} $ ${{A}}_{{i}}$ ${{Y}}_{{i}} $ Final priority factor (RSPF) integration
-
After obtaining the PIF and the ΔR, obtain the RSPF for each road section:
$ {\text{RSPF}}_{\text{i}}={\text{PIF}}_{\text{i}}-\Delta {\text{R}}_{\text{i}} $ (6) Since a smaller
$ PI{F}_{i} $ $ \text{Δ}{R}_{i} $ $ \text{Δ}{R}_{i} $ $ PI{F}_{i} $ Knowledge-driven maintenance measure matching based on retrieval assistance and knowledge graph
-
To address the imprecise alignment between pavement distress characteristics and maintenance treatments in traditional decision-making, this study introduces a knowledge-driven auxiliary decision layer, which aims to transform industry expertise and technical standards into machine-readable matching logic.
Retrieval-assisted knowledge base construction
-
A retrieval-assisted knowledge base was constructed to support the maintenance decision process with relevant textual evidence. The knowledge base integrates multi-source heterogeneous documents, including historical inspection reports, specialized maintenance design schemes, expert review opinions from the Linfen–Houma section of the G5 Highway during 2015–2024, and technical specifications such as the Specifications for Maintenance Design of Highway Asphalt Pavement (JTG 5421-2018)[32]. These sources contain both explicit technical requirements and implicit engineering experience, which are difficult to use directly in numerical decision models.
To make these documents searchable, the unstructured texts were pre-processed through document cleaning, text chunking, and embedding. For a target 100-m road section, its predicted pavement condition and detected distress information were converted into a retrieval request. The retrieval module then returned the most relevant specification clauses, historical treatment cases, and expert recommendations according to semantic similarity. In this study, the retrieval module was used as a supporting layer to provide contextual evidence for subsequent graph-based matching.
Knowledge graph construction and semantic matching logic
-
A 'Distress-Performance-Measure' association knowledge graph was constructed using the Neo4j graph database.
(1) Entity and relationship definition
The knowledge graph contains four main types of entities. The first type is road section entities, which describe the attributes of each 100 m section, including section ID, predicted PCI, RQI, RDI, maintenance category, and cluster label. The second type is distress entities, which describe typical pavement problems such as transverse cracking, longitudinal cracking, rutting, potholes, bleeding, and composite distress. The third type is performance-state entities, which describe threshold-based condition levels of PCI, RQI, RDI, and related indicators used in maintenance classification. The fourth type is maintenance-measure entities, which correspond to standardized engineering treatments such as crack sealing, micro-surfacing, thin friction course overlay, and milling with asphalt overlay.
Each maintenance measure was encoded as a structured node with attributes including measure name, applicable maintenance category, suitable distress type, target performance-state range, expected treatment effect, and basic implementation constraints. In this way, treatment recommendations could be linked not only to distress patterns, but also to maintenance type and performance condition.
Based on these entities, the graph defines several semantic relationships, including has_distress, linking a road section to its dominant distress type; has_condition_level, linking a road section to its predicted performance state; belongs_to_category, linking a road section to preventive maintenance or restorative maintenance; recommended_measure, linking a distress or condition state to candidate treatments; and applicable_to, linking a treatment to its suitable maintenance category and implementation conditions. These relationships were derived from technical specifications and historical engineering records, so that normative rules and case-based knowledge could be represented in a unified structure.
(2) Semantic matching workflow
The semantic matching process consisted of three steps:
First, the target road section was represented by a structured query profile, including its predicted pavement indicators, maintenance category, cluster label, and dominant distress features. For example, a road section could be represented as: 'PCI in medium-to-low range, restorative maintenance, composite cracking cluster, dominant transverse cracking'.
Second, the graph database was queried to retrieve maintenance measures that satisfied both distress-related and condition-related constraints. In this step, the graph performed rule-based filtering to exclude technically unsuitable measures.
(3) Example of section-level treatment matching
To improve interpretability, a section-level example is given here. Suppose that a 100-m road section has predicted values of PCI = 78 and RDI = 82, and its dominant distress feature is significant transverse cracking. According to the classification standards, this section is first categorized as restorative maintenance. The distress feature and predicted condition level are then transformed into graph query conditions. The graph retrieves candidate measures such as crack sealing, micro-surfacing, and milling with asphalt overlay. Among them, crack sealing and surface treatment are retained as feasible options because they match both the restorative maintenance category and the observed cracking pattern, whereas measures requiring more severe structural intervention are excluded at this stage. The final recommendation is then checked against retrieved specification clauses and similar historical cases, so that the selected treatment is not only semantically matched but also supported by engineering evidence.
Through this retrieval-assisted and graph-based matching strategy, the proposed method connects numerical pavement prediction with standardized maintenance decision-making, thereby improving the transparency and technical rationality of treatment recommendation.
Trial calculation of maintenance fund allocation
-
Based on the classification of maintenance types (PM/RM) and the priority ranking of sections (RSPF), this section designs a trial calculation process for fund allocation that serves practical engineering decision-making. The goal is not to pursue a globally optimal solution in a strict mathematical sense, but to generate a feasible and transparent allocation plan under budget and performance constraints, following the principle of restorative maintenance first, preventive maintenance second, under the constraint of the total budget M, and taking the RSPF ranking result as the input.
The allocation process is governed by two constraints: (1) Budget constraint: the total allocated maintenance cost must not exceed the annual fund limit M. This reflects real-world financial limitations. (2) Performance constraint: the average PCI of the entire road network after maintenance should meet or exceed a preset target (e.g., PCI ≥ 90). This ensures that the allocation plan achieves a minimum acceptable level of overall pavement quality.
All road sections are first classified into RM and PM according to the criteria in Table 2. Sections within each category are then sorted in ascending order of RSPF (lower RSPF indicates higher maintenance urgency). The trial calculation process is governed by two constraints: the total annual budget and the network-level performance target. The procedure follows the principle of RM first, PM second, and proceeds as follows:
Initialization and priority rule
-
The RM sections are prioritized for allocation. Only after all eligible RM sections are covered, and if the budget still permits, will PM sections be considered.
Iterative trial calculation for RM sections
-
Let the RM sections be indexed in ascending RSPF order, with maintenance cost
$ {\mathrm{B}}_{\mathrm{i}} $ $ {\text{cost}}_{\text{RM}}={\mathrm{B}}_{1} $ $ {\text{cost}}_{\text{RM}}< \mathrm{M} $ $ {\text{PCI}}_{\text{ave}}<90 $ $ {\text{cost}}_{\text{RM}}={\mathrm{B}}_{1}+{\mathrm{B}}_{2} $ $ {\text{PCI}}_{\text{ave}} $ $ {\text{cost}}_{\text{RM}}=\sum\limits_{\mathrm{i}=1}^{\mathrm{N}}{\mathrm{B}}_{\mathrm{i}}< \mathrm{M} $ $ {\text{PCI}}_{\text{ave}}< 90 $ If at this point
$ {\text{cost}}_{\text{RM}}=\sum\limits_{\mathrm{i}=1}^{\mathrm{N}+1}{\mathrm{B}}_{\mathrm{i}}< \mathrm{M} $ $ {\text{PCI}}_{\text{ave}}\geq 90 $ If all road sections under the RM category are included in the calculation and the corresponding maintenance cost meets the conditions
$ {\text{cost}}_{\text{RM}}=\sum\limits_{\mathrm{i}=1}^{{\mathrm{m}}_{1}}{\mathrm{B}}_{\mathrm{i}}< \mathrm{M} $ $ {\text{PCI}}_{\text{ave}}\geq 90 $ Iterative trial calculation for PM sections
-
Once RM allocation is finalized, the same iterative logic is applied to PM sections, using their RSPF ordering and respective maintenance costs. PM sections are added sequentially only if the remaining budget suffices. No further performance constraint is enforced at this stage unless explicitly required.
Interpretation of fund utilization rate
-
After the trial calculation completes, the fund utilization rate is defined as the ratio of actual allocated funds to the total budget M. A utilization rate below 100% does not indicate inefficiency in fund usage. Rather, it reflects the discrete nature of section-level allocation: the next highest-priority section in the sorted list may have a maintenance cost exceeding the remaining budget, and no further section can be added without violating the established priority order (RM before PM) or the performance constraint (average PCI ≥ 90). In engineering practice, such residual funds can be reasonably reserved for emergency maintenance or unforeseen distress.
Comparison with traditional approaches
-
In contrast to traditional threshold-based methods (e.g., selecting sections solely based on PCI falling below a fixed threshold), the proposed trial calculation process explicitly respects both budget and performance constraints, enforces a clear priority order, and provides a transparent, traceable decision path for highway asset management.
-
To validate the effectiveness of the proposed model, systematic comparative experiments were designed based on a measured dataset from 100-m-level road sections of the Lin-Hou section of the JK Highway in Shanxi Province, China, from 2015 to 2024. The experimental hardware platform consisted of an Intel Core i7-12700K processor with 32 GB DDR4 memory. The experiments focused on quantitative evaluation and analysis of pavement performance prediction accuracy and the benefits of maintenance fund allocation.
To comprehensively and objectively evaluate model performance[35], this study adopts three metrics: root mean square error (RMSE), mean absolute error (MAE), and the coefficient of determination (R2).
Performance prediction results and analysis
-
To verify the advantages of the fusion model, RF and XGBoost were selected as benchmarks for comparison. The performance comparison of each model on key indicators is shown in Table 5.
Table 5. Comparison of experimental results.
Model Indicator PQI RQI PCI RDI Average XGBoost R2 0.8991 0.8113 0.9677 0.5465 0.8062 RMSE 1.1309 0.7380 1.8493 0.9413 1.1649 MAE 0.8694 0.5040 1.4265 0.6614 0.8653 RF R2 0.8105 0.6940 0.8111 0.7781 0.7734 RMSE 1.5421 0.9349 4.4494 0.6551 1.8954 MAE 1.1930 0.5385 3.5367 0.4679 1.4340 Ours R2 0.9101 0.9112 0.9314 0.8908 0.9109 RMSE 1.0715 0.5033 2.7075 0.4596 1.1855 MAE 0.8220 0.3602 2.1038 0.3457 0.9079 As shown in Table 5, RF and XGBoost show different prediction characteristics across the four pavement performance indicators. XGBoost performs better in PCI prediction, with an R2 of 0.9677, while RF performs better than XGBoost in RDI prediction, with an R2 of 0.7781 compared with 0.5465. This indicates that the two base learners have certain complementary advantages, which provides support for their fusion in the stacking framework.
The proposed method demonstrates noticeable strengths in predicting core performance indicators. For PQI, the proposed method achieves an R2 of 0.9101, which is higher than XGBoost 0.8991 and RF 0.8105. Its RMSE and MAE are also the lowest among the three models, indicating that the proposed method has better prediction accuracy for the overall pavement quality condition. For RQI, the R2 of the proposed method reaches 0.9112, which is 12.3% higher than that of XGBoost 0.8113. Meanwhile, its RMSE decreases to 0.5033 and MAE to 0.3602. This indicates that the fusion model can more accurately capture the subtle patterns of RQI variation with traffic load and pavement age. For PCI, the R2 of the proposed method is 0.9314. Although slightly lower than XGBoost's 0.9677, it still shows a 14.8% improvement over RF's 0.8111 and maintains a high prediction level. For RDI, an indicator characterized by strong nonlinear deterioration, the proposed method achieves an R2 of 0.8908, which is 63.0% higher than XGBoost's 0.5465 and 14.5% higher than RF's 0.7781. This further validates the effectiveness of the stacking framework in handling the complex influencing factors in the RDI deterioration process.
Overall, the proposed method achieves the highest average R2 of 0.9109. Although XGBoost has slightly lower average RMSE and MAE values, the proposed method maintains a more balanced prediction ability across the four indicators. These results show that the stacking model can make use of the complementary advantages of RF and XGBoost and provide reliable prediction results for subsequent maintenance prioritization and fund allocation.
Several representative road segments were selected from the target road segments and used to predict the long-term evolution trends of core pavement performance indices using an exponential decay model[36], yielding the evolution trend from 2016 to 2033 (Fig 5). Among them, the data from 2016 to 2018 are actual monitoring data of the sections, and the data from 2019 to 2033 (15 years) are predicted based on the exponential decay model, which can intuitively reflect the attenuation characteristics (the selected sections are representative and can embody the general trends of similar sections).
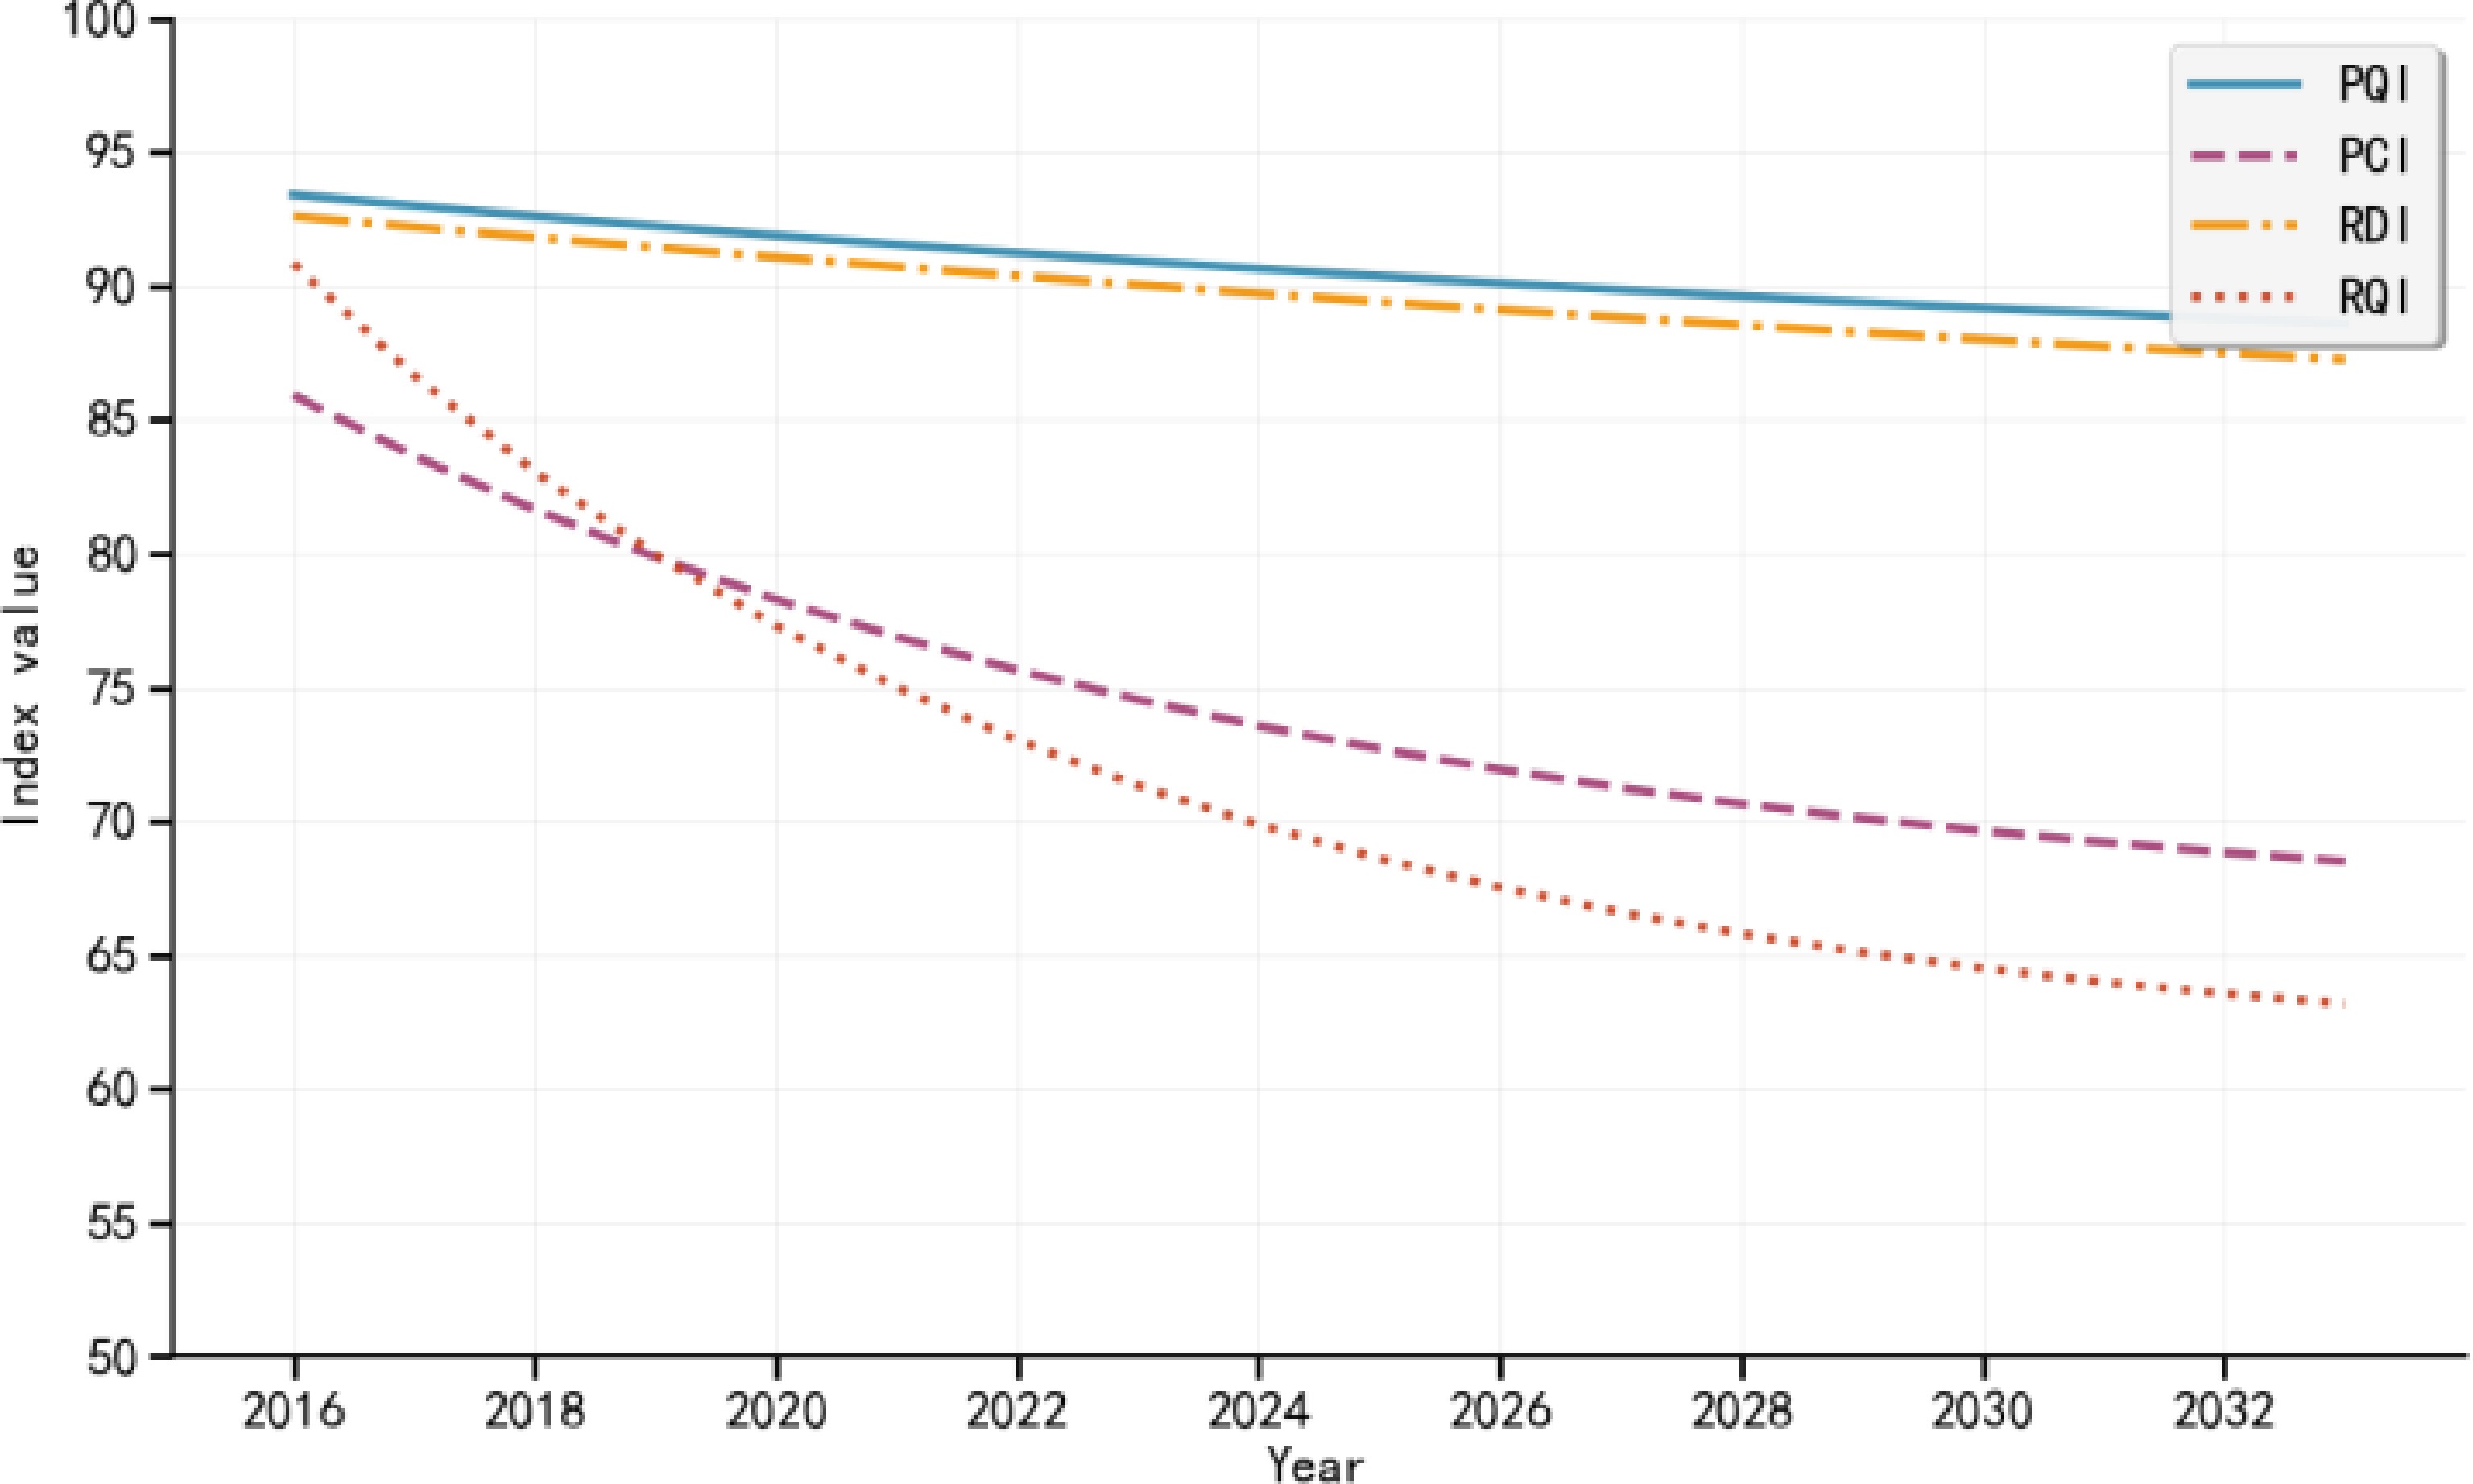
Figure 5.
Evolution trends of pavement performance indices (2016–2033).
From the perspective of index changes, the RQI of section 777671–778358 decreased rapidly from 95.48 in 2016 to 72.88 in 2018, and is expected to decline to approximately 63 by 2033. This indicates a relatively fast deterioration in riding quality, suggesting that such sections should be considered in advance in maintenance planning. The PCI of section 762671–763671 decreased from 89.82 in 2016 to 76.27 in 2018, and is expected to be around 70 by 2033, showing a typical aging trend of pavement condition. In contrast, PQI and RDI show gentler attenuation and better stability, but regular inspection and preventive maintenance are still needed to maintain their performance.
Fund allocation results and analysis
Road section classification and prioritization
Refined classification based on OPTICS clustering
-
On the basis of a preliminary division of maintenance types (PM/RM) according to performance index thresholds, the OPTICS density clustering algorithm is adopted for refined grouping of road sections. After data preprocessing (missing value filling, standardization) and parameter optimization (taking the silhouette coefficient as the evaluation index), three core clusters are finally obtained. The core characteristics of each cluster are shown in Table 6.
Table 6. Core characteristics of OPTICS clustering results.
Cluster No. Core features Key indicators (average) Maintenance type ratio Distress distribution 1 High-performance low-distress group PCI 93.60, RQI 92.85,
RDI 95.45RM 1.3%, PM 98.7% 63.6% of sections have no distress; main distress is transverse crack (21.3%) 2 Medium-performance low-distress group PCI 87.40, RQI 87.37,
RDI 90.57RM 59.0%, PM 41.0% 39.2% of sections have no distress; main distress is longitudinal crack (39.9%) 3 Medium-performance medium-distress group PCI 84.65, RQI 93.53,
RDI 93.96RM 43.8%, PM 56.2% Main distresses are longitudinal cracks (43.8%) and transverse cracks (56.2%); complex distress combinations accounts for 78.8% To determine the most appropriate technical measures for each identified cluster, a semantic matching process was performed. The knowledge-driven approach provides a more nuanced decision-making logic compared to traditional threshold-based methods. Specifically, for Cluster 3, although its average PCI (84.65) is relatively close to that of Cluster 2 (87.40), the distress distribution revealed a 78.8% prevalence of complex composite cracks.
The knowledge graph between pavement distress characteristics and maintenance treatments is visualized in Fig 6. For example, when a target section is linked to a cracking-related distress node and a relatively low performance-state node, the graph first retrieves the candidate maintenance measures connected with the same distress type, and then further filters them according to the applicable maintenance category and specification constraints. By executing Cypher queries within the Neo4j-based graph, the system identified the structural risks associated with these patterns as defined in the JTG 5421-2018 standards[32].
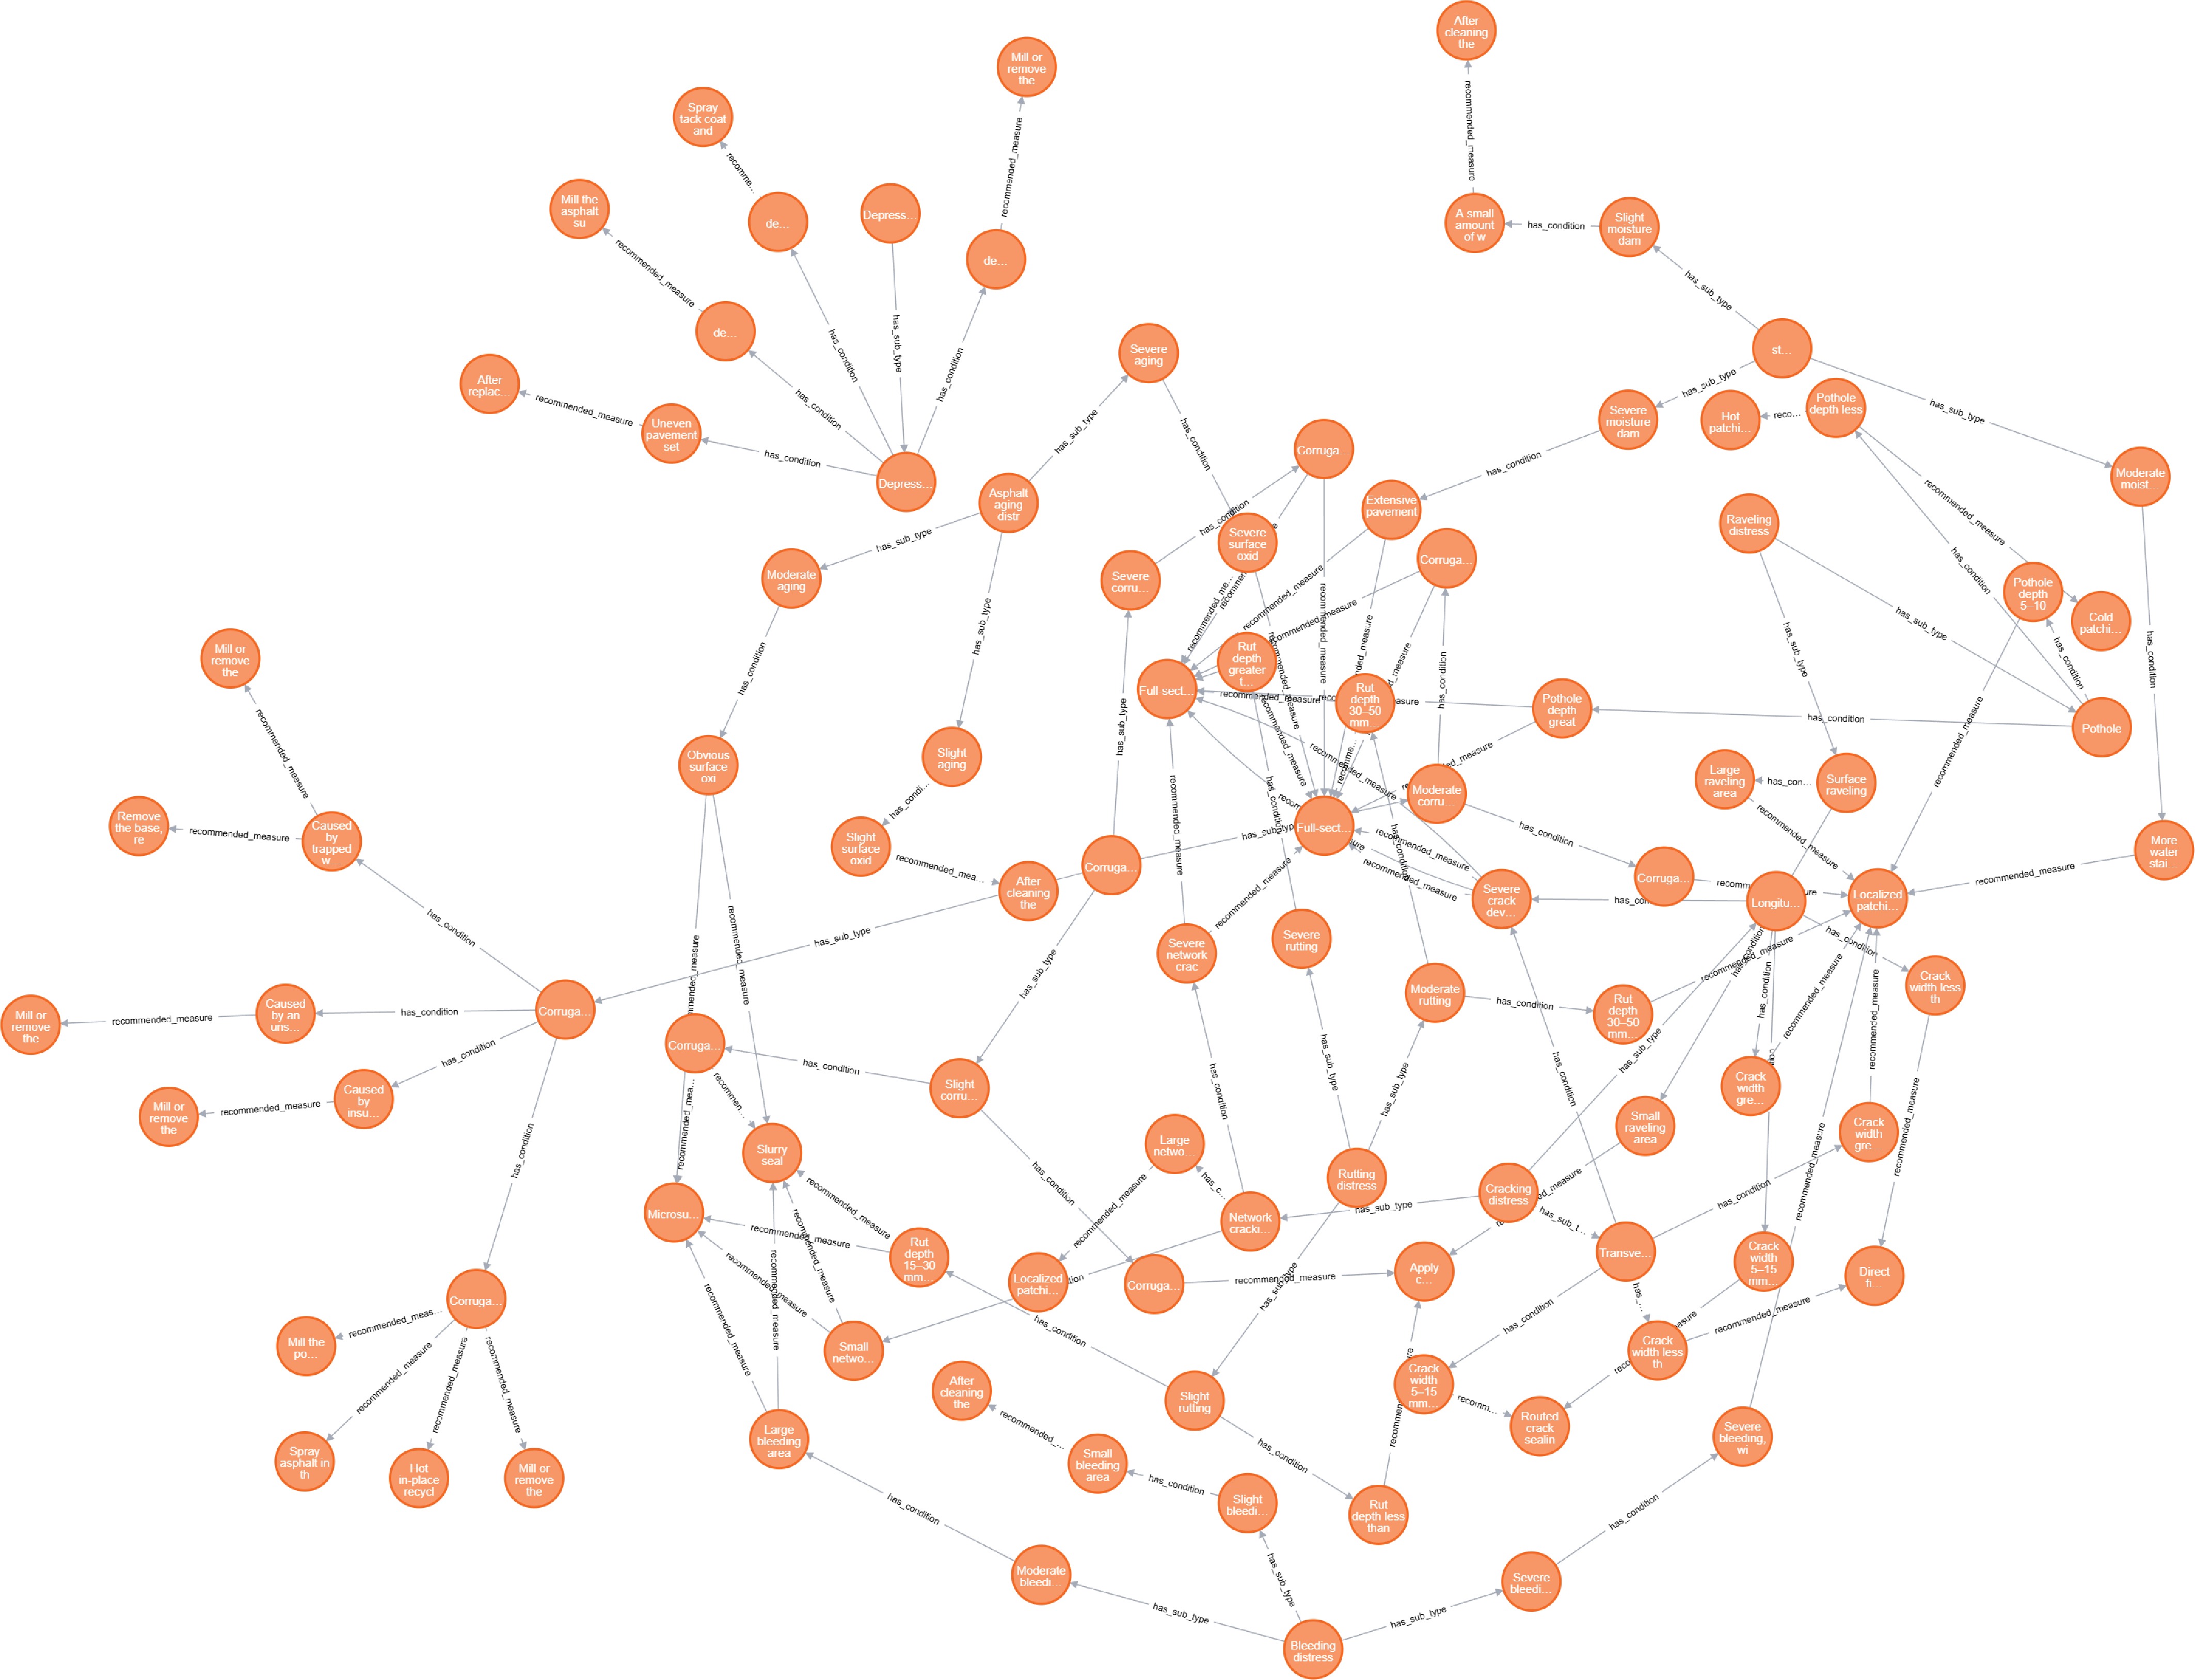
Figure 6.
Asphalt pavement distress maintenance measures based on knowledge graphs.
Quantitative prioritization based on RSPF
-
PIF and
$ \text{Δ}R $ Table 7. Top 10 priority sections for PM and RM categories.
Road ID PCI RQI RDI SRI RSPF Maintenance
typePriority
rankingG5-213.1 85.35 90.25 73.77 94.17 64.38 PM 1 G5-204.1 86.30 85.46 93.49 94.17 67.22 PM 2 G5-228.3 85.31 86.44 94.83 94.17 67.43 PM 3 G5-775.4 87.93 85.58 92.22 94.17 67.57 PM 4 G5-771.6 86.40 85.13 96.13 94.17 67.68 PM 5 G5-745.8 86.33 89.48 91.15 94.17 67.97 PM 6 G5-195.3 87.02 86.62 94.26 94.17 67.97 PM 7 G5-755 85.93 90.18 91.02 94.17 68.01 PM 8 G5-756.5 85.10 89.59 94.21 94.17 68.18 PM 9 G5-275.7 86.63 87.44 95.02 94.17 68.23 PM 10 G5-229.4 82.40 46.64 93.81 94.17 54.27 RM 1 G5-756.7 83.71 54.94 85.62 94.17 55.58 RM 2 G5-256.8 49.13 91.96 96.71 94.17 56.80 RM 3 G5-203.1 48.68 95.89 98.04 94.17 58.09 RM 4 G5-267.3 68.77 85.15 79.32 94.17 58.16 RM 5 G5-215.9 55.92 89.71 95.43 94.17 58.25 RM 6 G5-752.1 65.52 83.68 91.04 94.17 58.92 RM 7 G5-203 50.89 96.18 98.02 94.17 58.95 RM 8 G5-268.6 56.57 92.62 94.36 94.17 59.14 RM 9 G5-5.8 53.25 95.34 97.15 94.17 59.35 RM 10 The sorting results show that RSPF can effectively identify sections with urgent maintenance needs. In the RM category, the top-ranked section G5-229.4 has an extremely low RQI of 46.64, indicating a severe riding-quality deficiency and a strong need for corrective maintenance. In the PM category, the top-ranked section G5-213.1 has a relatively low RDI of 73.77 compared with the other PM sections, suggesting that rutting-related deterioration contributes to its higher priority. Overall, the selected sections show clear performance weaknesses in at least one key indicator, which supports the rationality of the RSPF-based ranking results.
Fund trial calculation results and benefit analysis
-
Following the principle of prioritizing restorative maintenance and then preventive maintenance, the proposed method performs stepwise fund trial calculation under budget constraints. For each budget scenario, the method updates the selected section set, cumulative cost, and expected network performance in sequence, thereby identifying the feasible maintenance range corresponding to the available funds. Based on this process, three budget scenarios were simulated for the study section, and the resulting allocation schemes were compared with the conventional strategy, as shown in Table 8.
Table 8. Comparison of fund allocation results under different scenarios.
Scenario Total budget
(10,000 CN¥)Covered
sections
(PM + RM)Average
PCI after
maintenanceFund utilization
rateScenario 1 25 13 91.06 99.6% Scenario 2 35 16 97.30 99.2% Scenario 3 45 20 100.00 84.4% Traditional method 35 12 94.53 98.1% As can be seen from the data in Table 8, the proposed method exhibits better comprehensive performance in fund allocation efficiency and maintenance benefit compared with the traditional approach: under the same budget constraint of 350,000 yuan, the proposed method covers 16 sections, including all 10 RM sections and 6 PM sections. The traditional method only covers 12 sections; a large number of sections with medium to high distress and high traffic volume have not been included in the maintenance plan due to priority quantification. The average PCI after maintenance with the proposed method is 97.30, which is higher than the traditional method's 94.53. This shows that under limited funds, the proposed method can focus on sections with urgent maintenance needs, leading to better overall improvement of pavement performance. The reason is that conventional schemes classify road sections for maintenance merely based on the single PCI indicator, ignoring external urgency factors such as traffic volume, road age, and maintenance intervals. Consequently, critical sections featuring complex pavement distress and heavy traffic loads are highly likely to be overlooked. In contrast, the RSPF quantifies maintenance urgency by integrating multi-dimensional indicators, and combined with matched appropriate treatment technologies via the maintenance knowledge graph, it directs maintenance funds toward high-benefit road sections, while simultaneously expanding the coverage of maintained sections and improving the overall pavement performance of the highway network.
In the scenario with the lowest budget of 250,000 yuan, the proposed method still covers 13 sections. The average PCI after maintenance reaches 91.06, meeting the preset performance target of average PCI ≥ 90. Under limited funds, the proposed method can ensure the basic performance of the road network to avoid missing the optimal disposal period for a large number of diseased road sections. The traditional method under a higher budget can only cover 12 sections, and the effect of performance improvement is relatively insufficient.
When the budget is sufficient at 450,000 yuan, the proposed method can cover all 20 sections in need of maintenance. The average PCI reaches 100, fully restoring the pavement to excellent condition. At the same time, the remaining funds can also be used for emergency maintenance and special maintenance tasks.
Conventional maintenance fund allocation methods mostly screen road sections through the threshold of a single performance indicator and rank sections relying on managers' experience, which have inherent drawbacks. These results confirm that the proposed method, based on RSPF priority ranking and iterative fund trial calculation, achieves matching between maintenance funds and section needs, effectively improving the scientificity and efficiency of fund allocation.
Discussion
-
Compared with traditional maintenance decision methods that rely on single-index threshold judgment or empirical ranking, the proposed method has prominent advantages in application effect and practical value. First, the stacking fusion prediction model integrates the advantages of Random Forest and XGBoost, and realizes high-precision short-term prediction, which effectively solves the problem of insufficient multi-source information utilization and low coordination of multi-index prediction in traditional methods. Second, the road section priority factor (RSPF) constructed in this study comprehensively fuses pavement performance indicators and external dynamic factors such as traffic volume, road age, maintenance interval, and section importance, breaking through the limitation of one-dimensional priority evaluation, and can quantitatively and objectively reflect the maintenance urgency of different sections. Third, the knowledge-driven maintenance measure matching module based on the maintenance knowledge graph and retrieval enhancement tightly connects pavement distress characteristics and performance status with standardized maintenance measures, making the decision-making process more transparent and technically compliant, and avoiding the randomness of empirical selection of maintenance measures. Finally, the iterative fund trial calculation under budget constraints strictly follows the principle of restorative maintenance first and preventive maintenance second, which can improve pavement performance better under limited funds.
In terms of method limitations, first, this method relies on complete multi-source data such as pavement performance detection, traffic volume, and maintenance history, and its application effect in road sections with incomplete data or insufficient long-term detection data will be affected. Second, the current model does not fully consider the impact of extreme weather, emergency distress, and other uncertain disturbances, and the robustness of the model in complex scenarios needs to be enhanced.
For the highway maintenance department, the proposed 100-m refined decision-making unit method conforms to the trend of refined development in modern highway infrastructure management and can effectively support the management department's daily maintenance plan formulation, annual budget preparation, and maintenance measure selection. In the case of a limited maintenance budget, this method can accurately identify high-priority maintenance sections, avoiding the waste of funds caused by excessive maintenance and preventing road surface degradation caused by insufficient maintenance, thus achieving a balance between capital investment and road service quality.
-
This study proposes an integrated framework for highway maintenance fund allocation. The main conclusions are summarized as follows:
(1) A stacking-based prediction model was constructed for short-term pavement performance prediction at the 100-m section level. The experimental results indicate that the proposed model exhibits excellent predictive performance across multiple key evaluation indicators, with an average R2 of 0.9109, which provides reliable data support for subsequent maintenance decision-making practices.
(2) The proposed road section priority factor (RSPF) comprehensively integrates pavement performance indicators and external factors such as traffic volume, road age, maintenance interval, and section importance, which can quantify maintenance urgency more objectively and comprehensively and overcome the limitation of single-dimensional evaluation in traditional methods.
(3) The knowledge-driven maintenance measure matching mechanism based on a knowledge graph and retrieval augmentation realizes reliable matching between road section distress characteristics and standardized maintenance measures. Under the same budget constraint, compared with the traditional strategy, the proposed method can cover more maintenance sections and effectively improve the average pavement performance after maintenance.
Despite providing targeted solutions for highway maintenance fund allocation, this study still has certain limitations. Future work will focus on the following aspects: (1) Introducing automatic weight optimization and adaptive parameter adjustment algorithms to reduce the dependence on expert experience and facilitate engineering application. (2) Incorporating environmental factors, traffic emergencies, and other dynamic disturbances into the model and building a more robust maintenance decision framework.
-
The authors confirm their contributions to the paper as follows: conceptualization, methodology, validation: Zhou J, Hao J; data curation: Tian J, Niu Y; formal analysis: Li L, Pei L; investigation: Zhou J, Hao J, Tian J; resources: Hao J; software: Tian J; supervision: Hao J; visualization, Pei L; writing—original draft preparation:Zhou J, Li L; writing—review and editing: Tian J, Niu Y, Pei L; project administration, Niu Y, Li L, Pei L; funding acquisition: Pei L. All authors reviewed the results and approved the final version of the manuscript.
-
The raw data used in this study (e.g., road materials, traffic records) are confidential under legal agreements with government partners and cannot be shared publicly. Processed data or summaries are available upon request from the authors, subject to approval by the data providers.
-
The authors declare that they have no conflict of interest.
- Copyright: © 2026 by the author(s). Published by Maximum Academic Press, Fayetteville, GA. This article is an open access article distributed under Creative Commons Attribution License (CC BY 4.0), visit https://creativecommons.org/licenses/by/4.0/.
-
About this article
Cite this article
Zhou J, Hao J, Tian J, Niu Y, Li L, et al. 2026. Intelligent allocation method of highway maintenance funds based on priority factor calculation. Digital Transportation and Safety 5(3): 216−228 doi: 10.48130/dts-0026-0017 

Intelligent allocation method of highway maintenance funds based on priority factor calculation
- Received: 18 March 2026
- Revised: 28 June 2026
- Accepted: 01 July 2026
- Published online: 30 September 2026
Abstract: To address deficiencies in current maintenance decision-making, including insufficient use of multi-source information, one-dimensional priority evaluation, and irrational fund allocation, this study proposes an intelligent maintenance decision-support framework based on priority factor calculation. A stacking-based prediction model is first developed to forecast short-term pavement performance at a 100 m spatial granularity, covering the Pavement Condition Index (PCI), Riding Quality Index (RQI), Rut Depth Index (RDI), and Pavement Quality Index (PQI). Based on predicted pavement condition, the Road Section Priority Factor (RSPF) is calculated to quantify section priority, and a knowledge-driven matching module supported by a maintenance knowledge graph identifies suitable treatment measures for prioritized sections. Finally, an iterative trial-calculation procedure under budget constraints generates feasible maintenance allocation schemes. Validation on the LH section of the Beijing–Kunming Highway in Shanxi Province, China, shows that the proposed method achieves competitive prediction performance, with an average coefficient of determination (R2) of 0.9109 across the four indicators. Under the same budget, the proposed method covers 16 sections, compared with 12 under the conventional strategy, and increases average post-maintenance PCI from 94.53 to 97.30. These results indicate that the proposed framework can improve road maintenance decisions and assist fund allocation for 100-m sections.