-
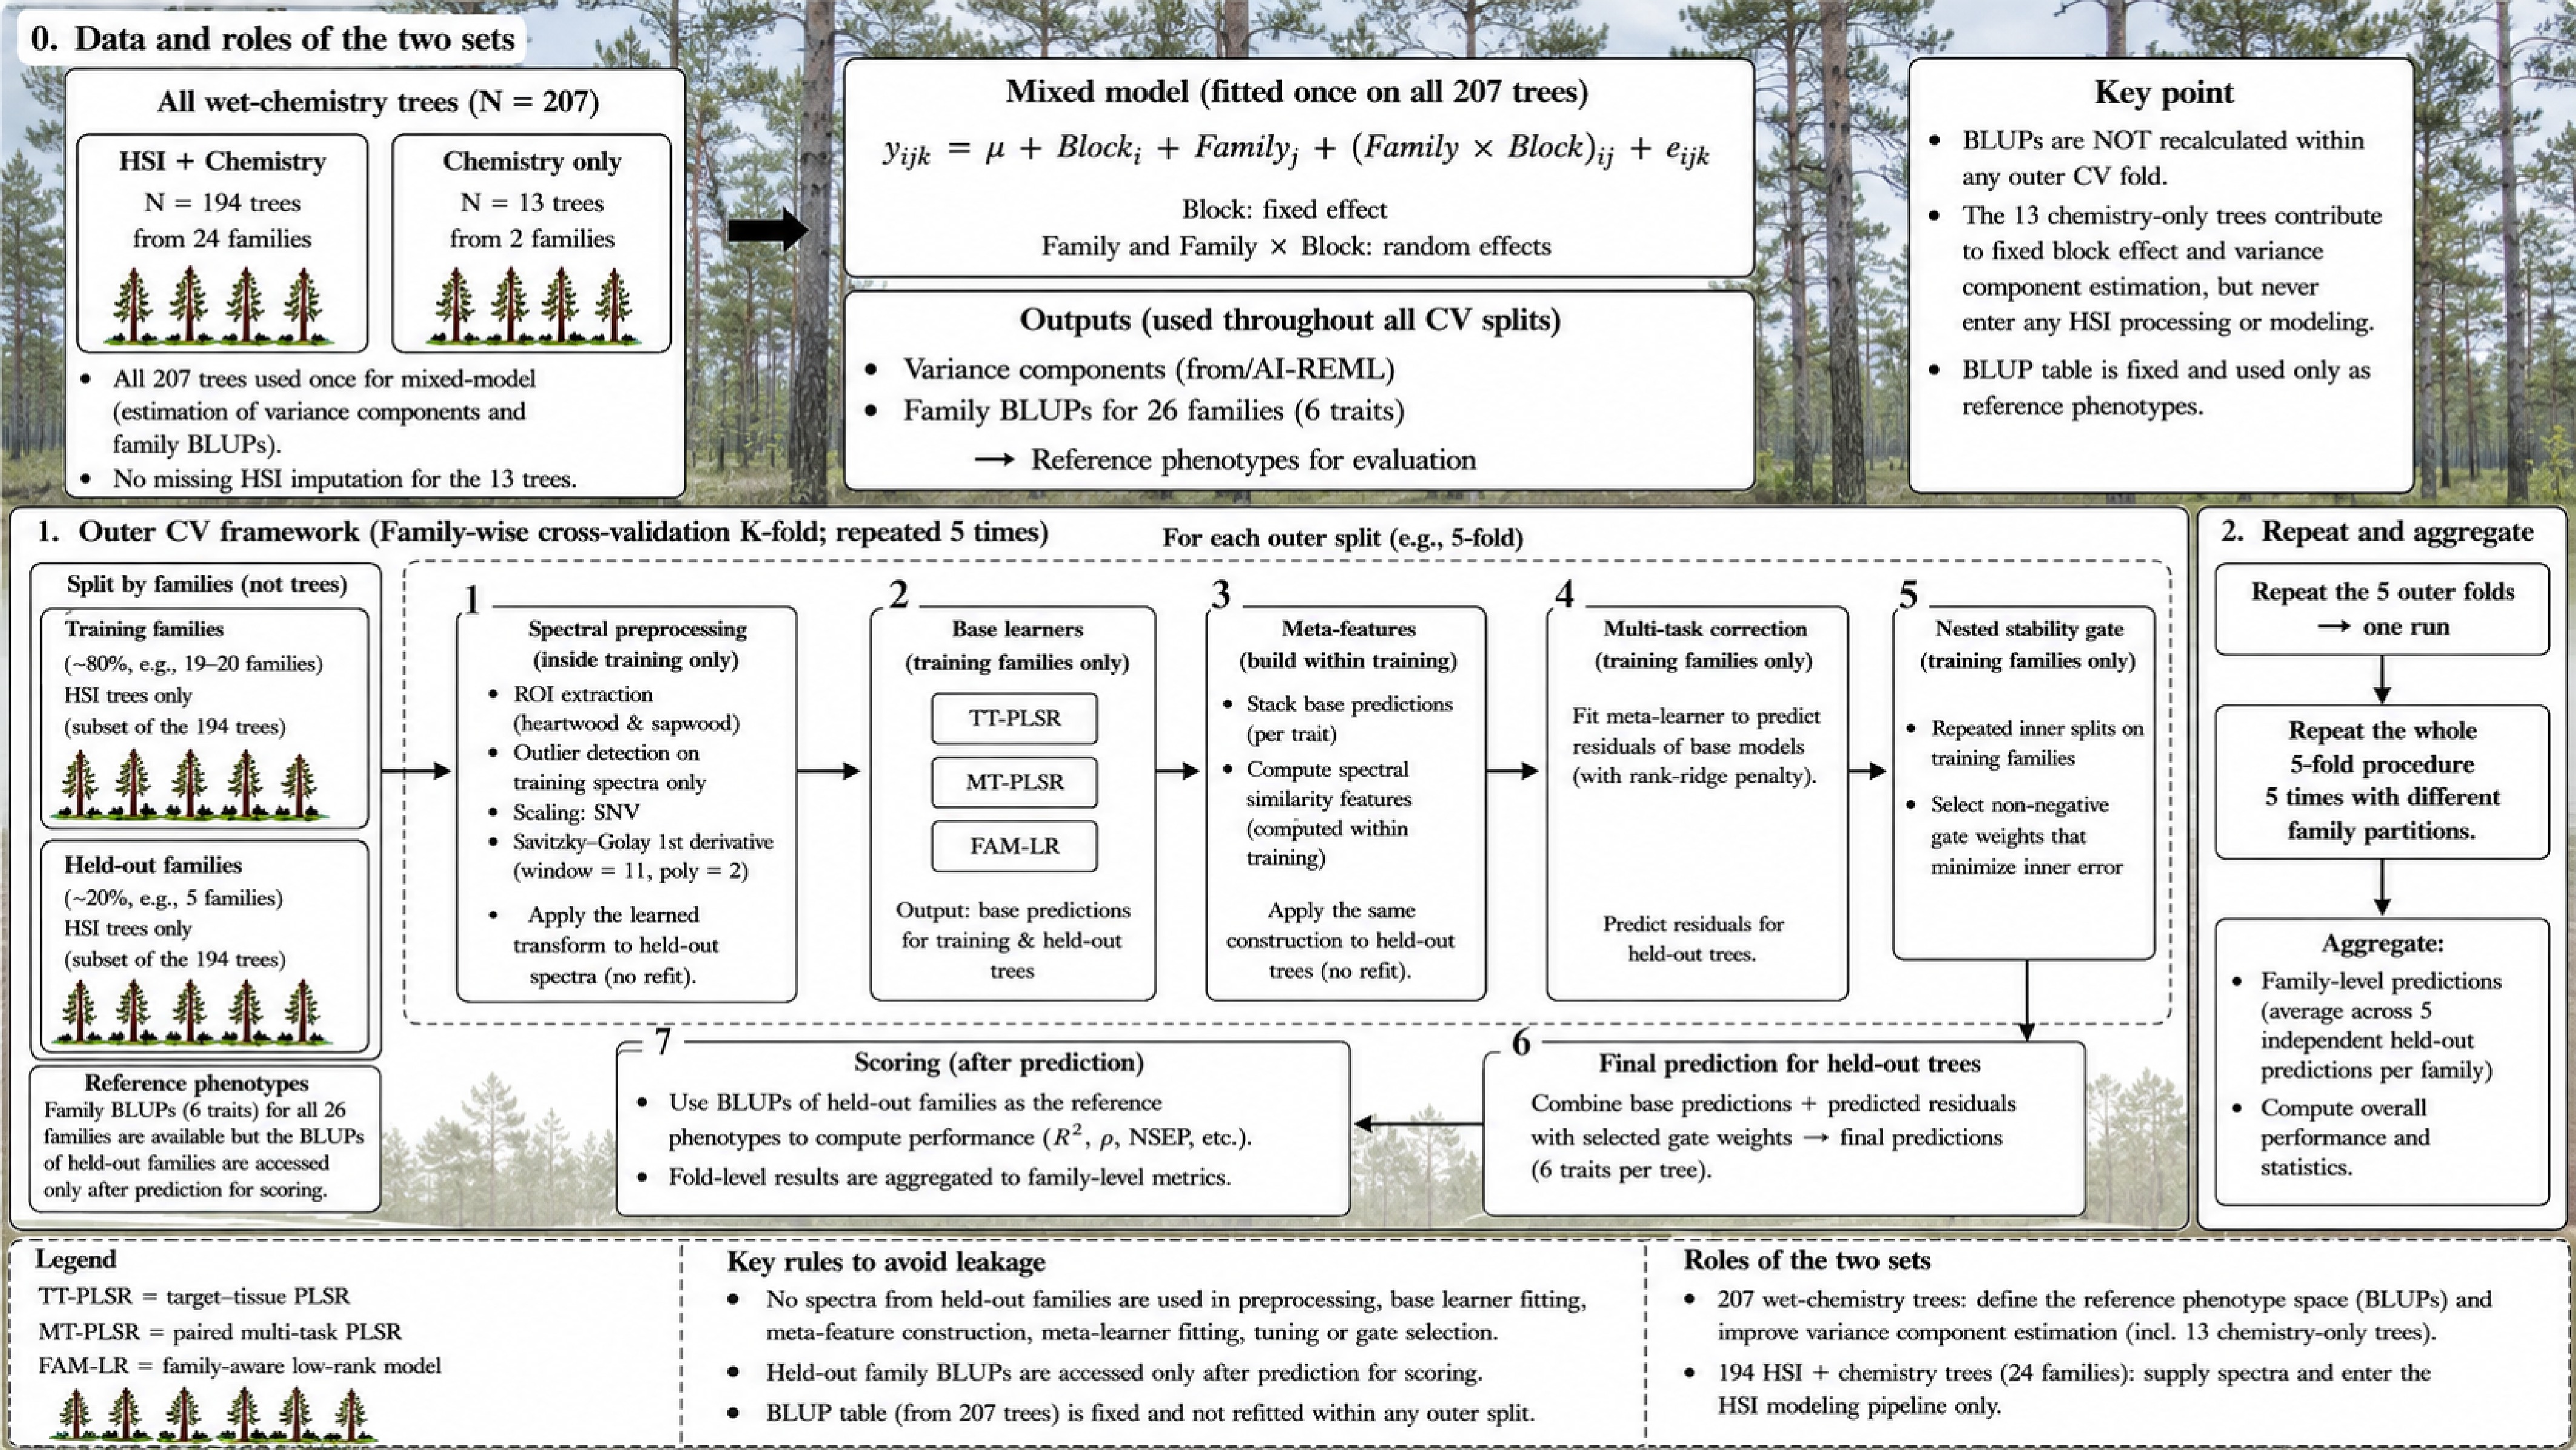
Figure 1.
Study design and family-wise cross-validation workflow for SWIR-HSI prediction of heartwood and sapwood chemistry in slash pine. Family BLUPs for six chemistry traits were estimated once from all 207 wet-chemistry trees, whereas only the 194 trees from 24 families with paired SWIR-HSI entered HSI modelling. Within each outer split, preprocessing, model fitting, tuning, and gate selection used training families only, and held-out-family BLUPs were used only for post-prediction scoring. Five-fold family-wise cross-validation was repeated five times, and predictions were aggregated at the family level.
-
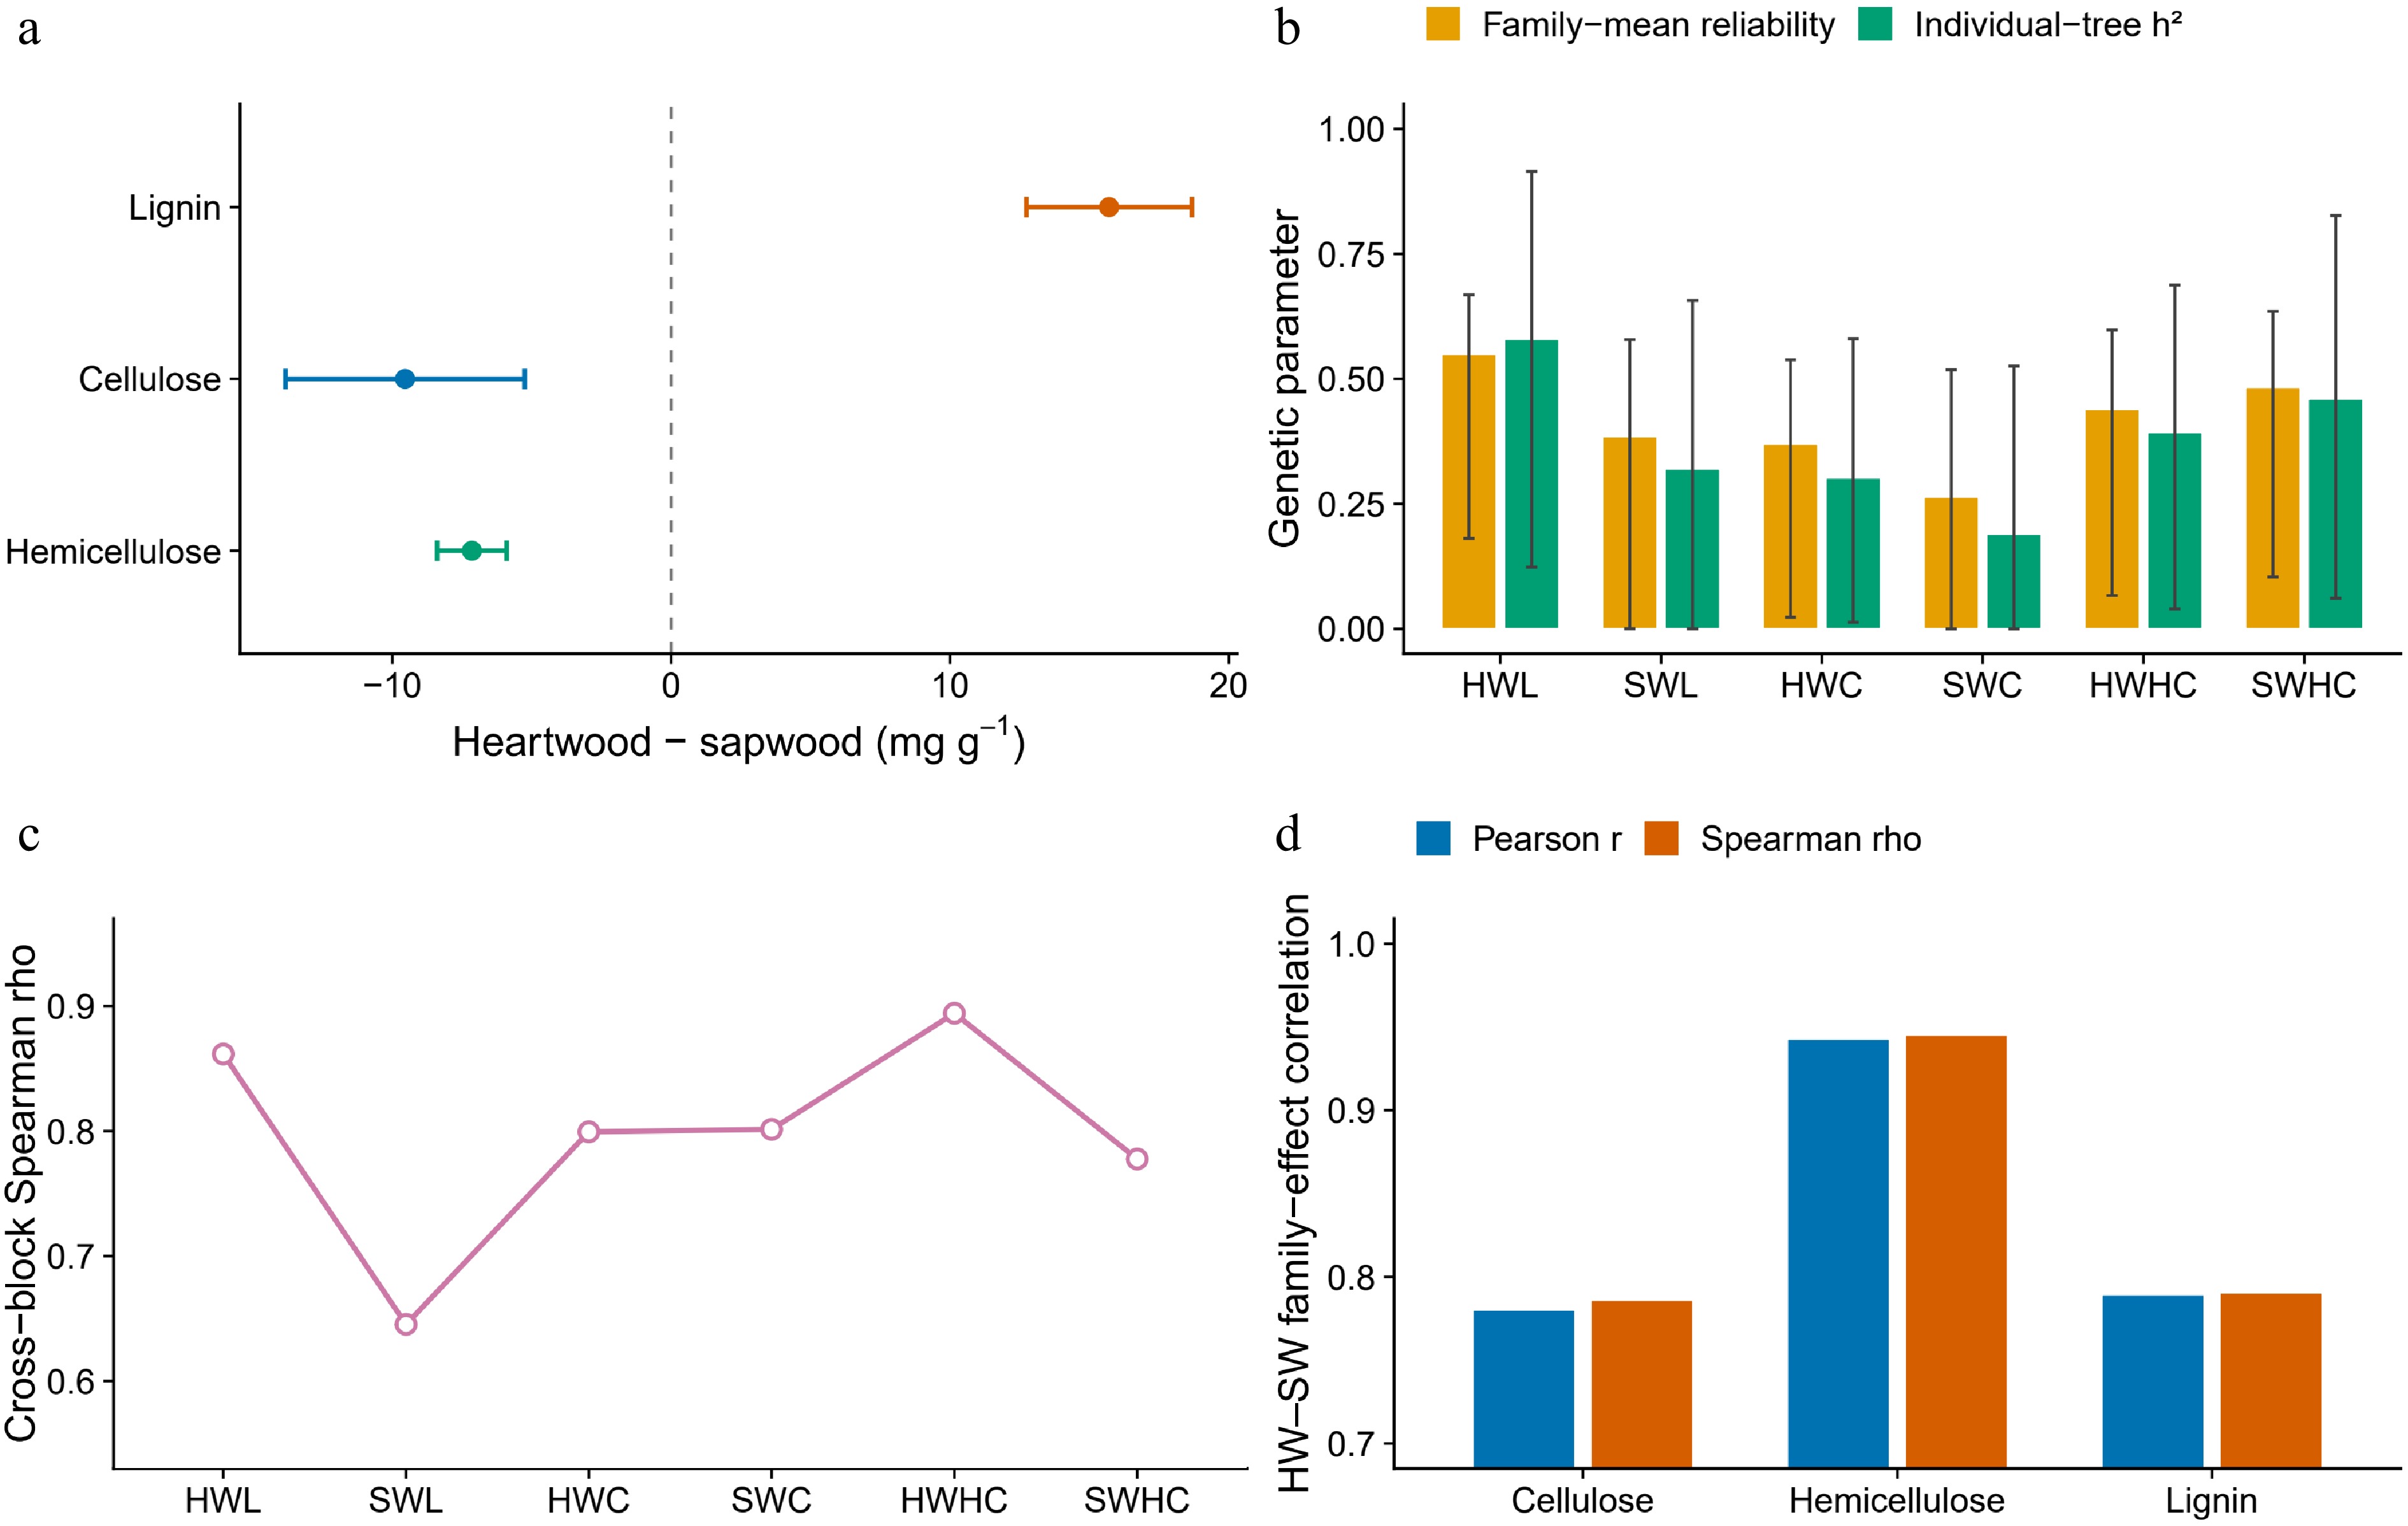
Figure 2.
Radial chemistry, family signal, and tissue covariance. (a) Mean heartwood-minus-sapwood differences for 207 trees with 95% confidence intervals. (b) Individual-tree heritability and family-mean reliability for 26 families; bars are point estimates and error bars are family-stratified bootstrap 95% intervals from 200 replicates. (c) Spearman correlations between block-specific means for the 23 HSI families represented in both blocks. (d) Pearson and Spearman correlations between heartwood and sapwood BLUPs for the 24 HSI families.
-
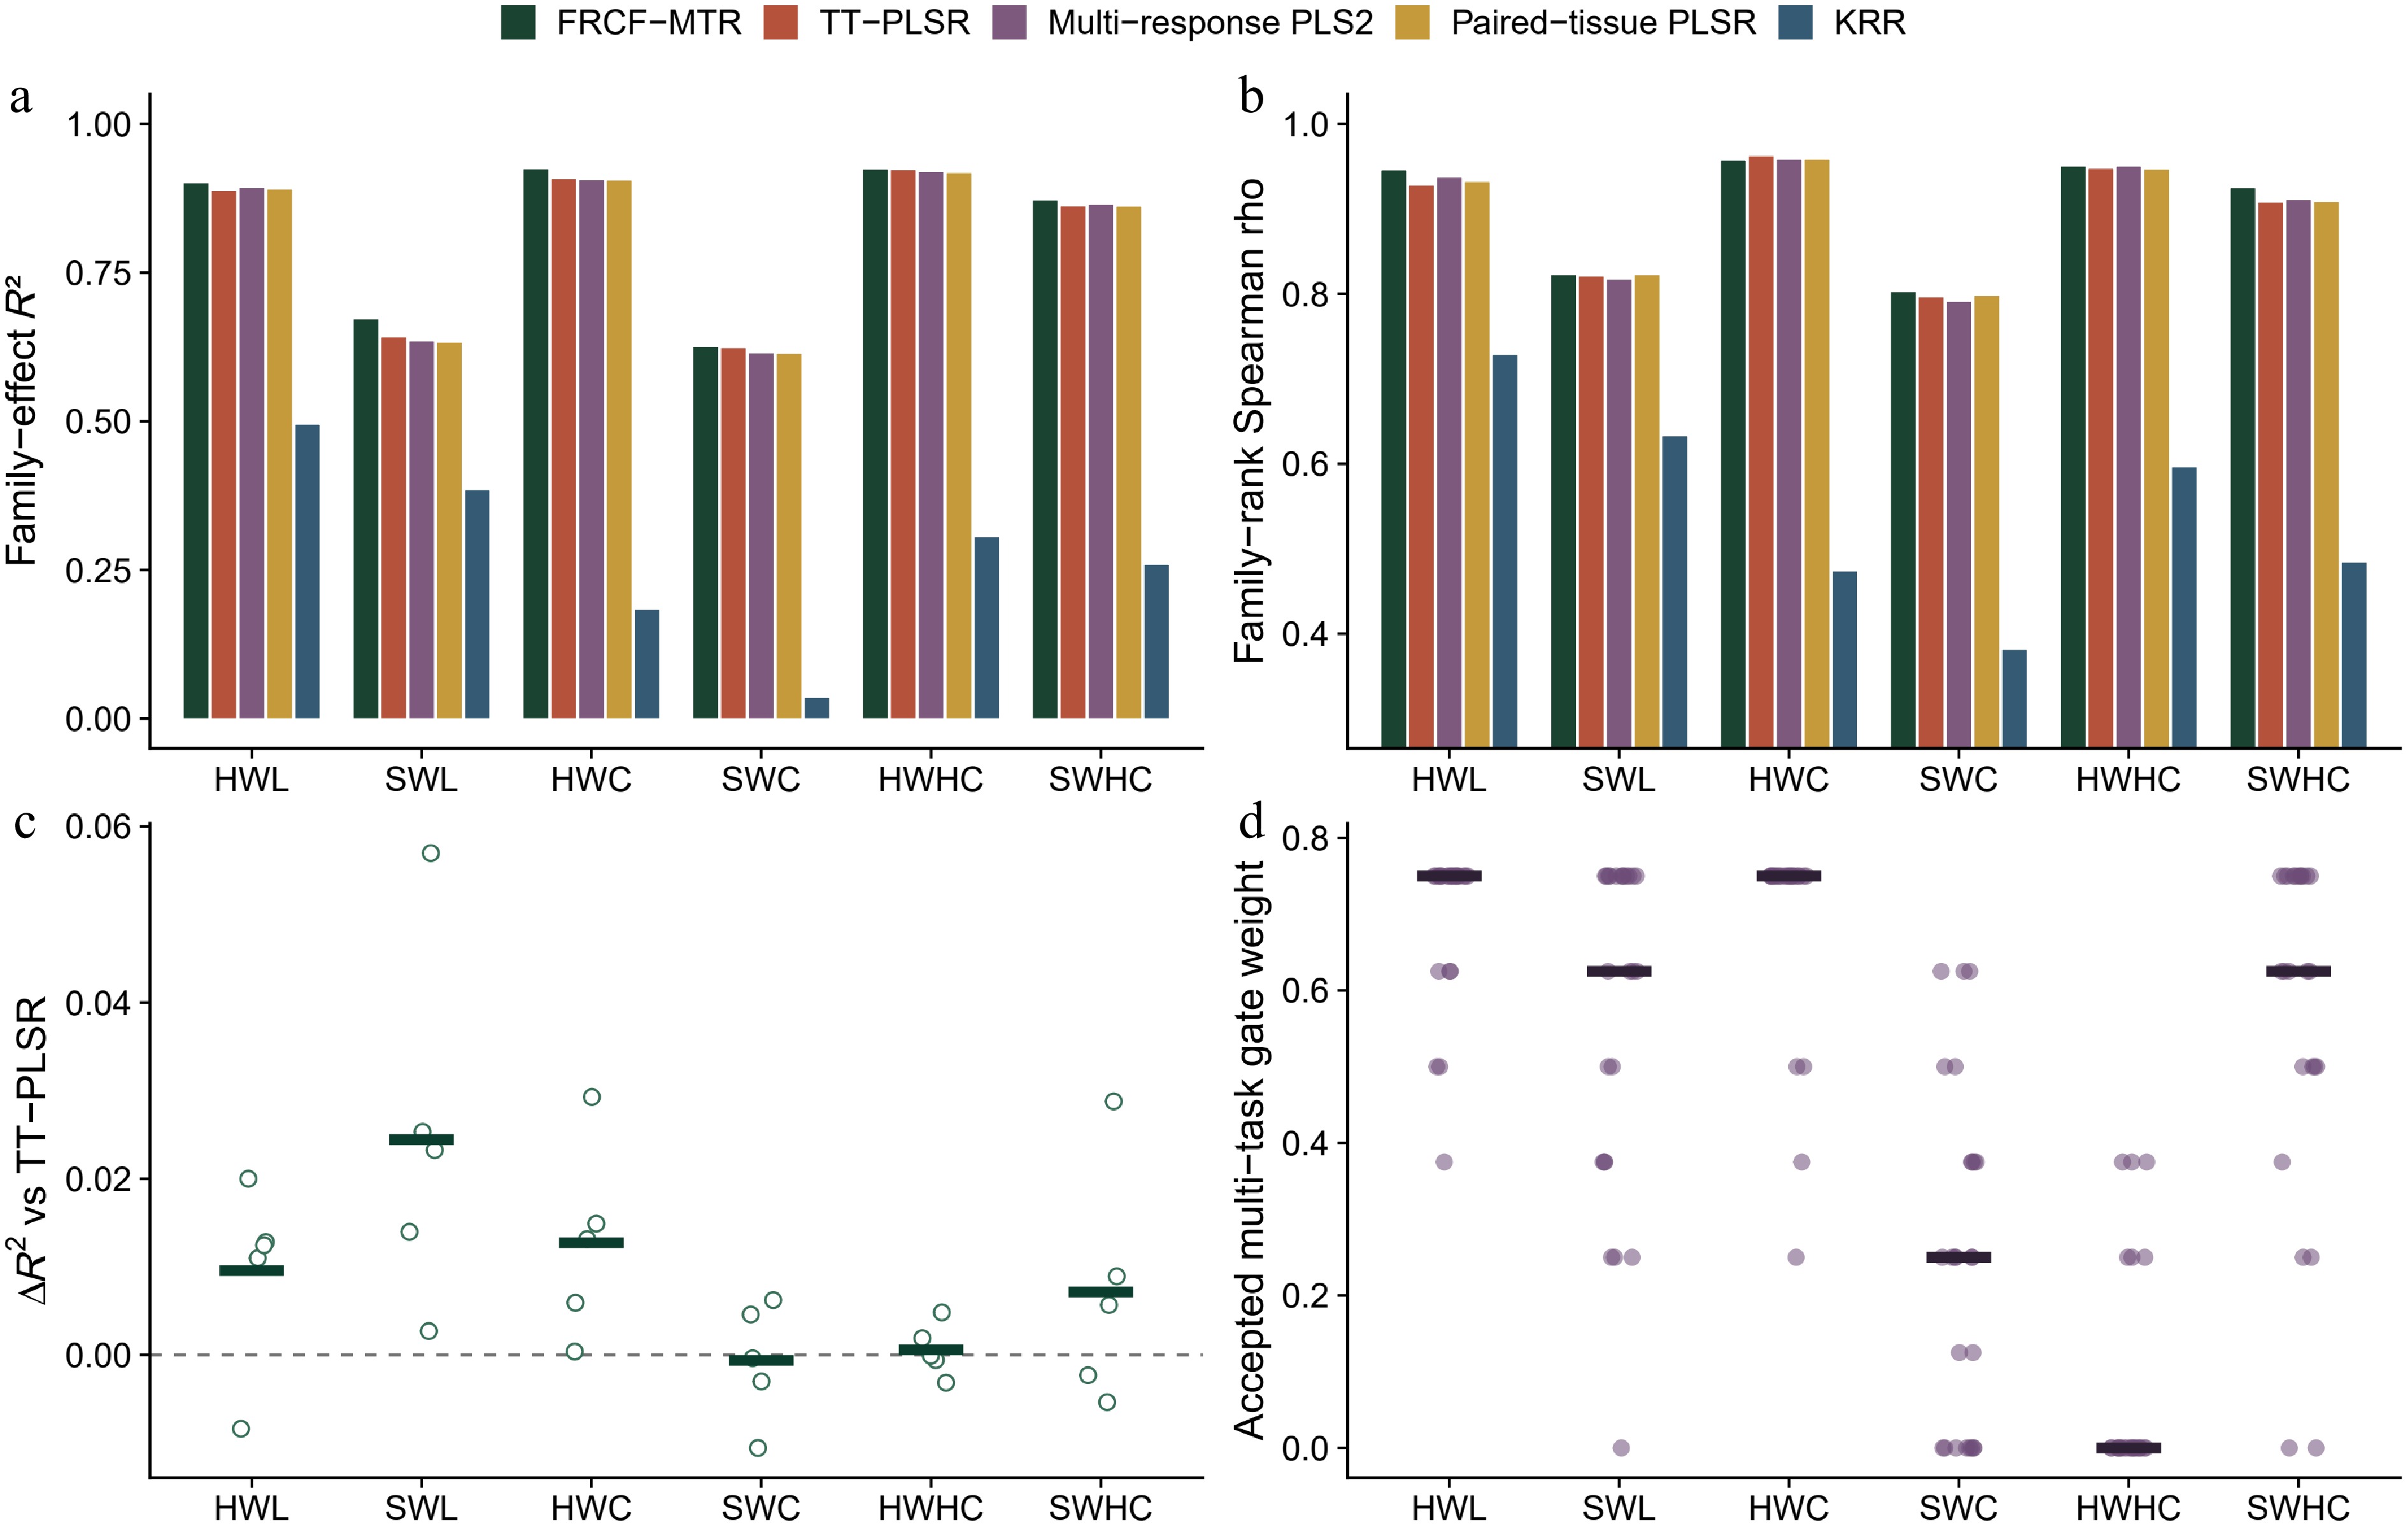
Figure 3.
Family-wise prediction and trait-adaptive correction. (a) Family-effect R2 and (b) family-rank Spearman ρ after averaging five independent family-wise predictions per family. (c) Difference in R2 between FRCF-MTR and TT-PLSR in each outer repeat; horizontal segments indicate trait means. (d) Gate weights selected only from inner training-family splits; zero indicates reversion to TT-PLSR.
-
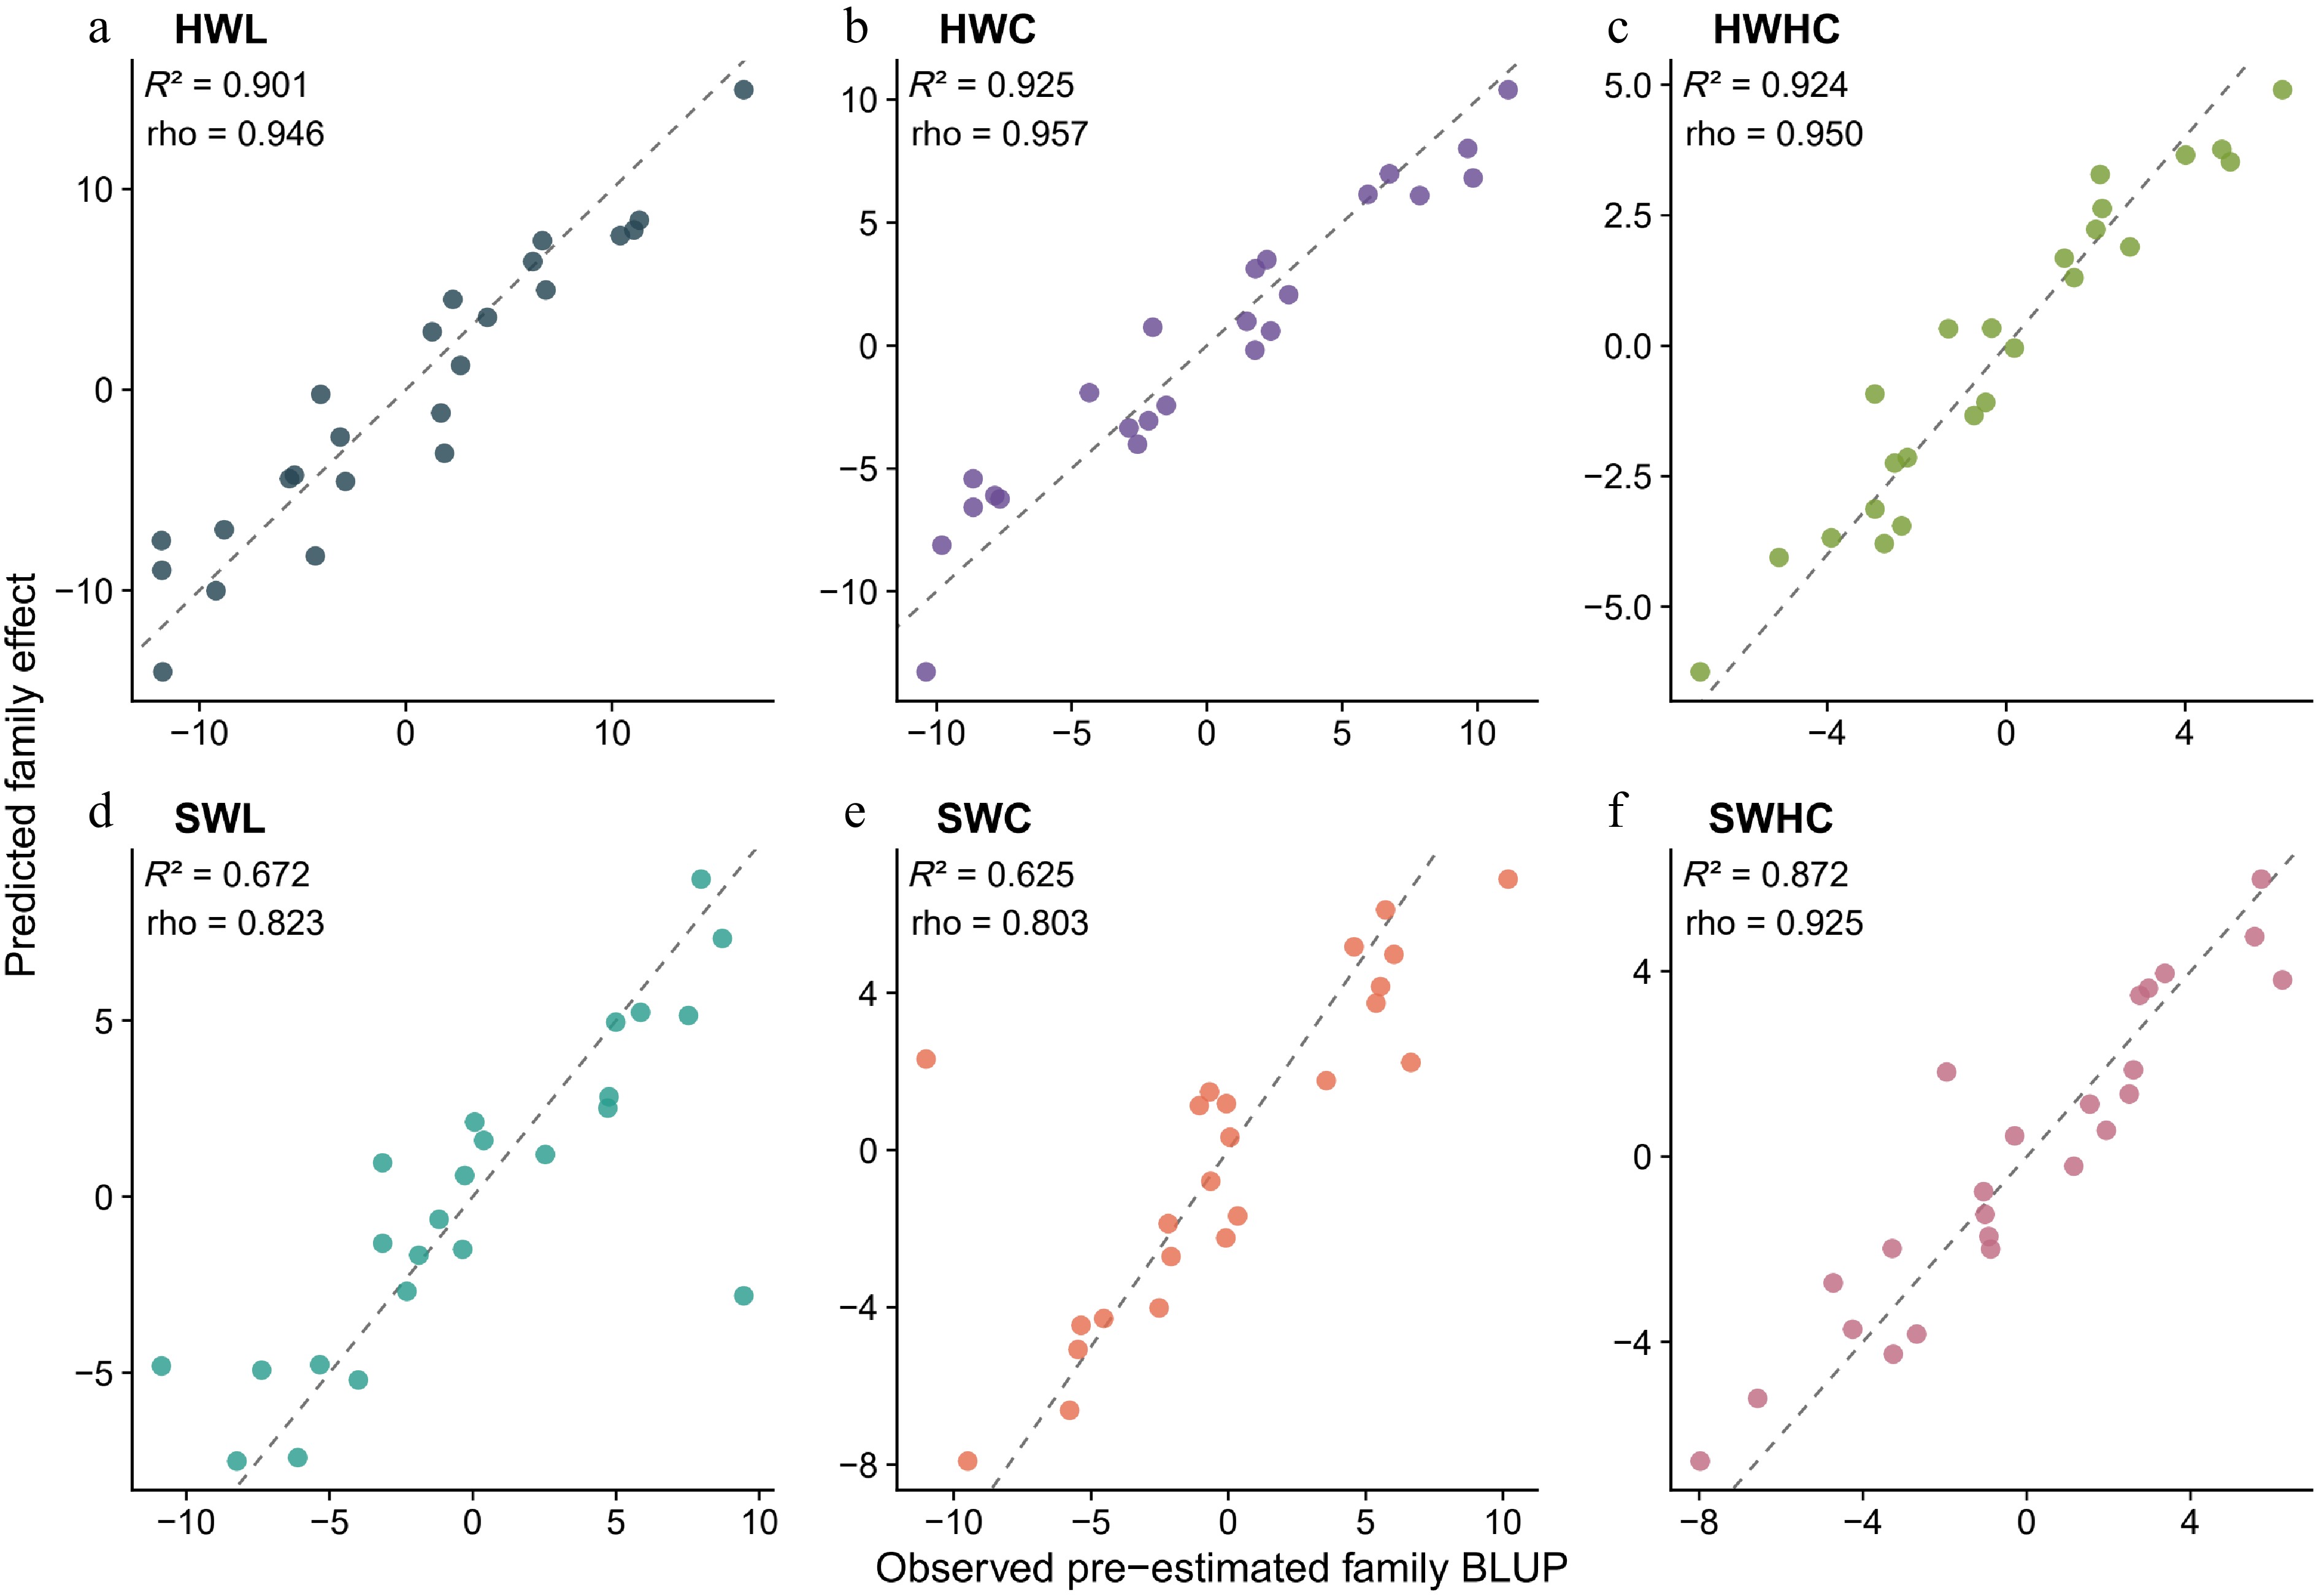
Figure 4.
Held-out-family prediction of block-adjusted family effects. Panels (a)–(f) show HWL, SWL, HWC, SWC, HWHC, and SWHC, respectively. Each point represents one family. Predictions are the means of five family-wise outer repeats; dashed lines indicate equality.
-
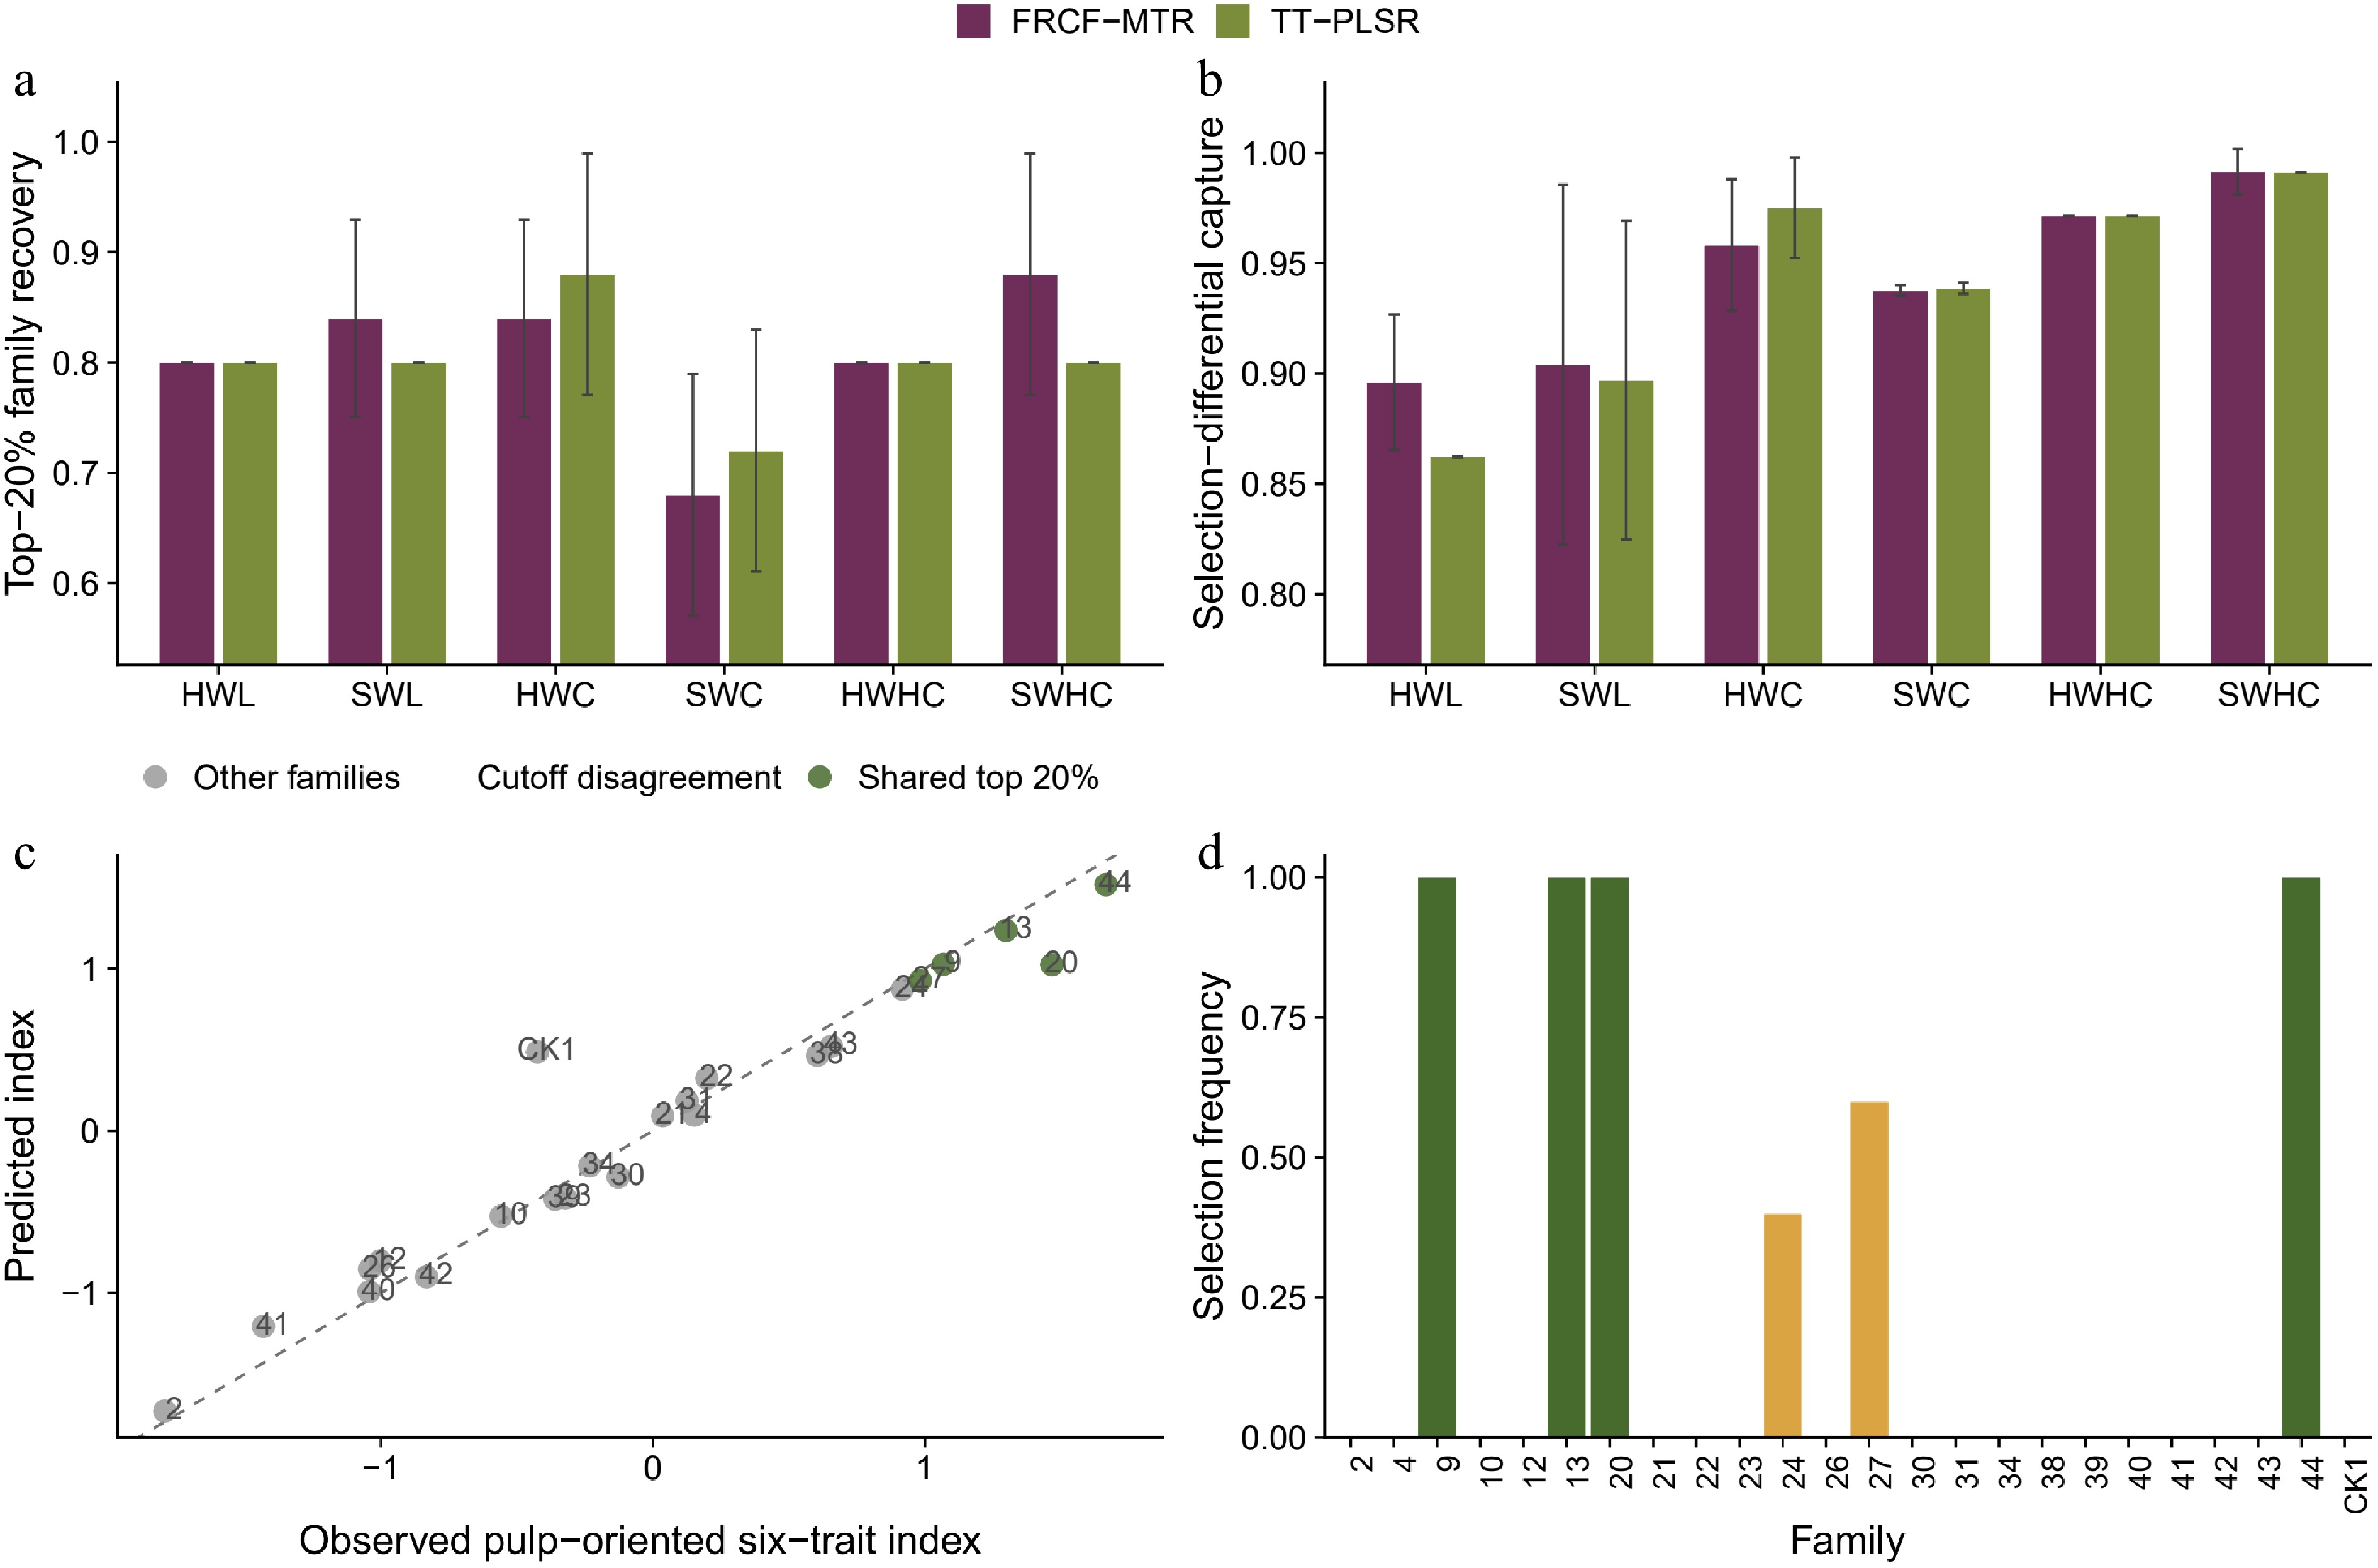
Figure 5.
Breeding-oriented selection utility. (a) Recovery of the observed top 20% of families and (b) fraction of attainable selection differential retained by predicted selection. Bars are means and standard deviations across five outer repeats. (c) Observed and predicted pulp-oriented six-trait index by family; shared top families are green and cutoff disagreements are coral. (d) Frequency with which each of the 24 families was selected by the predicted index.
-
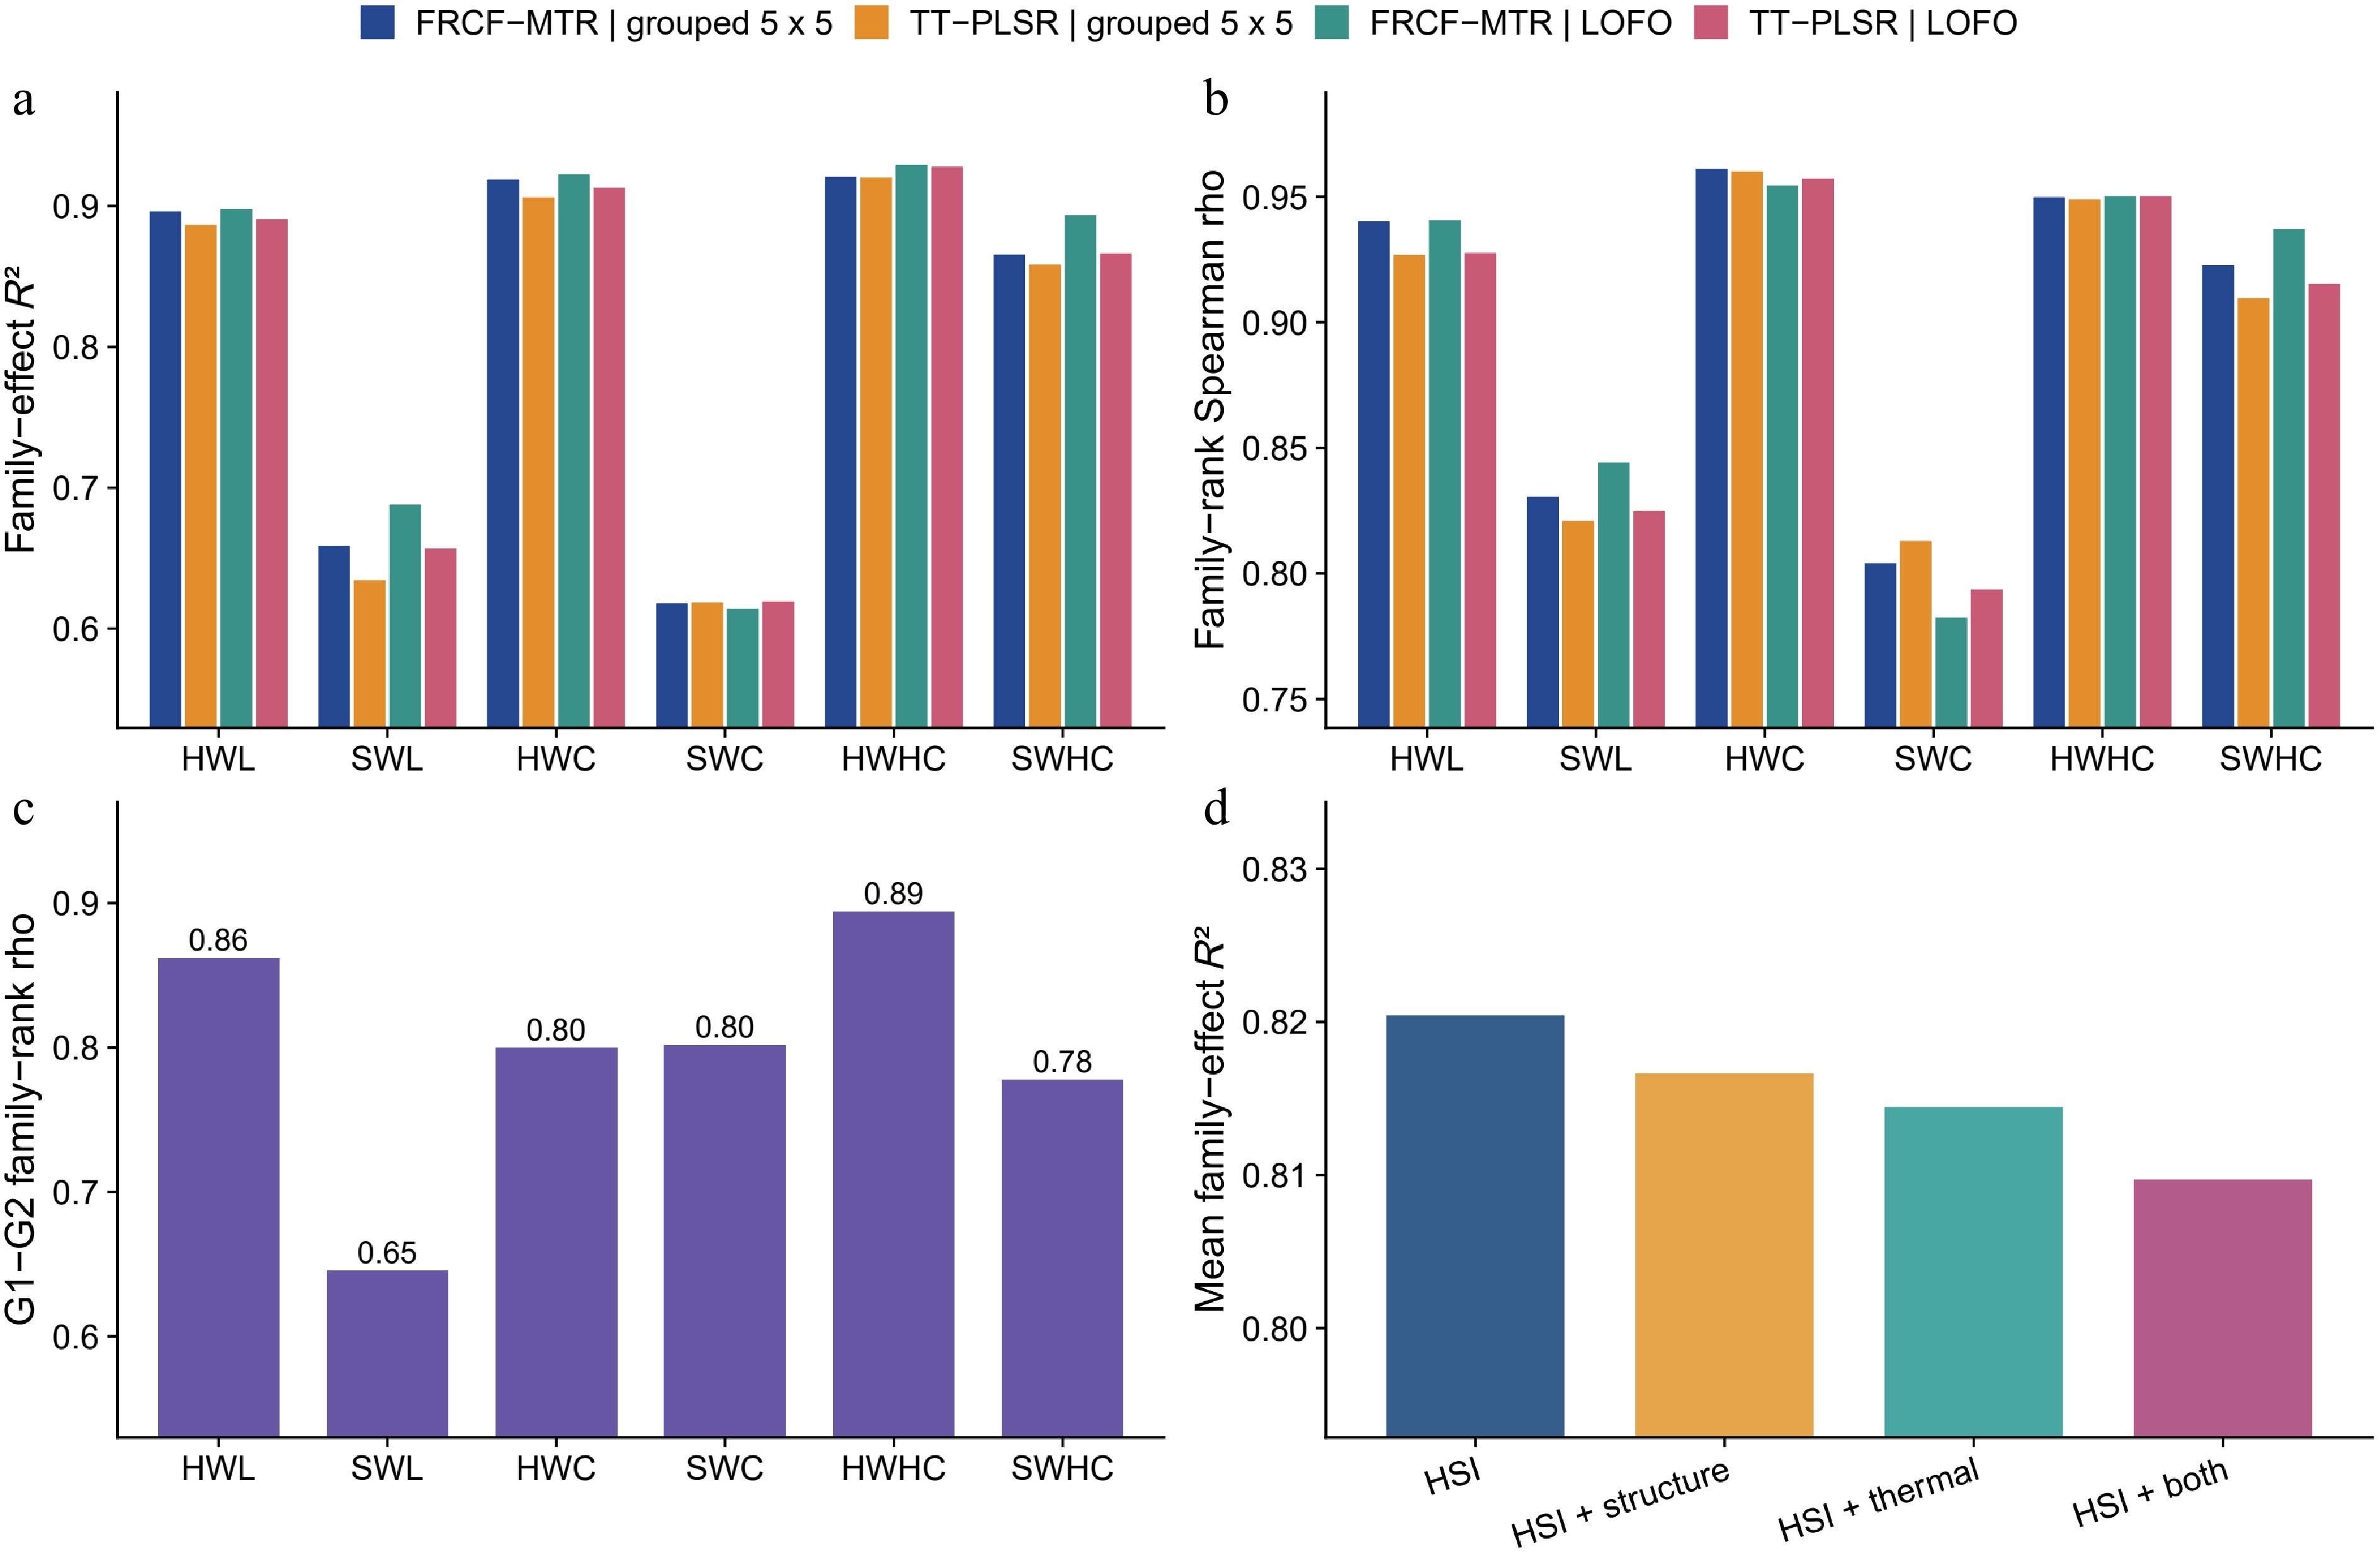
Figure 6.
Robustness to validation scheme, block, and auxiliary inputs. (a) Family-effect R2 and (b) rank correlation under repeated family-wise validation and leave-one-family-out validation. (c) Within-site cross-block family-rank concordance for 23 families. (d) Predefined auxiliary ablation; HSI only was retained because structural and thermal descriptors did not improve mean family-wise performance.
-
Validation Model Traits Mean RMSE RMSE range RMSE change vs TT-PLSR (%) Grouped 5 × 5 ensemble TT-PLSR 6 2.236 0.908–3.340 0.00 Grouped 5 × 5 ensemble Paired-tissue PLSR 6 2.256 0.939–3.382 0.91 Grouped 5 × 5 ensemble Multi-response PLS2 6 2.243 0.929–3.372 0.30 Grouped 5 × 5 ensemble KRR 6 4.479 2.735–5.837 100.32 Grouped 5 × 5 ensemble FRCF-MTR 6 2.145 0.903–3.195 −4.06 LOFO TT-PLSR 6 2.204 0.879–3.268 0.00 LOFO FRCF-MTR 6 2.124 0.871–3.237 −3.61 Grouped 5 × 5 denotes five repeated five-fold family-wise validation; the table reports metrics after averaging the five family-wise predictions for each family. LOFO denotes leave-one-family-out validation. RMSE is expressed in mg·g−¹. Negative change denotes lower error than TT-PLSR. Complete R2 and rank-correlation values are provided in the accompanying machine-readable table. Table 1.
Absolute error of family-effect predictions for families excluded from calibration.
Figures
(6)
Tables
(1)